consolidated financials - godrej · consolidated balance sheet as at march 31, ... cash flow...
TRANSCRIPT

167
CONSOLIDATEDFINANCIALS
168 | Annual Report 2013-14
Independent Auditors’ Report
TO THE BOARD OF DIRECTORS OF GODREJ CONSUMER PRODUCTS LIMITED
We have audited the accompanying Consolidated Financial Statements of GODREJ CONSUMER PRODUCTS LIMITED (the Company), and its subsidiaries (collectively referred to as the “Godrej Group”) which comprise the Consolidated Balance Sheet as at March 31, 2014, the Consolidated Statement of Profit and Loss and the Consolidated Cash Flow Statement for the year then ended and a summary of significant accounting policies and other explanatory information.
Management’s Responsibility for the Consolidated Financial Statements
Management is responsible for the preparation of these Consolidated Financial Statements that give a true and fair view of the consolidated financial position, consolidated financial performance and consolidated cash flows of the Group in accordance with the accounting principles generally accepted in India, this includes the design, implementation and maintenance of internal control relevant to the preparation and presentation of the consolidated financial statements that give a true and fair view and are free from material misstatement, whether due to fraud or error.
Auditor’s Responsibility
Our responsibility is to express an opinion on these Consolidated Financial Statements based on our audit. We conducted our audit in accordance with the Standards on Auditing issued by the Institute of Chartered Accountants of India. Those Standards require that we comply with ethical requirements and plan and perform the audit to obtain reasonable assurance about whether the Consolidated Financial Statements are free from material misstatement.
An audit involves performing procedures to obtain audit evidence about the amounts and disclosures in the Consolidated Financial Statements. The procedures selected depend on the auditor’s judgment, including the assessment of the risks of material misstatement of the Consolidated Financial Statements, whether due to fraud or error. In making those risk assessments, the auditor considers internal control relevant to the Company’s preparation and presentation of the Consolidated Financial Statements that give a true and fair view in order to design audit procedures that are appropriate in the circumstances, but not for the purpose of expressing an opinion on the effectiveness of the entity’s internal control. An audit also includes evaluating the appropriateness of accounting policies used and the reasonableness of the accounting estimates made by Management, as well as evaluating the overall presentation of the Consolidated Financial Statements.
We believe that the audit evidence we have obtained is sufficient and appropriate to provide a basis for our audit opinion.
Opinion
In our opinion and to the best of our information and according to the explanations given to us and based on the consideration of the reports of the other auditors on the financial statements of the subsidiaries as noted below, the Consolidated Financial Statements give a true and fair view in conformity with the accounting principles generally accepted in India:
a) in the case of the Consolidated Balance Sheet, of the state of affairs of the Group as at March 31, 2014;
b) in the case of the Consolidated Statement of Profit and Loss, of the profits of the Group for the year ended on that date; and
c) in the case of the Consolidated Cash Flow Statement, of the cash flows of the Group for the year ended on that date.
Emphasis of Matter
We draw attention to the following Notes to the Consolidated Financial Statements for the year ended March 31, 2014:
a) Note 13(b) to the Consolidated Financial Statements regarding the Scheme of Amalgamation of the erstwhile Godrej Household Products Limited with the Company approved by The Hon’ble High Court of Judicature at Bombay whereby an amount of ̀ 52.75 crore for the year ended on March 31, 2014, equivalent to the amortisation
Godrej Consumer Products Limited 169
Independent Auditors’ Report
of the Goodknight and HIT Brands is directly debited to the General Reserve instead of debiting the same to the Statement of Profit and Loss. Had this amount been charged to the Statement of Profit and Loss, the profit for the year ended on March 31, 2014, would have been lower by ` 52.75 crore and the General Reserve would have been higher by ` 52.75 crore.
b) Note 41(b) to the Consolidated Financial Statements regarding the Amalgamation of Godrej Indonesia Netherlands Holding B.V. (GINBV) with Godrej Consumer Holdings B.V. (GCHNBV) approved by the Dutch Court. In accordance with the Scheme of Amalgamation, for the purposes of preparation of the consolidated financial statements of GCHNBV an amount of ` 39.34 crore, being the foreign exchange loss on revaluation of certain identified assets and liabilities of the subsidiaries of GCHNBV as determined by the Board of Directors of GCHNBVand costs and expenses of amalgamation amounting to ` 0.19 crore have been adjusted directly in the Reserves in the consolidated financial statements of GCHNBV. Had the Scheme not prescribed the above accounting treatment, the above mentioned exchange loss amounting to ` 39.34 crore and costs and expenses of amalgamation amounting to ` 0.19 crore would have been charged to the Statement of Profit and Loss, the consolidated profit for the year ended March 31, 2014, would have been lower by ` 39.53 crore and the General Reserve would have been higher by ` 39.53 crore as at March 31, 2014.
The cumulative impact of the above is that the profit before tax would have been lower by ` 92.28 crore year ended March 31, 2014 and the General Reserve would have been higher by ` 92.28 crore as at March 31, 2014.
Our opinion is not qualified in respect of these matters.
Other Matter
We did not audit the financial statements of certain subsidiaries included in these Consolidated Financial Statements whose financial statements reflect the Group’s share of total assets of ` 5,342.17 crore as at March 31, 2014, the Group’s share of total revenues of ` 3,664.62 crore and net cash flows amounting to ` 165.86 crore for the year then ended. These financial statements have been audited by other auditors whose reports have been furnished to us by the Management and our opinion, insofar as it relates to the amounts included in respect of these subsidiaries is based solely on the report of the other auditors.
Our opinion is not qualified in respect of this matter.
For and on behalf ofKALYANIWALLA & MISTRYCHARTERED ACCOUNTANTSFirm Regn. No.: 104607W ROSHNI MARFATIAPARTNERM. No.: 106548
Mumbai: April 28, 2014.
170 | Annual Report 2013-14
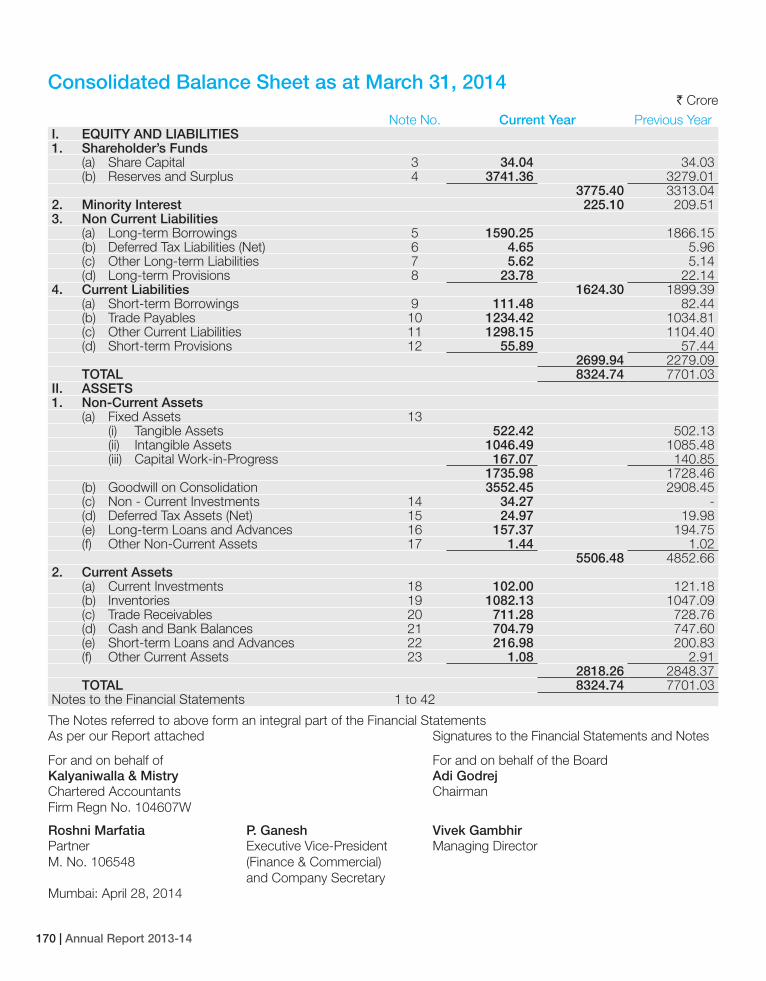
Consolidated Balance Sheet as at March 31, 2014` Crore
The Notes referred to above form an integral part of the Financial StatementsAs per our Report attached Signatures to the Financial Statements and Notes
For and on behalf of For and on behalf of the Board Kalyaniwalla & Mistry Adi GodrejChartered AccountantsFirm Regn No. 104607W
Chairman
Roshni Marfatia P. Ganesh Vivek GambhirPartnerM. No. 106548
Executive Vice-President (Finance & Commercial) and Company Secretary
Managing Director
Mumbai: April 28, 2014
Note No. Current Year Previous YearI. EQUITY AND LIABILITIES1. Shareholder’s Funds
(a) Share Capital 3 34.04 34.03(b) Reserves and Surplus 4 3741.36 3279.01
3775.40 3313.042. Minority Interest 225.10 209.513. Non Current Liabilities
(a) Long-term Borrowings 5 1590.25 1866.15(b) Deferred Tax Liabilities (Net) 6 4.65 5.96(c) Other Long-term Liabilities 7 5.62 5.14(d) Long-term Provisions 8 23.78 22.14
4. Current Liabilities 1624.30 1899.39(a) Short-term Borrowings 9 111.48 82.44(b) Trade Payables 10 1234.42 1034.81(c) Other Current Liabilities 11 1298.15 1104.40(d) Short-term Provisions 12 55.89 57.44
2699.94 2279.09TOTAL 8324.74 7701.03
II. ASSETS1. Non-Current Assets
(a) Fixed Assets 13 (i) Tangible Assets 522.42 502.13 (ii) Intangible Assets 1046.49 1085.48 (iii) Capital Work-in-Progress 167.07 140.85
1735.98 1728.46(b) Goodwill on Consolidation 3552.45 2908.45(c) Non - Current Investments 14 34.27 -(d) Deferred Tax Assets (Net) 15 24.97 19.98(e) Long-term Loans and Advances 16 157.37 194.75(f) Other Non-Current Assets 17 1.44 1.02
5506.48 4852.662. Current Assets
(a) Current Investments 18 102.00 121.18(b) Inventories 19 1082.13 1047.09(c) Trade Receivables 20 711.28 728.76(d) Cash and Bank Balances 21 704.79 747.60(e) Short-term Loans and Advances 22 216.98 200.83(f) Other Current Assets 23 1.08 2.91
2818.26 2848.37TOTAL 8324.74 7701.03
Notes to the Financial Statements 1 to 42
Godrej Consumer Products Limited 171
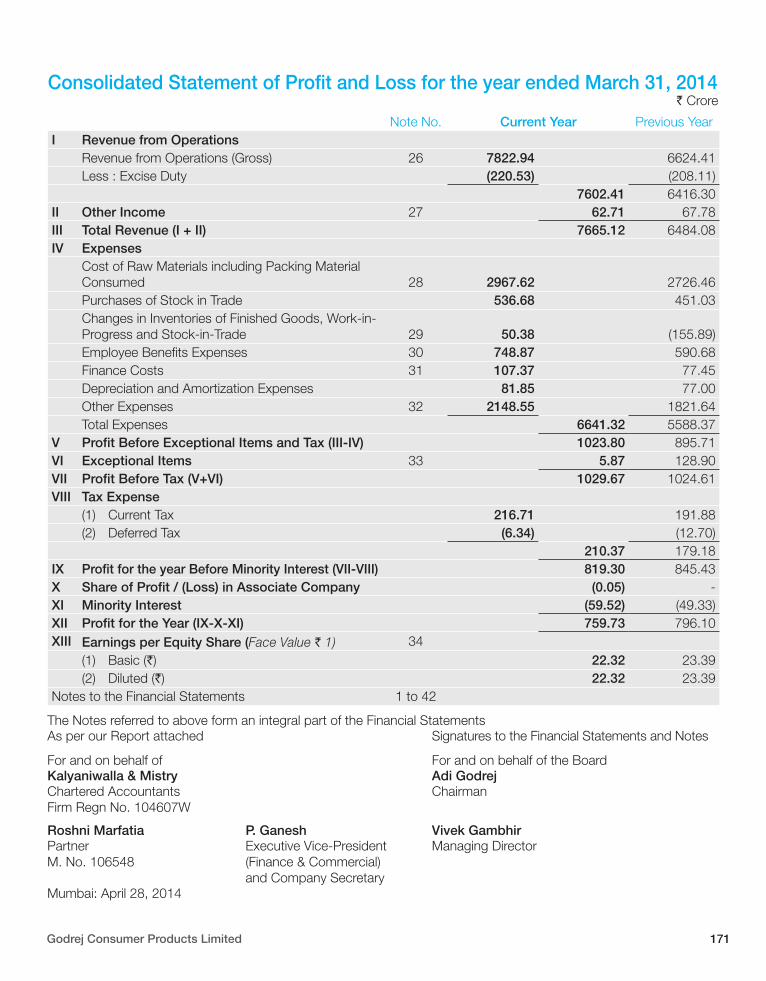
Consolidated Statement of Profit and Loss for the year ended March 31, 2014` Crore
The Notes referred to above form an integral part of the Financial StatementsAs per our Report attached Signatures to the Financial Statements and Notes
For and on behalf of For and on behalf of the Board Kalyaniwalla & Mistry Adi GodrejChartered AccountantsFirm Regn No. 104607W
Chairman
Roshni Marfatia P. Ganesh Vivek GambhirPartnerM. No. 106548
Executive Vice-President (Finance & Commercial) and Company Secretary
Managing Director
Mumbai: April 28, 2014
Note No. Current Year Previous YearI Revenue from Operations
Revenue from Operations (Gross) 26 7822.94 6624.41Less : Excise Duty (220.53) (208.11)
7602.41 6416.30II Other Income 27 62.71 67.78III Total Revenue (I + II) 7665.12 6484.08IV Expenses
Cost of Raw Materials including Packing Material Consumed 28 2967.62 2726.46Purchases of Stock in Trade 536.68 451.03Changes in Inventories of Finished Goods, Work-in-Progress and Stock-in-Trade 29 50.38 (155.89)Employee Benefits Expenses 30 748.87 590.68Finance Costs 31 107.37 77.45Depreciation and Amortization Expenses 81.85 77.00Other Expenses 32 2148.55 1821.64Total Expenses 6641.32 5588.37
V Profit Before Exceptional Items and Tax (III-IV) 1023.80 895.71VI Exceptional Items 33 5.87 128.90VII Profit Before Tax (V+VI) 1029.67 1024.61VIII Tax Expense
(1) Current Tax 216.71 191.88(2) Deferred Tax (6.34) (12.70)
210.37 179.18IX Profit for the year Before Minority Interest (VII-VIII) 819.30 845.43X Share of Profit / (Loss) in Associate Company (0.05) - XI Minority Interest (59.52) (49.33)XII Profit for the Year (IX-X-XI) 759.73 796.10XIII Earnings per Equity Share (Face Value ` 1) 34
(1) Basic (`) 22.32 23.39(2) Diluted (`) 22.32 23.39
Notes to the Financial Statements 1 to 42
172 | Annual Report 2013-14
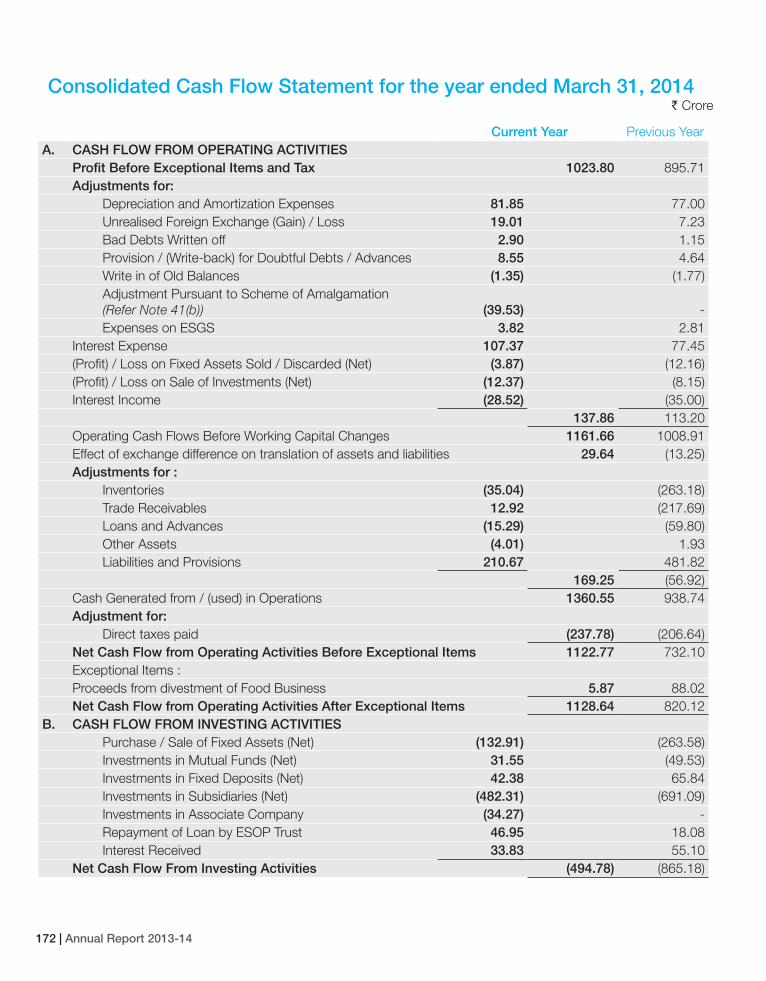
Consolidated Cash Flow Statement for the year ended March 31, 2014` Crore
Current Year Previous Year A. CASH FLOW FROM OPERATING ACTIVITIES
Profit Before Exceptional Items and Tax 1023.80 895.71Adjustments for:
Depreciation and Amortization Expenses 81.85 77.00Unrealised Foreign Exchange (Gain) / Loss 19.01 7.23Bad Debts Written off 2.90 1.15Provision / (Write-back) for Doubtful Debts / Advances 8.55 4.64Write in of Old Balances (1.35) (1.77)Adjustment Pursuant to Scheme of Amalgamation(Refer Note 41(b)) (39.53) -Expenses on ESGS 3.82 2.81
Interest Expense 107.37 77.45(Profit) / Loss on Fixed Assets Sold / Discarded (Net) (3.87) (12.16)(Profit) / Loss on Sale of Investments (Net) (12.37) (8.15)Interest Income (28.52) (35.00)
137.86 113.20Operating Cash Flows Before Working Capital Changes 1161.66 1008.91Effect of exchange difference on translation of assets and liabilities 29.64 (13.25)Adjustments for :
Inventories (35.04) (263.18)Trade Receivables 12.92 (217.69)Loans and Advances (15.29) (59.80)Other Assets (4.01) 1.93Liabilities and Provisions 210.67 481.82
169.25 (56.92)Cash Generated from / (used) in Operations 1360.55 938.74Adjustment for:
Direct taxes paid (237.78) (206.64)Net Cash Flow from Operating Activities Before Exceptional Items 1122.77 732.10Exceptional Items :Proceeds from divestment of Food Business 5.87 88.02Net Cash Flow from Operating Activities After Exceptional Items 1128.64 820.12
B. CASH FLOW FROM INVESTING ACTIVITIESPurchase / Sale of Fixed Assets (Net) (132.91) (263.58)Investments in Mutual Funds (Net) 31.55 (49.53)Investments in Fixed Deposits (Net) 42.38 65.84Investments in Subsidiaries (Net) (482.31) (691.09)Investments in Associate Company (34.27) - Repayment of Loan by ESOP Trust 46.95 18.08Interest Received 33.83 55.10
Net Cash Flow From Investing Activities (494.78) (865.18)
Godrej Consumer Products Limited 173
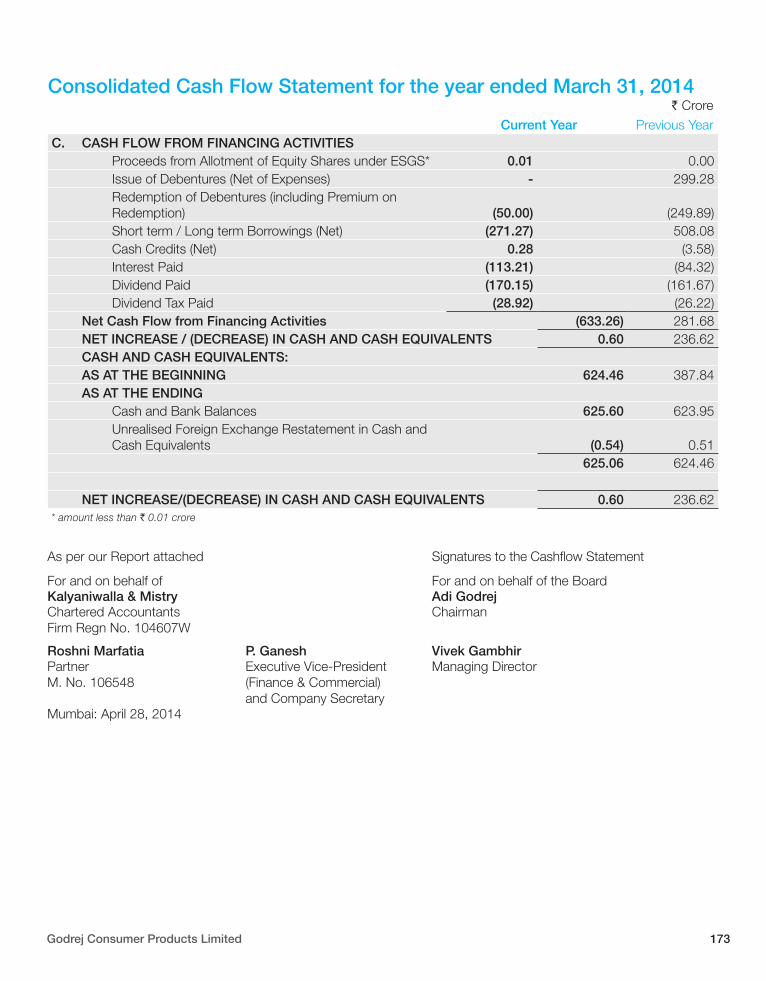
Consolidated Cash Flow Statement for the year ended March 31, 2014` Crore
As per our Report attached Signatures to the Cashflow Statement
For and on behalf of For and on behalf of the Board Kalyaniwalla & Mistry Adi GodrejChartered AccountantsFirm Regn No. 104607W
Chairman
Roshni Marfatia P. Ganesh Vivek GambhirPartnerM. No. 106548
Executive Vice-President (Finance & Commercial) and Company Secretary
Managing Director
Mumbai: April 28, 2014
Current Year Previous Year C. CASH FLOW FROM FINANCING ACTIVITIES
Proceeds from Allotment of Equity Shares under ESGS* 0.01 0.00Issue of Debentures (Net of Expenses) - 299.28Redemption of Debentures (including Premium on Redemption) (50.00) (249.89)Short term / Long term Borrowings (Net) (271.27) 508.08Cash Credits (Net) 0.28 (3.58)Interest Paid (113.21) (84.32)Dividend Paid (170.15) (161.67)Dividend Tax Paid (28.92) (26.22)
Net Cash Flow from Financing Activities (633.26) 281.68 NET INCREASE / (DECREASE) IN CASH AND CASH EQUIVALENTS 0.60 236.62
CASH AND CASH EQUIVALENTS:AS AT THE BEGINNING 624.46 387.84AS AT THE ENDING
Cash and Bank Balances 625.60 623.95Unrealised Foreign Exchange Restatement in Cash and Cash Equivalents (0.54) 0.51
625.06 624.46
NET INCREASE/(DECREASE) IN CASH AND CASH EQUIVALENTS 0.60 236.62* amount less than ` 0.01 crore
174 | Annual Report 2013-14
NOTE1 : SIGNIFICANT ACCOUNTING POLICIES
a. Accounting Convention
The financial statements are prepared under the historical cost convention, on accrual basis, in accordance with the generally accepted accounting principles in India, the applicable Accounting Standards notified under Section 211(3c) of the Companies Act, 1956 and specified in the Companies (Accounting Standard) Rules read with the General Circular No. 15/2013 dated September 12, 2013 issued by the Ministry of Corporate Affairs in respect of Section 133 of the Companies Act, 2013, pronouncements of the Institute of Chartered Accountants of India, and the provisions of the Companies Act, 1956 and the applicable sections of the Companies Act, 2013.
All assets and liabilities have been classified as current or non-current as per the Group’s normal operating cycle and other criterias set out in the revised schedule VI to the Companies Act, 1956. Based on the nature of the products and the time taken between acquisition of assets for processing and their realization in cash and cash equivalent, the Group has ascertained its operating cycle as twelve months for the purpose of the classification of assets and liabilities into current and non-current.
b. Use of Estimates
The preparation of financial statements in conformity with generally accepted accounting principles requires the Management to make estimates and assumptions that affect the reported balances of assets and liabilities as of the date of the financial statements and reported amounts of income and expenses during the period. Management believes that the estimates used in the preparation of financial statements are prudent and reasonable. Actual results could differ from the estimates.
c. Fixed Assets
Fixed Assets are stated at cost of acquisition or construction, less accumulated depreciation and impairment, if any. Cost includes all expenses related to acquisition and installation of the concerned assets and excludes any duties / taxes recoverable and capital subsidy / grant received. Subsequent expenditure incurred on existing fixed assets is expensed out except where such expenditure increases the future economic benefits from the existing assets.
Direct financing cost incurred during the construction period on major projects is also capitalized.
Fixed assets acquired under finance lease are capitalized at the lower of their fair value and the present value of the minimum lease payments.
Items of fixed assets that have been retired from active use and are held for disposal are shown separately in the financial statement as Assets held for Sale under ‘Other Current Assets’. Any expected loss on account of difference between book value and realisable value, is recognised immediately in the Statement of Profit and Loss.
d. Asset Impairment
Management periodically assesses, using external and internal sources, whether there is an indication that an asset may be impaired. An impairment occurs where the carrying value of the asset exceeds its recoverable amount. Recoverable amount is higher of an asset’s net selling price and its value in use. Value in use is the present value of estimated future cash flows expected to arise from the continuing use of an asset and from its disposal at the end of its useful life. An impairment loss, if any, is recognised in the period in which the impairment takes place.
e. Operating Leases
Leases of assets under which all the risks and rewards of ownership are effectively retained by the lessor are classified as operating leases. Lease payments under operating leases are recognised as an expense on a straight-line basis over the lease term.
Notes to the Consolidated Financial Statements for the year ended March 31, 2014
Godrej Consumer Products Limited 175
f. Investments
Investments are classified into current and non-current investments. Investments intended to be held for a period less than twelve months or those maturing within twelve months from the balance sheet date are classified as ‘Current Investments’.
Investments other than Current Investments are classified as ‘Non-current Investments’.
Current Investments are stated at lower of cost and net realisable value. Non-Current investments are carried at cost. Cost of acquisition includes all costs directly incurred on the acquisition of the investment. Provision for diminution, if any, in the value of Non-current investments is made to recognise a decline, other than of a temporary nature.
g. Inventories
Inventories are valued at lower of cost and estimated net realizable value. Cost is computed on the weighted average basis and is net of CENVAT. Finished goods and work-in-progress include cost of conversion and other costs incurred in bringing the inventories to their present location and condition. Finished goods valuation also includes excise duty. Provision is made for cost of obsolescence and other anticipated losses, whenever considered necessary.
h. Provisions and Contingent Liabilities
Provisions are recognised when the Group has a present obligation as a result of a past event; it is probable that an outflow of resources embodying economic benefits will be required to settle the obligation and when a reliable estimate of the amount of the obligation can be made.
No Provision is recognised for –
i) Any possible obligation that arises from past events and the existence of which will be confirmed only by the occurrence or non-occurrence of one or more uncertain future events not wholly within the control of the Group; or
ii) Any present obligation that arises from past events but is not recognised because-
a) It is not probable that an outflow of resources embodying economic benefits will be required to settle the obligation; or
b) A reliable estimate of the amount of obligation cannot be made.
Such obligations are recorded as Contingent Liabilities. These are assessed periodically and only that part of the obligation for which an outflow of resources embodying economic benefits is probable, is provided for, except in the extremely rare circumstances where no reliable estimate can be made.
Contingent Assets are not recognised in the financial statements since this may result in the recognition of income that may never be realized.
i. Revenue Recognition
i) Sales are recognised on supply of goods when significant risks and rewards of ownership in the goods are transferred to the buyer. Sales are recorded net of returns, trade discounts, rebates, sales taxes and excise duties.
ii) Income from processing operations is recognised on completion of production / dispatch of the goods, as may be provided in the terms of contract.
iii) Dividend income is recognised when the right to receive the same is established.
iv) Interest income is recognised on a time proportion basis.
Notes to the Consolidated Financial Statements for the year ended March 31, 2014
176 | Annual Report 2013-14
j. Expenditure
i) Expenses are accounted for on accrual basis, net of recoveries, if any and provision is made for all known losses and liabilities.
ii) Revenue expenditure on research and development is charged to the Statement of Profit and Loss of the year in which it is incurred. Capital expenditure incurred during the year on research and development is shown as addition to fixed assets.
k. Borrowing Costs
Borrowing costs that are directly attributable to the acquisition of an asset that necessarily takes a substantial period of time to get ready for its intended use are capitalized as part of the cost of that asset till the date it is put to use. Other borrowing costs are recognised as an expense in the period in which they are incurred.
l. Foreign Currency Transactions
i) Transactions in foreign currency are recorded at the exchange rates prevailing on the date of the transaction. Monetary assets and liabilities denominated in foreign currency remaining unsettled at the period end are translated at the period end exchange rates. The difference in translation of monetary assets and liabilities and realised gains and losses on foreign currency transactions are recognised in the Statement of Profit and Loss.
ii) Forward exchange contracts, remaining unsettled at the period end, backed by underlying assets or liabilities are also translated at period end exchange rates. Premium or discount on forward foreign exchange contracts is amortised over the period of the contract and recognised as income or expense for the period. Realised gain or losses on cancellation of forward exchange contracts are recognised in the Statement of Profit and Loss of the period in which they are cancelled.
iii) Non-monetary foreign currency items like investments in foreign subsidiaries are carried at cost and expressed in Indian currency at the rate of exchange prevailing at the time of making the original investment.
iv) For the purpose of consolidation of non-integral foreign operations, all assets and liabilities, both monetary and non-monetary are translated at the closing rate. Items of income and expenditure are translated at yearly average exchange rates. All resulting exchange differences are accumulated in a Foreign Currency Translation Reserve until disposal of the net investment.
v) Exchange differences arising on reporting of long term foreign currency monetary items at rates different from those at which they were initially recorded during the year insofar as they relate to the acquisition of a depreciable capital asset, are added to or deducted from the cost of the asset and are depreciated over the balance life of the asset, and in other cases, are accumulated in a “Foreign Currency Monetary Item Translation Difference Account” and amortised over the balance period of such long term asset or liability, by recognising as income or expense in each such periods.
m. Hedging
The Group uses forward exchange contracts to hedge its foreign exchange exposures. Gains or losses on settled contracts are recognised in the Statement of Profit and Loss.
n. Employee Benefits
i) Short-term Employee benefits
All employee benefits payable wholly within twelve months of rendering the service are classified as short term employee benefits. Benefits such as salaries, performance incentives, etc., are recognised as an expense at the undiscounted amount in the Statement of Profit and Loss of the year in which the employee renders the related service.
Notes to the Consolidated Financial Statements for the year ended March 31, 2014
Godrej Consumer Products Limited 177
ii) Post Employment Benefits
a) Defined Contribution Plans
Payments made to a defined contribution plan such as Provident Fund maintained with Regional Provident Fund Office and Superannuation Fund are charged as an expense in the Statement of Profit and Loss as they fall due.
b) Defined Benefit Plans
Gratuity Fund
The Company’s liability towards gratuity to past employees is determined using the projected unit credit method which considers each period of service as giving rise to an additional unit of benefit entitlement and measures each unit separately to build up the final obligation. Past services are recognised on a straight line basis over the average period until the amended benefits become vested. Actuarial gain and losses are recognised immediately in the Statement of Profit and Loss as income or expense. Obligation is measured at the present value of estimated future cash flows using a discounted rate that is determined by reference to market yields at the Balance Sheet date on Government Securities where the currency and terms of the Government Securities are consistent with the currency and estimate terms of the defined benefit obligations.
Provident Fund
Provident Fund Contributions other than those made to the Regional Provident Fund Office of the Government which are made to the Trust administered by the Company are considered as Defined Benefit Plans. The interest rate payable to the members of the Trust shall not be lower than the statutory rate of interest declared by the Central Government under the Employees Provident Funds and Miscellaneous Provisions Act, 1952 and shortfall, if any, shall be made good by the Company.
c) Other Long Term Employee Benefits
Other Long Term Employee Benefits viz., leave encashment and long service bonus are recognised as an expense in the Statement of Profit and Loss as and when it accrues. The Company determines the liability using the Projected Unit Credit Method, with the actuarial valuation carried out as at the Balance Sheet date. Actuarial gains and losses in respect of such benefits are charged to the Statement of Profit and Loss.
o. Incentive Plans
The Company has a scheme of Performance Linked Variable Remuneration (PLVR) which rewards its employees based on Economic Value Addition (EVA). The PLVR amount is related to actual improvements made in EVA over the previous year when compared with expected improvements.
Up to March 31, 2009, the EVA awards would flow through a notional bank whereby only the prescribed portion of the bank is distributed each year and the balance is carried forward. The amount distributed out of the notional bank is charged to the Statement of Profit and Loss. The notional bank was held at risk and charged to EVA of future years and was payable at that time, if future performance so warranted. The notional bank balance accumulated till March 31, 2009, as at the beginning of the current year is being paid @ 33% every year on the reducing balance.The entire EVA award for the year has been charged to the Statement of Profit and Loss.
Notes to the Consolidated Financial Statements for the year ended March 31, 2014
178 | Annual Report 2013-14
p. Depreciation and Amortisation
Tangible Assets
i) Leasehold land is amortised equally over the lease period.
ii) Leasehold Improvements are depreciated over the shorter of the unexpired period of the lease and the estimated useful life of the assets.
iii) Depreciation is provided, pro rata to the period of use, under the Straight Line Method at the rates specified in Schedule XIV to the Companies Act, 1956 or higher, e.g.:
a) In case of computer hardware which is depreciated over 4 years.
b) Tools, dies and moulds acquired are depreciated over a period of 9 years and 3½ years respectively.
c) Vehicles are depreciated over a period ranging from 5 years to 10½ years depending on the use of vehicles.
d) Depreciation in the subsidiary companies is provided under the Straight Line Method over the expected useful lives of the respective assets ranging between 3 years to 10 years.
iv) Assets costing less than ` 5,000 are depreciated at 100% in the year of acquisition.
Intangible Assets
Intangible assets are amortised on straight line basis as given below:
i) Software license is amortised over a period of 6 years.
ii) SAP licenses acquired pursuant to the Scheme of the Amalgamation of the erstwhile Godrej Household Products Limited (GHPL) with the Company are amortised over a period of 4 years and Trademarks acquired are amortised equally over the best estimate of their useful life not exceeding a period of 10 years, except in the case of Goodknight, HIT, Kinky and Soft & Gentle brands where the brands are amortised equally over a period of 20 years.
iii) In accordance with the Court order approving the Scheme of Amalgamation of the erstwhile GHPL with the Company, an amount equivalent to the amortisation of the Goodknight and HIT brands at the end of each financial year is directly debited to the balance in the General Reserve Account.
iv) The cost of SAP licenses incurred for subsidiaries are being recovered from respective subsidiaries.
v) Goodwill is amortised over a period of 5 years.
vi) Technical Knowhow is depreciated over a period of 10 years.
It is estimated that the impact on depreciation and amortization of the difference in expected useful lives between the holding company and subsidiaries is not material.
q. Taxes on Income
Current tax is the amount of tax payable on the taxable income for the year determined in accordance with the provisions of the Income-tax Act, 1961.
Deferred tax subject to consideration of prudence, is recognised on timing differences; being the difference between taxable income and accounting income that originate in one period and are capable of reversal in one or more subsequent periods. Deferred tax asset / liabilities in respect of on timing differences which originate and reverse during the tax holiday period are not recognised. Deferred tax asset / liabilities in respect of timing differences that originate during the tax holiday period but reverse after the tax holiday period are recognised.
Notes to the Consolidated Financial Statements for the year ended March 31, 2014
Godrej Consumer Products Limited 179
Deferred tax assets on unabsorbed tax losses and tax depreciation are recognised only to the extent that there is virtual certainty supported by convincing evidence of their realisation and on other items when there is reasonable certainty of realisation. The tax effect is calculated on the accumulated timing differences at the year end based on the tax rates and laws enacted or substantially enacted on the balance sheet date.
r. Cash and Cash Equivalents
In the Cash Flow Statement, Cash and Cash Equivalents includes cash in hand, bank balances and term deposits with bank having maturity term of less than three months.
s. Earnings Per Share
Basic Earnings per share is calculated by dividing the net profit for the period attributable tothe equity shareholders by the weighted average number of equity shares outstanding during the period. For the purpose of calculating diluted earnings per share, the net profit for the period attributable to the equity shareholders and the weighted average number of equity shares outstanding during the period is adjusted for the effects of all dilutive potential equity shares.
t. Segment Reporting
The Group is considered to be a single segment group – engaged in the manufacture of Personal and Household Care products. The Group has identified business segment as its primary segment. Geographic segments of the Group are ‘Within India’ and ‘Outside India’. Segment revenues and assets have been identified to represent segments on the basis of their relationship to the respective segment.
NOTE 2 : PRINCIPLES OF CONSOLIDATION
a. The consolidated financial statements relate to Godrej Consumer Products Limited, the Holding Company and its subsidiaries. The consolidation of accounts of the Company with its subsidiaries and associates (collectively known as “Group”) has been prepared in accordance with Accounting Standard (AS) 21 - Consolidated Financial Statements. The financial statements of the parent and its subsidiaries are combined on a line by line basis and intra group balances, intra group transactions and unrealised profits or losses are fully eliminated.
b. The consolidated financial statements are prepared by adopting uniform accounting policies for like transactions and other events in similar circumstances and are presented to the extent possible, in the same manner as the parent company’s separate financial statements unless stated otherwise.
c. The Audited financial statements of the subsidiaries used in the consolidation are drawn up to the same reporting date as of the Holding Company i.e. up to March 31, 2014.
d. In the consolidated financial statements, ‘Goodwill’ represents the excess of the cost to the Company of its investment in the subsidiaries over its share of equity, at the respective dates on which the investments are made. Alternatively, where the share of equity as on the date of investment is in excess of cost of investment, it is recognised as ‘Capital Reserve’ in the consolidated financial statements.
e. Minority interest in net income of the consolidated subsidiaries is adjusted against the income of the group in order to arrive at the net income attributable to shareholder’s of the company. Minority Interest in the net assets of consolidated subsidiaries consists of the amount of equity attributable to the minority shareholders at the respective dates on which investments are made by the Company in the subsidiary companies and further movements in their share in the equity, subsequent to the dates of investment as stated above.
f. Investments in Associates are dealt with in accordance with Accounting Standard (AS) 23- Accounting for Investments in Associates in Consolidated Financial Statements using ‘Equity Method’. The Company’s share of the post-acquisition profits or losses is included in the carrying cost of investments.
Notes to the Consolidated Financial Statements for the year ended March 31, 2014
180 | Annual Report 2013-14
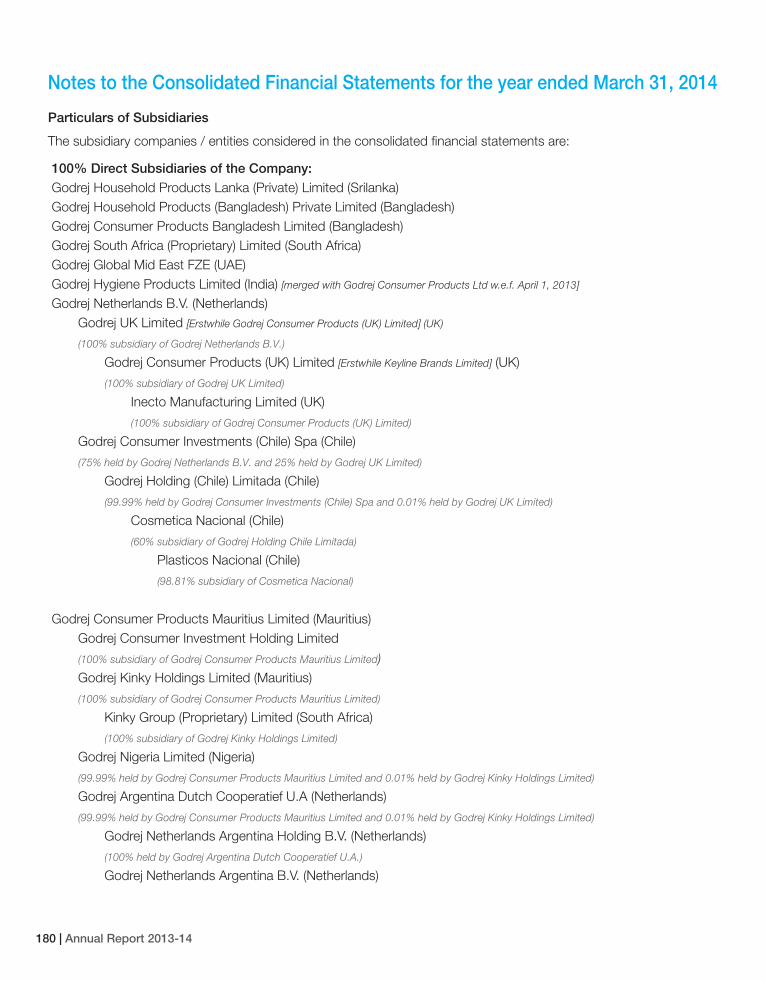
Particulars of Subsidiaries
The subsidiary companies / entities considered in the consolidated financial statements are:
100% Direct Subsidiaries of the Company: Godrej Household Products Lanka (Private) Limited (Srilanka)Godrej Household Products (Bangladesh) Private Limited (Bangladesh)Godrej Consumer Products Bangladesh Limited (Bangladesh)Godrej South Africa (Proprietary) Limited (South Africa)Godrej Global Mid East FZE (UAE)Godrej Hygiene Products Limited (India) [merged with Godrej Consumer Products Ltd w.e.f. April 1, 2013]
Godrej Netherlands B.V. (Netherlands) Godrej UK Limited [Erstwhile Godrej Consumer Products (UK) Limited] (UK)
(100% subsidiary of Godrej Netherlands B.V.)
Godrej Consumer Products (UK) Limited [Erstwhile Keyline Brands Limited] (UK)
(100% subsidiary of Godrej UK Limited)
Inecto Manufacturing Limited (UK)
(100% subsidiary of Godrej Consumer Products (UK) Limited)
Godrej Consumer Investments (Chile) Spa (Chile)
(75% held by Godrej Netherlands B.V. and 25% held by Godrej UK Limited)
Godrej Holding (Chile) Limitada (Chile)
(99.99% held by Godrej Consumer Investments (Chile) Spa and 0.01% held by Godrej UK Limited)
Cosmetica Nacional (Chile)
(60% subsidiary of Godrej Holding Chile Limitada)
Plasticos Nacional (Chile)
(98.81% subsidiary of Cosmetica Nacional)
Godrej Consumer Products Mauritius Limited (Mauritius) Godrej Consumer Investment Holding Limited
(100% subsidiary of Godrej Consumer Products Mauritius Limited) Godrej Kinky Holdings Limited (Mauritius)
(100% subsidiary of Godrej Consumer Products Mauritius Limited)
Kinky Group (Proprietary) Limited (South Africa)
(100% subsidiary of Godrej Kinky Holdings Limited)
Godrej Nigeria Limited (Nigeria)
(99.99% held by Godrej Consumer Products Mauritius Limited and 0.01% held by Godrej Kinky Holdings Limited)
Godrej Argentina Dutch Cooperatief U.A (Netherlands)
(99.99% held by Godrej Consumer Products Mauritius Limited and 0.01% held by Godrej Kinky Holdings Limited)
Godrej Netherlands Argentina Holding B.V. (Netherlands)
(100% held by Godrej Argentina Dutch Cooperatief U.A.)
Godrej Netherlands Argentina B.V. (Netherlands)
Notes to the Consolidated Financial Statements for the year ended March 31, 2014
Godrej Consumer Products Limited 181
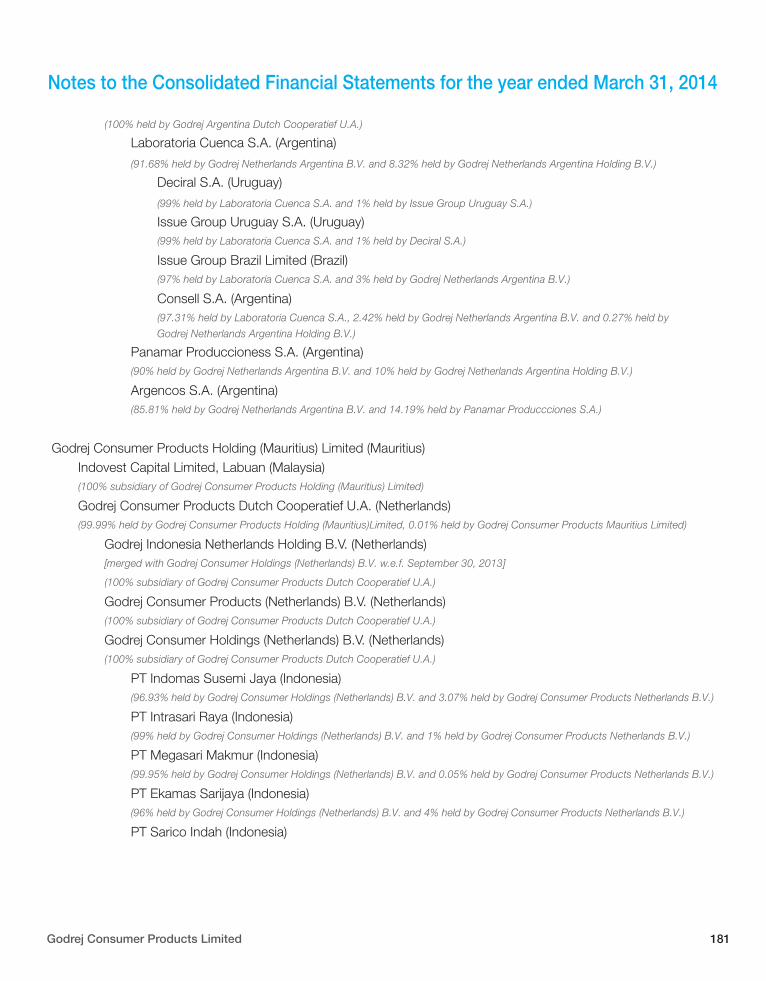
(100% held by Godrej Argentina Dutch Cooperatief U.A.)
Laboratoria Cuenca S.A. (Argentina)
(91.68% held by Godrej Netherlands Argentina B.V. and 8.32% held by Godrej Netherlands Argentina Holding B.V.)
Deciral S.A. (Uruguay)
(99% held by Laboratoria Cuenca S.A. and 1% held by Issue Group Uruguay S.A.)
Issue Group Uruguay S.A. (Uruguay) (99% held by Laboratoria Cuenca S.A. and 1% held by Deciral S.A.)
Issue Group Brazil Limited (Brazil) (97% held by Laboratoria Cuenca S.A. and 3% held by Godrej Netherlands Argentina B.V.)
Consell S.A. (Argentina) (97.31% held by Laboratoria Cuenca S.A., 2.42% held by Godrej Netherlands Argentina B.V. and 0.27% held by
Godrej Netherlands Argentina Holding B.V.)
Panamar Produccioness S.A. (Argentina) (90% held by Godrej Netherlands Argentina B.V. and 10% held by Godrej Netherlands Argentina Holding B.V.)
Argencos S.A. (Argentina) (85.81% held by Godrej Netherlands Argentina B.V. and 14.19% held by Panamar Produccciones S.A.)
Godrej Consumer Products Holding (Mauritius) Limited (Mauritius) Indovest Capital Limited, Labuan (Malaysia) (100% subsidiary of Godrej Consumer Products Holding (Mauritius) Limited)
Godrej Consumer Products Dutch Cooperatief U.A. (Netherlands) (99.99% held by Godrej Consumer Products Holding (Mauritius)Limited, 0.01% held by Godrej Consumer Products Mauritius Limited)
Godrej Indonesia Netherlands Holding B.V. (Netherlands) [merged with Godrej Consumer Holdings (Netherlands) B.V. w.e.f. September 30, 2013]
(100% subsidiary of Godrej Consumer Products Dutch Cooperatief U.A.)
Godrej Consumer Products (Netherlands) B.V. (Netherlands) (100% subsidiary of Godrej Consumer Products Dutch Cooperatief U.A.)
Godrej Consumer Holdings (Netherlands) B.V. (Netherlands) (100% subsidiary of Godrej Consumer Products Dutch Cooperatief U.A.)
PT Indomas Susemi Jaya (Indonesia) (96.93% held by Godrej Consumer Holdings (Netherlands) B.V. and 3.07% held by Godrej Consumer Products Netherlands B.V.)
PT Intrasari Raya (Indonesia) (99% held by Godrej Consumer Holdings (Netherlands) B.V. and 1% held by Godrej Consumer Products Netherlands B.V.)
PT Megasari Makmur (Indonesia) (99.95% held by Godrej Consumer Holdings (Netherlands) B.V. and 0.05% held by Godrej Consumer Products Netherlands B.V.)
PT Ekamas Sarijaya (Indonesia) (96% held by Godrej Consumer Holdings (Netherlands) B.V. and 4% held by Godrej Consumer Products Netherlands B.V.)
PT Sarico Indah (Indonesia)
Notes to the Consolidated Financial Statements for the year ended March 31, 2014
182 | Annual Report 2013-14
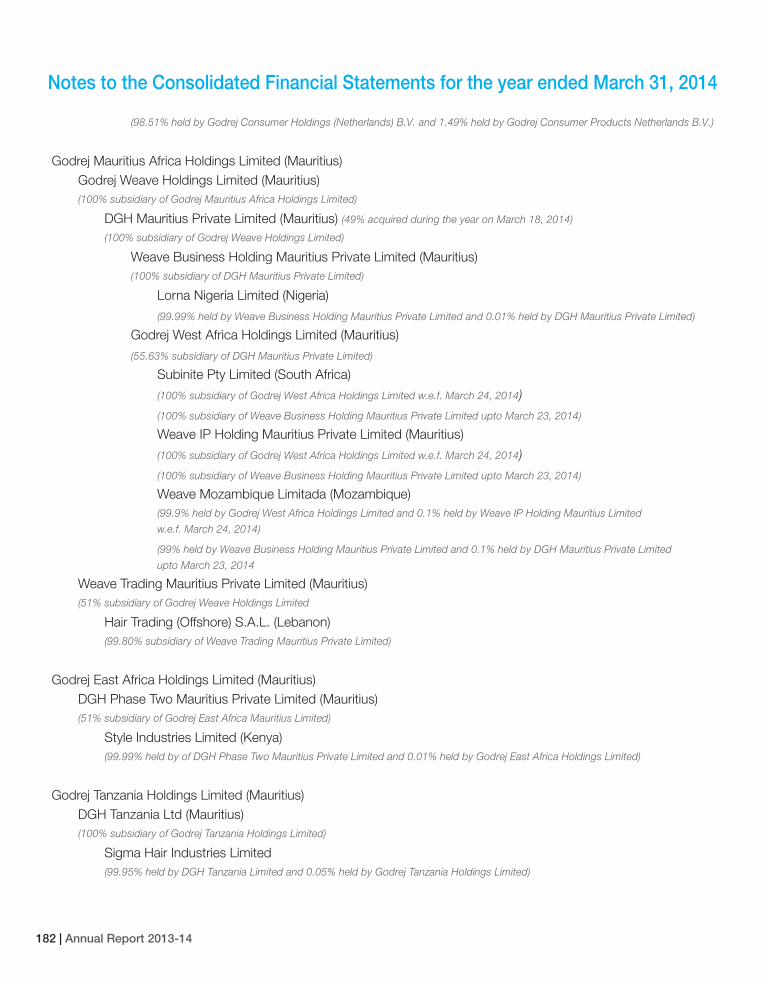
(98.51% held by Godrej Consumer Holdings (Netherlands) B.V. and 1.49% held by Godrej Consumer Products Netherlands B.V.)
Godrej Mauritius Africa Holdings Limited (Mauritius) Godrej Weave Holdings Limited (Mauritius) (100% subsidiary of Godrej Mauritius Africa Holdings Limited)
DGH Mauritius Private Limited (Mauritius) (49% acquired during the year on March 18, 2014)
(100% subsidiary of Godrej Weave Holdings Limited)
Weave Business Holding Mauritius Private Limited (Mauritius) (100% subsidiary of DGH Mauritius Private Limited)
Lorna Nigeria Limited (Nigeria)
(99.99% held by Weave Business Holding Mauritius Private Limited and 0.01% held by DGH Mauritius Private Limited)
Godrej West Africa Holdings Limited (Mauritius)
(55.63% subsidiary of DGH Mauritius Private Limited)
Subinite Pty Limited (South Africa)
(100% subsidiary of Godrej West Africa Holdings Limited w.e.f. March 24, 2014)
(100% subsidiary of Weave Business Holding Mauritius Private Limited upto March 23, 2014)
Weave IP Holding Mauritius Private Limited (Mauritius)
(100% subsidiary of Godrej West Africa Holdings Limited w.e.f. March 24, 2014)
(100% subsidiary of Weave Business Holding Mauritius Private Limited upto March 23, 2014)
Weave Mozambique Limitada (Mozambique) (99.9% held by Godrej West Africa Holdings Limited and 0.1% held by Weave IP Holding Mauritius Limited
w.e.f. March 24, 2014)
(99% held by Weave Business Holding Mauritius Private Limited and 0.1% held by DGH Mauritius Private Limited
upto March 23, 2014
Weave Trading Mauritius Private Limited (Mauritius) (51% subsidiary of Godrej Weave Holdings Limited
Hair Trading (Offshore) S.A.L. (Lebanon) (99.80% subsidiary of Weave Trading Mauritius Private Limited)
Godrej East Africa Holdings Limited (Mauritius) DGH Phase Two Mauritius Private Limited (Mauritius) (51% subsidiary of Godrej East Africa Mauritius Limited)
Style Industries Limited (Kenya) (99.99% held by of DGH Phase Two Mauritius Private Limited and 0.01% held by Godrej East Africa Holdings Limited)
Godrej Tanzania Holdings Limited (Mauritius) DGH Tanzania Ltd (Mauritius) (100% subsidiary of Godrej Tanzania Holdings Limited)
Sigma Hair Industries Limited (99.95% held by DGH Tanzania Limited and 0.05% held by Godrej Tanzania Holdings Limited)
Notes to the Consolidated Financial Statements for the year ended March 31, 2014
Godrej Consumer Products Limited 183
Notes to the Consolidated Financial Statements for the year ended March 31, 2014
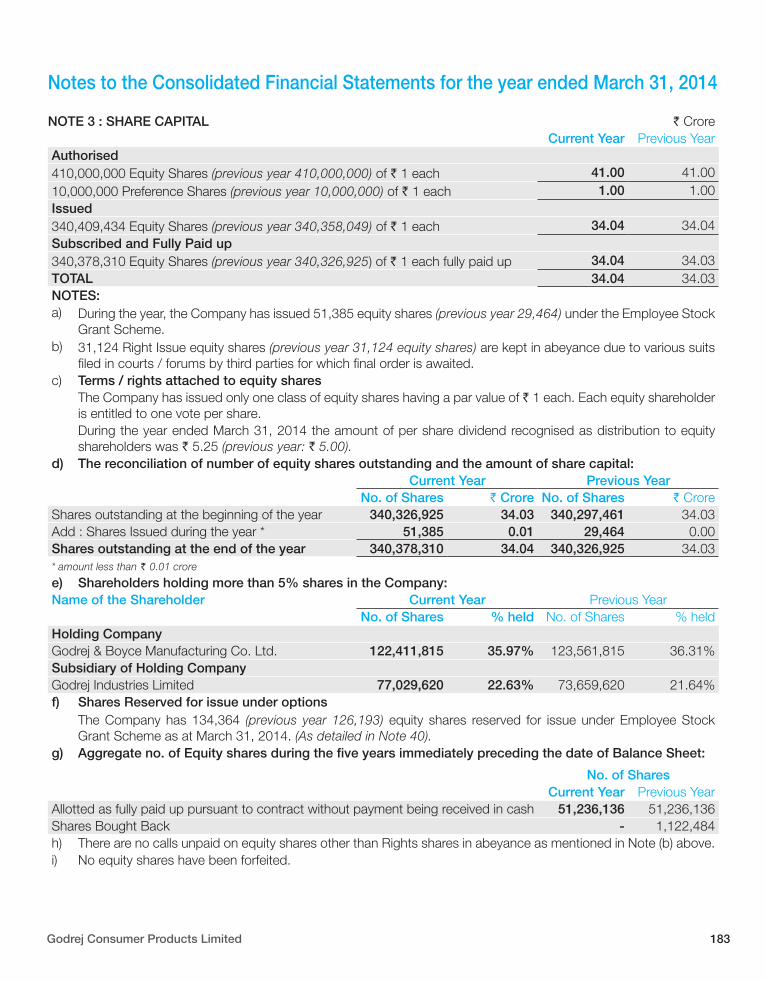
NOTE 3 : SHARE CAPITAL ` Crore Current Year Previous Year
Authorised410,000,000 Equity Shares (previous year 410,000,000) of ` 1 each 41.00 41.0010,000,000 Preference Shares (previous year 10,000,000) of ` 1 each 1.00 1.00Issued340,409,434 Equity Shares (previous year 340,358,049) of ` 1 each 34.04 34.04Subscribed and Fully Paid up340,378,310 Equity Shares (previous year 340,326,925) of ` 1 each fully paid up 34.04 34.03TOTAL 34.04 34.03NOTES:a) During the year, the Company has issued 51,385 equity shares (previous year 29,464) under the Employee Stock
Grant Scheme.b) 31,124 Right Issue equity shares (previous year 31,124 equity shares) are kept in abeyance due to various suits
filed in courts / forums by third parties for which final order is awaited.c) Terms / rights attached to equity shares
The Company has issued only one class of equity shares having a par value of ` 1 each. Each equity shareholder is entitled to one vote per share. During the year ended March 31, 2014 the amount of per share dividend recognised as distribution to equity shareholders was ` 5.25 (previous year: ` 5.00).
d) The reconciliation of number of equity shares outstanding and the amount of share capital:Current Year Previous Year
No. of Shares ` Crore No. of Shares ` CroreShares outstanding at the beginning of the year 340,326,925 34.03 340,297,461 34.03Add : Shares Issued during the year * 51,385 0.01 29,464 0.00Shares outstanding at the end of the year 340,378,310 34.04 340,326,925 34.03* amount less than ` 0.01 crore
e) Shareholders holding more than 5% shares in the Company:Name of the Shareholder Current Year Previous Year
No. of Shares % held No. of Shares % heldHolding CompanyGodrej & Boyce Manufacturing Co. Ltd. 122,411,815 35.97% 123,561,815 36.31%Subsidiary of Holding CompanyGodrej Industries Limited 77,029,620 22.63% 73,659,620 21.64%f) Shares Reserved for issue under options
The Company has 134,364 (previous year 126,193) equity shares reserved for issue under Employee Stock Grant Scheme as at March 31, 2014. (As detailed in Note 40).
g) Aggregate no. of Equity shares during the five years immediately preceding the date of Balance Sheet:
No. of Shares Current Year Previous Year
Allotted as fully paid up pursuant to contract without payment being received in cash 51,236,136 51,236,136Shares Bought Back - 1,122,484h) There are no calls unpaid on equity shares other than Rights shares in abeyance as mentioned in Note (b) above.i) No equity shares have been forfeited.
184 | Annual Report 2013-14
Notes to the Consolidated Financial Statements for the year ended March 31, 2014
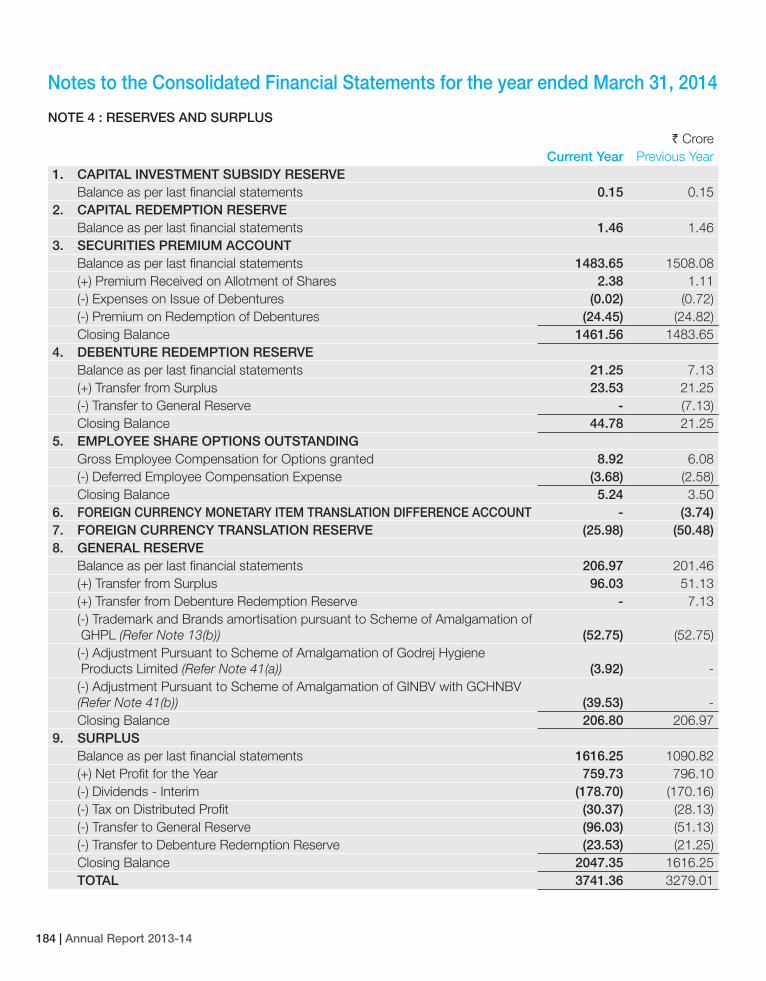
NOTE 4 : RESERVES AND SURPLUS
` CroreCurrent Year Previous Year
1. CAPITAL INVESTMENT SUBSIDY RESERVEBalance as per last financial statements 0.15 0.15
2. CAPITAL REDEMPTION RESERVEBalance as per last financial statements 1.46 1.46
3. SECURITIES PREMIUM ACCOUNTBalance as per last financial statements 1483.65 1508.08(+) Premium Received on Allotment of Shares 2.38 1.11(-) Expenses on Issue of Debentures (0.02) (0.72)(-) Premium on Redemption of Debentures (24.45) (24.82)Closing Balance 1461.56 1483.65
4. DEBENTURE REDEMPTION RESERVEBalance as per last financial statements 21.25 7.13(+) Transfer from Surplus 23.53 21.25(-) Transfer to General Reserve - (7.13)Closing Balance 44.78 21.25
5. EMPLOYEE SHARE OPTIONS OUTSTANDINGGross Employee Compensation for Options granted 8.92 6.08(-) Deferred Employee Compensation Expense (3.68) (2.58)Closing Balance 5.24 3.50
6. FOREIGN CURRENCY MONETARY ITEM TRANSLATION DIFFERENCE ACCOUNT - (3.74)7. FOREIGN CURRENCY TRANSLATION RESERVE (25.98) (50.48)8. GENERAL RESERVE
Balance as per last financial statements 206.97 201.46(+) Transfer from Surplus 96.03 51.13(+) Transfer from Debenture Redemption Reserve - 7.13(-) Trademark and Brands amortisation pursuant to Scheme of Amalgamation of GHPL (Refer Note 13(b)) (52.75) (52.75)(-) Adjustment Pursuant to Scheme of Amalgamation of Godrej Hygiene Products Limited (Refer Note 41(a)) (3.92) - (-) Adjustment Pursuant to Scheme of Amalgamation of GINBV with GCHNBV (Refer Note 41(b)) (39.53) - Closing Balance 206.80 206.97
9. SURPLUSBalance as per last financial statements 1616.25 1090.82(+) Net Profit for the Year 759.73 796.10(-) Dividends - Interim (178.70) (170.16)(-) Tax on Distributed Profit (30.37) (28.13)(-) Transfer to General Reserve (96.03) (51.13)(-) Transfer to Debenture Redemption Reserve (23.53) (21.25)Closing Balance 2047.35 1616.25TOTAL 3741.36 3279.01
Godrej Consumer Products Limited 185
Notes to the Consolidated Financial Statements for the year ended March 31, 2014
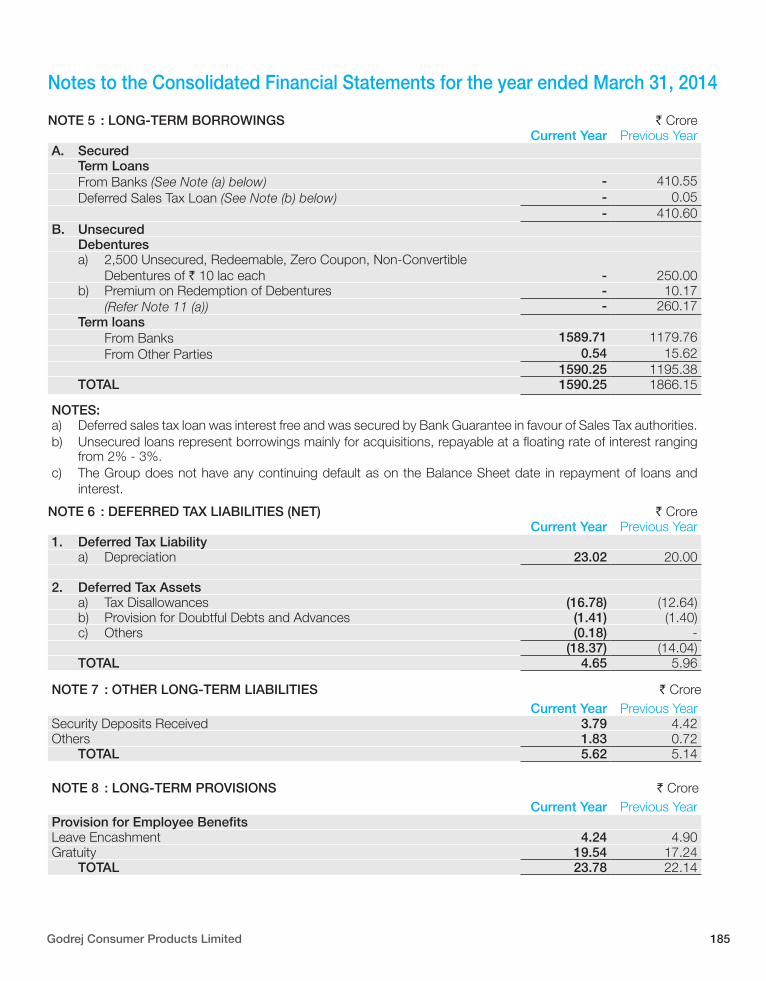
NOTE 5 : LONG-TERM BORROWINGS ` CroreCurrent Year Previous Year
A. SecuredTerm LoansFrom Banks (See Note (a) below) - 410.55Deferred Sales Tax Loan (See Note (b) below) - 0.05
- 410.60B. Unsecured
Debenturesa) 2,500 Unsecured, Redeemable, Zero Coupon, Non-Convertible Debentures of ` 10 lac each - 250.00b) Premium on Redemption of Debentures - 10.17 (Refer Note 11 (a)) - 260.17Term loans From Banks 1589.71 1179.76 From Other Parties 0.54 15.62
1590.25 1195.38TOTAL 1590.25 1866.15
NOTES:a) Deferred sales tax loan was interest free and was secured by Bank Guarantee in favour of Sales Tax authorities.b) Unsecured loans represent borrowings mainly for acquisitions, repayable at a floating rate of interest ranging
from 2% - 3%.c) The Group does not have any continuing default as on the Balance Sheet date in repayment of loans and
interest.
NOTE 6 : DEFERRED TAX LIABILITIES (NET) ` CroreCurrent Year Previous Year
1. Deferred Tax Liabilitya) Depreciation 23.02 20.00
2. Deferred Tax Assetsa) Tax Disallowances (16.78) (12.64)b) Provision for Doubtful Debts and Advances (1.41) (1.40)c) Others (0.18) -
(18.37) (14.04)TOTAL 4.65 5.96
NOTE 7 : OTHER LONG-TERM LIABILITIES ` CroreCurrent Year Previous Year
Security Deposits Received 3.79 4.42Others 1.83 0.72 TOTAL 5.62 5.14
NOTE 8 : LONG-TERM PROVISIONS ` CroreCurrent Year Previous Year
Provision for Employee BenefitsLeave Encashment 4.24 4.90Gratuity 19.54 17.24 TOTAL 23.78 22.14
186 | Annual Report 2013-14
Notes to the Consolidated Financial Statements for the year ended March 31, 2014
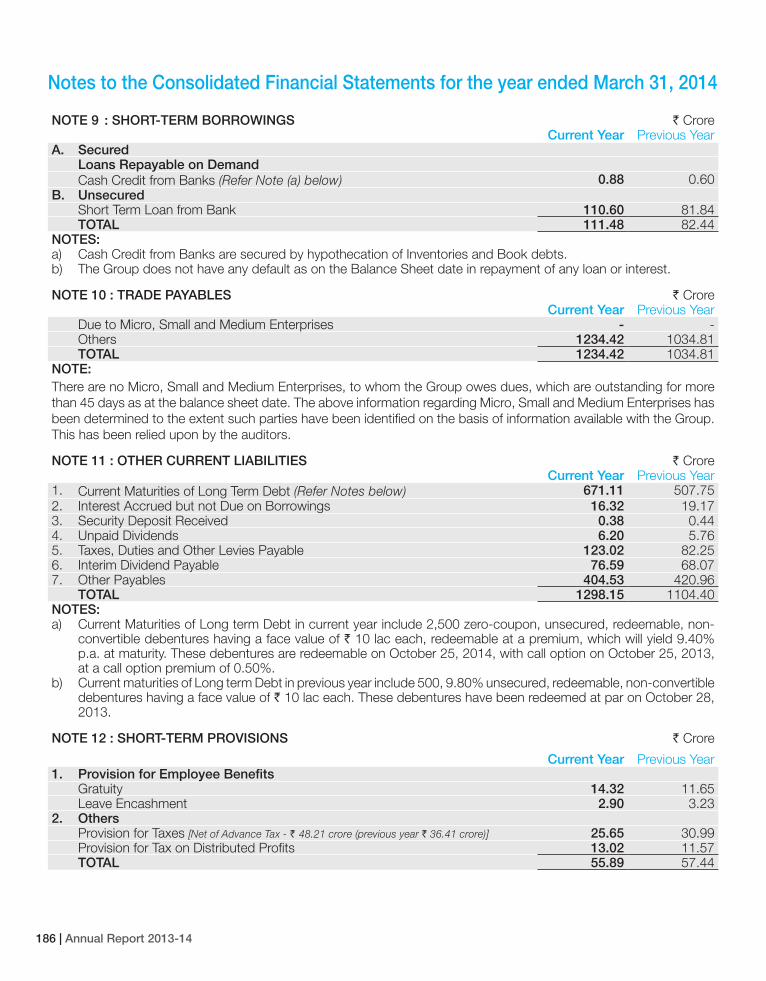
NOTE 9 : SHORT-TERM BORROWINGS ` CroreCurrent Year Previous Year
A. SecuredLoans Repayable on DemandCash Credit from Banks (Refer Note (a) below) 0.88 0.60
B. UnsecuredShort Term Loan from Bank 110.60 81.84TOTAL 111.48 82.44
NOTES:a) Cash Credit from Banks are secured by hypothecation of Inventories and Book debts.b) The Group does not have any default as on the Balance Sheet date in repayment of any loan or interest.
NOTE 10 : TRADE PAYABLES ` CroreCurrent Year Previous Year
Due to Micro, Small and Medium Enterprises - - Others 1234.42 1034.81TOTAL 1234.42 1034.81
NOTE:There are no Micro, Small and Medium Enterprises, to whom the Group owes dues, which are outstanding for more than 45 days as at the balance sheet date. The above information regarding Micro, Small and Medium Enterprises has been determined to the extent such parties have been identified on the basis of information available with the Group. This has been relied upon by the auditors.
NOTE 11 : OTHER CURRENT LIABILITIES ` CroreCurrent Year Previous Year
1. Current Maturities of Long Term Debt (Refer Notes below) 671.11 507.752. Interest Accrued but not Due on Borrowings 16.32 19.173. Security Deposit Received 0.38 0.444. Unpaid Dividends 6.20 5.765. Taxes, Duties and Other Levies Payable 123.02 82.256. Interim Dividend Payable 76.59 68.077. Other Payables 404.53 420.96
TOTAL 1298.15 1104.40NOTES:a) Current Maturities of Long term Debt in current year include 2,500 zero-coupon, unsecured, redeemable, non-
convertible debentures having a face value of ` 10 lac each, redeemable at a premium, which will yield 9.40% p.a. at maturity. These debentures are redeemable on October 25, 2014, with call option on October 25, 2013, at a call option premium of 0.50%.
b) Current maturities of Long term Debt in previous year include 500, 9.80% unsecured, redeemable, non-convertible debentures having a face value of ` 10 lac each. These debentures have been redeemed at par on October 28, 2013.
NOTE 12 : SHORT-TERM PROVISIONS ` Crore
Current Year Previous Year1. Provision for Employee Benefits
Gratuity 14.32 11.65Leave Encashment 2.90 3.23
2. OthersProvision for Taxes [Net of Advance Tax - ` 48.21 crore (previous year ` 36.41 crore)] 25.65 30.99Provision for Tax on Distributed Profits 13.02 11.57TOTAL 55.89 57.44
Godrej Consumer Products Limited 187
Notes to the Consolidated Financial Statements for the year ended March 31, 2014
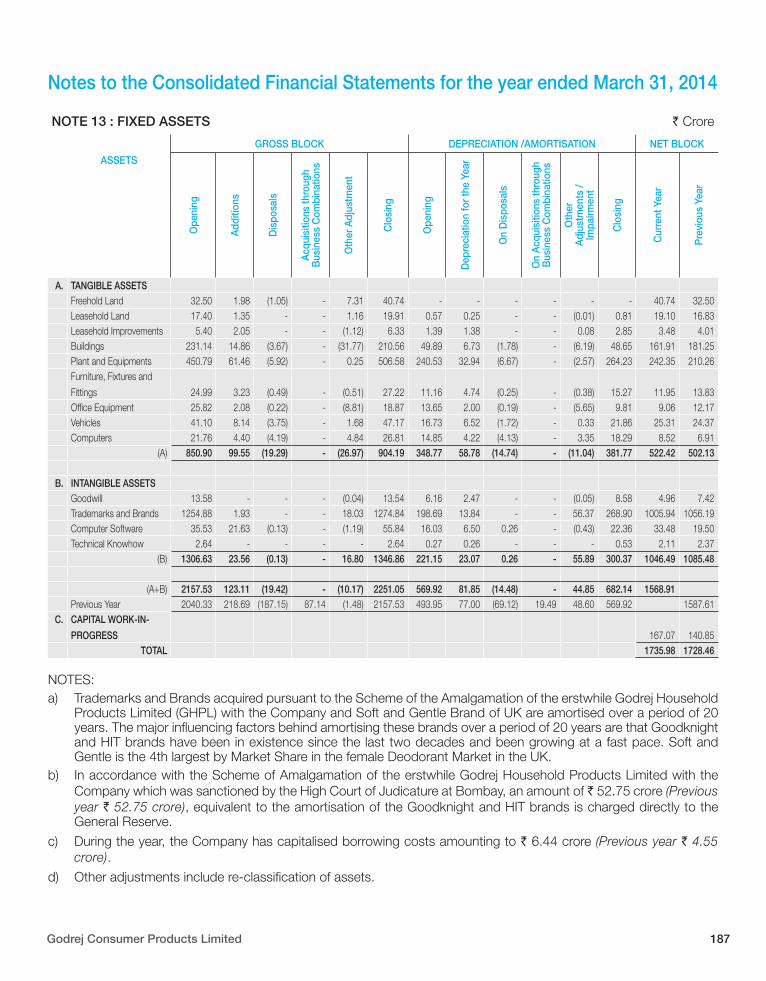
NOTE 13 : FIXED ASSETS ` Crore
GROSS BLOCK DEPRECIATION /AMORTISATION NET BLOCK
ASSETS
Ope
ning
Add
ition
s
Dis
posa
ls
Acq
uisi
tions
thro
ugh
B
usin
ess
Com
bina
tions
Oth
er A
djus
tmen
t
Clo
sing
Ope
ning
Dep
reci
atio
n fo
r the
Yea
r
On
Dis
posa
ls
On
Acq
uisi
tions
thro
ugh
Bus
ines
s C
ombi
natio
ns
Oth
er
Adj
ustm
ents
/
Impa
irmen
t
Clo
sing
Cur
rent
Yea
r
Pre
viou
s Ye
ar
A. TANGIBLE ASSETSFreehold Land 32.50 1.98 (1.05) - 7.31 40.74 - - - - - - 40.74 32.50Leasehold Land 17.40 1.35 - - 1.16 19.91 0.57 0.25 - - (0.01) 0.81 19.10 16.83Leasehold Improvements 5.40 2.05 - - (1.12) 6.33 1.39 1.38 - - 0.08 2.85 3.48 4.01Buildings 231.14 14.86 (3.67) - (31.77) 210.56 49.89 6.73 (1.78) - (6.19) 48.65 161.91 181.25Plant and Equipments 450.79 61.46 (5.92) - 0.25 506.58 240.53 32.94 (6.67) - (2.57) 264.23 242.35 210.26Furniture, Fixtures and
Fittings 24.99 3.23 (0.49) - (0.51) 27.22 11.16 4.74 (0.25) - (0.38) 15.27 11.95 13.83Office Equipment 25.82 2.08 (0.22) - (8.81) 18.87 13.65 2.00 (0.19) - (5.65) 9.81 9.06 12.17Vehicles 41.10 8.14 (3.75) - 1.68 47.17 16.73 6.52 (1.72) - 0.33 21.86 25.31 24.37Computers 21.76 4.40 (4.19) - 4.84 26.81 14.85 4.22 (4.13) - 3.35 18.29 8.52 6.91
(A) 850.90 99.55 (19.29) - (26.97) 904.19 348.77 58.78 (14.74) - (11.04) 381.77 522.42 502.13
B. INTANGIBLE ASSETSGoodwill 13.58 - - - (0.04) 13.54 6.16 2.47 - - (0.05) 8.58 4.96 7.42Trademarks and Brands 1254.88 1.93 - - 18.03 1274.84 198.69 13.84 - - 56.37 268.90 1005.94 1056.19Computer Software 35.53 21.63 (0.13) - (1.19) 55.84 16.03 6.50 0.26 - (0.43) 22.36 33.48 19.50Technical Knowhow 2.64 - - - - 2.64 0.27 0.26 - - - 0.53 2.11 2.37
(B) 1306.63 23.56 (0.13) - 16.80 1346.86 221.15 23.07 0.26 - 55.89 300.37 1046.49 1085.48
(A+B) 2157.53 123.11 (19.42) - (10.17) 2251.05 569.92 81.85 (14.48) - 44.85 682.14 1568.91Previous Year 2040.33 218.69 (187.15) 87.14 (1.48) 2157.53 493.95 77.00 (69.12) 19.49 48.60 569.92 1587.61
C. CAPITAL WORK-IN-
PROGRESS 167.07 140.85 TOTAL 1735.98 1728.46
NOTES: a) Trademarks and Brands acquired pursuant to the Scheme of the Amalgamation of the erstwhile Godrej Household
Products Limited (GHPL) with the Company and Soft and Gentle Brand of UK are amortised over a period of 20 years. The major influencing factors behind amortising these brands over a period of 20 years are that Goodknight and HIT brands have been in existence since the last two decades and been growing at a fast pace. Soft and Gentle is the 4th largest by Market Share in the female Deodorant Market in the UK.
b) In accordance with the Scheme of Amalgamation of the erstwhile Godrej Household Products Limited with the Company which was sanctioned by the High Court of Judicature at Bombay, an amount of ` 52.75 crore (Previous year ` 52.75 crore), equivalent to the amortisation of the Goodknight and HIT brands is charged directly to the General Reserve.
c) During the year, the Company has capitalised borrowing costs amounting to ` 6.44 crore (Previous year ` 4.55 crore).
d) Other adjustments include re-classification of assets.
188 | Annual Report 2013-14
Notes to the Consolidated Financial Statements for the year ended March 31, 2014
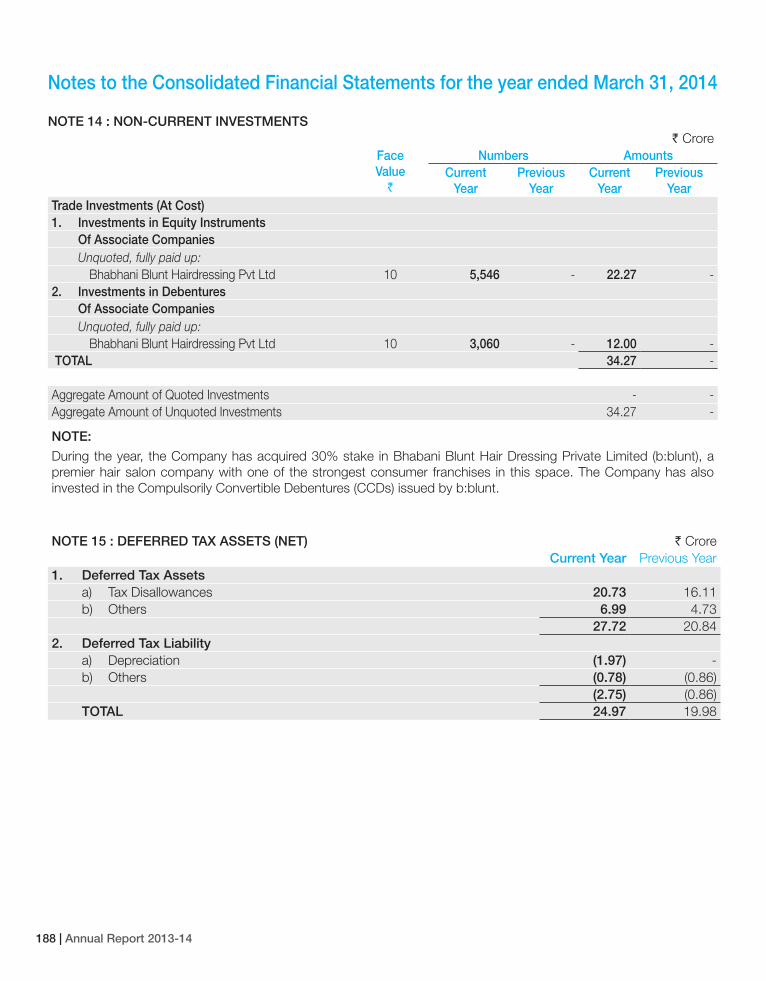
NOTE 14 : NON-CURRENT INVESTMENTS` Crore
Face Value
`
Numbers AmountsCurrent
YearPrevious
YearCurrent
YearPrevious
YearTrade Investments (At Cost)1. Investments in Equity Instruments Of Associate Companies Unquoted, fully paid up: Bhabhani Blunt Hairdressing Pvt Ltd 10 5,546 - 22.27 -2. Investments in Debentures Of Associate Companies Unquoted, fully paid up: Bhabhani Blunt Hairdressing Pvt Ltd 10 3,060 - 12.00 - TOTAL 34.27 -
Aggregate Amount of Quoted Investments - - Aggregate Amount of Unquoted Investments 34.27 -
NOTE:
During the year, the Company has acquired 30% stake in Bhabani Blunt Hair Dressing Private Limited (b:blunt), a premier hair salon company with one of the strongest consumer franchises in this space. The Company has also invested in the Compulsorily Convertible Debentures (CCDs) issued by b:blunt.
NOTE 15 : DEFERRED TAX ASSETS (NET) ` CroreCurrent Year Previous Year
1. Deferred Tax Assetsa) Tax Disallowances 20.73 16.11b) Others 6.99 4.73
27.72 20.842. Deferred Tax Liability
a) Depreciation (1.97) - b) Others (0.78) (0.86)
(2.75) (0.86)TOTAL 24.97 19.98
Godrej Consumer Products Limited 189
Notes to the Consolidated Financial Statements for the year ended March 31, 2014
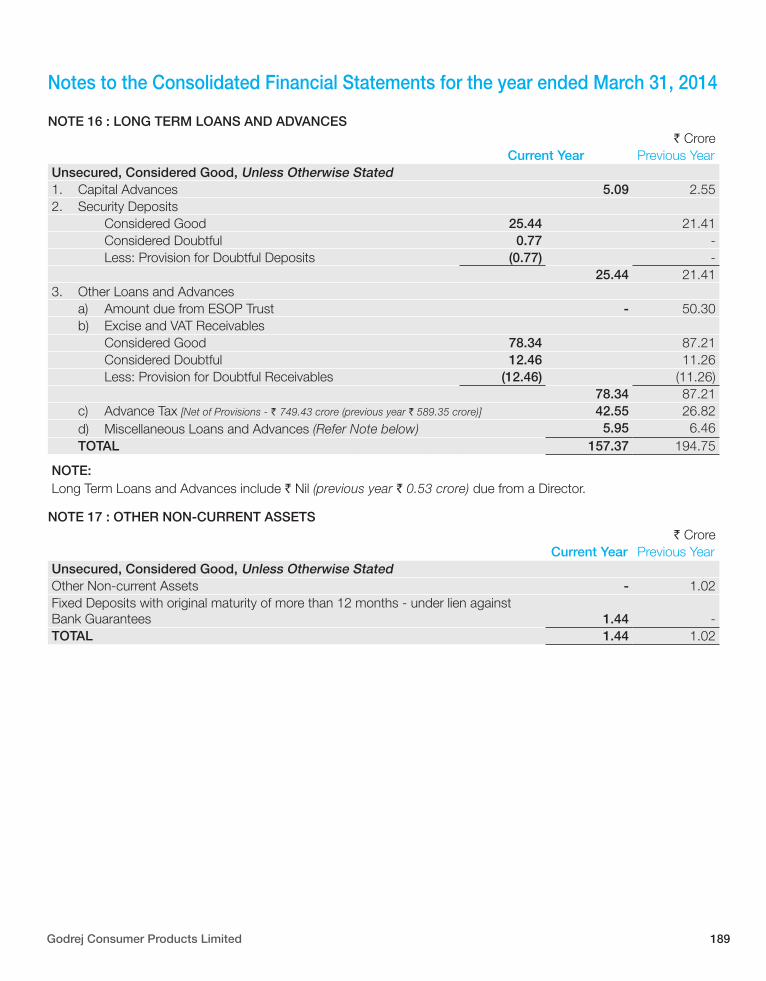
NOTE 16 : LONG TERM LOANS AND ADVANCES ` Crore
Current Year Previous YearUnsecured, Considered Good, Unless Otherwise Stated1. Capital Advances 5.09 2.552. Security Deposits Considered Good 25.44 21.41 Considered Doubtful 0.77 - Less: Provision for Doubtful Deposits (0.77) -
25.44 21.413. Other Loans and Advances a) Amount due from ESOP Trust - 50.30 b) Excise and VAT Receivables Considered Good 78.34 87.21 Considered Doubtful 12.46 11.26 Less: Provision for Doubtful Receivables (12.46) (11.26)
78.34 87.21 c) Advance Tax [Net of Provisions - ` 749.43 crore (previous year ` 589.35 crore)] 42.55 26.82 d) Miscellaneous Loans and Advances (Refer Note below) 5.95 6.46 TOTAL 157.37 194.75
NOTE:Long Term Loans and Advances include ` Nil (previous year ` 0.53 crore) due from a Director.
NOTE 17 : OTHER NON-CURRENT ASSETS` Crore
Current Year Previous YearUnsecured, Considered Good, Unless Otherwise StatedOther Non-current Assets - 1.02Fixed Deposits with original maturity of more than 12 months - under lien against Bank Guarantees 1.44 - TOTAL 1.44 1.02
190 | Annual Report 2013-14
Notes to the Consolidated Financial Statements for the year ended March 31, 2014
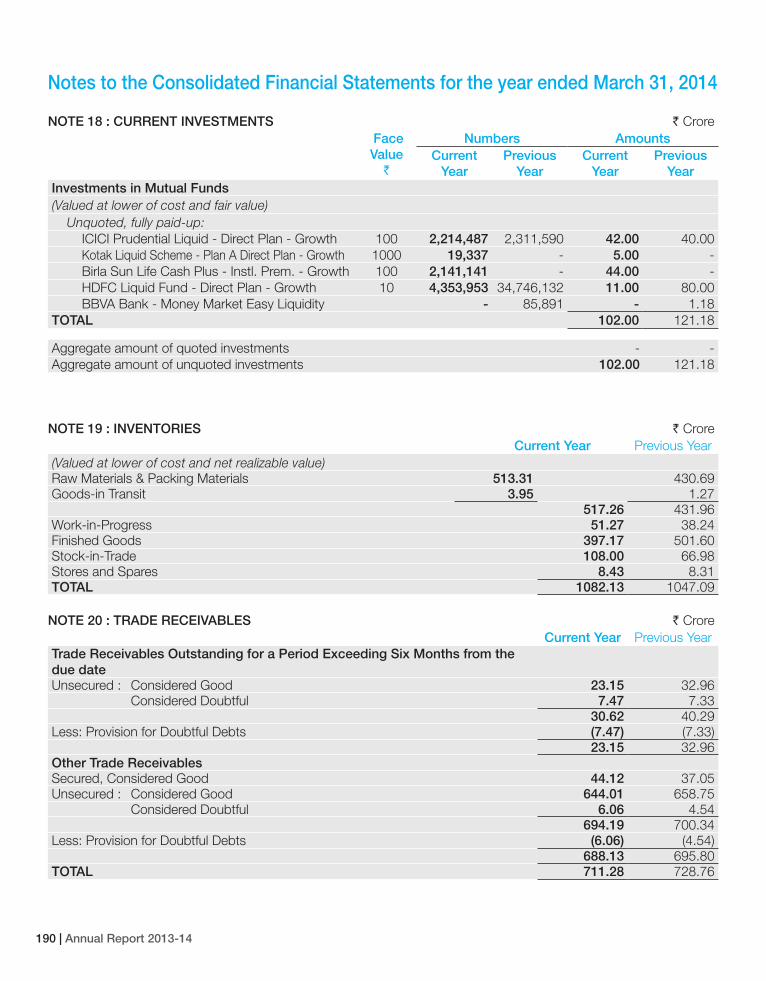
NOTE 18 : CURRENT INVESTMENTS ` Crore Face Value
`
Numbers AmountsCurrent
YearPrevious
YearCurrent
YearPrevious
YearInvestments in Mutual Funds(Valued at lower of cost and fair value) Unquoted, fully paid-up: ICICI Prudential Liquid - Direct Plan - Growth 100 2,214,487 2,311,590 42.00 40.00 Kotak Liquid Scheme - Plan A Direct Plan - Growth 1000 19,337 - 5.00 - Birla Sun Life Cash Plus - Instl. Prem. - Growth 100 2,141,141 - 44.00 - HDFC Liquid Fund - Direct Plan - Growth 10 4,353,953 34,746,132 11.00 80.00 BBVA Bank - Money Market Easy Liquidity - 85,891 - 1.18TOTAL 102.00 121.18
Aggregate amount of quoted investments - - Aggregate amount of unquoted investments 102.00 121.18
NOTE 19 : INVENTORIES ` CroreCurrent Year Previous Year
(Valued at lower of cost and net realizable value)Raw Materials & Packing Materials 513.31 430.69Goods-in Transit 3.95 1.27
517.26 431.96Work-in-Progress 51.27 38.24Finished Goods 397.17 501.60Stock-in-Trade 108.00 66.98Stores and Spares 8.43 8.31TOTAL 1082.13 1047.09
NOTE 20 : TRADE RECEIVABLES ` CroreCurrent Year Previous Year
Trade Receivables Outstanding for a Period Exceeding Six Months from the due dateUnsecured : Considered Good 23.15 32.96 Considered Doubtful 7.47 7.33
30.62 40.29Less: Provision for Doubtful Debts (7.47) (7.33)
23.15 32.96Other Trade ReceivablesSecured, Considered Good 44.12 37.05Unsecured : Considered Good 644.01 658.75 Considered Doubtful 6.06 4.54
694.19 700.34Less: Provision for Doubtful Debts (6.06) (4.54)
688.13 695.80TOTAL 711.28 728.76
Godrej Consumer Products Limited 191
Notes to the Consolidated Financial Statements for the year ended March 31, 2014
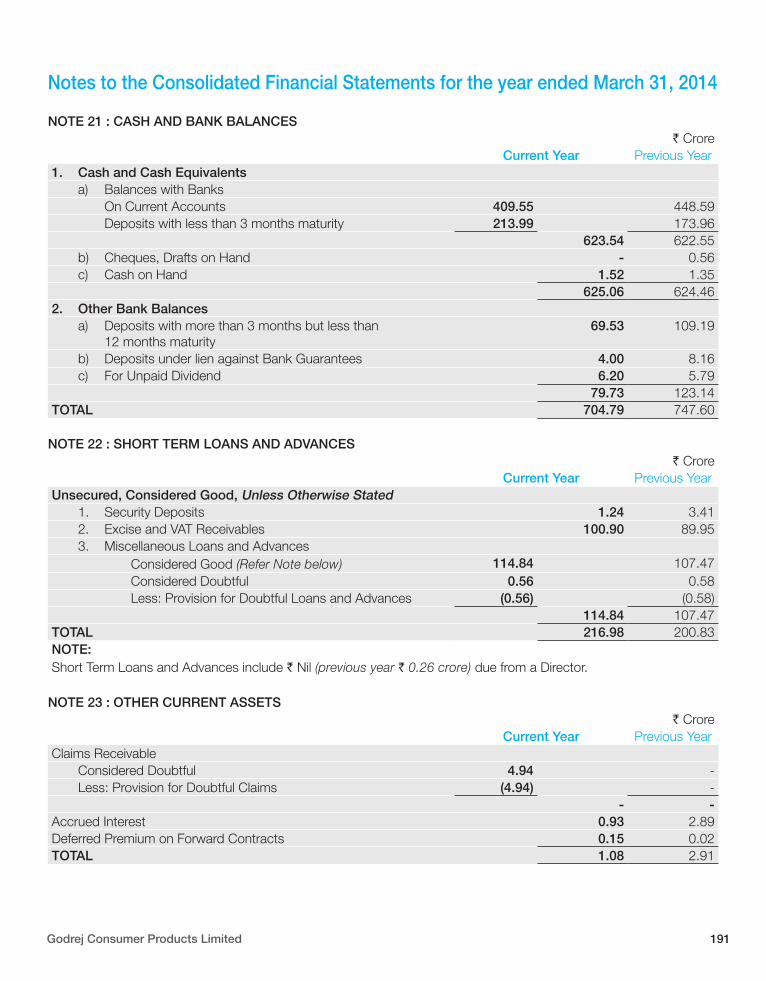
NOTE 21 : CASH AND BANK BALANCES` Crore
Current Year Previous Year1. Cash and Cash Equivalents a) Balances with Banks On Current Accounts 409.55 448.59 Deposits with less than 3 months maturity 213.99 173.96
623.54 622.55 b) Cheques, Drafts on Hand - 0.56 c) Cash on Hand 1.52 1.35
625.06 624.462. Other Bank Balances a) Deposits with more than 3 months but less than 12 months maturity
69.53 109.19
b) Deposits under lien against Bank Guarantees 4.00 8.16 c) For Unpaid Dividend 6.20 5.79
79.73 123.14TOTAL 704.79 747.60
NOTE 22 : SHORT TERM LOANS AND ADVANCES` Crore
Current Year Previous YearUnsecured, Considered Good, Unless Otherwise Stated 1. Security Deposits 1.24 3.41 2. Excise and VAT Receivables 100.90 89.95 3. Miscellaneous Loans and Advances Considered Good (Refer Note below) 114.84 107.47 Considered Doubtful 0.56 0.58 Less: Provision for Doubtful Loans and Advances (0.56) (0.58)
114.84 107.47TOTAL 216.98 200.83NOTE:Short Term Loans and Advances include ` Nil (previous year ` 0.26 crore) due from a Director.
NOTE 23 : OTHER CURRENT ASSETS` Crore
Current Year Previous YearClaims Receivable Considered Doubtful 4.94 - Less: Provision for Doubtful Claims (4.94) -
- -Accrued Interest 0.93 2.89Deferred Premium on Forward Contracts 0.15 0.02TOTAL 1.08 2.91
192 | Annual Report 2013-14
Notes to the Consolidated Financial Statements for the year ended March 31, 2014
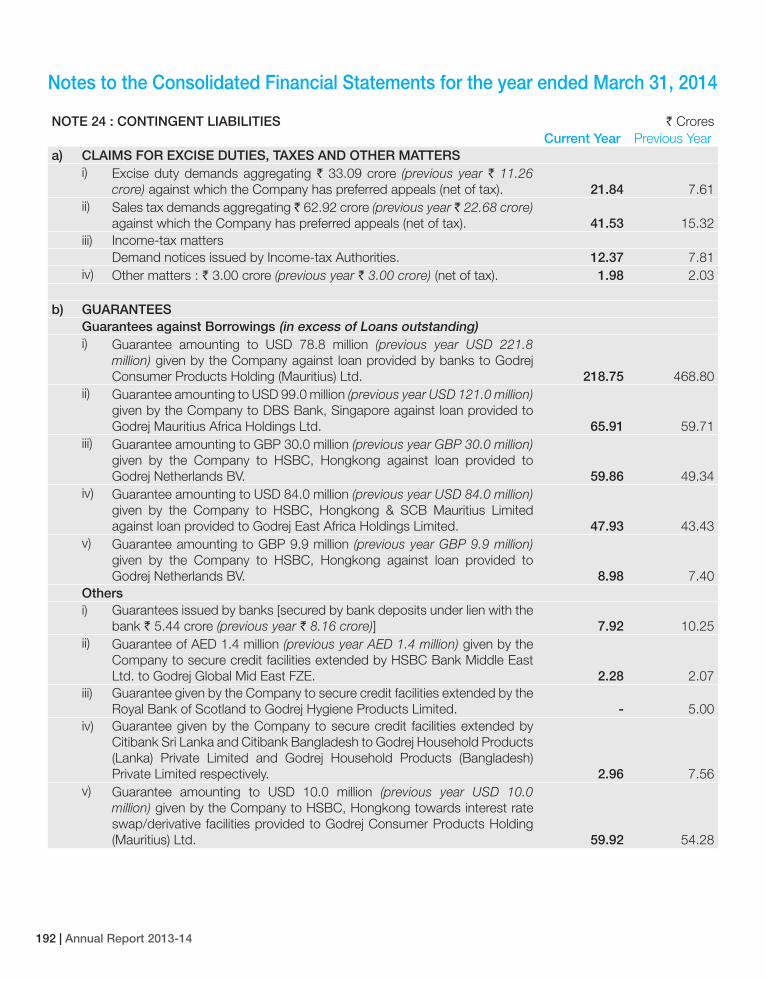
NOTE 24 : CONTINGENT LIABILITIES ` CroresCurrent Year Previous Year
a) CLAIMS FOR EXCISE DUTIES, TAXES AND OTHER MATTERSi) Excise duty demands aggregating ` 33.09 crore (previous year ` 11.26
crore) against which the Company has preferred appeals (net of tax). 21.84 7.61ii) Sales tax demands aggregating ̀ 62.92 crore (previous year ̀ 22.68 crore)
against which the Company has preferred appeals (net of tax). 41.53 15.32iii) Income-tax matters
Demand notices issued by Income-tax Authorities. 12.37 7.81iv) Other matters : ` 3.00 crore (previous year ` 3.00 crore) (net of tax). 1.98 2.03
b) GUARANTEESGuarantees against Borrowings (in excess of Loans outstanding)i) Guarantee amounting to USD 78.8 million (previous year USD 221.8
million) given by the Company against loan provided by banks to Godrej Consumer Products Holding (Mauritius) Ltd. 218.75 468.80
ii) Guarantee amounting to USD 99.0 million (previous year USD 121.0 million) given by the Company to DBS Bank, Singapore against loan provided to Godrej Mauritius Africa Holdings Ltd. 65.91 59.71
iii) Guarantee amounting to GBP 30.0 million (previous year GBP 30.0 million) given by the Company to HSBC, Hongkong against loan provided to Godrej Netherlands BV. 59.86 49.34
iv) Guarantee amounting to USD 84.0 million (previous year USD 84.0 million) given by the Company to HSBC, Hongkong & SCB Mauritius Limited against loan provided to Godrej East Africa Holdings Limited. 47.93 43.43
v) Guarantee amounting to GBP 9.9 million (previous year GBP 9.9 million) given by the Company to HSBC, Hongkong against loan provided to Godrej Netherlands BV. 8.98 7.40
Othersi) Guarantees issued by banks [secured by bank deposits under lien with the
bank ` 5.44 crore (previous year ` 8.16 crore)] 7.92 10.25ii) Guarantee of AED 1.4 million (previous year AED 1.4 million) given by the
Company to secure credit facilities extended by HSBC Bank Middle East Ltd. to Godrej Global Mid East FZE. 2.28 2.07
iii) Guarantee given by the Company to secure credit facilities extended by the Royal Bank of Scotland to Godrej Hygiene Products Limited. - 5.00
iv) Guarantee given by the Company to secure credit facilities extended by Citibank Sri Lanka and Citibank Bangladesh to Godrej Household Products (Lanka) Private Limited and Godrej Household Products (Bangladesh) Private Limited respectively. 2.96 7.56
v) Guarantee amounting to USD 10.0 million (previous year USD 10.0 million) given by the Company to HSBC, Hongkong towards interest rate swap/derivative facilities provided to Godrej Consumer Products Holding (Mauritius) Ltd. 59.92 54.28
Godrej Consumer Products Limited 193
Notes to the Consolidated Financial Statements for the year ended March 31, 2014
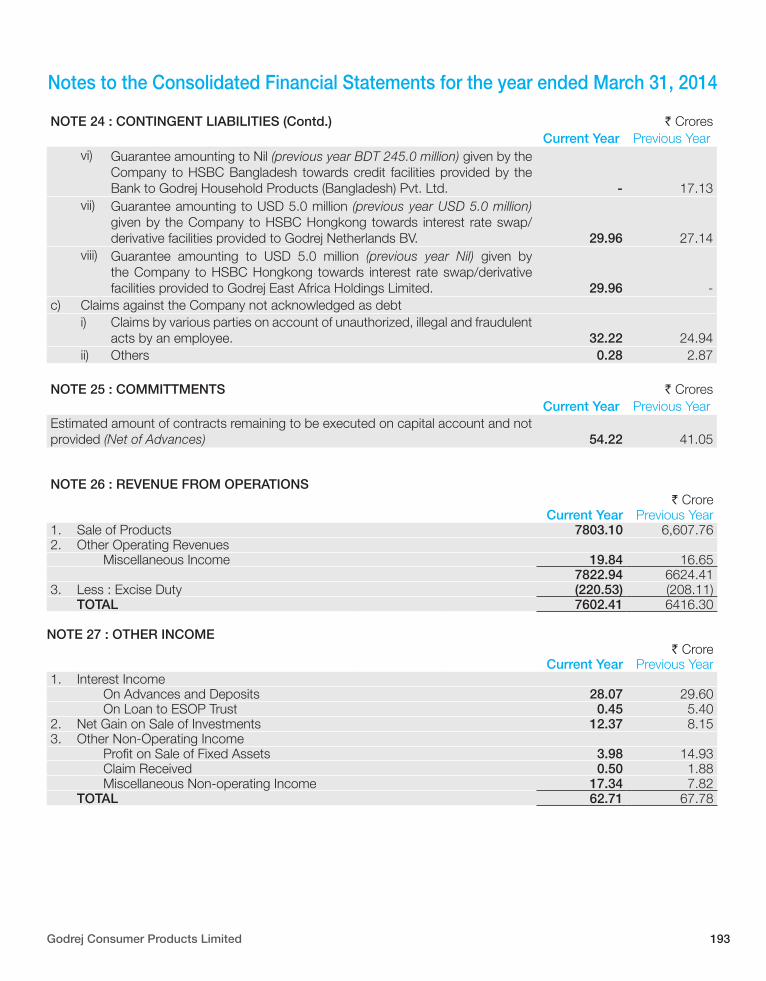
NOTE 24 : CONTINGENT LIABILITIES (Contd.) ` CroresCurrent Year Previous Year
vi) Guarantee amounting to Nil (previous year BDT 245.0 million) given by the Company to HSBC Bangladesh towards credit facilities provided by the Bank to Godrej Household Products (Bangladesh) Pvt. Ltd. - 17.13
vii) Guarantee amounting to USD 5.0 million (previous year USD 5.0 million) given by the Company to HSBC Hongkong towards interest rate swap/derivative facilities provided to Godrej Netherlands BV. 29.96 27.14
viii) Guarantee amounting to USD 5.0 million (previous year Nil) given by the Company to HSBC Hongkong towards interest rate swap/derivative facilities provided to Godrej East Africa Holdings Limited. 29.96 -
c) Claims against the Company not acknowledged as debt i) Claims by various parties on account of unauthorized, illegal and fraudulent
acts by an employee. 32.22 24.94ii) Others 0.28 2.87
NOTE 25 : COMMITTMENTS ` CroresCurrent Year Previous Year
Estimated amount of contracts remaining to be executed on capital account and not provided (Net of Advances) 54.22 41.05
NOTE 26 : REVENUE FROM OPERATIONS` Crore
Current Year Previous Year 1. Sale of Products 7803.10 6,607.762. Other Operating Revenues
Miscellaneous Income 19.84 16.657822.94 6624.41
3. Less : Excise Duty (220.53) (208.11)TOTAL 7602.41 6416.30
NOTE 27 : OTHER INCOME` Crore
Current Year Previous Year 1. Interest Income
On Advances and Deposits 28.07 29.60 On Loan to ESOP Trust 0.45 5.40
2. Net Gain on Sale of Investments 12.37 8.153. Other Non-Operating Income
Profit on Sale of Fixed Assets 3.98 14.93 Claim Received 0.50 1.88 Miscellaneous Non-operating Income 17.34 7.82TOTAL 62.71 67.78
194 | Annual Report 2013-14
Notes to the Consolidated Financial Statements for the year ended March 31, 2014
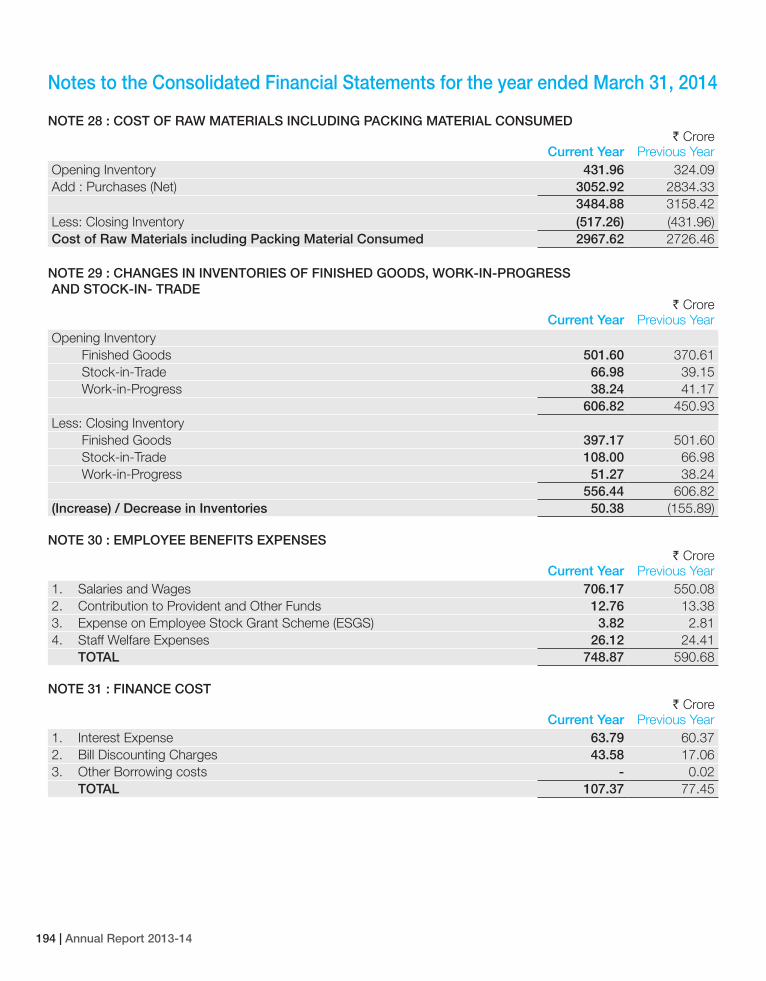
NOTE 28 : COST OF RAW MATERIALS INCLUDING PACKING MATERIAL CONSUMED` Crore
Current Year Previous Year Opening Inventory 431.96 324.09Add : Purchases (Net) 3052.92 2834.33
3484.88 3158.42Less: Closing Inventory (517.26) (431.96)Cost of Raw Materials including Packing Material Consumed 2967.62 2726.46
NOTE 29 : CHANGES IN INVENTORIES OF FINISHED GOODS, WORK-IN-PROGRESS AND STOCK-IN- TRADE
` Crore Current Year Previous Year
Opening Inventory Finished Goods 501.60 370.61 Stock-in-Trade 66.98 39.15 Work-in-Progress 38.24 41.17
606.82 450.93Less: Closing Inventory Finished Goods 397.17 501.60 Stock-in-Trade 108.00 66.98 Work-in-Progress 51.27 38.24
556.44 606.82(Increase) / Decrease in Inventories 50.38 (155.89)
NOTE 30 : EMPLOYEE BENEFITS EXPENSES` Crore
Current Year Previous Year 1. Salaries and Wages 706.17 550.082. Contribution to Provident and Other Funds 12.76 13.383. Expense on Employee Stock Grant Scheme (ESGS) 3.82 2.814. Staff Welfare Expenses 26.12 24.41
TOTAL 748.87 590.68
NOTE 31 : FINANCE COST` Crore
Current Year Previous Year 1. Interest Expense 63.79 60.372. Bill Discounting Charges 43.58 17.063. Other Borrowing costs - 0.02
TOTAL 107.37 77.45
Godrej Consumer Products Limited 195
Notes to the Consolidated Financial Statements for the year ended March 31, 2014
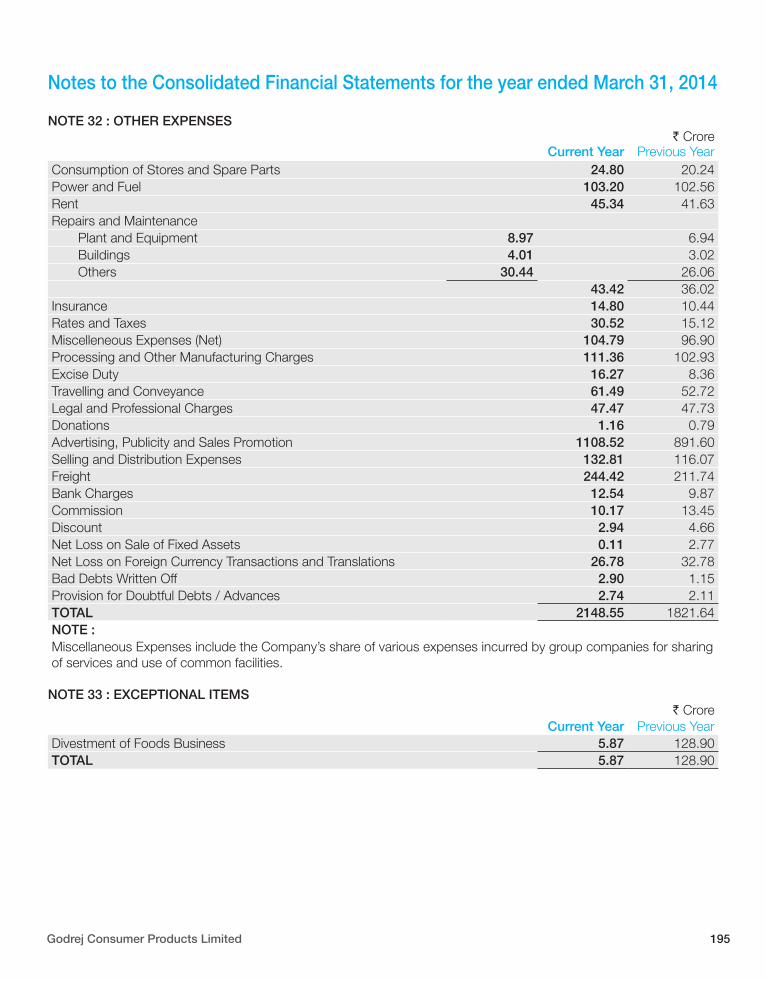
NOTE 32 : OTHER EXPENSES` Crore
Current Year Previous Year Consumption of Stores and Spare Parts 24.80 20.24 Power and Fuel 103.20 102.56 Rent 45.34 41.63 Repairs and Maintenance Plant and Equipment 8.97 6.94 Buildings 4.01 3.02 Others 30.44 26.06
43.42 36.02 Insurance 14.80 10.44 Rates and Taxes 30.52 15.12 Miscelleneous Expenses (Net) 104.79 96.90 Processing and Other Manufacturing Charges 111.36 102.93 Excise Duty 16.27 8.36 Travelling and Conveyance 61.49 52.72 Legal and Professional Charges 47.47 47.73 Donations 1.16 0.79 Advertising, Publicity and Sales Promotion 1108.52 891.60Selling and Distribution Expenses 132.81 116.07 Freight 244.42 211.74 Bank Charges 12.54 9.87 Commission 10.17 13.45 Discount 2.94 4.66 Net Loss on Sale of Fixed Assets 0.11 2.77 Net Loss on Foreign Currency Transactions and Translations 26.78 32.78 Bad Debts Written Off 2.90 1.15 Provision for Doubtful Debts / Advances 2.74 2.11 TOTAL 2148.55 1821.64NOTE :Miscellaneous Expenses include the Company’s share of various expenses incurred by group companies for sharing of services and use of common facilities.
NOTE 33 : EXCEPTIONAL ITEMS` Crore
Current Year Previous Year Divestment of Foods Business 5.87 128.90TOTAL 5.87 128.90
196 | Annual Report 2013-14
Notes to the Consolidated Financial Statements for the year ended March 31, 2014
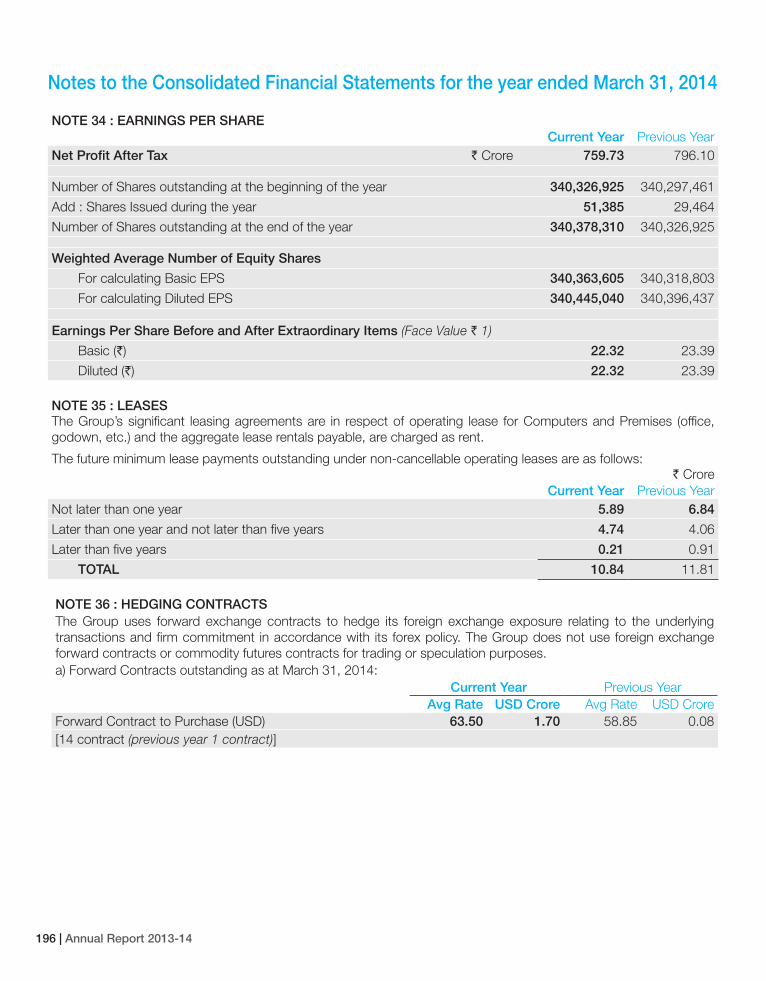
NOTE 34 : EARNINGS PER SHARE Current Year Previous Year
Net Profit After Tax ` Crore 759.73 796.10
Number of Shares outstanding at the beginning of the year 340,326,925 340,297,461
Add : Shares Issued during the year 51,385 29,464
Number of Shares outstanding at the end of the year 340,378,310 340,326,925
Weighted Average Number of Equity Shares
For calculating Basic EPS 340,363,605 340,318,803
For calculating Diluted EPS 340,445,040 340,396,437
Earnings Per Share Before and After Extraordinary Items (Face Value ` 1)
Basic (`) 22.32 23.39
Diluted (`) 22.32 23.39
NOTE 35 : LEASESThe Group’s significant leasing agreements are in respect of operating lease for Computers and Premises (office, godown, etc.) and the aggregate lease rentals payable, are charged as rent.
The future minimum lease payments outstanding under non-cancellable operating leases are as follows:` Crore
Current Year Previous Year Not later than one year 5.89 6.84
Later than one year and not later than five years 4.74 4.06
Later than five years 0.21 0.91
TOTAL 10.84 11.81
NOTE 36 : HEDGING CONTRACTSThe Group uses forward exchange contracts to hedge its foreign exchange exposure relating to the underlying transactions and firm commitment in accordance with its forex policy. The Group does not use foreign exchange forward contracts or commodity futures contracts for trading or speculation purposes.a) Forward Contracts outstanding as at March 31, 2014:
Current Year Previous Year Avg Rate USD Crore Avg Rate USD Crore
Forward Contract to Purchase (USD) 63.50 1.70 58.85 0.08[14 contract (previous year 1 contract)]
Godrej Consumer Products Limited 197
Notes to the Consolidated Financial Statements for the year ended March 31, 2014
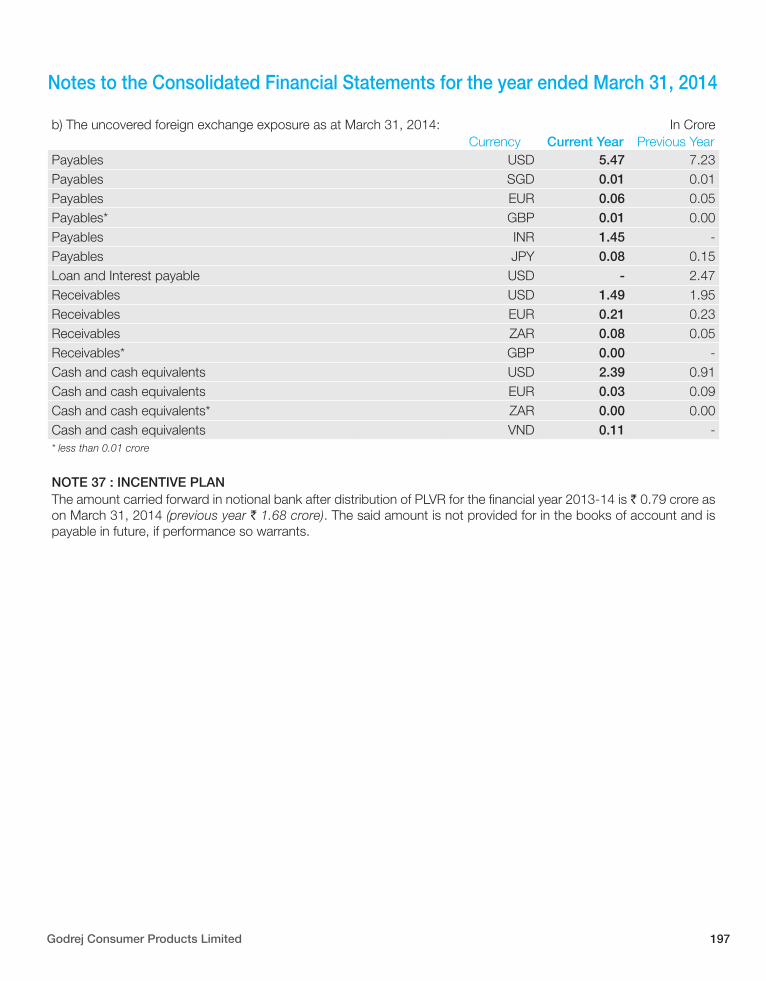
b) The uncovered foreign exchange exposure as at March 31, 2014: In Crore Currency Current Year Previous Year
Payables USD 5.47 7.23Payables SGD 0.01 0.01Payables EUR 0.06 0.05Payables* GBP 0.01 0.00Payables INR 1.45 - Payables JPY 0.08 0.15Loan and Interest payable USD - 2.47Receivables USD 1.49 1.95Receivables EUR 0.21 0.23Receivables ZAR 0.08 0.05Receivables* GBP 0.00 - Cash and cash equivalents USD 2.39 0.91Cash and cash equivalents EUR 0.03 0.09Cash and cash equivalents* ZAR 0.00 0.00Cash and cash equivalents VND 0.11 - * less than 0.01 crore
NOTE 37 : INCENTIVE PLANThe amount carried forward in notional bank after distribution of PLVR for the financial year 2013-14 is ` 0.79 crore as on March 31, 2014 (previous year ` 1.68 crore). The said amount is not provided for in the books of account and is payable in future, if performance so warrants.
198 | Annual Report 2013-14
Notes to the Consolidated Financial Statements for the year ended March 31, 2014
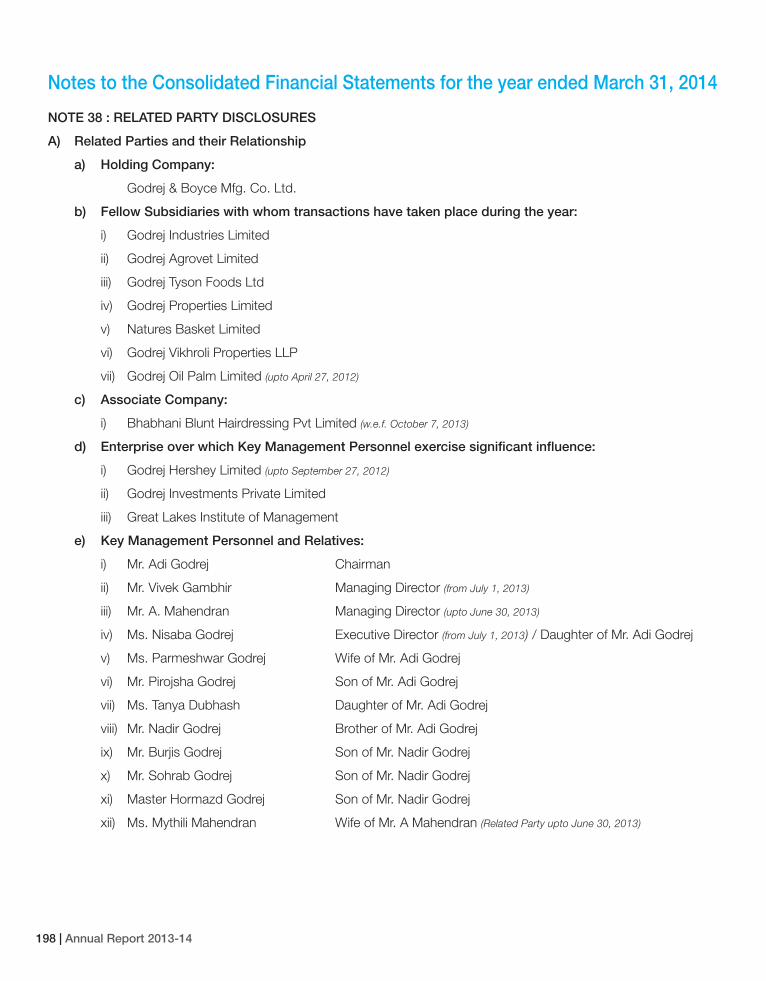
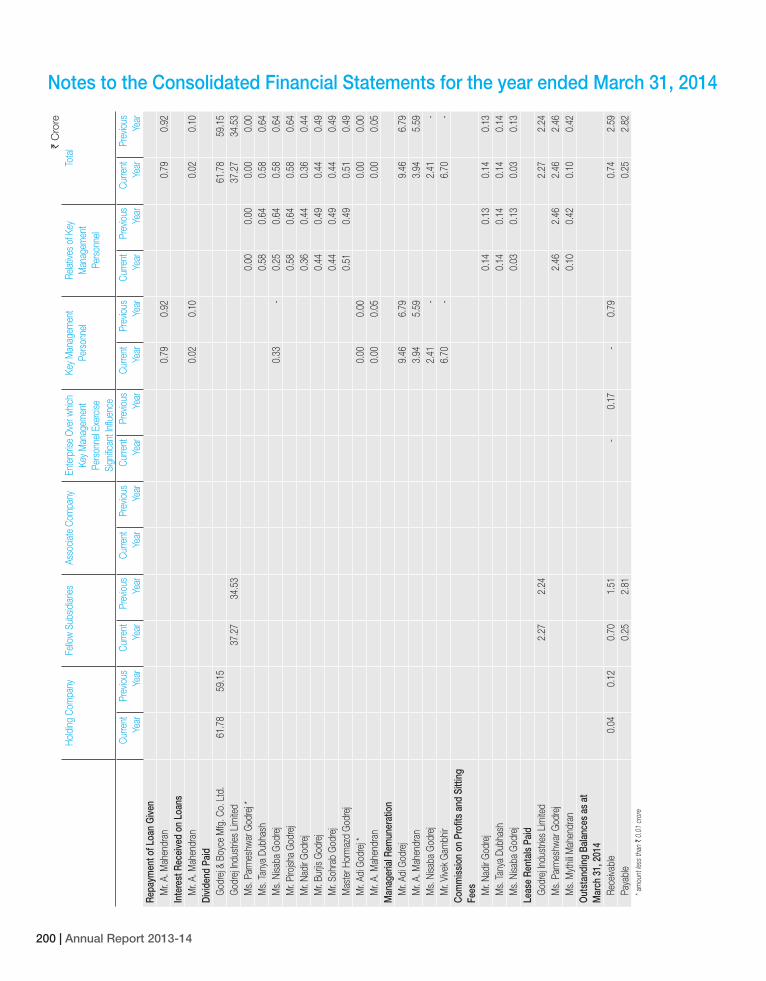
NOTE 38 : RELATED PARTY DISCLOSURES
A) Related Parties and their Relationship
a) Holding Company:
Godrej & Boyce Mfg. Co. Ltd.
b) Fellow Subsidiaries with whom transactions have taken place during the year:
i) Godrej Industries Limited
ii) Godrej Agrovet Limited
iii) Godrej Tyson Foods Ltd
iv) Godrej Properties Limited
v) Natures Basket Limited
vi) Godrej Vikhroli Properties LLP
vii) Godrej Oil Palm Limited (upto April 27, 2012)
c) Associate Company:
i) Bhabhani Blunt Hairdressing Pvt Limited (w.e.f. October 7, 2013)
d) Enterprise over which Key Management Personnel exercise significant influence:
i) Godrej Hershey Limited (upto September 27, 2012)
ii) Godrej Investments Private Limited
iii) Great Lakes Institute of Management
e) Key Management Personnel and Relatives:
i) Mr. Adi Godrej Chairman
ii) Mr. Vivek Gambhir Managing Director (from July 1, 2013)
iii) Mr. A. Mahendran Managing Director (upto June 30, 2013)
iv) Ms. Nisaba Godrej Executive Director (from July 1, 2013) / Daughter of Mr. Adi Godrej
v) Ms. Parmeshwar Godrej Wife of Mr. Adi Godrej
vi) Mr. Pirojsha Godrej Son of Mr. Adi Godrej
vii) Ms. Tanya Dubhash Daughter of Mr. Adi Godrej
viii) Mr. Nadir Godrej Brother of Mr. Adi Godrej
ix) Mr. Burjis Godrej Son of Mr. Nadir Godrej
x) Mr. Sohrab Godrej Son of Mr. Nadir Godrej
xi) Master Hormazd Godrej Son of Mr. Nadir Godrej
xii) Ms. Mythili Mahendran Wife of Mr. A Mahendran (Related Party upto June 30, 2013)
Godrej Consumer Products Limited 199
Notes to the Consolidated Financial Statements for the year ended March 31, 2014`
Cro
reHo
lding
Com
pany
Fello
w S
ubsid
iaries
Asso
ciate
Com
pany
Ente
rpris
e O
ver w
hich
Key
Man
agem
ent
Pers
onne
l Exe
rcise
Si
gnific
ant I
nflue
nce
Key
Man
agem
ent
Pers
onne
lRe
lative
s of
Key
M
anag
emen
t Pe
rson
nel
Tota
l
Curre
nt
Year
Prev
ious
Ye
arCu
rrent
Ye
arPr
evio
us
Year
Curre
nt
Year
Prev
ious
Ye
arCu
rrent
Ye
arPr
evio
us
Year
Curre
nt
Year
Prev
ious
Ye
arCu
rrent
Ye
arPr
evio
us
Year
Curre
nt
Year
Prev
ious
Ye
arSa
le o
f Goo
dsG
odre
j & B
oyce
Mfg
. Co.
Ltd
.0.
610.
510.
610.
51G
odre
j Indu
strie
s Lim
ited
28.2
715
.76
28.2
715
.76
God
rej P
rope
rties
Lim
ited
0.01
0.03
0.01
0.03
God
rej A
grov
et L
imite
d0.
400.
210.
400.
21G
odre
j Tys
on F
oods
Ltd
*0.
000.
000.
000.
00Pu
rcha
se o
f Mat
eria
ls a
nd S
pare
sG
odre
j & B
oyce
Mfg
. Co.
Ltd
.2.
843.
062.
843.
06G
odre
j Indu
strie
s Lim
ited
31.7
728
.77
31.7
728
.77
God
rej O
il Palm
Lim
ited
- 0.
03 -
0.03
God
rej A
grov
et L
imite
d1.
051.
171.
051.
17G
odre
j Pro
perti
es L
imite
d-
- -
- Na
ture
s Ba
sket
Lim
ited
0.00
- 0.
00 -
Purc
hase
of C
apita
l Ass
etG
odre
j & B
oyce
Mfg
. Co.
Ltd
.0.
321.
070.
321.
07G
odre
j Indu
strie
s Lim
ited
* -
0.00
- 0.
00G
odre
j Vikh
roli P
rope
rties
LLP
12.8
410
3.15
12.8
410
3.15
Adva
nce
Paid
God
rej &
Boy
ce M
fg. C
o. L
td.
2.02
0.09
2.02
0.09
God
rej P
rope
rties
Lim
ited
2.53
- 2.
53 -
Esta
blis
hmen
t and
Oth
er E
xpen
ses
Paid
/ (R
eceiv
ed)
God
rej &
Boy
ce M
fg. C
o. L
td.
0.38
1.56
0.38
1.56
God
rej In
dust
ries
Limite
d8.
4610
.47
8.46
10.4
7G
odre
j Agr
ovet
Lim
ited
0.72
0.56
0.72
0.56
God
rej P
rope
rties
Lim
ited
(0.0
2) (0
.51)
(0.0
2) (0
.51)
Natu
res
Bask
et L
imite
d (0
.10)
(0.0
8) (0
.10)
(0.0
8)G
odre
j Tys
on F
oods
Ltd
* (0
.15)
(0.1
1) (0
.15)
(0.1
1)M
r. Ad
i God
rej
- 0.
06 -
0.06
Mr.
A. M
ahen
dran
- 0.
04 -
0.04
Gre
at L
akes
Inst
itute
of
Man
agem
ent
- 0.
01 -
0.01
God
rej H
ersh
ey L
imite
d -
(0.0
4) -
(0.0
4)In
vest
men
ts M
ade
Bhab
hani
Blun
t Hair
dres
sing
Pvt
Limite
d34
.32
- 34
.32
- Se
curit
y De
posi
t Giv
en /
(Rep
aid)
God
rej H
ersh
ey L
td.
- (1
.50)
- (1
.50)
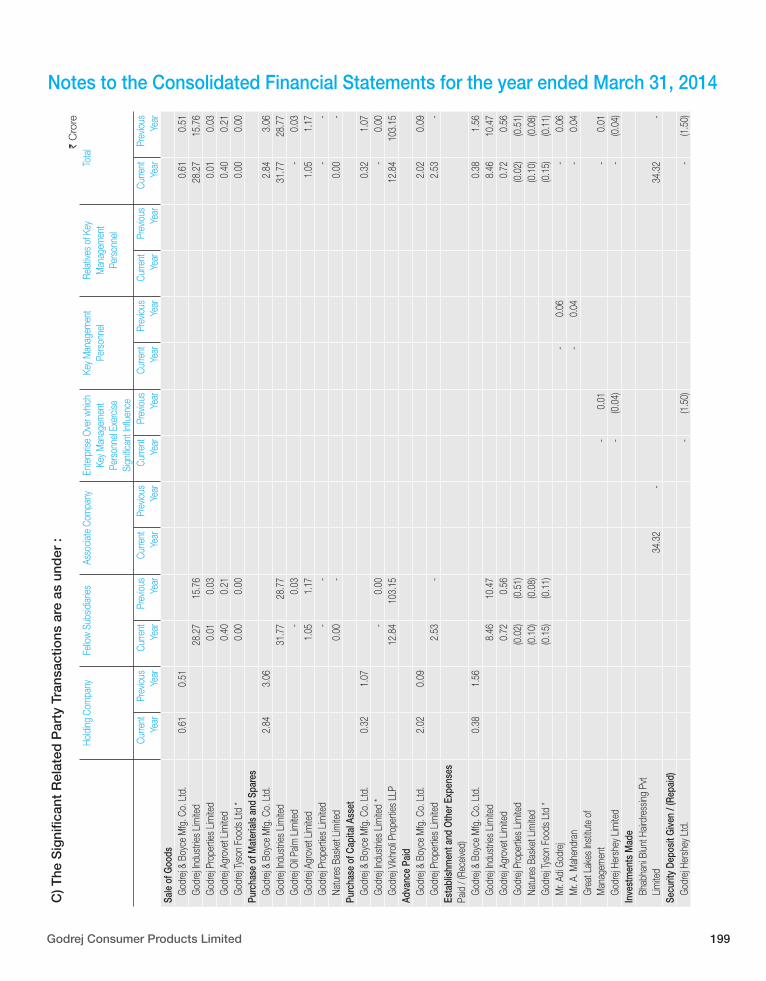
C) T
he S
igni
fican
t R
elat
ed P
arty
Tra
nsac
tions
are
as
und
er :
200 | Annual Report 2013-14
Notes to the Consolidated Financial Statements for the year ended March 31, 2014
` C
rore
Hold
ing C
ompa
nyFe
llow
Sub
sidiar
iesAs
socia
te C
ompa
nyEn
terp
rise
Ove
r whic
h Ke
y M
anag
emen
t Pe
rson
nel E
xerc
ise
Sign
ifican
t Infl
uenc
e
Key
Man
agem
ent
Pers
onne
lRe
lative
s of
Key
M
anag
emen
t Pe
rson
nel
Tota
l
Curre
nt
Year
Prev
ious
Ye
arCu
rrent
Ye
arPr
evio
us
Year
Curre
nt
Year
Prev
ious
Ye
arCu
rrent
Ye
arPr
evio
us
Year
Curre
nt
Year
Prev
ious
Ye
arCu
rrent
Ye
arPr
evio
us
Year
Curre
nt
Year
Prev
ious
Ye
arRe
paym
ent o
f Loa
n G
iven
Mr.
A. M
ahen
dran
0.79
0.92
0.79
0.92
Inte
rest
Rec
eive
d on
Loa
nsM
r. A.
Mah
endr
an0.
020.
100.
020.
10Di
vide
nd P
aid
God
rej &
Boy
ce M
fg. C
o. L
td.
61.7
859
.15
61.7
859
.15
God
rej In
dust
ries
Limite
d37
.27
34.5
337
.27
34.5
3M
s. P
arm
eshw
ar G
odre
j *0.
000.
000.
000.
00M
s. Ta
nya
Dubh
ash
0.58
0.64
0.58
0.64
Ms.
Nisa
ba G
odre
j0.
33 -
0.25
0.64
0.58
0.64
Mr.
Piro
jsha
God
rej
0.58
0.64
0.58
0.64
Mr.
Nadi
r God
rej
0.36
0.44
0.36
0.44
Mr.
Burjis
God
rej
0.44
0.49
0.44
0.49
Mr.
Sohr
ab G
odre
j0.
440.
490.
440.
49M
aste
r Hor
maz
d G
odre
j0.
510.
490.
510.
49M
r. Ad
i God
rej *
0.00
0.00
0.00
0.00
Mr.
A. M
ahen
dran
0.00
0.05
0.00
0.05
Man
ager
ial R
emun
erat
ion
Mr.
Adi G
odre
j9.
466.
799.
466.
79M
r. A.
Mah
endr
an3.
945.
593.
945.
59M
s. N
isaba
God
rej
2.41
- 2.
41 -
Mr.
Vive
k G
ambh
ir6.
70 -
6.70
- Co
mm
issi
on o
n Pr
ofits
and
Sitt
ing
Fees M
r. Na
dir G
odre
j0.
140.
130.
140.
13M
s. Ta
nya
Dubh
ash
0.14
0.14
0.14
0.14
Ms.
Nisa
ba G
odre
j0.
030.
130.
030.
13Le
ase
Rent
als
Paid
God
rej In
dust
ries
Limite
d2.
272.
242.
272.
24M
s. P
arm
eshw
ar G
odre
j2.
462.
462.
462.
46M
s. M
ythil
i Mah
endr
an0.
100.
420.
100.
42O
utst
andi
ng B
alan
ces
as a
t M
arch
31,
201
4Re
ceiva
ble
0.04
0.12
0.70
1.51
- 0.
17 -
0.79
0.74
2.59
Paya
ble
0.25
2.81
0.25
2.82
* am
ount
less
than
` 0
.01
cror
e
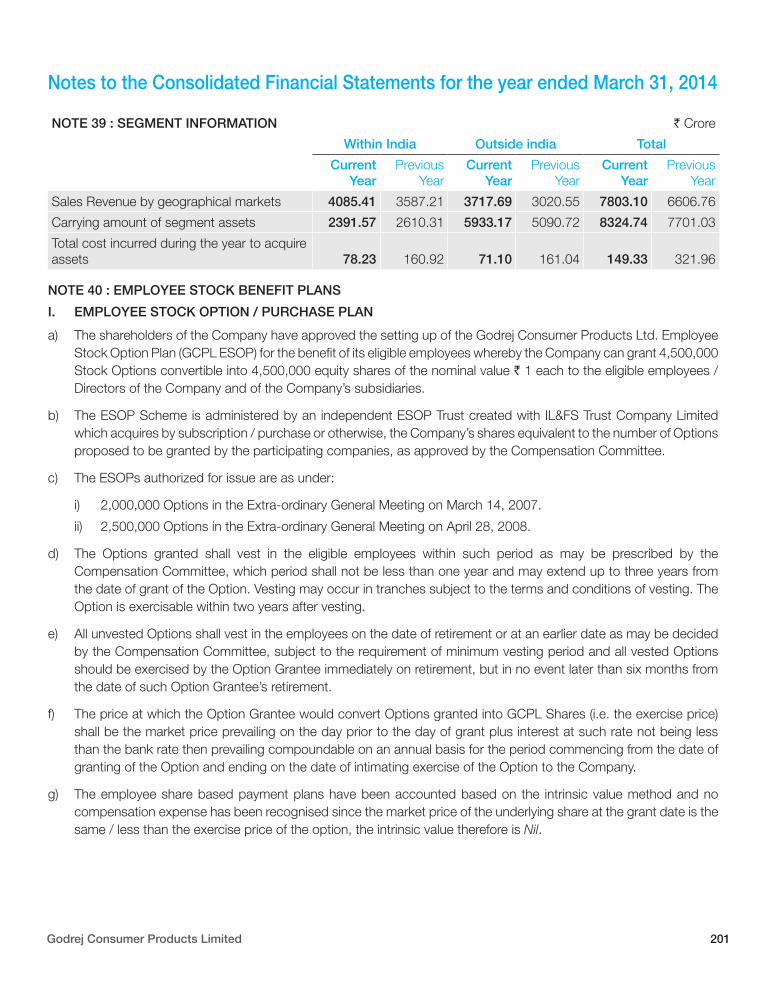
Godrej Consumer Products Limited 201
Notes to the Consolidated Financial Statements for the year ended March 31, 2014
NOTE 39 : SEGMENT INFORMATION ` Crore
Within India Outside india Total
Current Year
Previous Year
Current Year
Previous Year
Current Year
Previous Year
Sales Revenue by geographical markets 4085.41 3587.21 3717.69 3020.55 7803.10 6606.76
Carrying amount of segment assets 2391.57 2610.31 5933.17 5090.72 8324.74 7701.03
Total cost incurred during the year to acquire assets 78.23 160.92 71.10 161.04 149.33 321.96
NOTE 40 : EMPLOYEE STOCK BENEFIT PLANS
I. EMPLOYEE STOCK OPTION / PURCHASE PLAN
a) The shareholders of the Company have approved the setting up of the Godrej Consumer Products Ltd. Employee Stock Option Plan (GCPL ESOP) for the benefit of its eligible employees whereby the Company can grant 4,500,000 Stock Options convertible into 4,500,000 equity shares of the nominal value ` 1 each to the eligible employees / Directors of the Company and of the Company’s subsidiaries.
b) The ESOP Scheme is administered by an independent ESOP Trust created with IL&FS Trust Company Limited which acquires by subscription / purchase or otherwise, the Company’s shares equivalent to the number of Options proposed to be granted by the participating companies, as approved by the Compensation Committee.
c) The ESOPs authorized for issue are as under:
i) 2,000,000 Options in the Extra-ordinary General Meeting on March 14, 2007.
ii) 2,500,000 Options in the Extra-ordinary General Meeting on April 28, 2008.
d) The Options granted shall vest in the eligible employees within such period as may be prescribed by the Compensation Committee, which period shall not be less than one year and may extend up to three years from the date of grant of the Option. Vesting may occur in tranches subject to the terms and conditions of vesting. The Option is exercisable within two years after vesting.
e) All unvested Options shall vest in the employees on the date of retirement or at an earlier date as may be decided by the Compensation Committee, subject to the requirement of minimum vesting period and all vested Options should be exercised by the Option Grantee immediately on retirement, but in no event later than six months from the date of such Option Grantee’s retirement.
f) The price at which the Option Grantee would convert Options granted into GCPL Shares (i.e. the exercise price) shall be the market price prevailing on the day prior to the day of grant plus interest at such rate not being less than the bank rate then prevailing compoundable on an annual basis for the period commencing from the date of granting of the Option and ending on the date of intimating exercise of the Option to the Company.
g) The employee share based payment plans have been accounted based on the intrinsic value method and no compensation expense has been recognised since the market price of the underlying share at the grant date is the same / less than the exercise price of the option, the intrinsic value therefore is Nil.
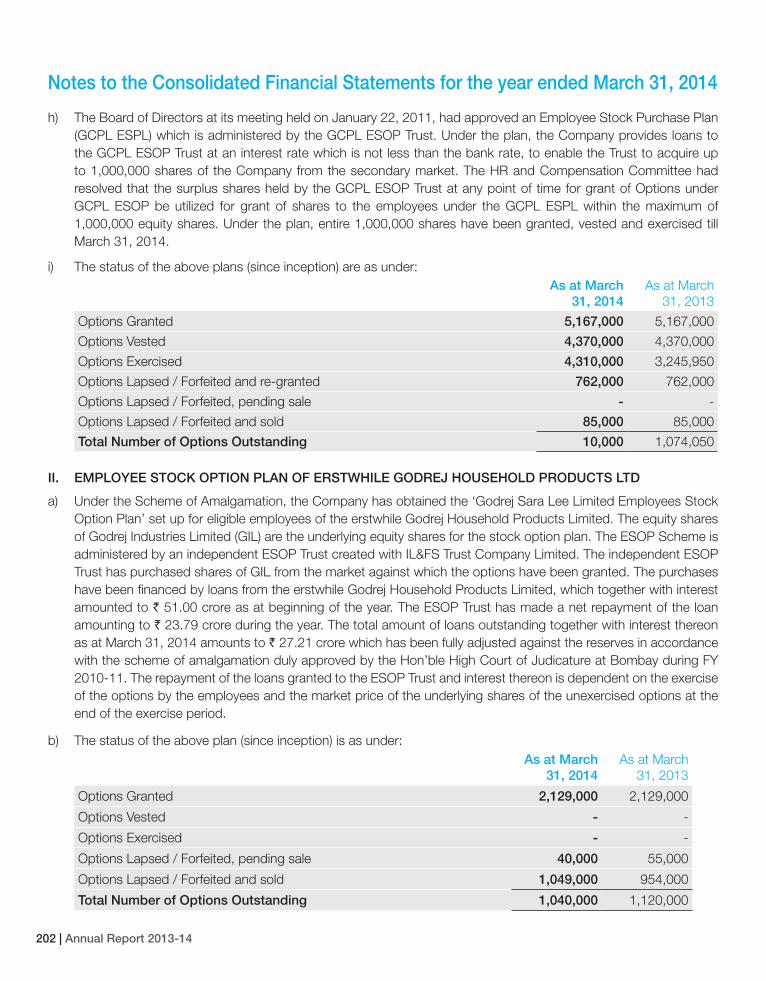
202 | Annual Report 2013-14
h) The Board of Directors at its meeting held on January 22, 2011, had approved an Employee Stock Purchase Plan (GCPL ESPL) which is administered by the GCPL ESOP Trust. Under the plan, the Company provides loans to the GCPL ESOP Trust at an interest rate which is not less than the bank rate, to enable the Trust to acquire up to 1,000,000 shares of the Company from the secondary market. The HR and Compensation Committee had resolved that the surplus shares held by the GCPL ESOP Trust at any point of time for grant of Options under GCPL ESOP be utilized for grant of shares to the employees under the GCPL ESPL within the maximum of 1,000,000 equity shares. Under the plan, entire 1,000,000 shares have been granted, vested and exercised till March 31, 2014.
i) The status of the above plans (since inception) are as under: As at March
31, 2014As at March
31, 2013
Options Granted 5,167,000 5,167,000
Options Vested 4,370,000 4,370,000
Options Exercised 4,310,000 3,245,950
Options Lapsed / Forfeited and re-granted 762,000 762,000
Options Lapsed / Forfeited, pending sale - -
Options Lapsed / Forfeited and sold 85,000 85,000
Total Number of Options Outstanding 10,000 1,074,050
II. EMPLOYEE STOCK OPTION PLAN OF ERSTWHILE GODREJ HOUSEHOLD PRODUCTS LTD
a) Under the Scheme of Amalgamation, the Company has obtained the ‘Godrej Sara Lee Limited Employees Stock Option Plan’ set up for eligible employees of the erstwhile Godrej Household Products Limited. The equity shares of Godrej Industries Limited (GIL) are the underlying equity shares for the stock option plan. The ESOP Scheme is administered by an independent ESOP Trust created with IL&FS Trust Company Limited. The independent ESOP Trust has purchased shares of GIL from the market against which the options have been granted. The purchases have been financed by loans from the erstwhile Godrej Household Products Limited, which together with interest amounted to ` 51.00 crore as at beginning of the year. The ESOP Trust has made a net repayment of the loan amounting to ` 23.79 crore during the year. The total amount of loans outstanding together with interest thereon as at March 31, 2014 amounts to ` 27.21 crore which has been fully adjusted against the reserves in accordance with the scheme of amalgamation duly approved by the Hon’ble High Court of Judicature at Bombay during FY 2010-11. The repayment of the loans granted to the ESOP Trust and interest thereon is dependent on the exercise of the options by the employees and the market price of the underlying shares of the unexercised options at the end of the exercise period.
b) The status of the above plan (since inception) is as under: As at March
31, 2014As at March
31, 2013
Options Granted 2,129,000 2,129,000
Options Vested - -
Options Exercised - -
Options Lapsed / Forfeited, pending sale 40,000 55,000
Options Lapsed / Forfeited and sold 1,049,000 954,000
Total Number of Options Outstanding 1,040,000 1,120,000
Notes to the Consolidated Financial Statements for the year ended March 31, 2014
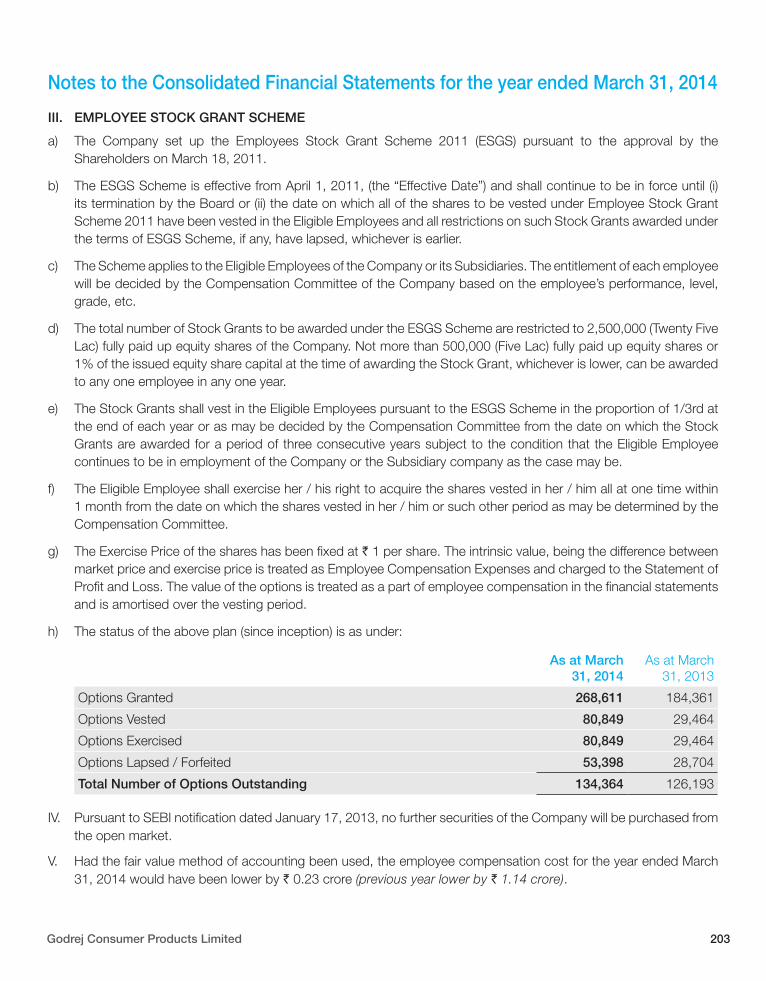
Godrej Consumer Products Limited 203
Notes to the Consolidated Financial Statements for the year ended March 31, 2014
III. EMPLOYEE STOCK GRANT SCHEME
a) The Company set up the Employees Stock Grant Scheme 2011 (ESGS) pursuant to the approval by the Shareholders on March 18, 2011.
b) The ESGS Scheme is effective from April 1, 2011, (the “Effective Date”) and shall continue to be in force until (i) its termination by the Board or (ii) the date on which all of the shares to be vested under Employee Stock Grant Scheme 2011 have been vested in the Eligible Employees and all restrictions on such Stock Grants awarded under the terms of ESGS Scheme, if any, have lapsed, whichever is earlier.
c) The Scheme applies to the Eligible Employees of the Company or its Subsidiaries. The entitlement of each employee will be decided by the Compensation Committee of the Company based on the employee’s performance, level, grade, etc.
d) The total number of Stock Grants to be awarded under the ESGS Scheme are restricted to 2,500,000 (Twenty Five Lac) fully paid up equity shares of the Company. Not more than 500,000 (Five Lac) fully paid up equity shares or 1% of the issued equity share capital at the time of awarding the Stock Grant, whichever is lower, can be awarded to any one employee in any one year.
e) The Stock Grants shall vest in the Eligible Employees pursuant to the ESGS Scheme in the proportion of 1/3rd at the end of each year or as may be decided by the Compensation Committee from the date on which the Stock Grants are awarded for a period of three consecutive years subject to the condition that the Eligible Employee continues to be in employment of the Company or the Subsidiary company as the case may be.
f) The Eligible Employee shall exercise her / his right to acquire the shares vested in her / him all at one time within 1 month from the date on which the shares vested in her / him or such other period as may be determined by the Compensation Committee.
g) The Exercise Price of the shares has been fixed at ` 1 per share. The intrinsic value, being the difference between market price and exercise price is treated as Employee Compensation Expenses and charged to the Statement of Profit and Loss. The value of the options is treated as a part of employee compensation in the financial statements and is amortised over the vesting period.
h) The status of the above plan (since inception) is as under:
As at March 31, 2014
As at March 31, 2013
Options Granted 268,611 184,361
Options Vested 80,849 29,464
Options Exercised 80,849 29,464
Options Lapsed / Forfeited 53,398 28,704
Total Number of Options Outstanding 134,364 126,193
IV. Pursuant to SEBI notification dated January 17, 2013, no further securities of the Company will be purchased from the open market.
V. Had the fair value method of accounting been used, the employee compensation cost for the year ended March 31, 2014 would have been lower by ` 0.23 crore (previous year lower by ` 1.14 crore).
204 | Annual Report 2013-14
Notes to the Consolidated Financial Statements for the year ended March 31, 2014
NOTE 41 : SCHEMES OF AMALGAMATION
a) Pursuant to a Scheme of Amalgamation (“the Scheme”), sanctioned by the Hon’ble High Court of Judicature at Bombay, vide its Order dated August 12, 2013, Godrej Hygiene Products Limited (GHPL) has been merged with Godrej Consumer Products Limited with effect from September 7, 2013. The appointed date as per the Scheme was April 1, 2013. The assets and liabilities of the erstwhile GHPL have been taken over at their book values which are also their fair values and the difference amounting to ` 3.92 crore including the expenses on amalgamation of ` 0.37 crore has been adjusted in General Reserve.
The assets amounting to ` 5.60 crore and liabilities amounting to ` 3.78 crore of the erstwhile GHPL have been acquired pursuant to the scheme.
b) Pursuant to a Scheme of Amalgamation sanctioned by a Dutch Court, Godrej Indonesia Netherlands Holding B.V. (GINBV) has been merged with Godrej Consumer Holdings (Netherlands) B.V. (GCHNBV) with effect from September 30, 2013. In accordance with the Scheme, for the purposes of preparation of the consolidated financial statements of GCHNBV, certain foreign exchange revaluation losses of the subsidiaries of GCHNBV and costs and expenses of amalgamation aggregating to USD 7.79 million (` 39.53 crore) were adjusted directly in the Reserves in the consolidated financial statements of GCHNBV.
NOTE 42 : GENERAL
a) Other information required by Schedule VI (Revised) to the Companies Act, 1956, has been given only to the extent applicable.
b) Figures for the previous year have been regrouped / restated wherever necessary to confirm to current year’s presentation.
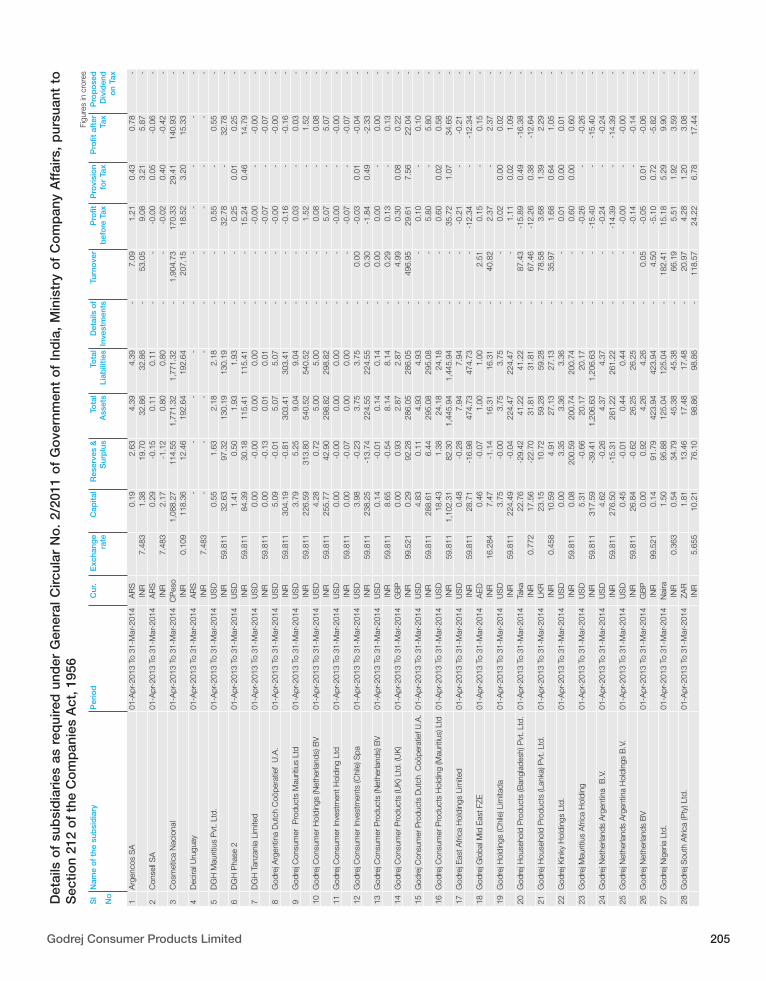
Godrej Consumer Products Limited 205
Det
ails
of
sub
sid
iari
es a
s re
qui
red
und
er G
ener
al C
ircul
ar N
o.
2/20
11 o
f G
ove
rnm
ent
of
Ind
ia,
Min
istr
y o
f C
om
pan
y A
ffai
rs,
pur
suan
t to
S
ectio
n 21
2 o
f th
e C
om
pan
ies
Act
, 195
6Fi
gure
s in
cro
res
Sl
No
Nam
e o
f th
e su
bsi
dia
ryP
erio
dC
ur.
Exc
hang
e ra
te
Cap
ital
Res
erve
s &
S
urp
lus
To
tal
Ass
ets
To
tal
Liab
ilitie
s D
etai
ls o
f In
vest
men
ts
Tur
nove
r P
rofit
b
efo
re T
ax
Pro
visi
on
for
Tax
Pro
fit a
fter
Ta
x
Pro
po
sed
D
ivid
end
o
n Ta
x 1
Arg
enco
s S
A01
-Apr
-201
3 To
31-
Mar
-201
4A
RS
0
.19
2.6
3 4
.39
4.3
9 -
7
.09
1.2
1 0
.43
0.7
8 -
IN
R 7
.483
1
.38
19.
70
32.
86
32.
86
-
53.
05
9.0
8 3
.21
5.8
7 -
2
Con
sell
SA
01-A
pr-2
013
To 3
1-M
ar-2
014
AR
S
0.2
9 -0
.15
0.1
1 0
.11
-
-
-0.0
0 0
.05
-0.0
6 -
IN
R 7
.483
2
.17
-1.1
2 0
.80
0.8
0 -
-
-0
.02
0.4
0 -0
.42
-
3C
osm
etic
a N
acio
nal
01-A
pr-2
013
To 3
1-M
ar-2
014
CP
eso
1
,088
.27
114
.55
1,7
71.3
2 1
,771
.32
-
1,9
04.7
3 1
70.3
3 2
9.41
1
40.9
3 -
IN
R 0
.109
1
18.3
6 1
2.46
1
92.6
4 1
92.6
4 -
2
07.1
5 1
8.52
3
.20
15.
33
-
4D
ecira
l Uru
guay
01-A
pr-2
013
To 3
1-M
ar-2
014
AR
S
-
-
-
-
-
-
-
-
-
-
INR
7.4
83
-
-
-
-
-
-
-
-
-
-
5D
GH
Mau
ritiu
s P
vt. L
td.
01-A
pr-2
013
To 3
1-M
ar-2
014
US
D
0.5
5 1
.63
2.1
8 2
.18
-
-
0.5
5 -
0
.55
-
INR
59.
811
32.
63
97.
32
130
.19
130
.19
-
-
32.
78
-
32.
78
-
6D
GH
Pha
se 2
01-A
pr-2
013
To 3
1-M
ar-2
014
US
D
1.4
1 0
.50
1.9
3 1
.93
-
-
0.2
5 0
.01
0.2
5 -
IN
R 5
9.81
1 84
.39
30.
18
115
.41
115
.41
-
-
15.
24
0.4
6 1
4.79
-
7
DG
H T
anza
nia
Lim
ited
01-A
pr-2
013
To 3
1-M
ar-2
014
US
D
0.0
0 -0
.00
0.0
0 0
.00
-
-
-0.0
0 -
-0
.00
-
INR
59.
811
0.0
0 -0
.13
0.0
1 0
.01
-
-
-0.0
7 -
-0
.07
-
8G
odre
j Arg
entin
a D
utch
Coö
pera
tief
U.A
.01
-Apr
-201
3 To
31-
Mar
-201
4U
SD
5
.09
-0.0
1 5
.07
5.0
7 -
-
-0
.00
-
-0.0
0 -
IN
R 5
9.81
1 3
04.1
9 -0
.81
303
.41
303
.41
-
-
-0.1
6 -
-0
.16
-
9G
odre
j Con
sum
er P
rodu
cts
Mau
ritiu
s Lt
d 01
-Apr
-201
3 To
31-
Mar
-201
4U
SD
3
.79
5.2
5 9
.04
9.0
4 -
-
0
.03
-
0.0
3 -
IN
R 5
9.81
1 2
26.5
9 3
13.8
0 5
40.5
2 5
40.5
2 -
-
1
.52
-
1.5
2 -
10
God
rej C
onsu
mer
Hol
ding
s (N
ethe
rland
s) B
V01
-Apr
-201
3 To
31-
Mar
-201
4U
SD
4
.28
0.7
2 5
.00
5.0
0 -
-
0
.08
-
0.0
8 -
IN
R 5
9.81
1 2
55.7
7 4
2.90
2
98.8
2 2
98.8
2 -
-
5
.07
-
5.0
7 -
11
God
rej C
onsu
mer
Inve
stm
ent H
oldi
ng L
td01
-Apr
-201
3 To
31-
Mar
-201
4U
SD
0
.00
-0.0
0 0
.00
0.0
0 -
-
-0
.00
-
-0.0
0 -
IN
R 5
9.81
1 0
.00
-0.0
7 0
.00
0.0
0 -
-
-0
.07
-
-0.0
7 -
12
God
rej C
onsu
mer
Inve
stm
ents
(Chi
le) S
pa01
-Apr
-201
3 To
31-
Mar
-201
4U
SD
3
.98
-0.2
3 3
.75
3.7
5 -
0
.00
-0.0
3 0
.01
-0.0
4 -
IN
R 5
9.81
1 2
38.2
5 -1
3.74
2
24.5
5 2
24.5
5 -
0
.30
-1.8
4 0
.49
-2.3
3 -
13
God
rej C
onsu
mer
Pro
duct
s (N
ethe
rland
s) B
V
01-A
pr-2
013
To 3
1-M
ar-2
014
US
D
0.1
4 -0
.01
0.1
4 0
.14
-
0.0
0 0
.00
-
0.0
0 -
IN
R 5
9.81
1 8
.65
-0.5
4 8
.14
8.1
4 -
0
.29
0.1
3 -
0
.13
-
14G
odre
j Con
sum
er P
rodu
cts
(UK
) Ltd
. (U
K)
01-A
pr-2
013
To 3
1-M
ar-2
014
GB
P
0.0
0 0
.93
2.8
7 2
.87
-
4.9
9 0
.30
0.0
8 0
.22
-
INR
99.
521
0.2
9 9
2.28
2
86.0
5 2
86.0
5 -
4
96.9
5 2
9.61
7
.56
22.
04
-
15G
odre
j Con
sum
er P
rodu
cts
Dut
ch C
oöpe
ratie
f U.A
. 01
-Apr
-201
3 To
31-
Mar
-201
4U
SD
4
.83
0.1
1 4
.93
4.9
3 -
-
0
.10
-
0.1
0 -
IN
R 5
9.81
1 2
88.6
1 6
.44
295
.08
295
.08
-
-
5.8
0 -
5
.80
-
16G
odre
j Con
sum
er P
rodu
cts
Hol
ding
(Mau
ritiu
s) L
td
01-A
pr-2
013
To 3
1-M
ar-2
014
US
D
18.
43
1.3
8 2
4.18
2
4.18
-
-
0
.60
0.0
2 0
.58
-
INR
59.
811
1,1
02.3
1 8
2.30
1
,445
.94
1,4
45.9
4 -
-
3
5.72
1
.07
34.
65
-
17G
odre
j Eas
t Afri
ca H
oldi
ngs
Lim
ited
01-A
pr-2
013
To 3
1-M
ar-2
014
US
D
0.4
8 -0
.28
7.9
4 7
.94
-
-
-0.2
1 -
-0
.21
-
INR
59.
811
28.
71
-16.
98
474
.73
474
.73
-
-
-12.
34
-
-12.
34
-
18G
odre
j Glo
bal M
id E
ast F
ZE01
-Apr
-201
3 To
31-
Mar
-201
4A
ED
0
.46
-0.0
7 1
.00
1.0
0 -
2
.51
0.1
5 -
0
.15
-
INR
16.
284
7.4
7 -1
.14
16.
31
16.
31
-
40.
82
2.3
7 -
2
.37
-
19G
odre
j Hol
ding
s (C
hile
) Lim
itada
01-A
pr-2
013
To 3
1-M
ar-2
014
US
D
3.7
5 -0
.00
3.7
5 3
.75
-
-
0.0
2 0
.00
0.0
2 -
IN
R 5
9.81
1 2
24.4
9 -0
.04
224
.47
224
.47
-
-
1.1
1 0
.02
1.0
9 -
20
God
rej H
ouse
hold
Pro
duct
s (B
angl
ades
h) P
vt. L
td.
01-A
pr-2
013
To 3
1-M
ar-2
014
Taka
2
2.76
-2
9.42
4
1.22
4
1.22
-
8
7.43
-1
5.89
0
.49
-16.
38
-
INR
0.7
72
17.
56
-22.
70
31.
81
31.
81
-
67.
46
-12.
26
0.3
8 -1
2.64
-
21
God
rej H
ouse
hold
Pro
duct
s (L
anka
) Pvt
. Ltd
.01
-Apr
-201
3 To
31-
Mar
-201
4LK
R
23.
15
10.
72
59.
28
59.
28
-
78.
58
3.6
8 1
.39
2.2
9 -
IN
R 0
.458
1
0.59
4
.91
27.
13
27.
13
-
35.
97
1.6
8 0
.64
1.0
5 -
22
God
rej K
inky
Hol
ding
s Lt
d.01
-Apr
-201
3 To
31-
Mar
-201
4U
SD
0
.00
3.3
5 3
.36
3.3
6 -
-
0
.01
0.0
0 0
.01
-
INR
59.
811
0.0
8 2
00.5
9 2
00.7
4 2
00.7
4 -
-
0
.60
0.0
0 0
.60
-
23G
odre
j Mau
ritiu
s A
frica
Hol
ding
01-A
pr-2
013
To 3
1-M
ar-2
014
US
D
5.3
1 -0
.66
20.
17
20.
17
-
-
-0.2
6 -
-0
.26
-
INR
59.
811
317
.59
-39.
41
1,2
06.6
3 1
,206
.63
-
-
-15.
40
-
-15.
40
-
24G
odre
j Net
herla
nds
Arg
entin
a B
.V.
01-A
pr-2
013
To 3
1-M
ar-2
014
US
D
4.6
2 -0
.26
4.3
7 4
.37
-
-
-0.2
4 -
-0
.24
-
INR
59.
811
276
.50
-15.
31
261
.22
261
.22
-
-
-14.
39
-
-14.
39
-
25G
odre
j Net
herla
nds
Arg
entin
a H
oldi
ngs
B.V
. 01
-Apr
-201
3 To
31-
Mar
-201
4U
SD
0
.45
-0.0
1 0
.44
0.4
4 -
-
-0
.00
-
-0.0
0 -
IN
R 5
9.81
1 2
6.84
-0
.62
26.
25
26.
25
-
-
-0.1
4 -
-0
.14
-
26G
odre
j Net
herla
nds
BV
01
-Apr
-201
3 To
31-
Mar
-201
4G
BP
0
.00
0.9
2 4
.26
4.2
6 -
0
.05
-0.0
5 0
.01
-0.0
6 -
IN
R 9
9.52
1 0
.14
91.
79
423
.94
423
.94
-
4.5
0 -5
.10
0.7
2 -5
.82
-
27G
odre
j Nig
eria
Ltd
.01
-Apr
-201
3 To
31-
Mar
-201
4N
aira
1
.50
95.
88
125
.04
125
.04
-
182
.41
15.
18
5.2
9 9
.90
-
INR
0.3
63
0.5
4 3
4.79
4
5.38
4
5.38
-
6
6.19
5
.51
1.9
2 3
.59
-
28G
odre
j Sou
th A
frica
(Pty
) Ltd
.01
-Apr
-201
3 To
31-
Mar
-201
4ZA
R
1.8
1 1
3.46
1
7.48
1
7.48
-
2
0.97
4
.28
1.2
0 3
.08
-
INR
5.6
55
10.
21
76.
10
98.
86
98.
86
-
118
.57
24.
22
6.7
8 1
7.44
-
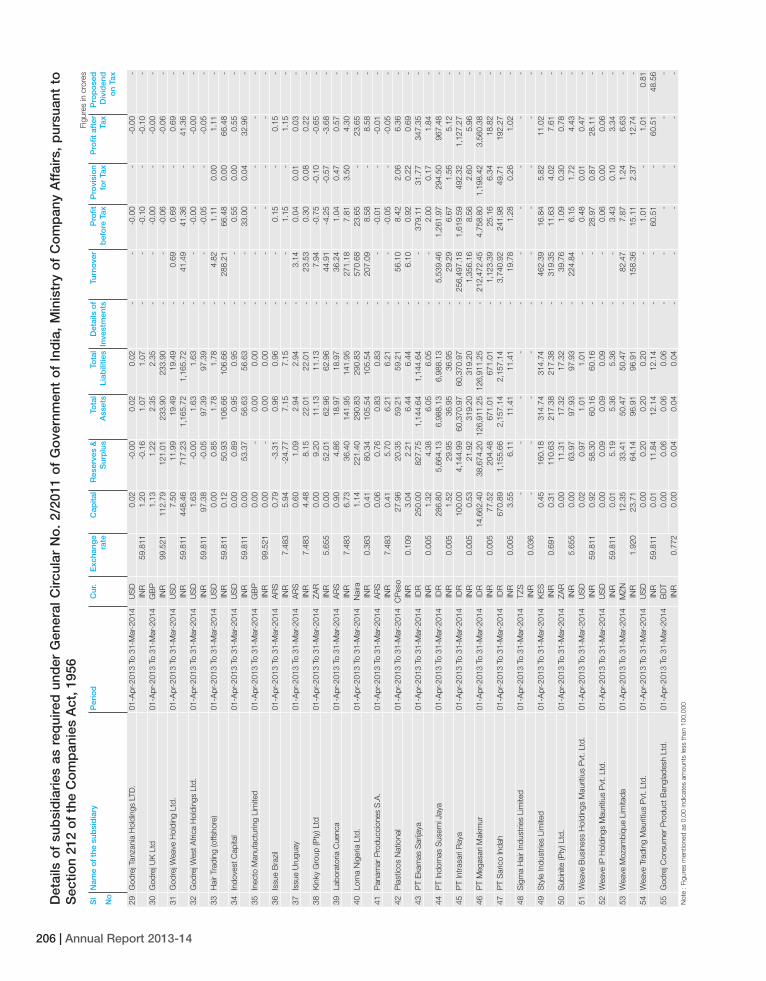
206 | Annual Report 2013-14
Det
ails
of
sub
sid
iari
es a
s re
qui
red
und
er G
ener
al C
ircul
ar N
o.
2/20
11 o
f G
ove
rnm
ent
of
Ind
ia,
Min
istr
y o
f C
om
pan
y A
ffai
rs,
pur
suan
t to
S
ectio
n 21
2 o
f th
e C
om
pan
ies
Act
, 195
6Fi
gure
s in
cro
res
Sl
No
Nam
e o
f th
e su
bsi
dia
ryP
erio
dC
ur.
Exc
hang
e ra
te
Cap
ital
Res
erve
s &
S
urp
lus
To
tal
Ass
ets
To
tal
Liab
ilitie
s D
etai
ls o
f In
vest
men
ts
Tur
nove
r P
rofit
b
efo
re T
ax
Pro
visi
on
for
Tax
Pro
fit a
fter
Ta
x
Pro
po
sed
D
ivid
end
o
n Ta
x 29
God
rej T
anza
nia
Hol
ding
s LT
D.
01-A
pr-2
013
To 3
1-M
ar-2
014
US
D
0.0
2 -0
.00
0.0
2 0
.02
-
-
-0.0
0 -
-0
.00
-
INR
59.
811
1.2
0 -0
.16
1.0
7 1
.07
-
-
-0.1
0 -
-0
.10
-
30G
odre
j UK
Ltd
01-A
pr-2
013
To 3
1-M
ar-2
014
GB
P
1
.13
1.2
2 2
.35
2.3
5 -
-
-
0.00
-
-
0.00
-
IN
R 9
9.52
1 1
12.7
9 1
21.0
1 2
33.9
0 2
33.9
0 -
-
-0
.06
-
-0.0
6 -
31
God
rej W
eave
Hol
ding
Ltd
.01
-Apr
-201
3 To
31-
Mar
-201
4U
SD
7
.50
11.
99
19.
49
19.
49
-
0.6
9 0
.69
-
0.6
9 -
IN
R 5
9.81
1 4
48.4
6 7
17.2
3 1
,165
.72
1,1
65.7
2 -
4
1.49
4
1.36
-
4
1.36
-
32
God
rej W
est A
frica
Hol
ding
s Lt
d.01
-Apr
-201
3 To
31-
Mar
-201
4U
SD
1
.63
-0.0
0 1
.63
1.6
3 -
-
-0
.00
-
-0.0
0 -
IN
R 5
9.81
1 9
7.38
-0
.05
97.
39
97.
39
-
-
-0.0
5 -
-0
.05
-
33H
air
Trad
ing
(offs
hore
) 01
-Apr
-201
3 To
31-
Mar
-201
4U
SD
0
.00
0.8
5 1
.78
1.7
8 -
4
.82
1.1
1 0
.00
1.1
1 -
IN
R 5
9.81
1 0
.12
50.
93
106
.66
106
.66
-
288
.21
66.
48
0.0
0 6
6.48
-
34
Indo
vest
Cap
ital
01-A
pr-2
013
To 3
1-M
ar-2
014
US
D
0.0
0 0
.89
0.9
5 0
.95
-
-
0.5
5 0
.00
0.5
5 -
IN
R 5
9.81
1 0
.00
53.
37
56.
63
56.
63
-
-
33.
00
0.0
4 3
2.96
-
35
Inec
to M
anuf
actu
ring
Lim
ited
01-A
pr-2
013
To 3
1-M
ar-2
014
GB
P
0.0
0 -
0
.00
0.0
0 -
-
-
-
-
-
IN
R 9
9.52
1 0
.00
-
0.0
0 0
.00
-
-
-
-
-
-
36Is
sue
Bra
zil
01-A
pr-2
013
To 3
1-M
ar-2
014
AR
S
0.7
9 -3
.31
0.9
6 0
.96
-
-
0.1
5 -
0
.15
-
INR
7.4
83
5.9
4 -2
4.77
7
.15
7.1
5 -
-
1
.15
-
1.1
5 -
37
Issu
e U
rugu
ay01
-Apr
-201
3 To
31-
Mar
-201
4A
RS
0
.60
1.0
9 2
.94
2.9
4 -
3
.14
0.0
4 0
.01
0.0
3 -
IN
R 7
.483
4
.48
8.1
5 2
2.01
2
2.01
-
2
3.53
0
.30
0.0
8 0
.22
-
38K
inky
Gro
up (P
ty) L
td
01-A
pr-2
013
To 3
1-M
ar-2
014
ZAR
0
.00
9.2
0 1
1.13
1
1.13
-
7
.94
-0.7
5 -0
.10
-0.6
5 -
IN
R 5
.655
0
.00
52.
01
62.
96
62.
96
-
44.
91
-4.2
5 -0
.57
-3.6
8 -
39
Labo
rato
ria C
uenc
a 01
-Apr
-201
3 To
31-
Mar
-201
4A
RS
0
.90
4.8
6 1
8.97
1
8.97
-
3
6.24
1
.04
0.4
7 0
.57
-
INR
7.4
83
6.7
3 3
6.40
1
41.9
5 1
41.9
5 -
2
71.1
8 7
.81
3.5
0 4
.30
-
40Lo
rna
Nig
eria
Ltd
.01
-Apr
-201
3 To
31-
Mar
-201
4N
aira
1
.14
221
.40
290
.83
290
.83
-
570
.68
23.
65
-
23.
65
-
INR
0.3
63
0.4
1 8
0.34
1
05.5
4 1
05.5
4 -
2
07.0
9 8
.58
-
8.5
8 -
41
Pan
amar
Pro
ducc
ione
s S
.A.
01-A
pr-2
013
To 3
1-M
ar-2
014
AR
S
0.0
6 0
.76
0.8
3 0
.83
-
-
-0.0
1 -
-0
.01
-
INR
7.4
83
0.4
1 5
.70
6.2
1 6
.21
-
-
-0.0
5 -
-0
.05
-
42P
last
icos
Nat
iona
l01
-Apr
-201
3 To
31-
Mar
-201
4C
Pes
o
27.
96
20.
35
59.
21
59.
21
-
56.
10
8.4
2 2
.06
6.3
6 -
IN
R 0
.109
3
.04
2.2
1 6
.44
6.4
4 -
6
.10
0.9
2 0
.22
0.6
9 -
43
PT
Eka
mas
Sar
ijaya
01
-Apr
-201
3 To
31-
Mar
-201
4ID
R
250
.00
827
.75
1,1
44.6
4 1
,144
.64
-
-
379
.11
31.
77
347
.35
-
INR
0.0
05
1.3
2 4
.38
6.0
5 6
.05
-
-
2.0
0 0
.17
1.8
4 -
44
PT
Indo
mas
Sus
emi J
aya
01-A
pr-2
013
To 3
1-M
ar-2
014
IDR
2
86.8
0 5
,664
.13
6,9
88.1
3 6
,988
.13
-
5,5
39.4
6 1
,261
.97
294
.50
967
.48
-
INR
0.0
05
1.5
2 2
9.95
3
6.95
3
6.95
-
2
9.29
6
.67
1.5
6 5
.12
-
45P
T In
tras
ari R
aya
01-A
pr-2
013
To 3
1-M
ar-2
014
IDR
1
00.0
0 4
,144
.99
60,
370.
97
60,
370.
97
-
256
,497
.18
1,6
19.5
9 4
92.3
2 1
,127
.27
-
INR
0.0
05
0.5
3 2
1.92
3
19.2
0 3
19.2
0 -
1
,356
.16
8.5
6 2
.60
5.9
6 -
46
PT
Meg
asar
i Mak
mur
01
-Apr
-201
3 To
31-
Mar
-201
4ID
R
14,
662.
40
38,
674.
20
126,
911.
25
126,
911.
25
-
212
,472
.45
4,7
58.8
0 1
,198
.42
3,5
60.3
8 -
IN
R 0
.005
7
7.52
2
04.4
8 6
71.0
1 6
71.0
1 -
1
,123
.39
25.
16
6.3
4 1
8.82
-
47
PT
Sar
ico
Inda
h 01
-Apr
-201
3 To
31-
Mar
-201
4ID
R
670
.89
1,1
55.6
6 2
,157
.14
2,1
57.1
4 -
3
,740
.92
241
.98
49.
71
192
.27
-
INR
0.0
05
3.5
5 6
.11
11.
41
11.
41
-
19.
78
1.2
8 0
.26
1.0
2 -
48
Sig
ma
Hai
r In
dust
ries
Lim
ited
01-A
pr-2
013
To 3
1-M
ar-2
014
TZS
-
-
-
-
-
-
-
-
-
-
IN
R 0
.036
-
-
-
-
-
-
-
-
-
-
49
Sty
le In
dust
ries
Lim
ited
01-A
pr-2
013
To 3
1-M
ar-2
014
KE
S
0.4
5 1
60.1
8 3
14.7
4 3
14.7
4 -
4
62.3
9 1
6.84
5
.82
11.
02
-
INR
0.6
91
0.3
1 1
10.6
3 2
17.3
8 2
17.3
8 -
3
19.3
5 1
1.63
4
.02
7.6
1 -
50
Sub
inite
(Pty
) Ltd
.01
-Apr
-201
3 To
31-
Mar
-201
4ZA
R
0.0
0 1
1.31
1
7.32
1
7.32
-
3
9.76
1
.09
0.3
0 0
.78
-
INR
5.6
55
0.0
0 6
3.97
9
7.93
9
7.93
-
2
24.8
4 6
.15
1.7
2 4
.43
-
51W
eave
Bus
ines
s H
oldi
ngs
Mau
ritiu
s P
vt. L
td.
01-A
pr-2
013
To 3
1-M
ar-2
014
US
D
0.0
2 0
.97
1.0
1 1
.01
-
-
0.4
8 0
.01
0.4
7 -
IN
R 5
9.81
1 0
.92
58.
30
60.
16
60.
16
-
-
28.
97
0.8
7 2
8.11
-
52
Wea
ve IP
Hol
ding
s M
aurit
ius
Pvt
. Ltd
.01
-Apr
-201
3 To
31-
Mar
-201
4U
SD
0
.00
0.0
9 0
.09
0.0
9 -
-
0
.06
0.0
0 0
.06
-
INR
59.
811
0.0
1 5
.19
5.3
6 5
.36
-
-
3.4
3 0
.10
3.3
4 -
53
Wea
ve M
ozam
biqu
e Li
mita
da01
-Apr
-201
3 To
31-
Mar
-201
4M
ZN
12.
35
33.
41
50.
47
50.
47
-
82.
47
7.8
7 1
.24
6.6
3 -
IN
R 1
.920
2
3.71
6
4.14
9
6.91
9
6.91
-
1
58.3
6 1
5.11
2
.37
12.
74
-
54W
eave
Tra
ding
Mau
ritiu
s P
vt. L
td.
01-A
pr-2
013
To 3
1-M
ar-2
014
US
D
0.0
0 0
.20
0.2
0 0
.20
-
-
1.0
1 -
1
.01
0.8
1 IN
R 5
9.81
1 0
.01
11.
84
12.
14
12.
14
-
-
60.
51
-
60.
51
48.
56
55G
odre
j Con
sum
er P
rodu
ct B
angl
ades
h Lt
d.01
-Apr
-201
3 To
31-
Mar
-201
4B
DT
0.00
0.06
0.06
0.06
--
--
--
INR
0.77
20.
000.
040.
040.
04-
--
--
-N
ote
: Fig
ures
men
tione
d as
0.0
0 in
dica
tes
amou
nts
less
than
100
,000

Notes

Notes