consolidated management report 2020
TRANSCRIPT

CONSOLIDATED MANAGEMENT REPORT2020_MAIN NON-FINANCIAL STATEMENTS

MAIN NON-FINANCIAL STATEMENTSMAIN NON-FINANCIAL STATEMENTS

3
MAIN NON-FINANCIAL STATEMENTS Helping society thrive Leading by example Building a greener futureMAIN NON-FINANCIAL STATEMENTS
INDEX
04
Helping society thrive
12
Leading by example
58
Building a greener future

MAIN NON-FINANCIAL STATEMENTS
4
MAIN NON-FINANCIAL STATEMENTS
Helping society thrive

5
MAIN NON-FINANCIAL STATEMENTS Helping society thrive Leading by example Building a greener futureMAIN NON-FINANCIAL STATEMENTS
Digital inclusion
Servicio Universal (millones de euros)
2019 2020Argentina1 42 39
Brazil2 98 70
Colombia3 48 40
Ecuador4 4 3
Spain5 16 8
Perú 15 13
Venezuela6 0.33 1
(1) Argentina: Updated 2018 value. The value reported for 2020 includes only contributions for the period January-November 2020. Annualised information is obtained on 15 February each year.
(2)�Brazil:� 2019:� FUST� R$287,293,932.60� (figure� in� reais)� and� FUNTTEL� R$143,646,960.45.� 2020:� FUST� R$272,159,651.65� and� FUNTTEL�R$136,079,828.11.
(3) Colombia: Includes payments derived from revenues from the provision of telecommunications services, plus the use of spectrum frequencies. Includes a recurring percentage agreed with the Ministry for Mobile Spectrum Renewal. The 2020 amount is composed of actual values paid from Q1 to Q3, plus an estimate for Q4.
(4) Ecuador: Payments correspond to 1% of FODETEL (payment made quarterly based on the previous quarter’s income). Includes payments for SMA, LDI,�Carrier�Service�and�VAS.�The�annual�value�includes�an�estimate�for�Q4�2020,�therefore,�the�final�value�may�be�adjusted.
(5)�Spain:�The�figure�in�the�table�indicates�only�the�value�estimated�by�the�Company�for�2020.�However,�the�official�reported�figure�for�2020�is�-€836,986.�The negative amount is due to regularisations and corrections of overprovisioning made in previous years.
(6) Venezuela: Does not include the payment for Q4 2020.
LTE Penetration
2019 2020 Year-on-year variationSpain 83.2 % 87.0 % 3.8 pp
United Kingdom 89.4 % 92.5 % 3.2 pp
Germany 77.8 % 90.5 % 12.7 pp
Brazil 66.6 % 75.8 % 9.2 pp
Argentina 79.6 % 83.6 % 4.1 pp
Peru 85.0 % 87.5 % 2.5 pp
Chile 84.0 % 87.6 % 3.6 pp
Colombia 67.8 % 73.6 % 5.8 pp
Mexico 64.6 % 68.2 % 3.6 pp
Total 75.5 % 82.1 % 6.6 pp
UBB accesses (thousands)2019 2020 Year-on-year variation
Spain 4,325 4,614 6.7 %
Germany 1,652 1,798 8.8 %
Brazil 5,023 5,084 1.2 %
HispAm 3,250 3,695 13.7 %
Total 14,281 15,213 6.5 %

6
MAIN NON-FINANCIAL STATEMENTS
Innovation
Key innovation indicators
2018 2019 2020
Investment in R&D and innovation (million euros) 6,114 5,602 4,626
Investment in R&D and innovation / revenue (%) 12.6% 11.6 % 10.74%
Investment in R&D (million euros) 947 866 959
Investment in R&D / revenue (%) 1.9% 1.8% 2.2%
Annual increase/decrease in investment in R&D (%) 9.9% (8.6 %) 10.7%
Industrial property rights portfolio 601 477 440
New patents registered 22 27 14
*These�figures�have�been�calculated�using�the�OECD�guidelines.�
New assets generated in 2020
Assets Scope
14 patents 10 European patents4 international PCT patents
1 industrial designEUIPO European Union Intellectual Prop-erty Office�
Investment in R&D by region
12%
Germany SpainBrazilUnited KingdomHispam33%
17%
11%
Key Open Innovation indicators
2020
Startups in portfolio/active in Open Innovation > 500
Startups working with Telefónica > 130
Countries in which Open Innovation is present 12
Wayra Hubs� 7
Open Future spaces 35
Telefónica Ventures (centres) 8
Startups invested in by Wayra > 770
Startups invested in directly by Telefónica Ventures >25
Direct investment in startups in 2020 (million euros) 11,4
Startups invested in through other funds by Telefónica Ventures > 120
Third-party investment in startups (million euros) 1,900
27%

7
MAIN NON-FINANCIAL STATEMENTS Helping society thrive Leading by example Building a greener future
Contribution to communities: impacts and SDGs
SDG 8 - Drive digitisation for a more sustainable society and economy
Contribution to SDG 8
Target Indicator 2020
8.1
Telefónica’s impact on GDP 44,691
Total tax contribution (million euros) 8,160
8.3.
% purchases from local suppliers 77%
Third-party investment in startups (million euros) 1,900
Startups invested in by Wayra > 770
8.5.
Total number of employees 112,349
Indirect employment generated (employees) 637,990
Employees with disabilities 1,118
8.6.
People trained in employability 996,875
8.8.
Supplier audits 16,105
Suppliers with improvement plans 560
SDG 9 - Build inclusive and sustainable connectivity
Contribution to SDG 9
Target Indicator 2020
9.1
Investment in infrastructure and applied services (total investment of the Telefónica Group (million euros)
5,861
Pre-paid penetration 49.4%
Universal Service 174
9.5
R&D investment (million euros) 959
Industrial property rights portfolio (includes patents) 440
9.c
Number of people connected via the Internet�for�All�project 1,800,000
4G/LTE mobile coverage 82.5%
UBB - Ultra Broad-band (passed units) 134,769,000

8
MAIN NON-FINANCIAL STATEMENTS
SDG�7�-�Develop�the�most�efficient�telecommunications network powered by renewable energies
Contribution to SDG 7
Target KPI 2020
7.2
Renewable electricity consumption (MWh) 4,918,373
7.3
Emissions avoided thanks to renewable energy consumption (tCO2e)
911,070
SDG 4 - Address inequalities by investing in digital skills
Contribution to SDG 4
Target KPI 2020
4.2
Number�of�children�benefiting� from Profuturo programmes (million people)
16
Number of countries in which the Profuturo programme operates (*) 40
4.4
Students enrolled in Telefónica Educación Digital MOOCs >6 M
Beneficiaries�of�the�digital�skills�train-ing programme 2,321,189
Internal employee training hours 3,549,124
4.C
Number of Profuturo programme teachers > 400000
ScolarTIC teacher training programme (people registered) 34,001
SDG 11 - Develop solutions to optimise consumption, reduce emissions and improve mobility and safety for people and communities
Contribution to SDG 11
Target KPI 2020
11.6
Emissions avoided through Eco Smart services (million tCO2) 9.5
ODS 12 Promover la economía circular en el uso de equipos electrónicos, a través del eco-diseño, la reutilización y el reciclado
Contribution to SDG 12
Target KPI 2020
12.2
Electricity consumption + Self-generation (MWh) 6,548,152
Total energy consumption (MWh) 6,863,728
Generation of waste (tonnes) 46,912
12.5
Waste recycling (%) 98%
12.6
Responsible Design Indicator Integrated into T.España

9
MAIN NON-FINANCIAL STATEMENTS Helping society thrive Leading by example Building a greener future
SDG 5 - Promote gender equality and reduce gender gaps in wages and salaries
Contribution to SDG 5
Target KPI 2020
5.2
Cases of discrimination detected / measures taken 3/2
5.5
% Women on the Board of Directors 29.41
Women in management positions 27.4
% Women in the workforce 38
5.b
Programmes to promote STEM careers 27
SDG 16 - Enhancing trust through the ethical and responsible use of technology
Contribution to SDG 16
Target KPI 2020
16.5
% of employees who have taken the Responsible Business course 93%
16.10
Privacy of information SASB TC-TL-2020a
Information security SASB TC-TL - 230a
16.a
Corporate volunteering (people) 56,472
Beneficiaries�of�voluntary�activities 1,532,160
SDG 17 - Develop strong global partnerships for sustainable development
Contribution to SDG 17
Target KPI 2020
17.6
Number�of�fixed�broadband�subscribers 20,077,200
17.8
Penetración del servicio LTE en la base de clientes. 85.20%
SDG 13 - Combat climate change and improve resource efficiency�and�utilisation
Contribution to SDG 13
Target KPI 2020
13.2
Direct emissions (Scope 1) (tCO2) 212,682
Indirect emissions (based on market method) (Scope 2) (tCO2) 530,684
Other indirect emissions (Scope 3) (tCO2) 1,909,321

10
MAIN NON-FINANCIAL STATEMENTS
Contribuimos a las comunidades en las que estamos presentes
2020
Ingresos Grupo por país
(millones €)Empleados
Grupo por país
% de proveedores
locales
Inversión total realizada
en el país* (millones €)
Gastos salariales en el país
(millones €)
Impuestos soportados en
el país (millones €)
Alemania 7.532 7.926 76% 1.094 611 220
Brasil 7.422 34.432 96% 1.372 792 320
España 12.401 28.560 78% 1.408 1.748 802
Reino Unido 6.708 6.322 82% 913 459 301
Hispam* 7.922 34.687 90% 833 999 560
(*)�Hispam�incluye�Argentina,�Chile,�Colombia,�Ecuador,�México,�Uruguay,�Venezuela�y�Perú
Impact on GDP (main operations)
Million euros% of total im-
pactTotal impact 44,691
Direct impact 19,803 44.3%
Indirect impact 19,497 43.6%
Induced impact 5,392 12.1%
Definitions• Total impact: Total impact generated by our corporate activity and the
expenses and investments we make in the countries in which we operate.• Direct impact: Impact generated directly by our operations.• Indirect impact: Impact generated by the expenditure and investments
carried out throughout our supply chain. • Induced impact: Impact generated by the increase in consumption derived from the increase in work income generated by direct and indirect jobs.� � � � � � � � � � � ������������������������������
Million euros % of local GDP (*)
Germany 5,543 0.18%
Argentina 1,922 0.88%
Brazil 10,431 0.95%
Chile 1,953 0.93%
Colombia 1,285 0.59%
Spain 14,579 1.39%
Mexico 958 0.13%
Peru 1,759 1.11%
United Kingdom 6,262 0.29%
Impact on employment (main operations)
Impact on em-ploy-ment in the
main countries (numner of people)
% of total impact
Total impact (1) 957,314
Direct impact (2) 108,551 11.3%
Indirect impact (3) 637,990 66.4%
Induced impact (4) 210,773 22.3%
Definitions• Total impact: Total impact generated by our corporate activity and the
expenses and investments we make in the countries in which we operate.• Direct impact: Employees hired directly.• Indirect impact: Jobs generated in those companies and sectors that
receive our expenditure and investments and in their respective suppliers. • Induced impact: Jobs created in all economic sectors thanks to the eco-
nomic activity generated in an induced way in the market as a whole.
Impact on employment
(number of people)% total local employment
Germany 37,229 0.08%
Argentina 40,902 0.30%
Brazil 444,650 0.54%
Chile 39,098 0.49%
Colombia 65,458 0.31%
Spain 136,729 0.71%
Mexico 42,917 0.08%
Peru 96,375 0.98%
United Kingdom 53,956 0.17%

11
MAIN NON-FINANCIAL STATEMENTS Helping society thrive Leading by example Building a greener future
Tax contribution by country
Million euros
Contribution by country to con-
soli-dated Group profit before tax (1) 2019
Contribution by country to con-
soli-dated Group profit before tax (1) 2020
Total taxes paid 2 020
Total taxes collected 2020 Totals 2020
Germany 314 281 215 828 1,043
Argentina (894) (51) 148 408 556
Brazil 1,027 1,434 318 1,829 2,147
Central America 35 179 22 27 48
Chile 42 113 6 150 154
Colombia 38 66 103 120 222
Ecuador (22) 43 91 64 156
Spain 826 108 790 1,917 2,706
Mexico (707) (767) 169 84 253
Peru (180) (167) 52 155 207
United Kingdom 1,437 675 300 234 534
Uruguay 94 136 18 19 37
Venezuela 7 73 3 10 13
Other 231 215 67 16 83
TOTAL GROUP 2,248 2,338 2,301 5,859 8,160
Tax contribution by region
2020 2019
Million euros
Contribution by country to consolidated Group profit before taxes (1)
Tax on profits (2)
Contribution by country to consolidated Group profit before taxes (1)
Tax on profits (2)
Europe 2,577 310 1,064 365
Latam (*) (595) 270 880 383
Central America 35 8 179 27
Other 231 38 215 29
TOTAL GROUP 2,248 626 2,338 803
1)�Contribution�to�the�consolidated�pre-tax�result,�adjusted�for�the�allocation�to�the�year�of�coupons�relating�to�subordinated�perpetual�bonds.�The�Consolidated�Financial�Statements of the Telefónica Group are drawn up in accordance with the International Financial Reporting Standards (IFRS) as adopted by the European Union. The local accounting regulations applicable in each of the countries in which the Group is present may differ from the standards set by the IFRS.�The�table�above�groups�together�all�companies�of�the�Group�according�to�the�country�of�their�registered�office.�This�grouping�does�not�coincide�with�the�distribution�by�segment of the Telefónica Group. The results by country include, as appropriate, the effect of the allocation of the purchase price to the acquired assets and the liabilities assumed. The results by country exclude income generated by dividends of Group subsidiaries, as well as the change in the provision for write-downs of investments in companies of the Group, which are eliminated in the consolidation process.�2)�Refunds�received�from�different�tax�authorities�as�a�result�of�excess�payments�made�in�previous�years�are�excluded.�For�2020�specifically,�the�following�tax�refunds�for�payments made in 2018 and 2019 are excluded: 89 million euros in Spain, 15 million euros in Peru and 13 million euros in Chile. For 2019, the extraordinary refund received in Spain as a result of the TEAC resolution (701 million plus 14 million corresponding to excess tax payments made in 2009 and 2010, plus 201 million euros in compensatory interest) is excluded, as set out in note 25 of the 2019 Consolidated Annual Accounts. Additionally, the refund in Spain of 132 million euros for the 2017 tax year is also excluded, as are the refunds of 10 million euros in Chile and 17 million euros in Peru. This last refund was not excluded from the 2019�non-financial�statements,�as�that�information�was�lacking�at�the�time�of�publication.�The�taxes�paid�to�the�different�authorities�are�attributed�to�the�country�of�jurisdiction�of�the�corresponding�tax�authority. (*) As a result of their sale in 2019, Telefónica Móviles Guatemala, Telefónica Móviles de Nicaragua and Telefónica Móviles Panamá were disinvested at different dates (and therefore excluded from the consolidation perimeter).

MAIN NON-FINANCIAL STATEMENTS
12
MAIN NON-FINANCIAL STATEMENTS
Leading by example

13
MAIN NON-FINANCIAL STATEMENTS Helping society thrive Leading by example Building a greener futureMAIN NON-FINANCIAL STATEMENTS
Ethics and compliance
Employees trained in the course on our Busi-ness�Principles�and�Human�Rights*
Number of employees trained in the course on Busi-ness Principles and human rights 103,934
Percentage of employees trained in the course on Business Principles and human rights 93%
Hours�of�training�in�the�course�on�Business�Principles�and�human�rights 207,868
*Since its launchment in 2018
Employees trained in anti-corruption
Number of employees trained in anti-corruption* 104,522
Number of employees trained in anti-corruption* 93%
*Includes the courses on Business Principles (since 2018), the Foreign Corrupt Practices Act (since 2017) and local anti-corruption courses (since 2019). In 2020, 31% of the workforce was trained in anti-corruption.
Main KPIs on the Whistleblower Channel
2019 2020Complaints received 1,222 882
Substantiated complaints received 465 385
Actions taken to terminate contracts of employment as a result of 140 126substantiated complaints
Confirmed�cases�of�corruption 0 1
Disciplinary measures taken or terminations of contract carried out 0 3in�connection�with�confirmed�cases�of�corruption
Confirmed�cases�of�discrimination 2 3
Disciplinary measures or terminations of contract carried out in 2 2connection�with�confirmed�cases�of�discrimination

14
MAIN NON-FINANCIAL STATEMENTS
� �
Whistleblower Channel
2019 2020Nature of substantiated complaints
% of total number of substantiated com-plaints
% of total number of substantiated com-plaints
Failure to comply with regulations 8% 14%
Fraud 28% 23%
Workplace/sexual harassment, and/or discrimi-nation 6% 5%
Conflict of interest 4% 5%
Information privacy/security 2% 2%
Inappropriate behaviour and other workplace disputes 43% 37%
Other 9% 14%
Total number 465 385
Responsible Business Channel
2019 2020Responsible communication 1 1
Integrity 3 1
Environment 36 26
Supply chain 4 13
Privacy 6 15
Accessibility 4 7
Sustainable innovation 2 5
Human rights� 0 0
Other human rights 0 3
Children's rights 0 0
Freedom of expression 0 0
Other (e.g. Customer responsibility* ) 4 155
*The increase in the number of enquiries in the category “Customer responsi-bility” is due to the fact that we promoted our Responsible Business Channel externally in 2020, which led to an increased number of customer-related enquiries, which we redirected internally to the relevant channels for resolu-tion.
Reports published by Internal Audit in 2019
No. of reportsTotal or partial analysis of processes related to the expenditure and investment cycle
Reports aiming to verify proper compliance with other legal obligations
Fraud/corruption prevention, review of personal actions
Review of the revenue cycle
Supervision�of�the�major�technological risks and compliance
with legal provisions affecting service networks and those
affecting information systems
Financial or information systems audits conducted essentially for reviewing internal�control�over�financial�processes
8216%
12926%
12625%
479%
275%
87 17%
Other work
503100%
51%

15
MAIN NON-FINANCIAL STATEMENTS Helping society thrive Leading by example Building a greener future
Country-by-Country Report 2019Tax jurisdiction
Third-party income
Related-party income
Total Income
Profit or loss before tax (1)
Tax on profit paid (2) Profit tax (3)
No. of em-ployees (4)
Tangible assets (5)
Germany 7,870 62 7,932 281 52 81 8,235 3,959
Argentina 2,142 24 2,165 (51) 118 123 14,816 1,670
Brazil 10,056 43 10,099 1,434 56 320 34,014 7,663
Chile 1,918 9 1,927 113 18 21 4,194 1,500
Colombia 1,400 13 1,413 66 37 41 5,564 1,241
Costa rica 232 3 235 77 4 29 201 0
Ecuador 477 8 485 43 24 53 1,193 284
El salvador 133 5 138 27 1 10 199 0
Spain 12,804 792 13,595 108 97 (522) 30,596 9,588
Guatemala 5 3 8 2 0 0 28 15
Mexico 1,193 60 1,254 (767) 22 479 1,964 691
Nicaragua 61 5 66 26 13 7 85 0
Panama 145 21 165 48 8 17 281 10
Peru 2,138 52 2,190 (167) 93 155 6,210 1,786
United Kingdom 7,070 46 7,116 675 217 91 6,953 3,327
Uruguay 282 165 447 136 15 20 642 361
Venezuela 75 1 76 73 1 (4) 1,763 25
Other 422 (1,312) (890) 215 29 35 411 107
Totals 48,422 0 48,422 2,338 803 957 117,347 32,228
(1)�(3)�Contribution�to�consolidated�result�before�tax�and�profit�tax,�adjusted�for�the�allocation�to�the�year�of�coupons�relating�to�subordinated�perpetual�bonds.�The�consolidated�financial�statements�of�the�Telefónica�Group�are�drawn�up�in�accordance�with�the�International�Financial�Reporting�Standards�(IFRS)�as�adopted�by�the�European�Union.�The�local�accounting regulations applicable in each country in which the Group is present may differ from the standards set by the IFRS.The�table�above�groups�together�all�the�Group�companies�according�to�the�country�of�their�registered�office.�This�grouping�does�not�coincide�with�the�distribution�by�segment�of�the�Telefónica Group. Where applicable, the results by country include the effect of the allocation of the purchase price to acquired assets and liabilities assumed. The results by country exclude income generated by dividends of Group subsidiaries, as well as the change in the provision for write-downs of investments in Group companies, which are eliminated in the consolidation�process.�Tax�withholdings�paid�to�the�various�administrations�have�been�allocated�to�the�jurisdiction�that�ultimately�bears�the�withholdings.(2)�Refunds�received�from�different�administrations�and�corresponding�to�overpayments�from�previous�years�are�excluded,�i.e.�€1,048m�in�Spain,�€10m�in�Chile�and�€17m�in�Peru.�The�last�return�on�the�list�was�not�excluded�from�the�non-financial�information�filed�for�the�financial�year�2019,�as�the�information�was�not�available�at�the�time�of�publication.(4)�The�number�of�employees�refers�to�the�average�number�of�employees,�distributed�by�tax�jurisdiction.(5) Tangible assets related to Central American countries are affected by the provisions of “Note 30. Operations held for sale” in the 2019 Consolidated Financial Statements.

16
MAIN NON-FINANCIAL STATEMENTS
Employees trained on anti-corruption, by professional category and region *
Country Executives Middle Management Other professionals Total Germany** 6 10 7,604
Argentina 174 1,33 12,026 13,53
Brazil 1,532 2,006 27,015 30,553
Chile 82 568 3,353 4,003
Colombia 146 389 4,542 5,077
Ecuador 61 152 771 984
Spain 1,591 2,906 22,658 27,155
Mexico 316 76 1,418 1,81
Peru 158 380 4,355 4,893
UK 333 1,103 4,796 6,232
Uruguay 40 74 511 625
Venezuela 64 299 1,295 1,658
Rest 68 230 100 398
Total*** 4,581 9,56 83,18 104,909
*The courses considered for this indicator are; Business Principles Course (since 2018), the Foreign Corrupt Practices Act Course (since 2017 ) and local anti-corruption courses (since 2019). **While break-down of data into professional category and regions for Germany was possible for 2020 (see table below), no such break-down was possible for historic data displayed in this table.***Given that historic break-down of data into professional category and regions for Germany was not possible (see previous note), the total provided in the last column is the sum of the vertical numbers (total for each country) and not the sum of the total of professional categories.
% Employees trained on anti-corruption, by professional category and region*
Country Executives Middle Management Other professionals Total Germany** —% 1 % — % 96 %
Argentina 99% 100% 99% 99%
Brazil 97% 95% 88% 89%
Chile 98% 95% 94% 94%
Colombia 95% 79% 78% 79%
Ecuador 100% 97% 95% 96%
Spain 99% 99% 94% 95%
Mexico 99% 99% 98% 98%
Peru 99% 97% 94% 94%
UK 99% 99% 98% 99%
Uruguay 100 % 100% 98% 99%
Venezuela 98% 99% 96% 97%
Rest 93% 91% 84% 90%
Total 93% 90% 86% 93%
*The courses considered for this indicator are; Business Principles Course (since 2018), the Foreign Corrupt Practices Act Course (since 2017 ) and local anti-corruption courses (since 2019). **While break-down of data into professional category and regions for Germany was possible for 2020 (see table below), no such break-down was possible for historic data displayed in this table.

17
MAIN NON-FINANCIAL STATEMENTS Helping society thrive Leading by example Building a greener future
Employees trained on anti-corruption in 2020, by professional category and region
Country Executives Middle Management Other professionals TotalGermany 19 84 740 843
Argentina 97 812 7,153 8,062
Brazil 1,070 1,209 12,076 14,355
Chile 14 302 2,155 2,471
Colombia 3 95 871 969
Ecuador 52 125 714 891
Spain 53 251 3,325 3,629
Mexico 30 5 362 397
Peru 35 70 959 1,064
UK 102 221 1,369 1,692
Uruguay 2 0 51 53
Venezuela 26 42 275 343
Rest 3 4 84 91
Total 1,506 3,220 30,134 34,860
% Employees trained on anti-corruption in 2020, by professional category and region
Country Executives Middle Management Other professionals TotalGermany 3% 1% 9 % 11%
Argentina 55% 61% 59% 59%
Brazil 68% 58% 39% 42%
Chile 17% 50% 60% 58%
Colombia 2% 19% 15% 16%
Ecuador 85% 80% 88% 87%
Spain 3% 9% 14% 13%
Mexico 9% 6% 25% 22%
Peru 22 % 18% 21% 21%
UK 30 % 20% 28% 27%
Uruguay 5 % —% 10% 9%
Venezuela 40% 15% 20% 20%
Rest 4% 2% 71% 20%
Total 31% 30% 31% 31%

18
MAIN NON-FINANCIAL STATEMENTS
Clients
NPS Telefónica Group (*)
2019 2020
17 24(*) Only includes the four main operators (Spain, Germany, the United Kingdom and Brazil).
NPS Telefónica Group (by segment) (*)
2019 2020B2C 16 20
B2B 33 40
(*) Only includes the four main operators (Spain, Germany, the United Kingdom and Brazil).
Digital Trust Summary of key indicators
Indicators 2019 2020
Number of attendees on training courses in data protection and cybersecurity 54,991 80,222
Number of hours of training in data protection and cybersecurity 104,558 105,700
Number of open procedures for data protection issues 66 61
Number of fines for data protec-tion issues (*)� � � � � � � 23 15
Sum of fines (euros) for data protection issues (*)� � � � � � � � 244,206 328,593
Number of enquiries/complaints on data protection/privacy issues in the Responsible Business Channel 6 15
Number of inquiries / claims on Freedom of Expression issues in the Responsible Business Channel 0 0
Number of internal audits in data protection and cybersecurity 69 75Number of external audits in the area of product and service secu-rity (**) 13 10Number of high-impact infor-mation security or cybersecurity incidents/breaches that have affected personal data of cus-tomers 1 0
Scope of training and awareness initiatives on the responsible use of technology (people) 223,725,282 166,470,613
(*) Following the application of the “firm resolution/final decision” criteria regarding fines, one ruling/fine in Brazil has beenmoved from2019 to 2020.� � � � � � � � � � � � � � � � � � � � � �(**) Products and services that are audited: Vamps, Cyberthreats, AntiDDoS,Monitorización de seguridad, Navegación segura, Redes Limpias, Trafico Limpio de Correo, UTM� � � � � � � � � � � � � � � � � � � � � �Gestionado, WAF as a service, Soporte y Gestión de Dispositivos.
19
MAIN NON-FINANCIAL STATEMENTS Helping society thrive Leading by example Building a greener future
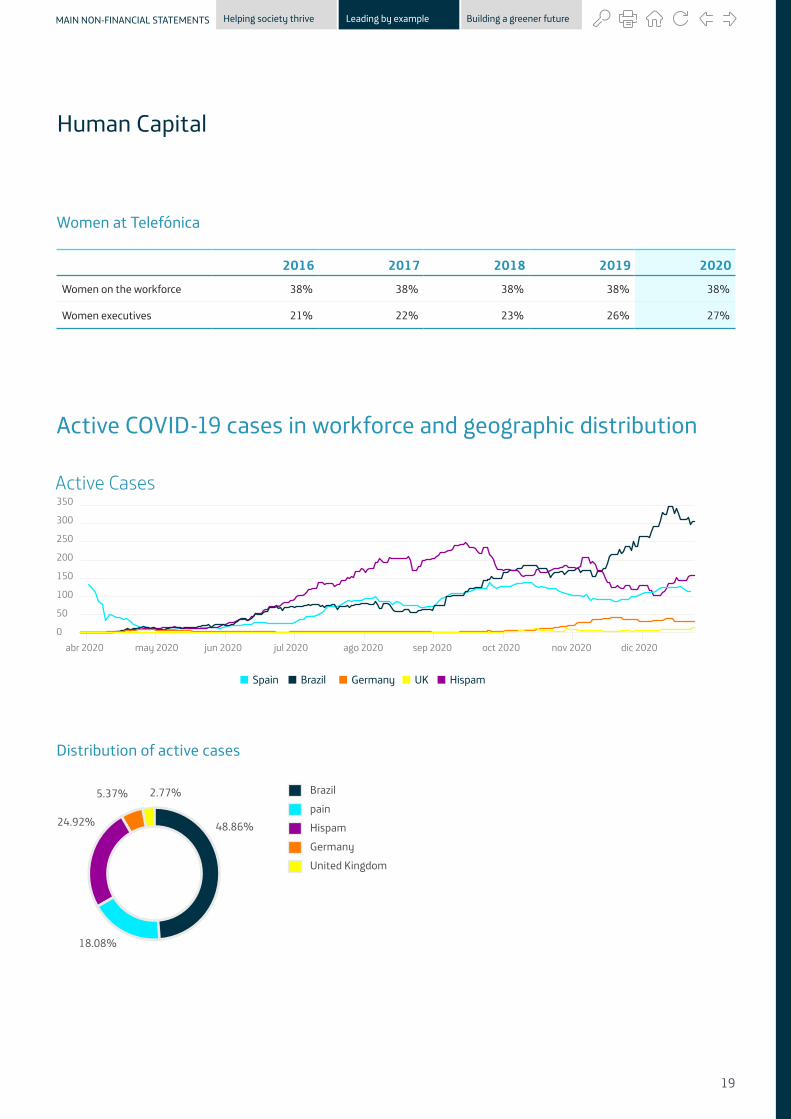
Human�Capital��
Women at Telefónica
48.86%
BrazilpainHispamGermanyUnited Kingdom
18.08%
24.92%
5.37%
350
300
250
200
150
100
50
0
Spain GermanyBrazil UK Hispam
abr 2020 ago 2020jun�2020 oct 2020may 2020 sep 2020jul�2020 nov 2020 dic 2020
2016 2017 2018 2019 2020
Women on the workforce 38% 38% 38% 38% 38%
Women executives 21% 22% 23% 26% 27%
Active COVID-19 cases in workforce and geographic distribution
Active Cases
Distribution of active cases
2.77%

20
MAIN NON-FINANCIAL STATEMENTS
Occupational health and safety indicators
Indicators (1) Germany Brazil Spain United Kingdom HispAm (4)2019 2020 2019 2020 2019 2020 2019 2020 2019 2020
Number of hours of absenteeism(men)
593.520 494.016 781.088 774.808 1.046.640 132.288 245.744 292.904 903.320 808.480
Number of hours of absenteeism(women)
584.200 485.904 920.944 771.592 673.400 177.592 271.864 302.920 892.280 587.648
Number of hours of absenteeismTOTAL
1.177.720 979.920 1.702.032 1.546.400 1.720.040 309.880 517.608 595.824 1.795.600 1.396.128
Absenteeism rate (men) 0.06 0.05 0.02 0.02 0.03 0.00 0.03 0.04 0.02 0.02
Absenteeism rate (women) 0.10 0.09 0.04 0.03 0.03 0.01 0.06 0.07 0.03 0.02
AbsenteeismrateTOTAL
0.08 0.07 0.03 0.02 0.03 0.01 0.04 0.05 0.03 0.02
Lost dayrate /severity(men) (2)
21.44 11.64 21.74 7.02 14.30 3.92 5.34 2.01 65.74 58.61
Lost dayrate /severity(women) (2)
23.73 14.35 2.08 0.72 8.29 6.20 3.85 12.47 14.77 22.54
Lost dayrate /severityTOTAL (2)
22.26 12.60 13.80 4.48 12.23 4.72 4.78 5.94 47.14 45.58
Lost day rate /severity(men) (3)
21.44 11.64 21.74 7.02 14.30 3.92 128.83 2.01 65.61 107.60
Lost day rate /severity(women) (3)
23.73 14.35 2.08 0.72 8.29 6.20 268.67 12.47 16.62 59.56
Lost day rate /severityTOTAL (3)
22.26 12.60 13.80 4.48 12.23 4.72 181.68 5.94 47.73 90.25
Accidentfrequency rate(men)
0.52 0.25 0.58 0.57 0.27 0.12 0.05 0.00 2.13 1.12
Accidentfrequency rate(women)
0.61 0.94 0.15 0.05 0.29 0.12 0.08 0.04 0.86 0.52
Accidentfrequency rateTOTAL
0.55 0.49 0.41 0.36 0.28 0.12 0.06 0.02 1.67 0.91
Occupationaldisease rate(men) (2)
0.00 0.00 0.00 0.00 0.00 0.00 0.00 0.00 0.02 0.05
Occupationaldisease rate(women) (2)
0.00 0.00 0.00 0.00 0.00 0.00 0.00 0.00 0.05 0.06
Occupationaldisease rateTOTAL (2)
0.00 0.00 0.00 0.00 0.00 0.00 0.00 0.00 0.03 0.05
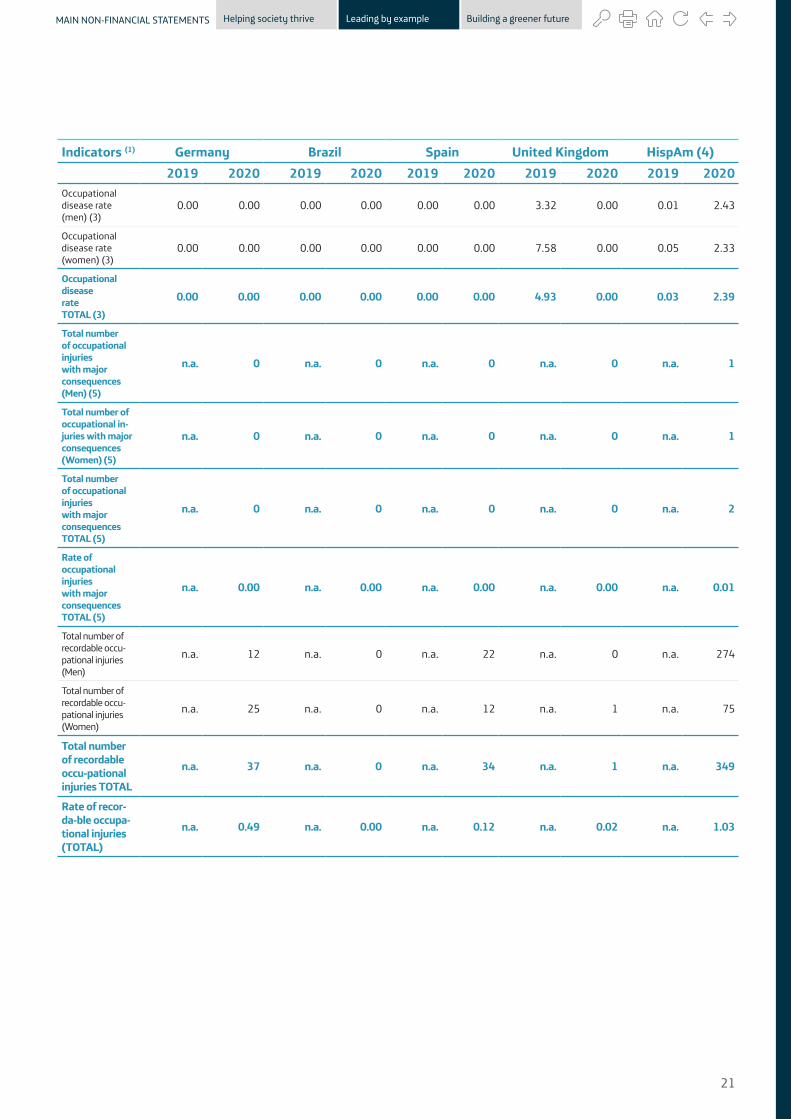
21
MAIN NON-FINANCIAL STATEMENTS Helping society thrive Leading by example Building a greener future
Indicators (1) Germany Brazil Spain United Kingdom HispAm (4)2019 2020 2019 2020 2019 2020 2019 2020 2019 2020
Occupationaldisease rate(men) (3)
0.00 0.00 0.00 0.00 0.00 0.00 3.32 0.00 0.01 2.43
Occupationaldisease rate(women) (3)
0.00 0.00 0.00 0.00 0.00 0.00 7.58 0.00 0.05 2.33
OccupationaldiseaserateTOTAL (3)
0.00 0.00 0.00 0.00 0.00 0.00 4.93 0.00 0.03 2.39
Total number of occupational injuries with major consequences (Men) (5)
n.a. 0 n.a. 0 n.a. 0 n.a. 0 n.a. 1
Total number of occupational in-juries with major consequences (Women) (5)
n.a. 0 n.a. 0 n.a. 0 n.a. 0 n.a. 1
Total number of occupational injuries with major consequences TOTAL (5)
n.a. 0 n.a. 0 n.a. 0 n.a. 0 n.a. 2
Rate of occupational injuries with major consequences TOTAL (5)
n.a. 0.00 n.a. 0.00 n.a. 0.00 n.a. 0.00 n.a. 0.01
Total number of recordable occu-pational�injuries�(Men)
n.a. 12 n.a. 0 n.a. 22 n.a. 0 n.a. 274
Total number of recordable occu-pational�injuries�(Women)
n.a. 25 n.a. 0 n.a. 12 n.a. 1 n.a. 75
Total number of recordable occu-pational injuries TOTAL
n.a. 37 n.a. 0 n.a. 34 n.a. 1 n.a. 349
Rate of recor-da-ble occupa-tional injuries (TOTAL)
n.a. 0.49 n.a. 0.00 n.a. 0.12 n.a. 0.02 n.a. 1.03
22
MAIN NON-FINANCIAL STATEMENTS
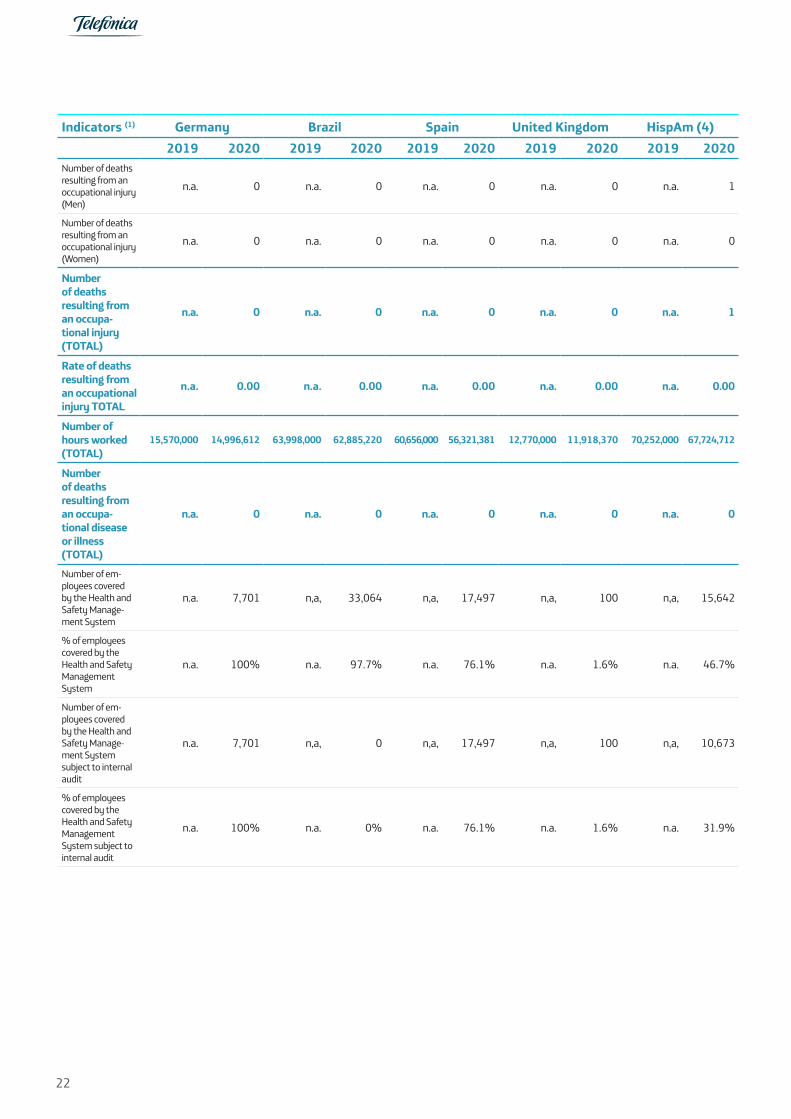
Indicators (1) Germany Brazil Spain United Kingdom HispAm (4)2019 2020 2019 2020 2019 2020 2019 2020 2019 2020
Number of deaths resulting from an occupational�injury�(Men)
n.a. 0 n.a. 0 n.a. 0 n.a. 0 n.a. 1
Number of deaths resulting from an occupational�injury�(Women)
n.a. 0 n.a. 0 n.a. 0 n.a. 0 n.a. 0
Number of deaths resulting from an occupa-tional injury (TOTAL)
n.a. 0 n.a. 0 n.a. 0 n.a. 0 n.a. 1
Rate of deaths resulting from an occupational injury TOTAL
n.a. 0.00 n.a. 0.00 n.a. 0.00 n.a. 0.00 n.a. 0.00
Number of hours worked (TOTAL)
15,570,000 14,996,612 63,998,000 62,885,220 60,656,000 56,321,381 12,770,000 11,918,370 70,252,000 67,724,712
Number of deaths resulting from an occupa-tional disease or illness (TOTAL)
n.a. 0 n.a. 0 n.a. 0 n.a. 0 n.a. 0
Number of em-ployees covered by�the�Health�and�Safety Manage-ment System
n.a. 7,701 n,a, 33,064 n,a, 17,497 n,a, 100 n,a, 15,642
% of employees covered by the Health�and�Safety�Management System
n.a. 100% n.a. 97.7% n.a. 76.1% n.a. 1.6% n.a. 46.7%
Number of em-ployees covered by�the�Health�and�Safety Manage-ment System subject�to�internal�audit
n.a. 7,701 n,a, 0 n,a, 17,497 n,a, 100 n,a, 10,673
% of employees covered by the Health�and�Safety�Management System�subject�to�internal audit
n.a. 100% n.a. 0% n.a. 76.1% n.a. 1.6% n.a. 31.9%

23
MAIN NON-FINANCIAL STATEMENTS Helping society thrive Leading by example Building a greener future
Indicators (1) Germany Brazil Spain United Kingdom HispAm (4)2019 2020 2019 2020 2019 2020 2019 2020 2019 2020
Number of em-ployees covered by�the�Health�and�Safety Manage-ment System subject�to�third�party�certification�or auditing
n.a. 7,701 n,a, 0 n,a, 17,497 n,a, 100 n,a, 20,613
% of employees covered by the Health�and�Safety�Management System�subject�to�third�party�certifi-cation or auditing
n.a. 100% n.a. 0.0% n.a. 76.1% n.a. 1.6% n.a. 61.5%
-Absenteeism rate = total number of days lost due to absence / total days worked per year.-Lost day rate / severity = (total number of days lost due to accidents in the workplace with leave and occupational disease / total hours worked per year) x 200.000-Accident frequency rate = (total number of accidents in the workplace with leave / total number of hours worked per year) x 200.000.-Occupational disease rate = (total number of occupational diseases / total number of hours worked per year) x 200.000.-Rate�of�occupational�injuries�with�major�consequences�=�(number�of�occupational�injuries�with�major�consequences�(excluding�deaths)�/�number�of�hours�worked)�×�[200.000 or 1.000.000].-Rate�of�recordable�occupational�injuries�=�(number�of�recordable�occupational�injuries�/�number�of�hours�worked)�×�[200.000�or�1.000.000].-Rate�of�deaths�resulting�from�an�occupational�injury�=�(number�of�deaths�resulting�from�an�occupational�injury�/�number�of�hours�worked)�×�[200.000�or�1.000.000].(1) To improve the quality of the data. we have reported data related to occupational diseases based on two criteria: 1. On the basis ofa�global�definition.�based�on�the�list�of�occupational�diseases�from�the�International�Labour�Organization�(ILO);�2.�On�the�basis�of�local�legislation.�regulations�and�rules.�as�in previous years. This distinction is necessary in order to understand the differences between countries. e.g.. the employment regulations in the United Kingdom contain a larger number of occupational diseases (e.g.. stress) than the rest of the regions in which Telefónica operates. and therefore the rates associated with occupational diseases are higher in the United Kingdom. Additionally. in 2020 in Argentina. according to local legislation. Covid is being considered as an occupational disease.(2) Based on the list of occupational diseases from the ILO.(3) Based on the list of occupational diseases in local legislation. regulations and rules.(4)�In�2019�and�2020.�HispAm�comprised:�Argentina.�Chile.�Colombia.�Ecuador.�México.�Perú.�Uruguay.�and�Venezuela.(5) Not including deaths.
Health�and�Safety�Management�Systems�in�2020
Indicators (*) Total Group (%)
Health and Safety management systems implemented and� � � � � � �certified under ISO 45001� � � 49%
Safety and Health management systems implemented without� � � � � � �certification 50%
Health and Safety management systems implemented 99%
(*) The indicators (calculated on the basis of the physical workforce by region) reflect the percentage of employ� � � � � � � � � � � � � � � � � -ees covered by a certified Health and Safety management system (ISO 45001 standard, or in the case of the� � � � � � � � � � � � � � � � � � �United Kingdom, which also has more than one certification), or with a management system in place but not� � � � � � � � � � � � � � � � � �certified. 99% indicates the sum of the percentage of employees who are covered by a certified or uncertified manage� � � � � � � � � � � � � � � � � -ment system.

24
MAIN NON-FINANCIAL STATEMENTS
WORKFORCE INDICATORS (*)
Total number and distribution of employees by gender, age, professional category and country
TOTAL GROUP
50 and more From 35 to 49 Under 35 Total
2019 2020 2019 2020 2019 2020 2019 2020
Executives Men 877 959 2,368 2,220 207 179 3,452 3,358
% 5% 5% 7% 7% 1% 1% 5% 5%
Women 253 289 1,114 1,120 103 103 1,470 1,512
% 4% 5% 5% 5% 1% 1% 3% 4%
Total 1,130 1,248 3,482 3,340 310 282 4,922 4,870
% 5% 5% 7% 6% 1% 1% 4% 4%
Middle management Men 1,747 1,916 4,442 4,362 1,015 1,028 7,204 7,306
% 10% 10% 14% 14% 5% 5% 10% 10%
Women 439 529 2,122 2,137 657 592 3,218 3,258
% 8% 8% 10% 10% 4% 4% 7% 8%
Total 2,186 2,445 6,564 6,499 1,672 1,620 10,422 10,564
% 9% 10% 12% 12% 4% 5% 9% 9%
Other professionals Men 14,970 16,090 25,491 25,051 19,478 17,833 59,939 58,974
% 85% 85% 79% 79% 94% 94% 85% 85%
Women 5,023 5,601 17,649 17,739 15,864 14,601 38,536 37,941
% 88% 87% 85% 84% 76% 70% 89% 89%
Total 19,993 21,691 43,140 42,790 35,342 32,434 98,475 96,915
% 86% 85% 81% 81% 66% 62% 87% 86%
Total Men 17,594 18,965 32,301 31,633 20,700 19,040 70,595 69,638
% 25% 27% 46% 45% 29% 27% 62% 62%
Women 5,715 6,419 20,885 20,996 16,624 15,296 43,224 42,711
% 13% 15% 48% 49% 38% 36% 38% 38%
Total 23,309 25,384 53,186 52,629 37,324 34,336 113,819 112,349
% 20% 23% 47% 47% 33% 31% 100% 100%
(*)�In�order�to�guarantee�homogenity�of�the�information,�professional�categories�and�age�groups�have�been�reconfigured.�This�has�required�to�re-express�2019�data.�Be-sides,�percentage�figures�across�the�different�tables�have�been�rounded�to�the�unit.

25
MAIN NON-FINANCIAL STATEMENTS Helping society thrive Leading by example Building a greener future
GERMANY
50 and more From 35 to 49 Under 35 Total
2019 2020 2019 2020 2019 2020 2019 2020
Executives Men 70 77 113 96 7 3 190 176
% 6% 6% 4% 4% 1% 0% 4% 4%
Women 16 18 40 34 3 3 59 55
% 3% 3% 3% 2% 0% 0% 2% 2%
Total 86 95 153 130 10 6 249 231
% 5% 5% 4% 3% 0% 0% 3% 3%
Middle management Men 102 121 370 371 73 69 4,321 561
% 9% 9% 15% 15% 5% 6% 85% 11%
Women 33 38 90 107 24 25 147 170
% 5% 6% 6% 7% 3% 3% 5% 6%
Total 135 159 460 478 97 94 692 731
% 7% 8% 11% 12% 4% 5% 8% 9%
Other professionals Men 1,009 1,123 2,052 2,002 1,260 1,101 4,321 4,226
% 85% 85% 81% 81% 94% 94% 53% 53%
Women 579 609 1,429 1,397 886 732 2,894 2,738
% 92% 92% 92% 91% 57% 48% 35% 35%
Total 1,588 1,732 3,481 3,399 2,146 1,833 7,215 6,964
% 88% 87% 85% 85% 52% 46% 88% 88%
Total Men 1,181 1,321 2,535 2,469 1,340 1,173 5,056 4,963
% 23% 27% 50% 50% 27% 24% 62% 63%
Women 628 665 1,559 1,538 913 760 3,100 2,963
% 20% 22% 50% 52% 29% 26% 38% 37%
Total 1,809 1,986 4,094 4,007 2,253 1,933 8,156 7,926
% 22% 25% 50% 51% 28% 24% 100% 100%

26
MAIN NON-FINANCIAL STATEMENTS
ARGENTINA
50 and more From 35 to 49 Under 35 Total
2019 2020 2019 2020 2019 2020 2019 2020
Executives Men 71 62 88 71 7 4 166 137
% 2% 2% 2% 2% 0% 0% 2% 1%
Women 17 16 24 21 0 1 41 38
% 3% 3% 1% 1% 0% 0% 1% 1%
Total 88 78 112 92 7 5 207 175
% 2% 2% 2% 1% 0% 0% 1% 1%
Middle management Men 430 405 499 500 106 91 1.035 996
% 12% 12% 12% 12% 5% 5% 10% 11%
Women 51 50 235 240 56 45 342 335
% 8% 9% 8% 8% 5% 5% 7% 8%
Total 481 455 734 740 162 136 1.377 1.331
% 11% 11% 10% 10% 5% 5% 9% 10%
Other professionals Men 3.183 2.918 3.642 3.583 1.869 1.573 8.694 8.074
% 86% 86% 86% 86% 94% 94% 60% 59%
Women 598 522 2.538 2.645 1.103 871 4.239 4.038
% 90% 89% 91% 91% 39% 30% 29% 30%
Total 3.781 3.440 6.180 6.228 2.972 2.444 12.933 12.112
% 87% 87% 88% 88% 42% 35% 89% 89%
Total Men 3.684 3.385 4.229 4.154 1.982 1.668 9.895 9.207
% 37% 37% 43% 45% 20% 18% 68% 68%
Women 666 588 2.797 2.906 1.159 917 4.622 4.411
% 14% 13% 61% 66% 25% 21% 32% 32%
Total 4.350 3.973 7.026 7.060 3.141 2.585 14.517 13.618
% 30% 29% 48% 52% 22% 19% 100% 100%

27
MAIN NON-FINANCIAL STATEMENTS Helping society thrive Leading by example Building a greener future
BRAZIL
50 and more From 35 to 49 Under 35 Total
2019 2020 2019 2020 2019 2020 2019 2020
Executives Men 121 155 822 813 121 109 1,064 1,077
% 8% 8% 9% 8% 1% 1% 5% 5%
Women 33 43 388 413 62 59 483 515
% 6% 6% 7% 7% 1% 1% 3% 4%
Total 154 198 1,210 1,226 183 168 1,547 1,592
% 7% 8% 8% 8% 1% 1% 4% 5%
Middle management Men 178 217 979 978 361 306 1,518 1,501
% 11% 12% 11% 10% 4% 4% 8% 8%
Women 24 29 329 354 267 230 620 613
% 4% 4% 6% 6% 3% 3% 4% 4%
Total 202 246 1,308 1,332 628 536 2,138 2,114
% 9% 10% 9% 9% 4% 3% 6% 6%
Other professionals Men 1,300 1,465 7,467 7,810 8,799 8,116 17,566 17,391
% 81% 80% 81% 81% 95% 95% 51% 51%
Women 527 596 4,724 5,099 8,002 7,640 13,253 13,335
% 90% 89% 87% 87% 147% 130% 38% 39%
Total 1,827 2,061 12,191 12,909 16,801 15,756 30,819 30,726
% 84% 82% 83% 83% 114% 102% 89% 89%
Total Men 1,599 1,837 9,268 9,601 9,281 8,531 20,148 19,969
% 8% 9% 46% 48% 46% 43% 58% 58%
Women 584 668 5,441 5,866 8,331 7,929 14,356 14,463
% 4% 5% 38% 41% 58% 55% 42% 42%
Total 2,183 2,505 14,709 15,467 17,612 16,460 34,504 34,432
% 6% 7% 43% 45% 51% 48% 100% 100%

28
MAIN NON-FINANCIAL STATEMENTS
CHILE
50 and more From 35 to 49 Under 35 Total
2019 2020 2019 2020 2019 2020 2019 2020
Executives Men 24 27 42 37 1 4 67 68
% 2% 2% 3% 3% 0% 1% 2% 2%
Women 5 4 7 9 1 3 13 16
% 2% 1% 1% 1% 0% 1% 1% 1%
Total 29 31 49 46 2 7 80 84
% 2% 2% 2% 2% 0% 1% 2% 2%
Middle management Men 134 135 183 225 27 89 344 449
% 13% 12% 15% 18% 5% 16% 12% 15%
Women 24 29 89 98 13 25 126 152
% 9% 10% 12% 13% 5% 9% 10% 11%
Total 158 164 272 323 40 114 470 601
% 12% 11% 14% 16% 5% 14% 11% 14%
Other professionals Men 900 962 1,016 1,006 523 452 2,439 2,420
% 85% 86% 82% 79% 95% 83% 59% 57%
Women 236 271 666 649 268 244 1,170 1,164
% 89% 89% 87% 86% 35% 32% 28% 27%
Total 1,136 1,233 1,682 1,655 791 696 3,609 3,584
% 86% 86% 84% 82% 39% 34% 87% 84%
Total Men 1,058 1,124 1,241 1,268 551 545 2,850 2,937
% 37% 38% 44% 43% 19% 19% 69% 69%
Women 265 304 762 756 282 272 1,309 1,332
% 20% 23% 58% 57% 22% 20% 31% 31%
Total 1,323 1,428 2,003 2,024 833 817 4,159 4,269
% 32% 33% 48% 47% 20% 19% 100% 100%

29
MAIN NON-FINANCIAL STATEMENTS Helping society thrive Leading by example Building a greener future
COLOMBIA
50 and more From 35 to 49 Under 35 Total
2019 2020 2019 2020 2019 2020 2019 2020
Executives Men 25 32 74 64 7 3 106 99
% 9% 9% 5% 4% 1% 0% 4% 3%
Women 11 12 41 42 1 1 53 55
% 7% 7% 4% 3% 0% 0% 2% 2%
Total 36 44 115 106 8 4 159 154
% 9% 8% 4% 3% 0% 0% 3% 2%
Middle management Men 36 48 175 203 30 50 241 301
% 13% 13% 12% 12% 3% 3% 8% 8%
Women 12 16 141 147 26 26 179 189
% 8% 9% 12% 11% 2% 2% 7% 7%
Total 48 64 316 350 56 76 420 490
% 12% 12% 12% 11% 2% 3% 8% 8%
Other professionals Men 207 284 1,205 1,494 1,148 1,432 2,560 3,210
% 77% 78% 83% 85% 97% 96% 46% 50%
Women 125 142 975 1,099 1,279 1,340 2,379 2,581
% 84% 84% 84% 85% 111% 104% 43% 40%
Total 332 426 2,180 2,593 2,427 2,772 4,939 5,791
% 80% 80% 83% 85% 93% 91% 90% 90%
Total Men 268 364 1,454 1,761 1,185 1,485 2,907 3,610
% 9% 10% 50% 49% 41% 41% 53% 56%
Women 148 170 1,157 1,288 1,306 1,367 2,611 2,825
% 6% 6% 44% 46% 50% 48% 47% 44%
Total 416 534 2,611 3,049 2,491 2,852 5,518 6,435
% 8% 8% 47% 47% 45% 44% 100% 100%

30
MAIN NON-FINANCIAL STATEMENTS
ECUADOR
50 and more From 35 to 49 Under 35 Total
2019 2020 2019 2020 2019 2020 2019 2020
Executives Men 20 15 40 30 1 1 t 46
% 48% 42% 11% 9% 0% 0% 9% 7%
Women 4 2 12 12 2 1 18 15
% 21% 13% 6% 6% 1% 1% 4% 4%
Total 24 17 52 42 3 2 79 61
% 39% 33% 9% 8% 1% 0% 7% 6%
Middle management Men 8 7 80 68 20 21 108 96
% 19% 19% 22% 20% 7% 8% 16% 15%
Women 2 3 41 41 27 16 70 60
% 11% 20% 22% 21% 12% 8% 16% 15%
Total 10 10 121 109 47 37 178 156
% 16% 20% 22% 20% 10% 8% 16% 15%
Other professionals Men 14 14 245 242 249 230 508 486
% 33% 39% 67% 71% 92% 91% 46% 47%
Women 13 10 136 142 192 173 341 325
% 68% 67% 72% 73% 102% 89% 31% 32%
Total 27 24 381 384 441 403 849 811
% 44% 47% 69% 72% 80% 75% 77% 79%
Total Men 42 36 365 340 270 252 677 628
% 6% 6% 54% 54% 40% 40% 61% 61%
Women 19 15 189 195 221 190 429 400
% 4% 4% 44% 49% 52% 48% 39% 39%
Total 61 51 554 535 491 442 1,106 1,028
% 6% 5% 50% 52% 44% 43% 100% 100%

31
MAIN NON-FINANCIAL STATEMENTS Helping society thrive Leading by example Building a greener future
SPAIN
50 and more From 35 to 49 Under 35 Total
2019 2020 2019 2020 2019 2020 2019 2020
Executives Men 1,127 394 747 693 21 16 1,127 1,103
% 15% 5% 9% 9% 1% 1% 6% 6%
Women 496 142 365 343 12 16 496 501
% 19% 5% 6% 6% 1% 1% 5% 5%
Total 1,623 536 1,112 1,036 33 32 1,623 1,604
% 16% 5% 8% 8% 1% 1% 6% 6%
Middle management Men 527 639 1,176 1,134 136 187 1,839 1,960
% 7% 7% 14% 15% 6% 8% 10% 11%
Women 159 218 668 665 86 103 913 986
% 6% 7% 11% 12% 5% 7% 9% 10%
Total 686 857 1,844 1,799 222 290 2,752 2,946
% 7% 7% 13% 14% 6% 8% 10% 10%
Other professionals Men 6,654 7,667 6,406 5,640 2,226 2,016 15,286 15,323
% 88% 88% 77% 76% 93% 91% 54% 54%
Women 2,292 2,755 4,915 4,564 1,520 1,368 8,727 8,687
% 89% 88% 83% 82% 26% 25% 31% 30%
Total 8,946 10,422 11,321 10,204 3,746 3,384 24,013 24,010
% 88% 88% 79% 78% 26% 26% 85% 84%
Total Men 7,540 8,700 8,329 7,467 2,383 2,219 18,252 18,386
% 41% 47% 46% 41% 13% 12% 64% 64%
Women 2,570 3,115 5,948 5,572 1,618 1,487 10,136 10,174
% 25% 31% 59% 55% 16% 15% 36% 36%
Total 10,110 11,815 14,277 13,039 4,001 3,706 28,388 28,560
% 36% 41% 50% 46% 14% 13% 100% 100%

32
MAIN NON-FINANCIAL STATEMENTS
MEXICO
50 and more From 35 to 49 Under 35 Total
2019 2020 2019 2020 2019 2020 2019 2020
Executives Men 30 29 175 163 29 24 234 216
% 30% 26% 23% 22% 7% 6% 18% 17%
Women 4 4 86 88 14 12 104 104
% 22% 20% 28% 27% 5% 5% 17% 18%
Total 34 33 261 251 43 36 338 320
% 29% 25% 24% 23% 6% 6% 18% 17%
Middle management Men 9 10 62 46 11 9 82 65
% 9% 9% 8% 6% 3% 2% 6% 5%
Women — 0 9 9 5 3 14 12
% 0% 0% 3% 3% 2% 1% 2% 2%
Total 9 10 71 55 16 12 96 77
% 8% 8% 7% 5% 2% 2% 5% 4%
Other professionals Men 62 72 525 547 382 352 969 971
% 61% 65% 69% 72% 91% 91% 51% 53%
Women 14 16 212 227 253 232 479 475
% 78% 80% 69% 70% 82% 72% 25% 26%
Total 76 88 737 774 635 584 1,448 1,446
% 64% 67% 69% 72% 59% 54% 77% 78%
Total Men 101 111 762 756 422 385 1,285 1,252
% 8% 9% 59% 60% 33% 31% 68% 68%
Women 18 20 307 324 272 247 597 591
% 3% 3% 51% 55% 46% 42% 32% 32%
Total 119 131 1,069 1,080 694 632 1,882 1,843
% 6% 7% 57% 59% 37% 34% 100% 100%

33
MAIN NON-FINANCIAL STATEMENTS Helping society thrive Leading by example Building a greener future
PERU
50 and more From 35 to 49 Under 35 Total
2019 2020 2019 2020 2019 2020 2019 2020
Executives Men 36 33 84 65 3 4 123 102
% 3% 3% 5% 4% 0% 0% 3% 3%
Women 8 8 44 41 2 1 54 50
% 3% 3% 5% 5% 0% 0% 3% 3%
Total 44 41 128 106 5 5 177 152
% 3% 3% 5% 4% 0% 0% 3% 3%
Middle management Men 45 43 235 214 30 19 310 276
% 4% 4% 15% 14% 3% 2% 9% 8%
Women 7 8 97 87 13 6 117 101
% 3% 3% 11% 10% 2% 1% 6% 6%
Total 52 51 332 301 43 25 427 377
% 4% 4% 13% 13% 3% 2% 8% 7%
Other professionals Men 989 942 1,239 1,224 953 878 3,181 3,044
% 92% 93% 80% 81% 97% 97% 59% 59%
Women 261 268 766 753 611 554 1,638 1,575
% 95% 94% 84% 85% 67% 63% 30% 31%
Total 1,250 1,210 2,005 1,977 1,564 1,432 4,819 4,619
% 93% 93% 81% 83% 63% 60% 89% 90%
Total Men 1,070 1,018 1,558 1,503 986 901 3,614 3,422
% 30% 30% 43% 44% 27% 26% 67% 66%
Women 276 284 907 881 626 561 1,809 1,726
% 15% 16% 50% 51% 35% 33% 33% 34%
Total 1,346 1,302 2,465 2,384 1,612 1,462 5,423 5,148
% 25% 25% 45% 46% 30% 28% 100% 100%

34
MAIN NON-FINANCIAL STATEMENTS
UNITED KINGDOM
50 and more From 35 to 49 Under 35 Total
2019 2020 2019 2020 2019 2020 2019 2020
Executives Men 69 81 123 131 8 10 200 222
% 9% 11% 7% 8% 0% 1% 5% 6%
Women 24 25 66 83 5 6 95 114
% 6% 7% 6% 8% 0% 1% 3% 5%
Total 93 106 189 214 13 16 295 336
% 8% 9% 7% 8% 0% 1% 4% 5%
Middle management Men 182 179 426 404 188 156 796 739
% 24% 24% 25% 25% 11% 11% 19% 19%
Women 77 77 249 213 107 82 433 372
% 20% 20% 22% 20% 8% 8% 16% 15%
Total 259 256 675 617 295 238 1,229 1,111
% 23% 23% 24% 23% 10% 9% 18% 18%
Other professionals Men 496 494 1,126 1,080 1,536 1,297 3,158 2,871
% 66% 66% 67% 67% 89% 89% 46% 45%
Women 278 281 816 749 1,152 974 2,246 2,004
% 73% 73% 72% 72% 102% 93% 32% 32%
Total 774 775 1,942 1,829 2,688 2,271 5,404 4,875
% 69% 68% 69% 69% 96% 85% 78% 77%
Total Men 747 754 1,675 1,615 1,732 1,463 4,154 3,832
% 18% 20% 40% 42% 42% 38% 60% 61%
Women 379 383 1,131 1,045 1,264 1,062 2,774 2,490
% 14% 15% 41% 42% 46% 43% 40% 39%
Total 1,126 1,137 2,806 2,660 2,996 2,525 6,928 6,322
% 16% 18% 41% 42% 43% 40% 100% 100%

35
MAIN NON-FINANCIAL STATEMENTS Helping society thrive Leading by example Building a greener future
URUGUAY
50 and more From 35 to 49 Under 35 Total
2019 2020 2019 2020 2019 2020 2019 2020
Executives Men 14 16 13 14 2 1 29 31
% 29% 31% 9% 9% 2% 1% 9% 10%
Women 1 1 10 8 0 0 11 9
% 4% 3% 8% 6% 0% 0% 4% 3%
Total 15 17 23 22 2 1 40 40
% 20% 21% 9% 8% 1% 0% 6% 6%
Middle management Men 7 7 26 26 5 5 38 38
% 15% 14% 18% 17% 4% 4% 12% 12%
Women 7 8 27 27 2 1 36 36
% 27% 27% 22% 21% 1% 1% 12% 12%
Total 14 15 53 53 7 6 74 74
% 19% 19% 20% 19% 2% 2% 12% 12%
Other professionals Men 27 28 105 113 119 110 251 251
% 56% 55% 73% 74% 94% 95% 40% 40%
Women 18 21 88 95 153 152 259 268
% 69% 70% 70% 73% 122% 117% 42% 42%
Total 45 49 193 208 272 262 510 519
% 61% 60% 72% 73% 101% 93% 82% 82%
Total Men 48 51 144 153 126 116 318 320
% 15% 16% 45% 48% 40% 36% 51% 51%
Women 26 30 125 130 155 153 306 313
% 8% 10% 41% 42% 51% 49% 49% 49%
Total 74 81 269 283 281 269 624 633
% 12% 13% 43% 45% 45% 42% 100% 100%

36
MAIN NON-FINANCIAL STATEMENTS
VENEZUELA
50 and more From 35 to 49 Under 35 Total
2019 2020 2019 2020 2019 2020 2019 2020
Executives Men 17 19 21 17 0 0 38 36
% 11% 11% 5% 4% 0% 0% 4% 4%
Women 10 12 20 17 0 0 30 29
% 9% 10% 5% 4% 0% 0% 3% 3%
Total 27 31 41 34 0 0 68 65
% 10% 11% 5% 4% 0% 0% 4% 4%
Middle management Men 36 43 102 95 12 11 150 149
% 24% 26% 26% 24% 4% 4% 17% 18%
Women 31 33 98 98 22 21 151 152
% 28% 28% 24% 23% 6% 6% 17% 17%
Total 67 76 200 193 34 32 301 301
% 26% 27% 25% 24% 5% 5% 17% 18%
Other professionals Men 95 105 275 280 301 267 671 652
% 64% 63% 69% 71% 96% 96% 38% 38%
Women 70 71 296 308 365 316 731 695
% 63% 61% 71% 73% 88% 75% 41% 41%
Total 165 176 571 588 666 583 1,402 1,347
% 64% 62% 70% 72% 82% 72% 79% 79%
Total Men 148 167 398 392 313 278 859 837
% 17% 20% 46% 47% 36% 33% 49% 49%
Women 111 116 414 423 387 337 912 876
% 12% 13% 45% 48% 42% 38% 51% 51%
Total 259 283 812 815 700 615 1,771 1,713
% 15% 17% 46% 48% 40% 36% 100% 100%

37
MAIN NON-FINANCIAL STATEMENTS Helping society thrive Leading by example Building a greener future
OTHERS
50 and more From 35 to 49 Under 35 Total
2019 2020 2019 2020 2019 2020 2019 2020
Executives Men 21 19 26 26 0 0 47 45
% 19% 20% 8% 17% 0% 0% 8% 16%
Women 1 2 11 9 1 0 13 11
% 4% 3% 7% 13% 1% 0% 5% 7%
Total 22 21 37 35 1 0 60 56
% 17% 13% 8% 15% 0% 0% 7% 13%
Middle management Men 53 62 129 98 16 15 198 175
% 49% 64% 38% 64% 12% 63% 34% 64%
Women 12 20 49 51 9 9 70 80
% 48% 33% 33% 71% 10% 64% 27% 54%
Total 65 82 178 149 25 24 268 255
% 49% 52% 36% 66% 11% 63% 32% 60%
Other professionals Men 34 16 188 30 113 9 335 55
% 31% 16% 55% 19% 88% 38% 40% 13%
Women 12 39 88 12 80 5 180 56
% 48% 64% 59% 17% 54% 7% 21% 13%
Total 46 55 276 42 193 14 515 111
% 35 35 56 19 39 6 61 26
Total Men 108 97 343 154 129 24 580 275
% 19% 35% 59% 56% 22% 9% 69% 65%
Women 25 61 148 72 90 14 263 147
% 10% 41% 56% 49% 34% 10% 31% 35%
Total 133 158 491 226 219 38 843 422
% 16% 37% 58% 54% 26% 9% 100% 100%

38
MAIN NON-FINANCIAL STATEMENTS
HISPAM
50 and more From 35 to 49 Under 35 Total
2019 2020 2019 2020 2019 2020 2019 2020
Executives Men 237 233 537 461 50 41 824 735
% 4% 4% 5% 4% 1% 1% 4% 3%
Women 60 59 244 238 20 19 324 316
% 4% 4% 4% 3% 0% 0% 3% 3%
Total 297 292 781 699 70 60 1,148 1,051
% 4% 4% 5% 4% 1% 1% 3% 3%
Middle management Men 705 698 1,362 1,377 241 295 2,308 2,370
% 11% 11% 13% 13% 4% 5% 10% 11%
Women 134 147 737 747 164 143 1,035 1,037
% 9% 10% 11% 11% 4% 4% 8% 8%
Total 839 845 2,099 2,124 405 438 3,343 3,407
% 11% 11% 12% 12% 4% 5% 10% 10%
Other professionals Men 5,477 5,325 8,252 8,489 5,544 5,294 19,273 19,108
% 85% 85% 81% 82% 95% 94% 55% 55%
Women 1,335 1,321 5,677 5,918 4,224 3,882 11,236 11,121
% 87% 87% 85% 86% 63% 56% 32% 32%
Total 6,812 6,646 13,929 14,407 9,768 9,176 30,509 30,229
% 86 85 83 84 58 53 87 87
Total Men 6,419 6,256 10,151 10,327 5,835 5,630 22,405 22,213
% 29% 28% 45% 46% 26% 25% 64% 64%
Women 1,529 1,527 6,658 6,903 4,408 4,044 12,595 12,474
% 12% 12% 53% 55% 35% 32% 36% 36%
Total 7,948 7,783 16,809 17,230 10,243 9,674 35,000 34,687
% 23% 22% 48% 50% 29% 28% 100% 100%
STRUCTURE�OF�THE�BOARD�OF�DIRECTORS
Persons on the Board of Directors by gender and age in 2020
Age range Men % Women % Total %50 and more 12 86% 2 14% 14 82%
From 35 to 49 0 0% 3 100% 3 18%
Under 35 0 0% 0 0% 0 0%
Total 12 71% 5 29% 17 100%

39
MAIN NON-FINANCIAL STATEMENTS Helping society thrive Leading by example Building a greener future
TYPES OF CONTRACT
Total number and distribution of employment contract types by gender and country
Country
Permanent contract (Men)
Permanent contract (Women)
Permanent contracts
Temporary contracts (Men)
Temporary contracts (Women)
Temporary contracts
2019 2020 2019 2020 2019 2020 2019 2020 2019 2020 2019 2020
Germany 4,568 4,531 2,803 2,707 7,371 7,238 488 432 297 256 785 688
Argentina 9,895 9,207 4,622 4,411 14,517 13,618 — — — — — —
Brazil 20,051 19,922 14,201 14,392 34,252 34,314 97 47 155 71 252 118
Chile 2,802 2,902 1,302 1,329 4,104 4,231 48 35 7 3 55 38
Colombia 2,812 3,495 2,466 2,666 5,278 6,161 95 115 145 159 240 274
Ecuador 666 600 424 376 1,090 976 11 28 5 24 16 52
Spain 17,803 18,015 9,746 9,858 27,549 27,873 449 371 390 316 839 687
Mexico 1,285 1,252 597 591 1,882 1,843 — — — — — —
Peru 3,325 3,122 1,685 1,586 5,010 4,708 289 300 124 140 413 440
United Kingdom 4,119 3,793 2,753 2,461 6,872 6,254 35 39 21 29 56 68
Uruguay 318 320 305 313 623 633 — — 1 — 1 —
Vene-zuela 830 817 858 851 1,688 1,668 29 20 54 25 83 45
Others 578 268 262 144 840 412 2 7 1 3 3 10
HispAm 21,933 21,715 12,259 12,123 34,192 33,838 472 498 336 351 808 849
Total Group 69,052 68,244 42,024 41,685 111,076 109,929 1,543 1,394 1,200 1,026 2,743 2,420
País
Full-time (Men)
Full-time (Women) Full-time
Part-time contracts (Men)
Part-time contracts (Women)
Part-time contracts
2019 2020 2019 2020 2019 2020 2019 2020 2019 2020 2019 2020
Germany 4,568 4,560 1,862 1,784 6,430 6,344 488 403 1,238 1,179 1,726 1,582
Argentina 6,496 9,207 3,388 4,385 9,884 13,592 3,399 — 1,234 26 4,633 26
Brazil 17,543 17,495 9,278 9,389 26,821 26,884 2,605 2,474 5,078 5,074 7,683 7,548
Chile 2,850 2,937 1,309 1,332 4,159 4,269 — — — — — —
Colombia 2,907 3,610 2,611 2,825 5,518 6,435 — — — — — —
Ecuador 677 628 429 400 1,106 1,028 — — — — — —
Spain 18,210 18,373 10,099 10,139 28,309 28,512 42 13 37 35 79 48
Mexico 1,285 1,252 597 591 1,882 1,843 — — — — — —
Peru 3,613 3,422 1,809 1,726 5,422 5,148 1 — — — 1 —
United Kingdom 3,549 3,341 1,811 1,689 5,360 5,030 605 491 963 801 1,568 1,292
Uruguay 318 296 306 252 624 548 — 24 — 61 — 85
Vene-zuela 859 837 912 876 1,771 1,713 — — — — — —
Others 580 275 263 146 843 421 — — — 1 — 1
HispAm 19,005 22,189 11,361 12,387 30,366 34,576 3,400 24 1,234 87 4,634 111
Total Group 63,455 66,233 34,674 35,534 98,129 101,767 7,140 3,405 8,550 7,177 15,690 10,582

40
MAIN NON-FINANCIAL STATEMENTS
Average annual number of permanent, temporary and part-time contracts by gender, age and professional category (*)
Average contracts by gender
Indicators Men Women Total
2019 2020 2019 2020 2019 2020
Permanent contracts (total number) 71,931 68,478 43,103 41,745 114,494 110,223
Temporary contracts (total number) 1,590 1,432 1,262 1,087 2,852 2,519
Part-time contracts (total number) 8,289 3,984 9,005 7,589 17,294 11,573
Average contracts by age
Indicators 50 and more From 35 to 49 Under 35 Total
2019 2020 2019 2020 2019 2020 2019 2020
Permanent contracts (total number) 24,301 25,716 53,536 52,443 36,657 32,064 114,494 110,223
Temporary contracts (total number) 106 106 571 560 2,176 1,853 2,852 2,519
Part-time contracts (total number) 2,853 757 5,389 3,533 9,052 7,283 17,294 11,573
Average contracts by professional category
Indicators ExecutivesMiddle manage-
mentOther profession-
als Total
2019 2020 2019 2020 2019 2020 2019 2020
Permanent contracts (total number) 4.442 4.868 9.177 10.421 100.876 94.934 114.494 110.223
Temporary contracts (total number) 3 7 15 18 2.834 2.493 2.852 2.519
Part-time contracts (total number) 14 25 78 125 17.202 11.422 17.294 11.573
(*) The calculation is based on the cumulative average for the year by type of contract and by type of working day.

41
MAIN NON-FINANCIAL STATEMENTS Helping society thrive Leading by example Building a greener future
DIVERSITY INDICATORS
Summary of main KPIS
Indicators 2019 2020Women on the workforce (%) 38% 38%
Women in management positions (%) 26% 27%
% Women on the Board of Directors (%) 29% 29%
Women in middle management (%) 31% 31%
People with disabilities on the workforce (People) 1,087 1,118
Under 30 (%) 17% 15%
Women hired under 30 (%) 46% 47%
Cultural diversity 2020
Country Employees Nationalities Women MenGermany 7,926 80 58 67
Argentina 13,618 27 17 24
Brazil 34,432 26 14 23
Chile 4,269 19 14 17
Colombia 6,435 9 7 7
Ecuador 1,028 10 4 10
Spain 28,560 54 44 42
Mexico 1,843 15 7 14
Peru 5,148 13 10 10
United Kingdom 6,322 62 43 52
Uruguay 633 8 6 7
Venezuela 1,713 8 5 7
Others 422 35 26 25
HispAm 34,687 40 29 33
Total Group 112,349 117 92 106

42
MAIN NON-FINANCIAL STATEMENTS
DISMISSALS
Number of dismissals by gender
CountryMen Women Total
2019 2020 2019 2020 2019 2020Germany 260 182 166 99 426 281
Argentina 244 636 150 242 394 878
Brazil 2,610 1,804 2,403 1,562 5,013 3,366
Chile 243 118 113 31 356 149
Colombia 174 77 182 74 356 151
Ecuador 79 59 42 36 121 95
Spain 2,123 157 807 116 2,930 273
Mexico 237 75 147 30 384 105
Peru 633 185 363 78 996 263
United Kingdom 127 228 44 183 171 411
Uruguay 12 8 9 4 21 12
Venezuela 25 — 44 — 69 —
Others 41 6 27 5 68 11
HispAm 1,647 1,158 1,050 495 2,697 1,653
Total Group 6,808 3,535 4,497 2,460 11,305 5,995
Number of dismissals by age range
Country
50 and more From 35 to 49 Under 35 Total
2019 2020 2019 2020 2019 2020 2019 2020Germany 61 48 145 102 220 131 426 281
Argentina 197 747 136 82 61 49 394 878
Brazil 229 173 1,544 1,234 3,240 1,959 5,013 3,366
Chile 140 32 142 60 74 57 356 149
Colombia 48 12 152 71 156 68 356 151
Ecuador 6 14 65 57 50 24 121 95
Spain 2,715 69 138 151 77 53 2,930 273
Mexico 37 11 226 71 121 23 384 105
Peru 475 66 470 140 51 57 996 263
United Kingdom 42 133 64 189 65 89 171 411
Uruguay 2 1 5 5 14 6 21 12
Venezuela 6 — 23 — 40 — 69 —
Others 9 2 41 6 18 3 68 11
HispAm 911 883 1,219 486 567 284 2,697 1,653
Total Group 3,967 1,308 3,151 2,168 4,187 2,519 11,305 5,995

43
MAIN NON-FINANCIAL STATEMENTS Helping society thrive Leading by example Building a greener future
Number of dismissals by professional category
Country
Executives Middle management Other professionals Total
2019 2020 2019 2020 2019 2020 2019 2020Germany 3 7 24 22 399 252 426 281
Argentina 2 9 57 108 335 761 394 878
Brazil 8 90 326 108 4,679 3,168 5,013 3,366
Chile 3 8 37 23 316 118 356 149
Colombia 8 5 29 8 319 138 356 151
Ecuador 1 15 18 23 102 57 121 95
Spain 37 66 180 41 2,713 166 2,930 273
Mexico 6 22 87 17 291 66 384 105
Peru 5 25 53 60 938 178 996 263
United Kingdom 1 47 35 61 135 303 171 411
Uruguay — 1 1 — 20 11 21 12
Venezuela — — 1 — 68 — 69 —
Others 3 3 4 4 61 4 68 11
HispAm 25 85 283 239 2,389 1,329 2,697 1,653
Total Group 77 298 852 475 10,376 5,222 11,305 5,995

44
MAIN NON-FINANCIAL STATEMENTS
NEW�HIRES
Total number and rate of new hires by age, gender and country
Country Age range Men % Women % Total2019 2020 2019 2020 2019 2020 2019 2020 2019 2020
Germany 50 and more 77 89 5.2% 7.2% 65 66 4.41% 5.33% 142 155
From 35 to 49 301 254 20.4% 20.5% 273 183 18.51% 14.78% 574 437
Under 35 458 367 31.1% 29.6% 301 279 20.41% 22.54% 759 646
Argentina 50 and more 46 109 11.1% 12.9% 23 22 5.56% 2.60% 69 131
From 35 to 49 52 205 12.6% 24.3% 75 222 18.12% 26.27% 127 427
Under 35 131 121 31.6% 14.3% 87 166 21.01% 19.64% 218 287
Brazil 50 and more 115 86 1.6% 1.6% 83 51 1.14% 0.96% 198 137
From 35 to 49 1,103 797 15.1% 15.0% 763 624 10.48% 11.72% 1,866 1,421
Under 35 2,693 1,837 37.0% 34.5% 2,525 1,927 34.67% 36.21% 5,218 3,764
Chile 50 and more 21 15 5.1% 3.2% 2 2 0.49% 0.42% 23 17
From 35 to 49 72 136 17.6% 28.9% 44 34 10.78% 7.22% 116 170
Under 35 201 234 49.3% 49.7% 68 50 16.67% 10.62% 269 284
Colombia 50 and more 10 16 0.8% 1.3% 8 6 0.65% 0.47% 18 22
From 35 to 49 146 152 11.8% 12.0% 108 88 8.74% 6.95% 254 240
Under 35 486 554 39.4% 43.7% 477 451 38.62% 35.60% 963 1,005
Ecuador 50 and more 3 — 1.4% 0.0% 1 — 0.47% 0.00% 4 0
From 35 to 49 30 9 14.0% 8.6% 13 6 6.05% 5.71% 43 15
Under 35 103 55 47.9% 52.4% 65 35 30.23% 33.33% 168 90
Spain 50 and more 242 556 4.1% 7.6% 71 258 1.21% 3.52% 313 814
From 35 to 49 1,320 1,617 22.4% 22.1% 861 985 14.64% 13.44% 2,181 2,602
Under 35 1,980 2,323 33.7% 31.7% 1,409 1,590 23.95% 21.69% 3,389 3,913
Mexico 50 and more 4 6 1.1% 3.0% 1 3 0.28% 1.50% 5 9
From 35 to 49 113 53 31.5% 26.5% 26 36 7.24% 18.00% 139 89
Under 35 129 59 35.9% 29.5% 86 43 23.96% 21.50% 215 102
Peru 50 and more 6 10 1.0% 1.7% 1 3 0.17% 0.51% 7 13
From 35 to 49 90 123 15.2% 20.9% 74 61 12.50% 10.36% 164 184
Under 35 267 252 45.1% 42.8% 154 140 26.01% 23.77% 421 392
United Kingdom 50 and more 37 22 2.8% 3.8% 17 18 1.30% 3.10% 54 40
From 35 to 49 154 91 11.8% 15.7% 79 49 6.05% 8.43% 233 140
Under 35 578 216 44.3% 37.2% 441 185 33.77% 31.84% 1,019 401
Uruguay 50 and more — 1 0.0% 1.8% — — 0.00% 0.00% — 1
From 35 to 49 18 6 43.9% 10.9% 2 3 4.88% 5.45% 36 9
Under 35 3 21 7.3% 38.2% 18 24 43.90% 43.64% 5 45

45
MAIN NON-FINANCIAL STATEMENTS Helping society thrive Leading by example Building a greener future
Country Age range Men % Women % Total2019 2020 2019 2020 2019 2020 2019 2020 2019 2020
Venezuela 50 and more 1 — 0.4% 0.0% 3 4 1.09% 1.81% 4 4
From 35 to 49 15 11 5.5% 5.0% 18 37 6.57% 16.74% 33 48
Under 35 99 58 36.1% 26.2% 138 111 50.36% 50.23% 237 169
Others 50 and more 16 3 9.2% 8.1% 3 — 1.72% 0.00% 19 3
From 35 to 49 55 17 31.6% 45.9% 28 5 16.09% 13.51% 83 22
Under 35 44 9 25.3% 24.3% 28 3 16.09% 8.11% 72 12
HispAm 50 and more 91 157 2.6% 4.2% 39 40 1.10% 1.07% 130 197
From 35 to 49 521 695 14.7% 18.5% 360 487 10.18% 12.98% 881 1,182
Under 35 1,434 1,354 40.5% 36.1% 1,093 1,020 30.89% 27.18% 2,527 2,374
Total Group 50 and more 578 913 2.9% 5.0% 278 433 1.41% 2.37% 856 1,346
From 35 to 49 3,454 3,471 17.6% 19.0% 2,364 2,333 12.03% 12.78% 5,818 5,804
Under 35 7,187 6,106 36.6% 33.4% 5,797 5,004 29.49% 27.40% 12,984 11,110

46
MAIN NON-FINANCIAL STATEMENTS
STAFF TURNOVER
Staff turnover (voluntary, total departures, detail of total departures and breakdown of departures) by age, gender and country
Staff turnover (voluntary)
Country Age range Men % Women % Total %2019 2020 2019 2020 2019 2020 2019 2020 2019 2020 2019 2020
Germany 50 and more 43 21 0.5% 0.3% 48 25 0.6% 0.3% 91 46 1.1% 0.6%
From 35 to 49 182 78 2.2% 1.0% 155 59 1.9% 0.7% 337 137 4.1% 1.7%
Under 35 204 98 2.5% 1.2% 149 73 1.8% 0.9% 353 171 4.3% 2.1%
Argentina 50 and more 9 2 0.1% 0.01% 3 1 0.02% 0.01% 12 3 0.1% 0.02%
From 35 to 49 42 32 0.3% 0.2% 21 12 0.1% 0.1% 63 44 0.4% 0.3%
Under 35 57 48 0.4% 0.3% 33 28 0.2% 0.2% 90 76 0.6% 0.5%
Brazil 50 and more 23 14 0.1% 0.0% 13 17 0.04% 0.05% 36 31 0.1% 0.1%
From 35 to 49 318 284 0.9% 0.8% 240 176 0.7% 0.5% 588 460 1.7% 1.3%
Under 35 796 593 2.3% 1.7% 756 552 2.2% 1.6% 1,552 1,145 4.6% 3.3%
Chile 50 and more — 2 0.0% 0.05% — — 0.0% 0.0% — 2 0.00% 0.05%
From 35 to 49 33 27 0.8% 0.6% 12 5 0.3% 0.1% 45 32 1.1% 0.8%
Under 35 59 38 1.4% 0.9% 16 11 0.4% 0.3% 75 49 1.8% 1.2%
Colombia 50 and more 2 6 0.04% 0.1% 2 3 0.04% 0.0% 4 9 0.1% 0.1%
From 35 to 49 89 87 1.6% 1.4% 68 63 1.2% 1.0% 157 150 2.8% 2.4%
Under 35 149 182 2.7% 2.9% 205 134 3.7% 2.1% 354 316 6.4% 5.0%
Ecuador 50 and more 1 — 0.1% 0.00% — — 0.00% 0.00% 1 — 0.1% 0.00%
From 35 to 49 31 10 2.6% 1.0% 24 8 2.0% 0.8% 55 18 4.6% 1.7%
Under 35 71 33 6.0% 3.2% 36 20 3.0% 1.9% 107 53 9.0% 5.2%
Spain 50 and more 19 14 0.1% 0.05% 7 7 0.02% 0.02% 26 21 0.1% 0.1%
From 35 to 49 113 81 0.4% 0.3% 90 47 0.3% 0.2% 203 128 0.7% 0.5%
Under 35 179 80 0.6% 0.3% 120 63 0.4% 0.2% 299 143 1.0% 0.5%
Mexico 50 and more 3 2 0.1% 0.1% — 1 0.00% 0.1% 2 3 0.1% 0.2%
From 35 to 49 29 27 1.5% 1.5% 21 9 1.1% 0.5% 51 36 2.6% 1.9%
Under 35 27 21 2.1% 1.1% 37 16 1.9% 0.9% 78 37 4.0% 2.0%
Peru 50 and more 13 3 0.2% 0.1% 1 1 0.02% 0.02% 11 4 0.2% 0.1%
From 35 to 49 60 46 1.1% 0.9% 39 17 0.6% 0.3% 110 63 1.8% 1.2%
Under 35 78 81 2.7% 1.5% 146 67 2.4% 1.3% 315 148 5.1% 2.8%

47
MAIN NON-FINANCIAL STATEMENTS Helping society thrive Leading by example Building a greener future
Country Age range Men % Women % Total %2019 2020 2019 2020 2019 2020 2019 2020 2019 2020 2019 2020
United Kingdom 50 and more 27 15 0.4% 0.2% 9 9 0.1% 0.1% 36 24 0.5% 0.4%
From 35 to 49 107 80 1.5% 1.2% 54 44 0.8% 0.7% 161 124 2.3% 1.9%
Under 35 588 262 8.4% 4.0% 395 212 5.6% 3.3% 983 474 14.0% 7.3%
Uruguay 50 and more — 1 0.00% 0.2% — — 0.00% 0.00% — 1 0.00% 0.2%
From 35 to 49 5 4 0.8% 0.6% 4 1 0.6% 0.2% 9 5 1.4% 0.8%
Under 35 17 10 2.6% 1.6% 24 12 3.7% 1.9% 41 22 6.4% 3.5%
Venezuela 50 and more 7 2 0.4% 0.1% 3 2 0.2% 0.1% 10 4 0.6% 0.2%
From 35 to 49 35 10 2.0% 0.6% 45 10 2.6% 0.6% 80 20 4.5% 1.1%
Under 35 59 30 3.3% 1.7% 67 38 3.8% 2.2% 126 68 7.1% 3.9%
Others 50 and more 3 2 0.3% 0.5% 1 3 0.1% 0.7% 4 5 0.3% 1.2%
From 35 to 49 18 2 1.6% 0.5% 15 3 1.3% 0.7% 33 5 2.9% 1.2%
Under 35 25 3 2.2% 0.7% 13 4 1.1% 1.0% 38 7 3.3% 1.7%
HispAm 50 and more 31 18 0.1% 0.1% 9 8 0.02% 0.02% 40 26 0.1% 0.1%
From 35 to 49 336 243 0.9% 0.7% 234 125 0.6% 0.4% 570 368 1.6% 1.1%
Under 35 622 443 1.7% 1.3% 564 326 1.6% 0.9% 1,186 769 3.3% 2.2%
Total Group 50 and more 115 84 0.1% 0.1% 78 69 0.1% 0.1% 193 153 0.2% 2.4%
From 35 to 49 738 768 0.6% 0.7% 554 454 0.5% 0.4% 1,292 2,709 1.1% 1.1%
Under 35 1,792 1,479 1.5% 1.3% 1,433 1,230 1.2% 1.1% 3,225 1,222 2.7% 0.1%
(*)Turnover is calculated by dividing departures by the average headcount.

48
MAIN NON-FINANCIAL STATEMENTS
Staff turnover: Total departures
Country Age range Men % Women % Total %2019 2020 2019 2020 2019 2020 2019 2020 2019 2020 2019 2020
Germany 50 and more 114 119 1.4% 1.5% 108 107 1.3% 1.3% 222 226 2.7% 2.8%
From 35 to 49 391 302 4.7% 3.8% 315 271 3.8% 3.4% 706 573 8.6% 7.2%
Under 35 452 382 5.5% 4.8% 351 286 4.3% 3.6% 803 668 9.8% 8.4%
Argentina 50 and more 186 702 1.3% 5.1% 73 194 0.5% 1.4% 259 896 1.7% 6.5%
From 35 to 49 160 258 1.1% 1.9% 174 246 1.2% 1.8% 334 504 2.3% 3.6%
Under 35 124 147 0.8% 1.1% 103 186 0.7% 1.3% 227 333 1.5% 2.4%
Brazil 50 and more 206 140 0.6% 0.4% 81 84 0.2% 0.2% 287 224 0.8% 0.6%
From 35 to 49 1,177 1,124 3.5% 3.3% 957 722 2.8% 2.1% 2,134 1,846 6.3% 5.4%
Under 35 2,415 1,637 7.1% 4.7% 2,401 1,674 7.1% 4.9% 4,816 3,311 14.2% 9.6%
Chile 50 and more 118 34 2.8% 0.8% 30 4 0.7% 0.1% 148 38 3.5% 0.9%
From 35 to 49 135 95 3.2% 2.3% 72 39 1.7% 0.9% 207 134 4.9% 3.2%
Under 35 134 162 3.2% 3.9% 45 22 1.1% 0.5% 179 184 4.3% 4.4%
Colombia 50 and more 35 18 0.6% 0.3% 26 12 0.5% 0.2% 61 30 1.1% 0.5%
From 35 to 49 184 175 3.3% 2.8% 158 119 2.8% 1.9% 342 294 6.1% 4.6%
Under 35 387 433 7.0% 6.8% 467 378 8.4% 6.0% 854 811 15.3% 12.8%
Ecuador 50 and more 5 12 0.4% 1.2% 2 5 0.2% 0.5% 7 17 0.6% 1.7%
From 35 to 49 96 50 8.0% 4.9% 59 26 4.9% 2.5% 155 76 13.0% 7.4%
Under 35 150 55 12.6% 5.3% 95 41 8.0% 4.0% 245 96 20.5% 9.3%
España 50 and more 2,363 657 7.7% 2.3% 812 307 2.7% 1.1% 3,175 964 10.4% 3.4%
From 35 to 49 1,122 1,574 3.7% 5.5% 793 1,020 2.6% 3.6% 1,915 2,594 6.3% 9.1%
Under 35 1,749 2,124 5.7% 7.5% 1,263 1,466 4.1% 5.2% 3,012 3,590 9.8% 12.6%
Mexico 50 and more 33 17 1.7% 0.9% 9 4 0.5% 0.2% 42 21 2.1% 1.1%
From 35 to 49 271 94 13.8% 5.1% 155 47 7.9% 2.5% 426 141 21.7% 7.6%
Under 35 276 40 14.1% 2.2% 179 37 9.1% 2.0% 455 77 23.2% 4.2%
Peru 50 and more 435 121 7.0% 2.3% 144 24 2.3% 0.5% 579 145 9.3% 2.7%
From 35 to 49 424 220 6.8% 4.2% 300 108 4.8% 2.0% 724 328 11.7% 6.2%
Under 35 376 242 6.1% 4.6% 252 154 4.1% 2.9% 628 396 10.1% 7.5%
United Kingdom 50 and more 75 96 1.1% 1.5% 33 76 0.5% 1.2% 108 172 1.5% 2.6%
From 35 to 49 162 190 2.3% 2.9% 80 137 1.1% 2.1% 242 327 3.5% 5.0%
Under 35 653 348 9.3% 5.3% 426 272 6.1% 4.2% 1,079 620 15.4% 9.5%
Uruguay 50 and more — 4 0.0% 0.6% 2 — 0.3% 0.0% 2 4 0.3% 0.6%
From 35 to 49 9 8 1.4% 1.3% 6 3 0.9% 0.5% 15 11 2.3% 1.8%
Under 35 26 15 4.0% 2.4% 29 16 4.5% 2.6% 55 31 8.6% 5.0%

49
MAIN NON-FINANCIAL STATEMENTS Helping society thrive Leading by example Building a greener future
Country Age range Men % Women % Total %2019 2020 2019 2020 2019 2020 2019 2020 2019 2020 2019 2020
Venezuela 50 and more 9 5 0.5% 0.3% 7 6 0.4% 0.3% 16 11 0.9% 0.6%
From 35 to 49 48 16 2.7% 0.9% 56 48 3.2% 2.7% 104 64 5.9% 3.6%
Under 35 78 70 4.4% 4.0% 108 134 6.1% 7.6% 186 204 10.6% 11.6%
Others 50 and more 64 6 5.6% 1.4% 25 3 2.2% 0.7% 89 9 7.8% 2.2%
From 35 to 49 427 8 37.3% 1.9% 216 5 18.9% 1.2% 643 13 56.2% 3.1%
Under 35 249 4 21.7% 1.0% 141 7 12.3% 1.7% 390 11 34.1% 2.6%
HispAm 50 and more 821 913 2.3% 2.6% 293 249 0.8% 0.7% 1,114 1,162 3.1% 3.3%
From 35 to 49 1,327 916 3.7% 2.6% 980 636 2.7% 1.8% 2,307 1,552 6.3% 4.4%
Under 35 1,551 1,164 4.3% 3.3% 1,278 968 3.5% 2.8% 2,829 2,132 7.8% 6.1%
Total Grupo 50 and more 3,643 1,931 3.1% 1.7% 1,352 826 1.2% 0.7% 4,995 2,757 4.3% 2.4%
From 35 to 49 4,606 4,114 3.9% 3.6% 3,341 2,791 2.8% 2.5% 7,947 6,905 6.8% 6.1%
Under 35 7,069 5,659 6.0% 5.0% 5,860 4,673 5.0% 4.1% 12,929 10,332 11.0% 9.2%
(*)Turnover is calculated by dividing departures by the average headcount.

50
MAIN NON-FINANCIAL STATEMENTS
Staff turnover: Detail of total departures(3)
Country
TotalDismissals
(%)Voluntary
resignations (%)Departures due to attrition (1) (%)
Other departures (2) (%)
2019 2020 2019 2020 2019 2020 2019 2020 2019 2020
Germany 21.0% 18.4% 5.2% 3.5% 9.5% 4.4% 3.6% 10.3% 2.7% 0.2%
Argentina 5.5% 12.5% 2.7% 6.3% 1.1% 0.9% 1.6% 2.9% 0.2% 2.4%
Brazil 21.3% 15.6% 14.7% 9.8% 6.3% 4.7% 0.05% 0.01% 0.2% 1.1%
Chile 12.7% 8.5% 8.5% 3.6% 2.9% 2.0% 1.3% 0.2% 0.1% 2.7%
Colombia 22.6% 17.9% 6.4% 2.4% 9.3% 7.5% 6.8% 7.9% 0.1% 0.1%
Ecuador 34.1% 18.4% 10.1% 9.2% 13.7% 6.9% 1.2% 1.9% 9.1% 0.3%
Spain 26.5% 25.2% 9.6% 1.0% 1.7% 1.0% 2.2% 17.8% 12.9% 5.3%
Mexico 47.0% 12.9% 19.6% 5.7% 6.7% 4.1% 1.0% 0.7% 19.8% 2.4%
Peru 31.1% 16.4% 16.0% 5.0% 7.0% 4.1% 1.4% 3.2% 6.7% 4.2%
United Kingdom 20.4% 17.2% 2.4% 6.3% 16.8% 9.6% 0.9% 1.2% 0.3% 0.1%
Uruguay 11.2% 7.3% 3.3% 1.9% 7.8% 4.5% 0.0% 0.8% 0.2% 0.2%
Venezuela 17.4% 15.9% 3.9% 0.0% 12.3% 5.2% 0.1% 0.2% 1.1% 10.4%
Others 98.0% 7.9% 5.9% 2.6% 6.6% 4.1% 1.0% 0.2% 84.5% 1.0%
HispAm 17.2% 13.9% 7.4% 4.7% 4.9% 3.3% 2.2% 3.2% 2.7% 2.6%
Total Group 22.0% 17.7% 9.6% 5.3% 5.5% 3.6% 1.6% 6.3% 5.3% 2.5%
(1) Departures due to attrition: Maternity leave, paternity leave and work/service leave.(2) Departures due to transfer to another Group company or change of scope.(3) % Calculated on average headcount.
Turnover: Breakdown of departures
Country
Dismissals % (3)Voluntary
resignations %
Departures due to
attrition (1) %Other depar-
tures (2) % Total
2019 2020 2019 2020 2019 2020 2019 2020 2019 2020 2019 2020 2019 2020 2019 2020 2019 2020
Germany 426 281 25% 19% 781 354 45% 24% 299 819 17% 56% 225 13 13% 1% 1,731 1,467
Argentina 394 878 48% 51% 165 123 20% 7% 235 403 29% 23% 26 329 3% 19% 820 1,733
Brazil 5,013 3,366 69% 63% 2,146 1,636 30% 30% 17 5 0.2% 0.1% 61 374 1% 7% 7,237 5,381
Chile 356 149 67% 42% 120 83 22% 23% 54 10 10% 3% 4 114 1% 32% 534 356
Colombia 356 151 28% 13% 515 475 41% 42% 380 501 30% 44% 6 8 0% 1% 1,257 1,135
Ecuador 121 95 30% 50% 163 71 40% 38% 14 20 3% 11% 109 3 27% 2% 407 189
Spain 2,930 273 36% 4% 528 292 7% 4% 688 5,067 8% 71% 3,956 1,516 49% 21% 8,102 7,148
Mexico 384 105 42% 44% 131 76 14% 32% 19 13 2% 5% 389 45 42% 19% 923 239
Peru 996 263 52% 30% 436 215 23% 25% 85 169 4% 19% 414 222 21% 26% 1,931 869
United Kingdom 171 411 12% 37% 1,180 622 83% 56% 60 78 4% 7% 18 8 1% 1% 1,429 1,119
Uruguay 21 12 29% 26% 50 28 69% 61% 0 5 0.0% 11% 1 1 1% 2% 72 46
Venezuela 69 0 23% 0.0% 216 92 71% 33% 1 4 0.3% 1% 20 183 7% 66% 306 279
Others 68 11 6% 33% 75 17 7% 52% 12 1 1% 3% 967 4 86% 12% 1,122 33
HispAm 2,697 1,653 43% 34% 1,796 1,163 29% 24% 788 1,125 13% 23% 969 905 16% 19% 6,250 4,846
Total Group 11,305 5,995 44% 30% 6,506 4,084 25% 20% 1,864 7,095 7% 35% 6,196 2,820 24% 14% 25,871 19,994(1) Departures due to attrition: Maternity leave, paternity leave and work/service leave.(2) Departures due to transfer to another Group company or change of scope.(3) % Calculated on the total number of departures.

51
MAIN NON-FINANCIAL STATEMENTS Helping society thrive Leading by example Building a greener future
Employee Net Promoter Score (eNPS) (*)
RegioneNPS Total eNPS (Men) eNPS (Women)
2019 2020 2019 2020 2019 2020Germany 21.6 54 16.8 52 29.5 57
Argentina 63.7 58 68 60 54.4 55
Brazil 72.5 79 70 70 76 76
Chile 65.4 75 63 75 70.4 76
Colombia 82.9 86 81.8 86 84.2 87
Ecuador 60.7 83 61.3 85 59.7 82
Spain 50.4 62 50.1 59 50.9 65
Mexico 67.7 81 66.7 79 70 84
Peru 15.9 35 19 34 9.1 36
United Kingdom 35.3 44 33.4 41 38 46
Uruguay 73.5 78 65.4 76 81 81
Venezuela 87.7 91 85.7 89 89.5 92
Others 39.7 43 41.6 41 36.1 46
HispAm 66 67 66 68
Total Group 58.4 65 57.3 64 60.2 70 (*)�See�definition�in�the�section�on�Our�people’s�commitment�and�motivation.
COLLECTIVE BARGAINING AGREEMENTS(*)
Percentage of employees covered by collective bargaining agreements by country
Country 2019 2020Germany — 86.1%
Argentina 75.4% 76.3%
Brazil 93.6% 93.3%
Chile 84.1% 84.6%
Spain 57.6% 63.7%
Peru 38.8% 38.8%
United Kingdom 60.9% 59.0%
Total Group 61.0% 68.5%
(*) 100% of Telefónica’s employees, in both 2019 and 2020, were covered by a labour framework that regulates their working conditions.

52
MAIN NON-FINANCIAL STATEMENTS
TRAINING
Hours�of�training�by�professional�category,�gender�and�country
Country
Hours of training
Hours of training for executives
(Men)
Hours of training for executives
(Women)
Hours of training for middle
management (Men)
Hours of training for middle
management (Women)
Hours of training for other
professionals (Men)
Hours of training for other
professionals (Women)
2019 2020 2019 2020 2019 2020 2019 2020 2019 2020 2019 2020 2019 2020
Germany 157,098 91,186 4,172 1,420 1,422 612 14,762 6,996 4,330 2,104 77,948 46,757 54,464 33,297
Argentina 431,599 353,659 6,068 2,116 1,633 485 40,926 27,239 15,281 10,114 243,625 199,950 124,066 113,755
Brazil 1,801,097 1,044,302 33,634 21,258 22,678 10,077 49,407 34,302 29,999 22,250 829,492 461,333 835,887 495,082
Chile 55,125 135,035 1,127 873 128 185 6,877 11,411 1,778 5,457 28,591 71,985 16,623 45,125
Colombia 393,048 428,988 6,668 3,566 3,586 1,927 16,576 14,310 13,787 14,059 163,200 190,994 189,232 204,132
Ecuador 22,181 47,345 1,132 1,587 235 801 2,044 3,878 1,009 1,962 10,942 23,044 6,819 16,071
Spain 901,051 1,074,212 31,097 15,622 14,152 7,178 60,372 53,868 28,979 27,122 508,064 620,435 258,387 349,987
Mexico 45,530 78,829 4,805 6,831 2,340 3,859 1,711 3,181 313 1,066 24,417 45,534 11,943 18,358
Peru 71,044 74,627 2,103 2,056 829 1,069 5,025 6,247 1,791 2,245 40,935 38,868 20,361 24,142
United King-dom 145,018 147,021 3,833 1,969 1,941 746 17,282 14,868 9,646 6,430 65,945 69,851 46,370 53,156
Uruguay 16,125 18,571 1,010 787 415 129 1,297 610 1,502 661 6,575 7,877 5,327 8,508
Venezuela 28,825 50,303 558 1,082 327 840 2,283 3,276 2,084 4,379 12,368 18,099 11,205 22,629
Others 12,228 5,047 441 430 139 125 2,832 2,239 1,214 1,161 4,004 501 3,598 591
HispAm 1,063,476 1,187,357 23,471 18,898 9,492 9,296 76,739 70,150 37,545 39,943 530,653 596,350 385,576 452,719
Total Group 4,079,968 3,549,124 96,561 59,596 47,776 28,035 221,483 182,423 113,760 99,009 2,016,106 1,795,228 1,584,282 1,384,832
Hours�of�training�per�employee�by�professional�category,�gender�and�country
Country
Hours of training per employee
Hours of training per executive
employee (Men)
Hours of training per executive
employee (Women)
Hours of training per middle
management employee (Men)
Hours of training per middle
management employee (Women)
Hours of training per other
professional employee (Men)
Hours of training per other
professional employee (Women)
2019 2020 2019 2020 2019 2020 2019 2020 2019 2020 2019 2020 2019 2020
Germany 19 12 22 8 24 11 3 12 29 12 18 11 19 12
Argentina 30 26 37 15 40 13 40 27 45 30 28 25 29 28
Brazil 52 30 32 20 47 20 33 23 48 36 47 27 63 37
Chile 13 32 17 13 10 12 20 25 14 36 12 30 14 39
Colombia 71 67 63 36 68 35 69 48 77 74 64 59 80 79
Ecuador 20 46 19 35 13 53 19 40 14 33 22 47 20 49
Spain 32 38 28 14 29 14 33 27 32 28 33 40 30 40
Mexico 24 43 21 32 22 37 21 49 22 89 25 47 25 39
Peru 13 14 17 20 15 21 16 23 15 22 13 13 12 15
United King-dom 21 23 19 9 20 7 22 20 22 17 21 24 21 27
Uruguay 26 29 35 25 38 14 34 16 42 18 26 31 21 32
Venezuela 16 29 15 30 11 29 15 22 14 29 18 28 15 33
Others 15 12 9 10 11 11 14 13 17 15 12 9 20 11
HispAm 30 34 28 26 29 29 33 30 36 39 28 31 34 41
Total Group 36 32 28 18 33 19 31 25 35 30 34 30 41 36

53
MAIN NON-FINANCIAL STATEMENTS Helping society thrive Leading by example Building a greener future
REMUNERATIONAverage remuneration and its evolution by gender, age and professional category
Telefónica Women Men Pay gap
Professional category Age rangeAverage total
remuneration (*)Average total
remuneration (*) Base salary Total remuneration
2019 2020 2019 2020 2019 2020 2019 2020
Group 33,235 31,513 41,076 39,316 19.11% 19.26% 19.09% 19.85%
Executives
50 and more 152,786 146,967 179,944 167,922 12.10% 9.42% 15.09% 12.48%
From 35 to 49 106,441 93,832 116,055 103,555 7.95% 7.18% 8.28% 9.39%
Under 35 67,018 56,829 66,394 56,432 -1.80% -1.32% -0.94% -0.70%
Middle management
50 and more 66,455 64,274 62,396 61,950 -7.37% -5.35% -6.51% -3.75%
From 35 to 49 54,387 49,952 56,372 50,266 1.07% -0.25% 3.52% 0.62%
Under 35 37,333 33,069 38,081 33,657 3.48% 4.23% 1.97% 1.75%
Other professionals
50 and more 43,633 46,012 47,053 49,385 7.23% 5.63% 7.27% 6.83%
From 35 to 49 32,857 29,909 36,432 32,818 7.97% 6.70% 9.81% 8.86%
Under 35 18,960 16,455 21,595 19,123 13.62% 15.57% 12.20% 13.95%
(*) For the purposes of reporting the average total remuneration of all the Group’s employees, all the Company’s executive positions have been grouped under the same category,�including�executives�and�managers,�given�that�the�design�of�the�remuneration�mix�(fixed�remuneration,�annual�variable�remuneration,�eligibility�for�the�long-term�incentive�plan�and�other�concepts)�is�aligned�with�the�Telefónica�Group’s�Global�Remuneration�Policy,�the�main�objective�of�which�is�to�promote�the�achievement�of�financial,�business,�value�creation�and�sustainability�objectives.
Average total remuneration includes: total base salary, bonuses, commissions and commercial incentives paid during 2019, long-term incentives paid in 2019 and in-kind benefits,�including�social�benefits,�accrued�in�2019.�
The�information�refers�to�98%�of�the�total�workforce�at�31/12/2020.�In�2020,�Venezuela�has�been�excluded�due�to�the�hyperinflationary�situation�in�the�country,�277�employees of Tempotel and 25 expatriates.
Information for 2019 includes Central America.
CEOTotal average remu-
neration ratio (*)2020 5,193,121 80:1
(*) Ratio between CEO’s total annual compensation and average total remuneration of employees based in Spain results in 80:1. This analysis includes the total remuneration accrued by the Chief Executive�Officer�(CEO)�in�2020,�which�includes�the�sum�of�the�fixed�retribution,�short-term�variable�pay,�long-term�incentives�and�benefits;�the�same�elements�have�been�considered�for�all�employees�based in Spain that were active at December 31st 2020.
Average total annual compensation ratio relative to CEO
Average total remuneration of Directors by gender
Men Women
2019 2020 2019 2020Directors 153,000 147,987 883,397 1,018,361

54
MAIN NON-FINANCIAL STATEMENTS
Minimum wage paid in EFT / Local SMI
Country Women MenGermany 1.0 1.0
Argentina 2.3 2.3
Brazil 1.0 1.0
Chile 1.0 1.0
Colombia 1.0 1.0
Ecuador 1.0 1.0
Spain 1.0 1.0
Mexico 4.0 3.2
Peru 1.0 1.0
United Kingdom 1.0 1.0
Uruguay 1.8 1.9
Gross�and�adjusted�pay�gap�
PAY GAP
Country Employees % Men % Women Gross gap (%) Adjusted gap (%)
2019 2020 2019 2020 2019 2020 2019 2020 2019 2020
Total Group (1) 111,173 109,703 62% 62% 38% 38% 19.09% 19.85% 3.10% 2.50%
Germany 8,018 7,801 62% 63% 38% 37% 22.75% 20.63% 4.40% 3.93%
Argentina 14,459 13,599 68% 68% 32% 32% 6.81% 8.21% 1.57% 1.61%
Brazil 34,194 34,255 59% 58% 41% 42% 22.12% 23.34% 4.58% 3.65%
Chile 4,159 4,266 69% 69% 31% 31% 18.64% 12.91% 6.72% 3.86%
Colombia 5,277 6,160 53% 57% 47% 43% 26.24% 19.89% 5.92% 4.95%
Ecuador 1,099 1,026 61% 61% 39% 39% 21.88% 17.67% -2.01% -1.51%
Spain 28,348 28,268 64% 65% 36% 35% 14.88% 15.38% 3.41% 2.48%
Mexico 1,874 1,840 68% 68% 32% 32% 5.77% 6.07% 1.04% 1.65%
Peru 5,419 5,185 67% 66% 33% 34% 5.21% 6.77% 3.02% 3.38%
United Kingdom 6,862 6,251 60% 61% 40% 39% 16.65% 14.07% 1.60% 1.18%
Uruguay 624 632 51% 50% 49% 50% 37.71% 32.20% 3.84% 2.37%
Others (2) 840 420 69% 65% 31% 35% 25.17% 29.42% — —
(1)�Information�from�all�Telefónica�Group�countries�except�Venezuela,�due�to�the�country’s�hyperinflationary�economic�situation,�277�Tempotel�employees�and�25�expatriates.(2)�Rest�includes�other�countries�such�as:�Bolivia,�Brussels,�China,�Denmark,�Estonia,�France,�Greece,�Holland,�Hungary,�Ireland,�Italy,�Luxembourg,�Poland,�Portugal,�Puerto�Rico, Romania, Sweden, Switzerland, USA.(3)�The�adjusted�gender�pay�gap�is�calculated�using�a�mathematical�regression�model�that�relates�average�total�pay�to�factors�other�than�gender.�Factors�such�as�country,�occupational category, functional area in which the employee works, seniority, legal entity and working time pattern (full-time or part-time).
Calculation of the pay gap
To calculate the gross pay gap, the average total remuneration of men minus the average total remuneration of women was divided by the average total remuneration of men.
The average total remuneration includes all pay items paid during the year under analysis. These remuneration items are: ›› Annualised Base Salary›› Short-term Variable Remuneration: Bonuses, commissions, commercial incentives and other variable remuneration items paid. ››�Benefits�in�kind,�including�social�benefits,�accrued�in�the�year.�›› Long-term variable remuneration: Incentives (shares) paid. The scope of this analysis considers all active employees of the Telefónica Group at 31 December of the corre-
sponding year.

55
MAIN NON-FINANCIAL STATEMENTS Helping society thrive Leading by example Building a greener future
Suppliers
Impact of our business on society
Volume of purchases awarded %/Total
24,268M€1 awarded to: 9,038 suppliers. 77% of purchases awarded to
local suppliers.
34%MOBILITY
22%SERVICES AND WORKS
20%SERVICES AND WORKS
11%B2B / B2C
9%TI
4%ADVERTISING AND MARKETING
(1) Agreements negotiated by Procurement with impact on 2019.
RESULTS OF CORPORATE AUDITSAverage score obtained by suppliers according to subject mat-ter (% compliance)
2019 2020Business Principles 90% 90%
Human resources� 89% 93%
Health and safety� � 88% 93%
Environment 89% 89%
(1) Significant social or environmental impacts are considered to be the critical non-conformities� � � � � � � � � � � � �identified during the audits in each area.� � � � � � �
Summary of key indicators
Indicators 2019 2020
Activity
Volume of purchases awarded 25,274M 24,268M
Suppliers awarded 9,973 9,038
% of purchases awarded locally 83% 77%
Ethics and Compliance
High-risk sustainability suppliers identified in our global analysis� � � � � � � 1,969 1,700
High-risk suppliers assessed on sustainability aspects by EcoVadis� � � � � � � 1,131 1,157
% suppliers evaluated by Dow Jones Risk & Compliance Service 100% 100%
Suppliers blocked for non-compliance with ethical or sustainability aspects 15 9
Total audits on suppliers 18,359 16,105
High-risk suppliers with improvement plans� � � � 687 560

56
MAIN NON-FINANCIAL STATEMENTS
Details of the Annual Audit Plan Audited risk aspects
Supplier type Region/countryOngoing audits and improvement plans Ethical
Working conditions
Health and safety
Supply chain man-agement
Human rights (child/ forcedlabour)
Conflict minerals
Environ-ment
Safety, privacy and DP
ALLIES PRO-GRAMME Labour-in-tensive collaborator companies.
6 countries in Latin America(1) and Spain
LOCAL• 5,807 administrative
audits.• 9,197 on-site audits.• 213 suppliers with
improvement plans.
Brazil, Colombia, Spain and Peru
CORPORATE• 65 on-site audits.• 84 suppliers with im-
provement plans(2). JAC INITIATIVE Manufacturing centres in the ICT sector.
10 countries in Asia, Latin Amer-ica and Eastern Europe
• 60 on-site audits: 63% on Tier 2 or 3 suppliers.
• ´ 34 suppliers with improvement plans.
TELEFÓNICA GERMANY For risk associated with the product or service.
Germany
• 1 administrative audit.• 1 supplier with an
improvement plan • 2 on-site audits.• 2 suppliers with im-
provement plans. TELEFÓNICA ARGENTINA For risk associated with the product or service
Argentina • 3 on-site audits. TELEFÓNICA BRASILFor risk associated with the product or service
Brazil
• 168 administrative audits.
• 102 suppliers with improvement plans.
• 88 on-site audits. • 86 suppliers with improvement plans.
TELEFÓNICA ESPAÑA For risk associated with the product or service
Spain• 1 on-site audit. • 1 supplier with an
improvement plan.
TELEFÓNICA UNITED KINGDOM Network providers, services and works.
Various countries
• 40 administrative audits.
• 30 suppliers with improvement plans.
• 668 on-site audits.• 2 suppliers with im-
provement plans. • 3 on-site audits.• 3 suppliers with im-
provement plans. • 1 on-site audit.• 2 suppliers with im-
provement plans. TELEFÓNICA VENEZUELA For risk associated with the product or service.
Venezuela • 1 on-site audit.
Social Environ-mental
Total audits per aspect 15,799 338
Suppliers with improvement plans 336 253 (1) Argentina, Brazil, Chile, Colombia, Mexico and Peru.(2) This also includes suppliers audited in 2019 whose improvement plans were open at the end of the year. The�decision�on�how�to�conduct�on-site�audits�has�always�been�subject�to�compliance�with�local�mobility�restrictions�by�COVID-19�ensuring�at�all�times�the�health�of�the�people involved in the process.

57
MAIN NON-FINANCIAL STATEMENTS Helping society thrive Leading by example Building a greener future
Human�Rights���
Summary of key indicators
Indicators(*) 2019 2020Number of employees trained in human rights through the Responsible Business Principles course since its launch 107,017 103,934
Number�of�operators�subjected�to�a�human�rights�impact�assessment(**) 12 12
%�of�operators�subjected�to�a�human�rights�impact�assessment(**) 100 100
Number of on-site human rights audits of suppliers (labour issues, child/forced labour, health and safety, privacy and security) 11,601 10,090
Number of human rights queries/complaints received through the Re-sponsible Business Channel(***) 0 3
(*)�Regarding�the�number�of�significant�investment�agreements�signed�with�human�rights�clauses:�no�significant�investment�agreements�were�signed�by�Telefónica�S.A.�at�the�corporate�level�during�the�reporting�period.�Significant�investment�agreements�are�those�that�have�brought�Telefónica�S.A.�into�a�position�of�control�of�another�entity�and�have�initiated�a�capital�investment�project�that�is�material�to�the�financial�accounts.�
(**) Data for 2019 refers to assessments conducted since 2013. Data for 2020 refers to assessments carried out in that year. (***)�The�well-founded�complaints�filed�via�the�internal�complaints�channel�regarding�human�rights�issues�such�as�privacy,�harassment,�mobbing�and�discrimina-tion are covered in the Chapter on Ethics and Compliance (Complaint and remedy mechanisms: Consultation and complaint channels).

MAIN NON-FINANCIAL STATEMENTS
58
MAIN NON-FINANCIAL STATEMENTS
Construir un futuro más verde
Building a greener future
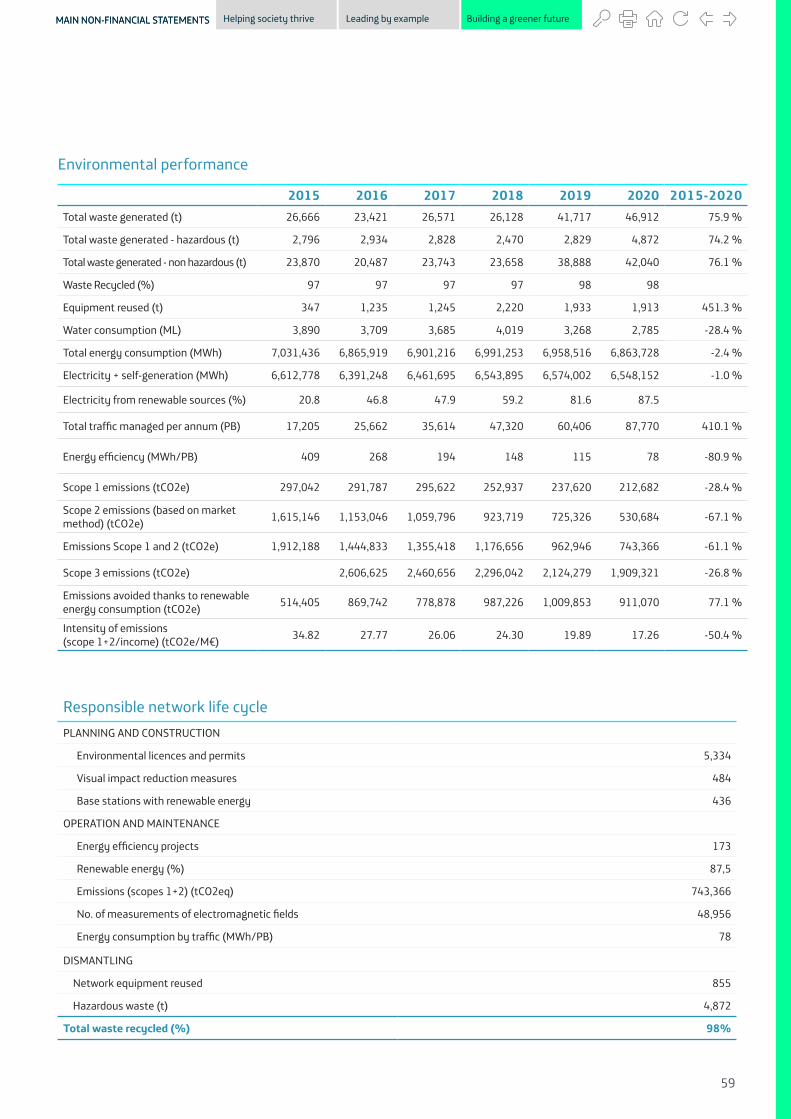
59
MAIN NON-FINANCIAL STATEMENTS Helping society thrive Leading by example Building a greener futureMAIN NON-FINANCIAL STATEMENTS
Environmental performance
2015 2016 2017 2018 2019 2020 2015-2020Total waste generated (t) 26,666 23,421 26,571 26,128 41,717 46,912 75.9 %
Total waste generated - hazardous (t) 2,796 2,934 2,828 2,470 2,829 4,872 74.2 %
Total waste generated - non hazardous (t) 23,870 20,487 23,743 23,658 38,888 42,040 76.1 %
Waste Recycled (%) 97 97 97 97 98 98
Equipment reused (t) 347 1,235 1,245 2,220 1,933 1,913 451.3 %
Water consumption (ML) 3,890 3,709 3,685 4,019 3,268 2,785 -28.4 %
Total energy consumption (MWh) 7,031,436 6,865,919 6,901,216 6,991,253 6,958,516 6,863,728 -2.4 %
Electricity + self-generation (MWh) 6,612,778 6,391,248 6,461,695 6,543,895 6,574,002 6,548,152 -1.0 %
Electricity from renewable sources (%) 20.8 46.8 47.9 59.2 81.6 87.5
Total�traffic�managed�per�annum�(PB) 17,205 25,662 35,614 47,320 60,406 87,770 410.1 %
Energy�efficiency�(MWh/PB) 409 268 194 148 115 78 -80.9 %
Scope 1 emissions (tCO2e) 297,042 291,787 295,622 252,937 237,620 212,682 -28.4 %
Scope 2 emissions (based on market method) (tCO2e) 1,615,146 1,153,046 1,059,796 923,719 725,326 530,684 -67.1 %
Emissions Scope 1 and 2 (tCO2e) 1,912,188 1,444,833 1,355,418 1,176,656 962,946 743,366 -61.1 %
Scope 3 emissions (tCO2e) 2,606,625 2,460,656 2,296,042 2,124,279 1,909,321 -26.8 %
Emissions avoided thanks to renewable energy consumption (tCO2e) 514,405 869,742 778,878 987,226 1,009,853 911,070 77.1 %
Intensity of emissions (scope�1+2/income)�(tCO2e/M€) 34.82 27.77 26.06 24.30 19.89 17.26 -50.4 %
Responsible network life cyclePLANNING AND CONSTRUCTION
Environmental licences and permits 5,334
Visual impact reduction measures 484
Base stations with renewable energy 436
OPERATION AND MAINTENANCE
Energy efficiency projects� � 173
Renewable energy (%) 87,5
Emissions (scopes 1+2) (tCO2eq) 743,366
No. of measurements of electromagnetic fields� � � � � 48,956
Energy consumption by traffic (MWh/PB)� � � � 78
DISMANTLING
Network equipment reused 855
Hazardous waste (t)� � 4,872
Total waste recycled (%) 98%

60
MAIN NON-FINANCIAL STATEMENTS
Energy and Climate Change
Performance 2020 - Global
KPI2025
target Value base year Value 2020 Evolution
Energy�consumption�pertraffic -90% 408.7 MWh/PB 78.2 MWh/PB -80.9%
GHG�emissions�(Scopes�1+2) -70% 1.91 MtCO2 0.74 MtCO2 -61.1%
Scope 3 Emissions -39% 2.61 MtCO2 1.91 MtCO2 -26.8%
% Renewable electricity consumption 85% 20.8 % 87.5 %
Performance 2020 - Four main markets
KPI2025
target Value base year Value 2020 Evolution
Energy�consumption�per�traffic -90% 366.1 MWh/PB 79.1 MWh/PB -78.4%
GHG�emissions�(Scopes�1+2) -90% 1.1 MtCO2 0.25 MtCO2 -78.1%
Scope 3 Emissions -39% 1.53 MtCO2 1.13 MtCO2 -25.9%
% renewable electricity consumption 100% 30.1 % 100 %
Key energy and climate change indicators
2015 2016 2017 2018 2019 2020
Energy from renewable sources (%) 20.8% 46.8% 47.9% 59.2% 81.6% 87.5%
Energy�consumption�by�traffic� (MWh/PB) 409 268 194 148 115 78
%�increase�in�energy�efficiency� (base year: 2015) _ -34.5% -52.6% -63.8% -71.8% -80.9%
GHG�emissions�Scope�1+2� (market method) (tCO2eq) 1,912,188 1,444,833 1,355,418 1,176,656 962,946 743,366

61
MAIN NON-FINANCIAL STATEMENTS Helping society thrive Leading by example Building a greener future
Consumption by country
28%
78%
27%
12%
25%
6%
11%
1%1%
Total consumption: 6,548 GWh
9%
2%
Hispam�Brazil Spain GermanyUK
Electricity consumption
44%
35%
Cell Sites
Fixed Switch Sites
Mobile Telephone Switching
Offices�(MTSOs)
Data Centers
Telxius
Offices
Others
7%
5%5%
Total consumption: 6,548 GWh
3% 1%
ENERGY 2015 2016 2017 2018 2019 2020
Total energy consumption (MWh) 7,031,436 6,865,919 6,901,216 6,991,253 6,958,516 6,863,728
Electricity consumption + self-generation (MWh) 6,612,778 6,391,248 6,461,695 6,543,895 6,574,002 6,548,152
Fuel and district heating (MWh) 418,658 474,670 439,521 447,358 384,514 315,576
Electricity from renewable sources (%) 20,8 46,8 47,9 59,2 81,6 87,5
Total annual traffic managed� � � � (Petabytes) 17,205 25,662 35,614 47,320 60,406 87,770
Emissions and energy
Traffic
HGH�emissions�(Scope�1and2)�ktCO2
Energy consumption (GWh)Traffic�(PB)
8.000
7,000
6,000
5,000
4,000
3,000
2,000
1,000
0
90,000
80,000
70,000
60,000
50,000
40,000
30,000
20,000
10,000
02015 202020172016 20192018
411%
-61%
-2%
Energy�saving�in�energy�efficiency�projects
Total 192,4 GWh
Network transformation Climate control Modernization of network equipmentLightingPower Saving FeaturesOthers

62
MAIN NON-FINANCIAL STATEMENTS
Scope 3 Emissions
tCO2
2,606,625
2016
2,460,656
2017
2,296,042
2018
2,124,279
2019
1,909,321
2020
-26.8%
52.1 %35.3 %
4.0 %
0.6 %8.1 %
Purchased goods and servicesCapital goodsFuel- and energy-related activitiesBusiness TravelUse of sold products
Emissions Unit 2015 2016 2017 2018 2019 2020Evolution
2015-2019
Scope 1 tCO2e 297,042 291,787 295,622 252,937 237,620 212,682 -28.4%
Scope 2 (based on market method)
tCO2e 1,615,146 1,153,046 1,059,796 923,719 725,326 530,684 -67.1%
Scope 1+2 tCO2e 1,912,188 1,444,833 1,355,418 1,176,656 962,946 743,366 -61.1%
Emissions offsets (1) tCO2e _ _ _ _ _ 78,101 NA
Net emissions(2) tCO2e 1,912,188 1,444,833 1,355,418 1,176,656 962,946 665,265 NA
Scope 3 tCO2e 2,606,625 2,460,656 2,296,042 2,124,279 1,909,321 -26.8%
Emissions avoided due to renewable energy consumption
tCO2e 514,405 869,742 778,878 987,226 1,009,853 911,070 77.1%
Intensity of emissions tCO2e/M€ 34.82 27.77 26.06 24.30 19.89 17.26 -50.4%
(1)�Emissions�offset�by�purchase�of�carbon�credits�in�certified�projects.(2) Net emissions after offsetting through purchase of carbon credits [Scope 1 + 2(market) - Emissions offsets].
Emissions

63
MAIN NON-FINANCIAL STATEMENTS Helping society thrive Leading by example Building a greener future
Circular Economy
Water consumption by Telefónica vs. Water Stress (*)
0 21 3 4
Low<10%
CO
UY
BR
Medium-Low10-20%
EC
UKAR
2-3�Medium-High20-40%
DE
VE
PE
High40-80%
MX
ES
CH
Levels�of�water�stress�(0-Low,�4-High)�according�to�the�Aqueduct�Baseline�Water�Stress�Atlas,�of�the�World�Resources�Institute. https://www.wri.org/applications/aqueduct/country-rankings/
(*)�The�size�of�the�drops�reflects�the�consumption�of�water�by�country�as�opposed�to�the�percentage�of�water�stress.
Water consumption in all areas (ML)
2018 2019 2020
4,019 3,268 2,785
Water consumption in high-water-stress areas (ML)
Water consumption in countries with high levels of water stress according to the Aqueduct Baseline Water Stress Atlas, from the World
Resources Institute (Spain, Chile and Mexico).
2018 2019 2020
1,332 806 750

64
MAIN NON-FINANCIAL STATEMENTS
Moving towards a Zero Waste company1
46,912 t.Totals
Total Waste
Recycled98%
10%Hazardous�Waste (HW)
5% Other hazardous (ej.�Cables�and�hazardous WEEE, toner, fluorescents,�oils)
5% Batteries
Hazardous�Waste (NHW))
90%
77% Cables
2% Paper
11% WEEE (waste electrical and electronic equipment)
Tonnes1�Zero�waste�to�landfill
Equipment reused
Totals3,974,084 units
Routers and Decoders 3,762,298 units
Mobile telephones 209,388 units
Donated equipment 1,543 units
Operations�and�office�equipment 855 units

65
MAIN NON-FINANCIAL STATEMENTS Helping society thrive Leading by example Building a greener future
Telefónica’s waste2018 2019 2020
Total waste generated (t) (this excludes re-use as it is not considered waste until its useful life has ended) 26,128 41,717 46,912
Non-hazardous waste (%) 91% 93% 90%
Hazardous�waste�(%) 9% 7% 10%
Processing prioritised according to the waste hierarchy principleEquipment reused (t) 2,220 1,933 1,913
Waste recycled (t) 25,357 41,051 45,972
Waste to energy recovery (t) 22 34 18
Other treatments (t) 68 83 554
Waste�sent�to�landfill�and�incineration�(t) 681 550 368
Waste diverted from disposal. Includes recycling, reuse and other treatments
Total waste diverted from disposal (t) 27,645 43,066 48,439
Non-hazardous waste diverted from disposal (t) 25,267 40,350 43,628
Hazardous�waste�diverted�from�disposal�(t) 2,378 2,716 4,811
Waste directed to disposal. Includes energy recovery, incineration and landfillTotal waste directed to disposal (t) 703 584 386
Non-hazardous waste directed to disposal (t) 611 471 324
Hazardous�waste�directed�to�disposal�(t) 93 113 61
Other treatments: These includes physical treatments, biological treatments, secure cells and intermediate treatments prior to recycling.
Waste: It excludes building and demolition waste as this is not hazardous waste and does not represent more than 5% of the total waste generated. Therefore, it is not considered to be material in the reporting.
Breakdown of waste by type and disposal method 2018 2019 2020
Non-hazardous waste (NHW)
Total�NHW�produced�(t) 23,658 38,888 42,040
NHW�recycled�(t) 23,012 38,352 41,213
NHW�energy�recovery�(t) — 31 1
Other�NHW�treatments�(t)� 35 65 502
NHW�landfill�and�incineration�(t) 611 440 323
Hazardous waste (HW)Total�HW�produced�(t) 2,470 2,829 4,872
HW�recycled�(t) 2,345 2,698 4,758
HW�energy�recovery�(t) 22 3 17
Other�HW�treatments�(t)� 33 18 53
HW�landfill�and�incineration�(t) 71 110 45
Other treatments: These includes physical treatments, biological treatments, secure cells and intermediate treatments prior to recycling.
Waste: It excludes building and demolition waste as this is not hazardous waste and does not represent more than 5% of the total waste generated. Therefore, it is not considered to be material in the reporting.
