consolidated report on outreach of institutional finance
TRANSCRIPT

REPORT OF THE
WORKING GROUP ON
OUTREACH OF INSTITUTIONAL FINANCE,
COOPERATIVES AND
RISK MANAGEMENT
FOR THE 12TH FIVE YEAR PLAN(2012-17)
PLANNING COMMISSION
NOVEMBER 2011

I
Contents Chapter No.
Title Page No.
Foreword II List of Tables III List of Charts and Boxes IV List of Annexures IV List of Abbreviations VI I Introduction 1 II Flow of Credit to Agriculture 10 III Cooperative Credit Institutions 44 IV Risk mitigation 65 V Micro Finance Institutions 119 VI Summary & Recommendations 133 Annexure 156

II
Foreword
Guided by the 12th Five Year Plan’s objective of faster, more inclusive and
sustainable growth, the Working Group has approached the given task.
We believe that making quantitative projections is important, but equally
important is to deal with the emerging issues relating to the architecture,
content and the direction of institutional credit. Our recommendations
therefore have focused on these issues also.
In this endeavour, we have benefitted immensely from our interactions
with Prof. Abhijit Sen, Member, Planning Commission and other
Members of the Steering Committee. I would like to thank all the
Members of the Working Group and the Chairmen of the Sub Groups for
their valuable contributions. I have a special word of commendation for
Dr. Prakash Bakshi, Chairman, NABARD and Member Secretary of the
Working Group who not only gave off himself freely and without reserve
but also placed institutional resources at the disposal of the Working
Group. I would also like to acknowledge the team of Officers from the
Department of Economic Analysis & Research, NABARD for their
unstinted support to the Working Group.
Dr Y.S.P. Thorat Chairman 15th November 2011

III
LIST OF TABLES
Table 1 : List of meetings held by the Working Group
Table 2.1: Share of Debt of Cultivator Households from Different Sources
Table 2.2: Growth of GDP (Overall) and GDP (Agriculture) during 10th & 11th FYP
Table 2.3: Trends in the Number of Accounts and Amount in 11th FYP (2007-08 to 2009-10) in Ground Level Credit Flow under Agriculture- All India
Table 2.4: Change in the average size of holding over decades Table 2.5: Outstanding Credit of Scheduled Commercial Banks
Table 2.6: Outstanding Credit of Scheduled Commercial Banks According to Occupation, BSR (Various issues)
Table 2.7: Trends in Production and Investment Credit in the Tenth and Eleventh Five Year Plan
Table 2.8: Region wise share in Agriculture Credit- Tenth and Eleventh
Five Year Plan
Table 2.9: Compound Growth Rate of Area under Major Crops
Table 2.10: Area under Major Crops
Table 2.11: All India Compound Growth Rates of Area, Production and Yield of Major Crops
Table 2.12: Aggregate Ground Level Credit Flow to Agriculture Sector during 12th FYP- Projections
Table 2.13: Scenario 1A: Projections of GLC for agriculture and allied activities for XII FYP (2012-17)
Table 2.14: Scenario 2: Projections of GLC for agriculture and allied activities for XII FYP (2012-17)
Table 2.15: Scenario 2 A: Projections of GLC for agriculture and allied activities for XII FYP (2012-17)
Table 2.16: Projections of GLC for agriculture and allied activities for XII
FYP (2012-17)
IV
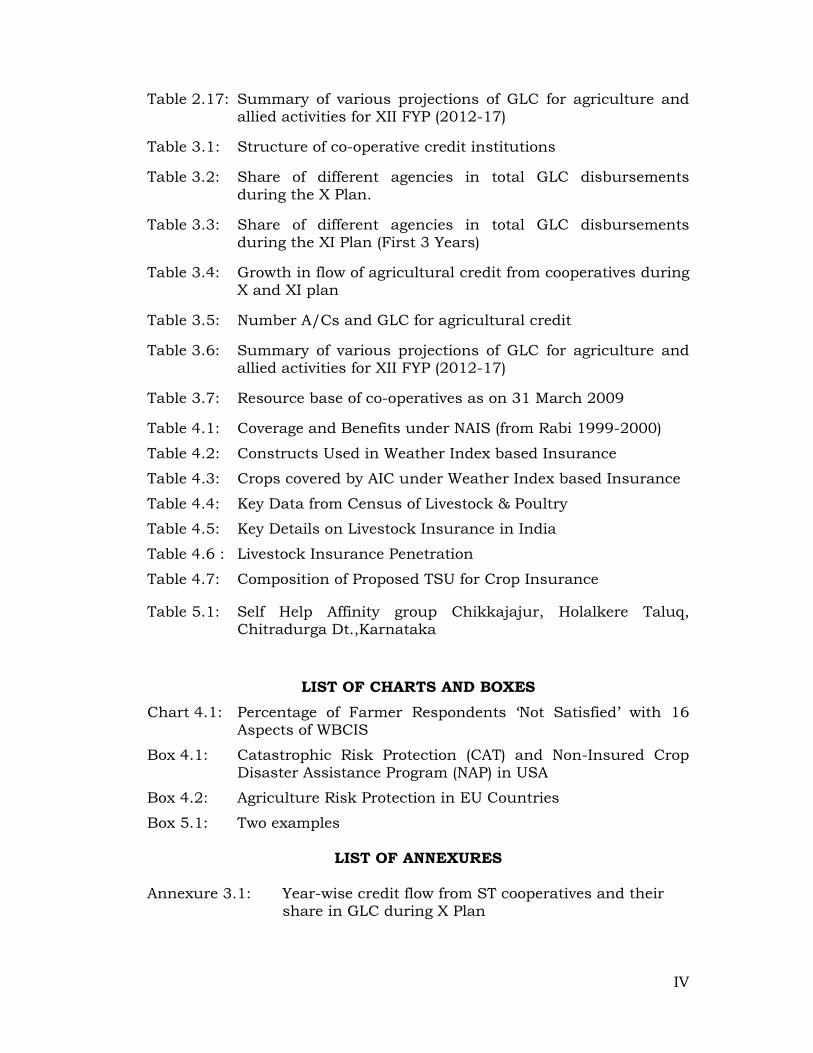
Table 2.17: Summary of various projections of GLC for agriculture and allied activities for XII FYP (2012-17)
Table 3.1: Structure of co-operative credit institutions
Table 3.2: Share of different agencies in total GLC disbursements during the X Plan.
Table 3.3: Share of different agencies in total GLC disbursements during the XI Plan (First 3 Years)
Table 3.4: Growth in flow of agricultural credit from cooperatives during X and XI plan
Table 3.5: Number A/Cs and GLC for agricultural credit
Table 3.6: Summary of various projections of GLC for agriculture and allied activities for XII FYP (2012-17)
Table 3.7: Resource base of co-operatives as on 31 March 2009
Table 4.1: Coverage and Benefits under NAIS (from Rabi 1999-2000)
Table 4.2: Constructs Used in Weather Index based Insurance
Table 4.3: Crops covered by AIC under Weather Index based Insurance
Table 4.4: Key Data from Census of Livestock & Poultry
Table 4.5: Key Details on Livestock Insurance in India
Table 4.6 : Livestock Insurance Penetration
Table 4.7: Composition of Proposed TSU for Crop Insurance
Table 5.1: Self Help Affinity group Chikkajajur, Holalkere Taluq, Chitradurga Dt.,Karnataka
LIST OF CHARTS AND BOXES Chart 4.1: Percentage of Farmer Respondents ‘Not Satisfied’ with 16
Aspects of WBCIS
Box 4.1: Catastrophic Risk Protection (CAT) and Non-Insured Crop Disaster Assistance Program (NAP) in USA
Box 4.2: Agriculture Risk Protection in EU Countries
Box 5.1: Two examples
LIST OF ANNEXURES
Annexure 3.1: Year-wise credit flow from ST cooperatives and their share in GLC during X Plan
V
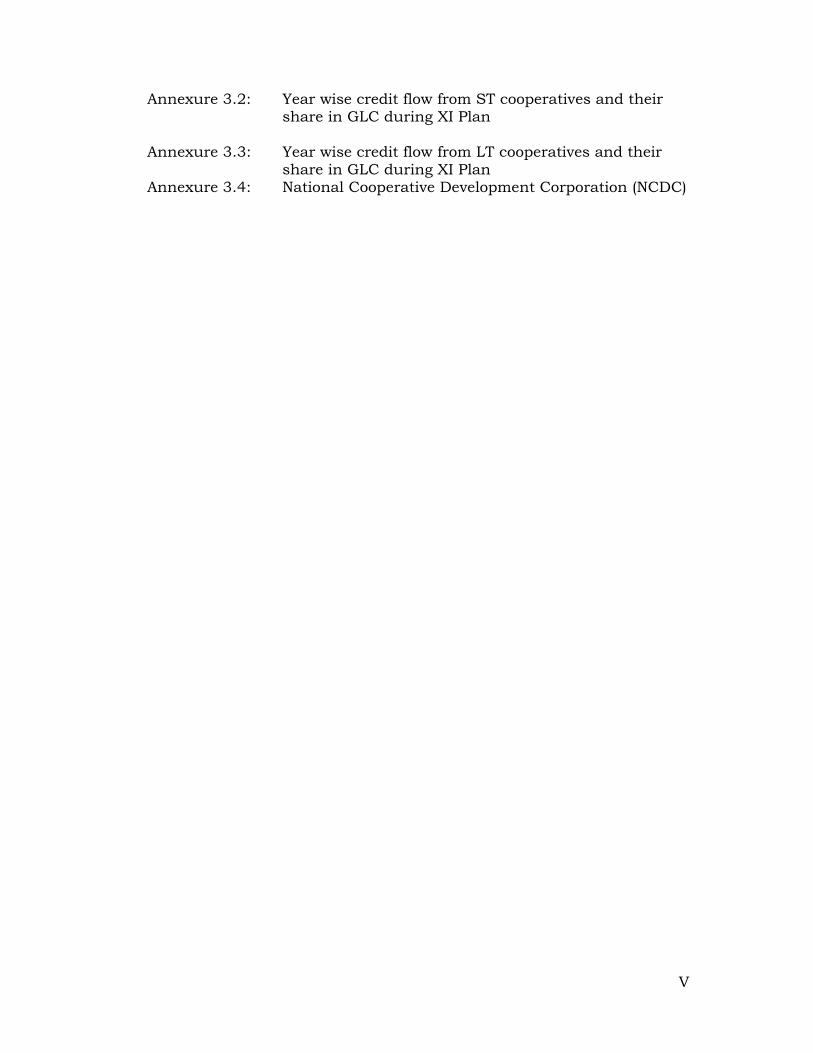
Annexure 3.2: Year wise credit flow from ST cooperatives and their share in GLC during XI Plan
Annexure 3.3: Year wise credit flow from LT cooperatives and their
share in GLC during XI Plan Annexure 3.4: National Cooperative Development Corporation (NCDC)

VI
List of Abbreviations ADWDR: Agriculture Debt Waiver and Debt Relief Scheme AIC: Agriculture Insurance Company AIDIS: All India Debt and Investment Survey AP: Andhra Pradesh ASP: Application Service Provider BC: Business Correspondent BR Act: Banking Regulation Act CAGR : Compound Annual Growth Rate CB: Commercial Banks CBS: Core Banking Solution CCB: Central Cooperative Bank CCE: Crop Cutting Experiment CCIS: Comprehensive Crop Insurance Scheme CD: Credit-Deposit CEO: Chief Executive Officer CMIE: Centre for Monitoring Indian Economy CSA: Cooperative Societies Act CSMS: Core Subsidy Management System DICGC: Deposit Insurance and Credit Guarantee Corporation FCIC: Federal Crop Insurance Corporation FYP: Five Year Plan GDP: Gross Domestic Product GHG: Green House Gas GIC: General Insurance Corporation GIPSA: General Insurance Public Sector Association GLC: Ground Level Credit GoI: Government of India HRD: Human Resource Development IARI: Indian Agriculture Research Institute ICB: Institutional Capacity Building ICOR: Incremental Capital-Output Ratio IMD: Indian Meteorological Department IPDSS: Institutional Protection and Deposit Safety Scheme IRDP: Integrated Rural Development Programme JLG: Joint Liability Group KCC: Kisan Credit Card KYC: Know Your Customer LTCCS: Long Term Cooperative Credit Structure MCI: Mutual Crop Insurance MCII: Mutual Crop Income Insurance MFI: Micro Finance Institutions MIS: Management Information System MNAIS: Modified National Agriculture Insurance Scheme MoRD: Ministry of Rural Development MoU: Memorandum of Understanding

VII
MPCI: Multiple Peril Crop Insurance MSCSA: Multi State Cooperative Societies Act NABARD: National Bank for Agriculture and Rural Development NABFINS: NABARD Financial Services NAIS: National Agriculture Insurance Scheme NBFC: Non-Banking Financial Company NCDC: National Cooperative Development Corporation NGO: Non- Governmental Organisation NIA: National Insurance Academy NREGA: National Rural Employment Guarantee Act NRLM: National Rural Livelihood Mission NSSO: National Sample Survey Organisation PACS: Primary Agricultural Credit Societies PCIS: Pilot Crop Insurance Scheme PSF: Price Stabilisation Fund RBI: Reserve Bank of India RCS: Registrar Cooperative Societies RFID: Radio Frequency Identification RRB: Regional Rural Bank S&M: Small and Marginal SCB: State Cooperative Bank SF/ MF: Small Farmer/ Marginal Farmer SFDA: Small Farmer Development Agency SHG: Self Help Group STCCS: Short Term Cooperative Credit Structure TOPS: Terrestrial Observation and Protection System ToR: Terms of Reference TSU: Technical Support Unit WBCIS: Weather risk-Based Crop Insurance Scheme WG: Working Group

1
Chapter I
Introduction
1.1 Context
In the context of preparing the Twelfth Five Year Plan (2012-2017),
Planning Commission, GoI constituted a Working Group with the
following composition and Terms of Reference:
1.2 The composition of the Working Group is as under:
(i) Dr. Y.S.P. Thorat , Former Chairman, National Bank
for Agriculture and Rural Development, Indu Niketan,
226 E, Tarabai Park, Gen Thorat Road, Kolhapur 416
003
-
Chairman
(ii) Deputy Governor, Reserve Bank of India, Mumbai - Member
(iii) Prof. M.S. Sriram, Indian Institute of Management,
Wing 6-E, Indian Institute of Management, Vastrapur,
Ahmedabad,380015, India
Telephone++91-79-66324891, Fax:91-79-66324855
email: [email protected]
- Member
(iv) Shri Y.C. Nanda, Former Chairman NABARD, Flat No.
14/C-GH4 Orchid Garden, Sector 54, Gurgaon-
122002. Mobile 9810877060
e-mail: [email protected]
- Member
(v) Dr. Gopal Naik, Professor, Indian Institute of
Management, Bannerghatta Road, Bangalore- 560
076, Fax 080-26582450
- Member
(vi) Dr. R. Kannan, Member, (Actuary) Member, Insurance
Regulatory & Development Authority, Parasirama
Bhavanam, Basheerbagh, Hyderabad-500 004, Fax No.
040-5582 3334
- Member

2
(vii) Shri D.N. Rao, Centurion School of Rural Enterprise
Management, P.O.R. Seethapur, Via Uppalada, besides
JITM Campus, Paralakhemundi - 761 211. Gajapati,
Orissa Tel – +91 (6815) 224200
- Member
(viii) Dr. Rajinder Singh Sidhu, Dean College of Basic
Sciences & Humanities, PAU. Ludhina. Tel: 0161-
2401960-79, Ext-323, [email protected]
- Member
(ix) Joint Secretary-(Banking & Insurance), Deptt. of
Finacial Services, Ministry of Finance, New Delhi.
- Member
(x) Managing Director, Agriculture Finance Corporation
Ltd., Dhanraj Mahal, 1st Floor, CSM Marg, Mumbai-
400 0041.
- Member
(xi) Executive Director, National Federation of State
Cooperative Banks, J.K. Chambers,Fifth Floor, Sector
17, Plot No. 76, Vashi, Navi Mumbai – 400 703.
-Member
(xii) Joint Secretary (Credit, Cooperation & Crop
Insurance), Deptt. of Agriculture & Cooperation, Krishi
Bhavan, New Delhi.
- Member
(xiii) Joint Secretary (Plantation), Ministry of Commerce,
Udyog Bhawan, New Delhi.
- Member
(xiv) Chairman-cum-Managing Director, State Bank of
India, Mumbai.
-Member
(xv) Chairman-cum-Managing Director, Punjab National
Bank
- Member
(xvi) MD and CEO, ICICI – Lombard Ltd., Mumbai. - Member
(xvii) Managing Director and CEO, IFFCO- TOKIO General
Insurance Ltd., IFFCO Tower, PlotNo.3, Sector 29,
Gurgaon, Haryana 122 001
- Member
(xviii) Chairman-cum-Managing Director, Agriculture
Insurance Company of India Ltd. 13th Floor, Amba
Deep Building, Kasturba Gandhi Marg, New
Delhi110001.
- Member
(xix) Shri Vijay Mahajan, BASIX, D-9, First Floor, Greater - Member

3
Kailash Enclave-I, New Delhi-1100048, Tel: 011-
41730252, 41730454
(xx) Shri A P Fernandez, Executive Director, MYRADA,
Head Office No.2 Service Road, Domular Layout,
Banglore, 560071
- Member
(xxi) Managing Director, National Cooperative Development
Corporation, NCUI Building, 4, Siri Institutional Area,
August Kranti Marg, Haus Khas, New Delhi-110 016.
- Member
(xxii) Director General, Vaikunthlal Mehta National Institute
of Co-operative Management, University Road, Pune
- Member
(xxiii) Shri K.U.B.Rao, Officer-in-Charge, Department of
Economic & Policy Research, Reserve Bank of India,
Central Office Building, 7th Floor, Mumbai-400 001.
- Member
(xxiv) Shri Kapil Mandal, Vivekanand Seva Kendra, Uion, 24,
Paraganas, West Bengal.
- Member
(xxv) Adviser(Agriculture), Planning Commission -Member
(xxvi) Dr. Prakash Bakshi, Executive Director, NABARD,
Bandra Kurla NABARD Complex, Mumbai
Member –
Secretary
1.3 The Terms of Reference (ToR) of the Working Group were as
follows:
(i) To review the flow of credit to the agriculture and allied sectors
during the 12th Plan, giving sub-sectoral analysis, and to recommend
measures to ease the flow of credit at reasonable rates of interest
throughout the country, with special consideration of disadvantaged
sections such as small and marginal farmers, women farmers, tenant
farmers, oral lessees and landless labourers and to assess the short term
and long term credit requirement of agricultural credit during XII plan.
(ii) To review the contribution and performance of credit cooperatives
towards outreach of credit to agriculture and allied activities and
recommend measures for their increased proactive participation.
4
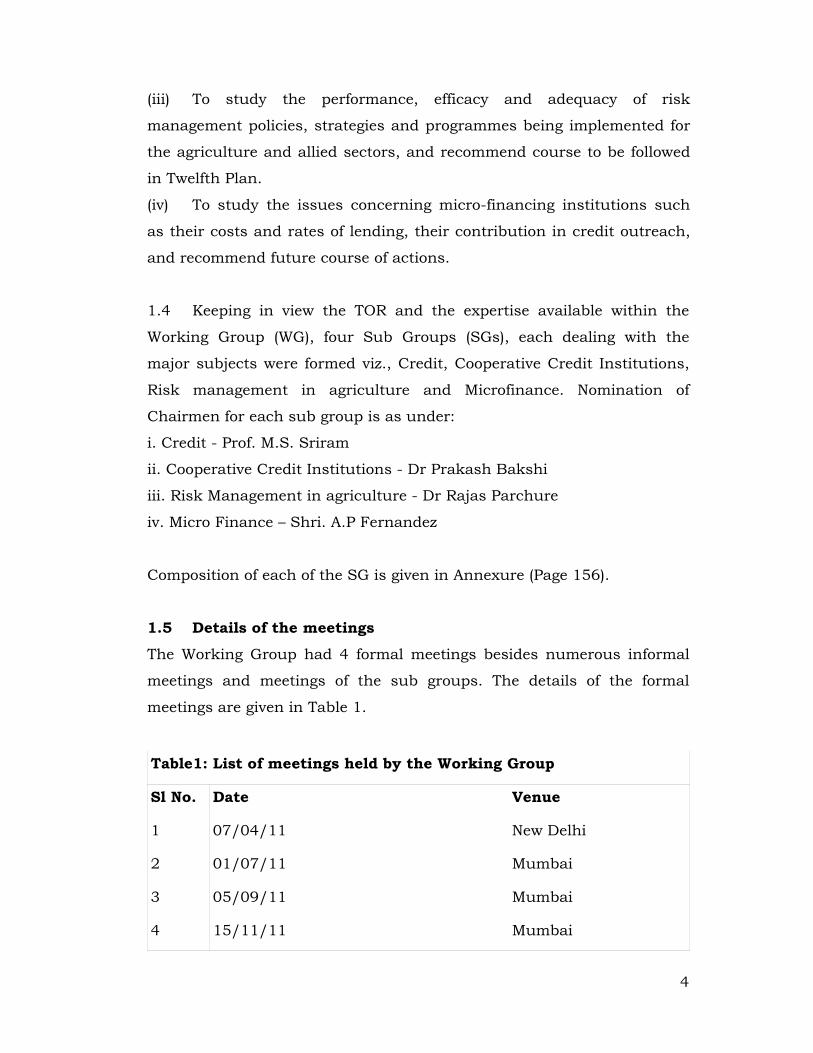
(iii) To study the performance, efficacy and adequacy of risk
management policies, strategies and programmes being implemented for
the agriculture and allied sectors, and recommend course to be followed
in Twelfth Plan.
(iv) To study the issues concerning micro-financing institutions such
as their costs and rates of lending, their contribution in credit outreach,
and recommend future course of actions.
1.4 Keeping in view the TOR and the expertise available within the
Working Group (WG), four Sub Groups (SGs), each dealing with the
major subjects were formed viz., Credit, Cooperative Credit Institutions,
Risk management in agriculture and Microfinance. Nomination of
Chairmen for each sub group is as under:
i. Credit - Prof. M.S. Sriram
ii. Cooperative Credit Institutions - Dr Prakash Bakshi
iii. Risk Management in agriculture - Dr Rajas Parchure
iv. Micro Finance – Shri. A.P Fernandez
Composition of each of the SG is given in Annexure (Page 156).
1.5 Details of the meetings
The Working Group had 4 formal meetings besides numerous informal
meetings and meetings of the sub groups. The details of the formal
meetings are given in Table 1.
Table1: List of meetings held by the Working Group
Sl No. Date Venue
1 07/04/11 New Delhi
2 01/07/11 Mumbai
3 05/09/11 Mumbai
4 15/11/11 Mumbai

5
1.6 Approach of the Working Group
One of the objectives of the 12th FYP is "faster, more inclusive and
sustainable growth". Viewed in this light, better and more inclusive
performance of agriculture automatically becomes a part of the mandate
of the WG. The WG’s approach, projections and the recommendations
therefore were guided primarily by the objective of more inclusive growth.
1.7 The Group's deliberations were based on the following major
considerations.
Firstly, while over time, the flow of credit has increased significantly, it
has also raised several concerns about the destination of matrix of credit.
On the background of these concerns, the WG has projected credit
requirements not only in quantitative terms, but has looked into
qualitative aspects beyond credit growth which have a bearing on
agriculture growth.
Secondly, the WG was of the opinion that the credit strategy should be
aligned to agriculture growth strategy which in turn has to address
broader macro economy concerns of supply management and issues like
inflation control, food, nutrition & livelihood security.
• Historically, agriculture growth strategy has been driven by
concerns of increasing production and productivity. While in many
ways, this strategy may still be relevant, it may be necessary to give
a thrust on the post production phase, including storage,
processing, distribution, marketing, etc.
• Over the years, the emerging trend is that GDP in agriculture is
increasingly being contributed to by sectors such as horticulture,
animal husbandry and fisheries, more than the pure crop sector.
The growth of the crop sector being stagnant – at least in the recent
past and which shall possibly continue into the immediate future
implies that the other sub sectors have to grow faster, so as to
achieve an overall growth of about 4% in agriculture.

6
• Further, in consonance with the needs of a diversified economy
reflecting changing consumption patterns and emerging nutritional
security requirements also, these sub sectors need more support
so that they can grow faster.
• Keeping in view the relative contribution of the rainfed agriculture,
credit needs of rainfed agriculture have to be given a priority.
Thirdly, for enhanced productivity of credit, financial sector initiatives
must be harmonized with the real sector initiatives. When the real world
is characterized by constraints such as low seed replacement rates,
uncertain input quality, yield fatigue, virtually non-existent extension
services, problems relating to land laws and tenancy related issues, weak
prices, need for better and more affordable productivity risk mitigation
initiatives etc., merely enhancing the flow of credit will not yield the
expected results. The WG therefore believes that support services
including infrastructure, storage, processing, marketing etc., should be
reinforced and regulatory mechanisms for ensuring quality of inputs and
reorienting extension services to enhance the impact of credit be put in
place.
Fourthly, Keeping in view the emerging agrarian structure which is
increasingly becoming small farm oriented, aggregation models are
essential to reach out to small and marginal farmers.
Fifthly, Keeping in view the biological nature of agriculture, the WG felt
that it is necessary to broaden the scope of risk mitigation wherever
possible, beyond insurance. More importantly, it may be necessary to
align risk mitigation for post production phase also.
1.8 In addition to the deliberations internally, the WG had the benefit
of outside consultation also with Industry Associations and
representatives of States on 23rd June 2011. Some of the important
issues that came up during the discussions are as follows:

7
i. Agriculture needs to be looked into holistically which should
include not only crops but horticulture, livestock, fisheries also.
ii. A related issue highlighted was the differential rate of interest as
applicable to the above sub sectors. The opinion was that all
sectors need to be treated uniformly.
iii. It was suggested that if agriculture has to grow at the desired level,
then enhanced credit support for horticulture, fisheries and
livestock is a must.
iv. There was a criticism regarding violation of certain regulatory
prescriptions at the ground level. As an example, insistence on
collateralized lending at the Branch level was cited, despite
contrary instructions from the top and agreements reached at the
SLBC level.
v. Similar sentiments were expressed about issuance of KCC where
conditionality of mutation was being cited and used by the bankers
for not issuing KCCs.
vi. A view was expressed that such problems call for setting up a
decentralized ground level mechanism to address regulatory
violation.
vii. The Assam State delegation made a specific reference to KCC. In
their view, the bankers are extremely reluctant to issue KCC,
despite a lot of ground work done by their Departments. Govt of
Assam has issued an internal circular to complete the formalities
relating to identification of farmers, certifying their land records
and completing all formalities duly countersigned by the Agri. Dev
Officer in a standardized manner. Still, bankers are not taking the
initiative.
viii. In Assam, the potential of the dairy sector also was reportedly
ignored by the bankers. Creating storage facility also is a priority in
the state, but the bankers as also potential entrepreneurs, are
ignoring this, despite a heavy dose of subsidy.
ix. The need to increase investment credit was emphasized in almost
every discussion. Some of the senior level Officers (Maharashtra)
8
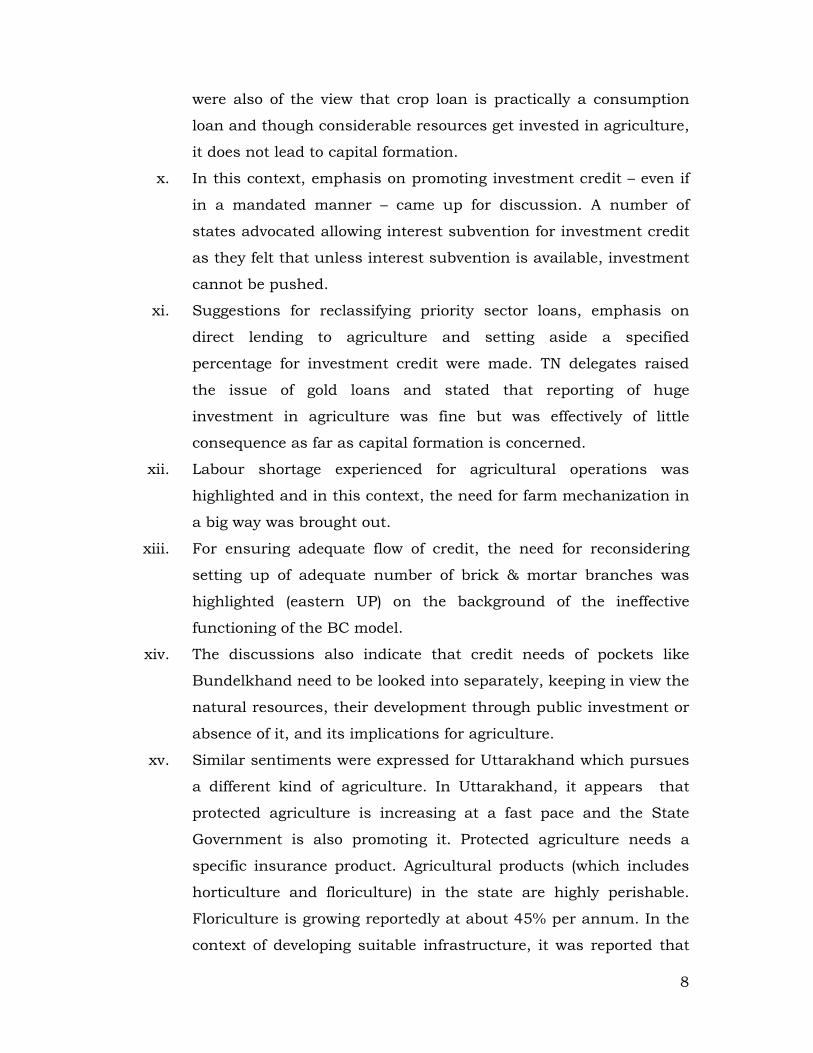
were also of the view that crop loan is practically a consumption
loan and though considerable resources get invested in agriculture,
it does not lead to capital formation.
x. In this context, emphasis on promoting investment credit – even if
in a mandated manner – came up for discussion. A number of
states advocated allowing interest subvention for investment credit
as they felt that unless interest subvention is available, investment
cannot be pushed.
xi. Suggestions for reclassifying priority sector loans, emphasis on
direct lending to agriculture and setting aside a specified
percentage for investment credit were made. TN delegates raised
the issue of gold loans and stated that reporting of huge
investment in agriculture was fine but was effectively of little
consequence as far as capital formation is concerned.
xii. Labour shortage experienced for agricultural operations was
highlighted and in this context, the need for farm mechanization in
a big way was brought out.
xiii. For ensuring adequate flow of credit, the need for reconsidering
setting up of adequate number of brick & mortar branches was
highlighted (eastern UP) on the background of the ineffective
functioning of the BC model.
xiv. The discussions also indicate that credit needs of pockets like
Bundelkhand need to be looked into separately, keeping in view the
natural resources, their development through public investment or
absence of it, and its implications for agriculture.
xv. Similar sentiments were expressed for Uttarakhand which pursues
a different kind of agriculture. In Uttarakhand, it appears that
protected agriculture is increasing at a fast pace and the State
Government is also promoting it. Protected agriculture needs a
specific insurance product. Agricultural products (which includes
horticulture and floriculture) in the state are highly perishable.
Floriculture is growing reportedly at about 45% per annum. In the
context of developing suitable infrastructure, it was reported that

9
rope ways for quick transport systems have been tried by the state.
They have worked, but not to their complete satisfaction.
xvi. The discussion probably suggests that specialized treatment/
products may be required to address location specific production
systems.
xvii. A few suggestions were made by the Maharashtra group. It was
suggested that the Warehousing (Regulation and Development) Act,
2007 has tremendous potential which needs to be tapped as far as
credit is concerned.
Based on the analysis of the WG, deliberations of the Sub Groups and
external inputs, this report has been finalized. Analysis and
recommendations relating to each of the four TORs are presented in the
subsequent chapters and the Summary and Recommendations have
been incorporated in chapter VI.

10
Chapter II
Flow of Credit to Agriculture Review 2.1 The 11th plan period was a period of action. During the period,
policy focus was on increasing the flow of agricultural credit. Firstly,
target was given to the banking sector to double the flow of credit to
agriculture in a matter of three years, and later came the announcement
of agricultural debt waiver [and one time settlement scheme for large
farmers]. This period saw an increase in the flow of credit to agriculture
from ` 2,54,657 Crore (2007-08) to ` 4,46 ,779 crores (2010-11).
2.2 The period was an interesting one not only because of the thrust in
the flow of agricultural credit and increased policy attention towards the
growth of credit, but also from the perspective of institutional reform.
During the past decade, the formal sources of credit lost market share to
the moneylenders (Table 2.1).
2.3 The 11th plan period possibly laid a foundation for the takeoff of the
next phase of reform and rejuvenation. The acceptance and
implementation of the Vaidyanathan Task Force on Co-operatives is
Table 2.1: Share of Debt# of Cultivator Households from Different Sources (%)
Sources of Credit 1951 1961 1971 1981 1991 2002 Institutional 7.3 18.7 31.7 63.2 66.3 61.1 Cooperative Societies/Banks, etc 3.3 2.6 22.0 29.8 30.0 30.2 Commercial Banks 0.9 0.6 2.4 28.8 35.2 26.3 Non-Institutional 92.7 81.3 66.3 36.8 30.6 38.9 Moneylenders 69.7 49.2 36.1 16.1 17.5 26.8 Unspecified - - - - 3.1 - Total 100.0 100.0 100.0 100.0 100.0 100.0 # Debt refers to outstanding cash dues. Source: Reserve Bank of India (RBI), All-India Rural Credit Survey, 1951-52; RBI, All India Rural Debt and Investment Survey, 1961-62 and NSSO, All India Debt and Investment Surveys, 1971-72, 1981-82, 1991-92 and 2003.

11
expected to start showing results in the next plan period, though some
developments which are of mixed nature are visible even now. These have
implications for making co-operatives an effective channel for dispensing
agricultural credit.
2.4 The banking system has moved forward in terms of technological
improvements, with almost all the scheduled commercial banks
[including RRBs] expected to be on the core banking solution platform
which makes transactions more efficient, data capture more elegant and
decision making more objective. The same database will also help in
making more informed policy decisions as well.
2.5 While there has been significant action on the institutional front,
there are some concerns as well. The policy focus on agriculture per se
has been through the credit lens. While it is important to acknowledge
the role of credit, it is also important to flag the important issues that
would make credit more effective – which would be in reducing risk and
uncertainty in agriculture – both at the level of yields and at the market
place, making agriculture economically viable and ensuring that there
are sufficient surpluses generated from agriculture which in turn is
ploughed into the household level savings/capital which would act as a
cushion in times of adversity. Overall the concerns are that there is a
disproportionate growth of credit in relation to “savings” and there is also
a disproportionate growth of credit in relation to the agricultural
productivity itself. This is happening in the context of:
a. The agricultural GDP not keeping in pace with the overall GDP
(Table 2.2)
b. The amount of loan and the average size of a loan account going
up; (Table 2.3)
c. The number of loan accounts going down;(Table 2.3)
d. The average land holding size reducing; (Table 2.4)

12
Table 2.2: Growth of GDP(Overall) and GDP(Agriculture) during 10th & 11th FYP
10th Plan Av (2002-03 to 2006-07)
11th Plan Av (2007-08 to 2010-11)
GDP 7.8 8.2 GDP-Agri 4.65 2.9
Source: Planning Commission, Government of India Table 2.3: Trends in the Number of Accounts(in Lakh) and Amount(in `.crore) in 11th FYP(2007-08 to 2009-10) in Ground Level Credit Flow under Agriculture-All India
2007-08 2008-09 2009-10 2010-11
Agency No of accounts (in Lakh)
Amount (` in crore)
No of accounts (in Lakh)
Amount (` in crore)
No of accounts (in Lakh)
Amount (` in crore)
No of accounts (in Lakh)
Amount (` in crore)
CBs 174.79 (40)
1,81,087 (71)
202.45 (44)
2,28,951 (76)
205.30 (43)
2,85,800 (74.3)
233.94 (41)
3,32,706 (74.4)
Coop 201.81 (46)
48,258 (19)
178.18 (39)
45,965 (15)
203.92 (42)
63,497 (16.5)
260.17 (46)
70,105 (15.7)
RRBs 62.74 (14)
25,311 (10)
75.47 (17)
26,764 (9)
73.08 (15)
35,217 (9.2)
72.03 (13)
44,702 (9.9)
Total 439.34 (100)
2,54,657 (100)
456.1 (100)
3,01,908 (100)
482.30 (100)
3,84,514 (100)
566.14 (100)
4,47,513 (100)
Per acc. Credit(Rs)
58,000 66,208 79,775 79,066
Note: CB denotes commercial banks, Coop denotes Cooperative Banks and RRB denotes regional rural banks. Figures in parentheses are in percentages to the total for the respective years. Source: NABARD
Table 2.4: Change in the average size of holding over decades (Ha) Category of Farmers 1990-91 1995-96 2001-02 2005-06 Marginal(less than 1 ha) 0.4 0.4 0.4 0.38 Small(1.0 to 2.0 ha) 1.44 1.42 1.42 1.38 Semi-medium(2.0 to 4.0) 2.76 2.73 2.72 2.68 Medium(4.0 to 10.0) 5.9 5.84 5.81 5.74 Large(10.0 and above) 17.3 17.21 17.12 17.08 All Groups 1.57 1.41 1.33 1.23 Source: Agricultural Census, GOI. Data downloaded from www. Agricoop.nic.in 2.6 All these would only lead us to conclude that while agricultural credit
is growing at a disproportionate rate unlike the growth of agriculture
itself, this growth might be coming from a very large institutional credit
gap and the gap has still not been filled up and there is scope for further
credit absorption or that the ultimate amounts are possibly not being
utilized for agriculture.

13
2.7 Irrespective of the conclusions, it is clearly evident that the credit
flow from the institutional sources has moved towards much larger
accounts, with the average account size growing over time. Assuming
that when the institutions fail, the informal sector takes over, and the
poorest would be the first to approach the informal structure, the fact
about the formal system is catering largely to the bigger farmers is also
supported by the growth in the share of moneylenders as reported by
AIDIS, NSSO.
Direct Vs Indirect credit
2.8 Is the robust credit growth driven considerably by indirect credit?
Table 2.5. Outstanding Credit of Scheduled Commercial Banks
Year Share of DF(%) Share of IF(%) Per account O/s (`)
Acc Amt Acc Amt DF Agri IF Agri Total Agri 2000 98 84 2 16 19,076 2,22,184 22,227 2001 99 84 1 16 22,194 2,97,639 26,069 2002 97 74 3 26 24,027 2,71,296 31,452 2003 97 78 3 22 29,243 2,61,681 36,436 2004 97 73 3 27 33,832 4,47,547 45,177 2005 98 76 2 24 36,384 4,60,570 46,662 2006 98 72 2 28 43,832 7,40,416 59,407 2007 98 75 2 25 52,796 7,99,986 69,300 2008 98 78 2 22 56,660 8,93,869 71,755 2009 98 77 2 23 60,806 9,77,168 77,405 2010 96 76 4 24 72,399 5,28,499 91,256
CAGR (2000 to 2010) 14 15 15
CAGR (2004 to 2007) 16 25 16
DF-Direct finance, IF- Indirect Finance. Source: Computed from the data provided in Banking and Statistical Returns, RBI (Various issues) There has been a distinct shift in the preference of commercial banks
towards indirect finance (IF) vis-à-vis direct finance (DF) to agriculture.
Of the total credit outstanding to agriculture, the share of indirect
finance was 16% in 2000 which increased to 28% in 2006 and stood at
24% in 2010 (Table above). The share among the two categories in terms

14
of accounts has more or less remained the same during the period 2000
to 2010. In recent times, the increase in the commercial banks’ indirect
financing could be due to their financing the value chain and as well as
the increasing role of urban and metropolitan branches in rural
financing. However, the present data does not make it amenable to reach
a firm conclusion in this aspect.
2.9 The per account outstanding among the two categories grew at the
same rate during the period 2000 to 2010. However, if we dissect for the
doubling period we observe that per account outstanding for indirect
finance grew at 25% per annum while for direct finance the CAGR was
16% (Table 2.6). The per account O/s for indirect finance was ` 2, 22,184
in 2000 which increased to ` 9, 77,168 in 2009 and then has decreased
to ` 5, 28,499. The O/s for direct finance has increased from to ` 19,076
in 2000 to ` 72,399 in 2010. Credit deepening in the indirect finance
category is more pronounced compared to direct finance category.
Table 2.6: Outstanding Credit of Scheduled Commercial Banks According to Occupation, BSR(Various issues)
Period Direct Finance to Agri
Indirect Finance to Agri
No of accounts Amt No of accounts Amt CAGR(2000 to 2010) 9 25 13 30 CAGR(2004 to 2007) 15 34 7 34 Source: Computed from the data provided in Banking and Statistical Returns, RBI(Various issues) 2.10 For the period 2000 to 2010, the growth in outstanding of both
number of accounts and amount of indirect finance (to agriculture) by
commercial banks was higher than direct finance (to agriculture).
However, for the DACP, the growth in direct finance (amount) was equal
to growth in indirect finance (amount).
2.11 Implications (i) During the doubling period both ‘credit widening’ and ‘credit
deepening’ was witnessed with respect to direct finance whereas there
was ‘credit deepening’ for indirect finance.

15
(ii) Both direct and indirect finance is essential for the growth of
agriculture however, a balance between the two categories in terms of
outreach and impact needs to kept in focus for optimising the overall
impact of credit. While there may be a case for increased role of indirect
finance to agriculture in the context of increased role of corporate, agri-
business in agriculture however the trends and shifts within the “indirect
finance” category needs to be analysed further. It is equally important to
emphasize that growth in indirect finance as a category should be not at
the cost of direct finance.
(iii) While the share in amounts between indirect and direct agriculture
has changed there has hardly been any compositional shifts in terms of
share in a counts. The aggregate nature of the data does not make it
amenable to further analysis which is needed to arrive at insights about
the nature and composition of indirect finance category.
Regional variation
2.12 In addition to the above, it is important to look at the disparity in
flow of credit. The flow of credit for the XI plan period on the basis of
three different cuts. The first task is to look at the regional variations, the
second cut is to look at what is happening to the various agencies
purveying credit and how their relative shares are panning out and the
third is to look at the granular data on agricultural credit to understand
what is happening on “direct” versus “indirect credit” and within direct,
examine the private capital formation, and examine in particular what is
happening to the investment/term credit (Tables 2.7 and 2.8).

16
Table 2.7: Trends in Production and Investment Credit in the Tenth and EleventhFive Year Plan
(in `. Crore) – All India
Year Production Credit(PC)
Share of PC to Total Credit
Investment Credit(IC)
Share of IC to Total Credit Total
2002-03 45586 61 28923 39 74509 2003-04 54977 63 32004 37 86981 2004-05 76062 61 49247 39 125309 2005-06 105350 58 75136 42 180486 2006-07 138455 60 90945 40 229400 2007-08 181394 71 73264 29 254658 2008-09 210461 70 91447 30 301908 2009-10 276656 72 107858 28 384514 2010-11 10th Plan(average) 84086 61 55251 39 139337 11th Plan(average) 222837 71 90856 29 313693 Source: Annual Report, NABARD, Various Issues Table 2.8: Region wise share in Agriculture Credit- Tenth and Eleventh Five Year Plan
Regions 10th FYP (average share)
11th FYP (average share)
Share in GCA
Northern 28.69 27.44 20.11 North Eastern 0.38 0.44 2.83 Eastern 6.67 7.27 14.65 Central 15.10 13.20 27.26 Western 14.17 14.10 16.47 Southern 34.99 37.55 18.68
Total 100.00 100.00 100.00
GCA- Gross Cropped Area, *- for the four year period 2007-08 to 2010-11. Source: Credit figures from NABARD and GCA from Centre for Monitoring Indian Economy, Mumbai 2.13 The review suggests that while there is substantial growth in credit
disbursement, the increased numbers do not necessarily increase the
comfort level. The available analysis and literature suggest that quality of
lending and direction of it in the incremental lending leaves much to be
desired. Emerging evidences of regional imbalances in credit flow, term

17
lending taking a backseat, sluggishness of the share of small and
marginal farmers, dilution in synchronisation of credit flow with
agricultural seasonality, increase in the share of indirect finance and
poor MIS which is unable to decipher the direction of flow, are such
concerns which imply that the sense of priority is getting deteriorated,
even while credit is being pushed in the sector in a big way. The WG
recommends that there is need to look into the definition of priority
sector keeping in view the emerging concerns. The Reserve Bank of
India has already appointed a Committee and the WG is hopeful that the
Committee will look into the concern.
Approach to the 12th FYP 2.14 An attempt has been made to review the changes in the cropping
pattern over the XI plan period and its implications. The idea is to check
whether cropping pattern shows significant movements in terms of
relative shares for food and non-food crops, broken up into cereals,
pulses, oilseeds, plantation and horticulture on one hand and
commercial crops on the other.
2.15 Indian agriculture has been witnessing a paradigm shift -the view
in several academic and policy making circles that a shift in terms of
cropping pattern, from foodgrains to non- foodgrain crops has been
taking place in recent decades. An analysis of the same is presented
below (Table 2.9) Table 2.9: Compound Growth Rate of Area under Major Crops (%) Year 1990-91 to 1999-2000 2000-01 to 2009-10 Total cereals 0.04 0.09
i. Rice 0.68 -0.03 ii. Wheat 1.72 1.21
Total pulses -0.6 1.17 Foodgrains -0.07 0.29 Oilseeds -0.86 2.26 Commercial crops 2.25 1.47 Non foodgrains 1.18 2.19 All crops 0.27 0.84 Source: Agricultural Statistics at a Glance, Ministry of Agriculture, GoI, 2010
18
2.16 The increase in the area under foodgrains was meagre during the
period from 2000-01 to 2009-10. The rate of growth of area under rice
was negative at -0.03% during 2000-2010 compared to a growth rate of
0.68% in the previous decade. The rate of growth of area under wheat
also declined, though the decrease was less pronounced than in the case
of rice. An increasing trend was observed, with regard to the growth in
area under non- food grain crops. While it was 1.18% in the 90’s, it
increased to 2.19% in the next decade signifying a significant shift from
cultivation of food grain to non- foodgrain crops. It ought to be examined
whether such a shift in cropping pattern shall have its impact on food
security in general, particularly when the country is reeling under the
pressure of food inflation. It is an encouraging trend that area under
pulses has recorded an increased CAGR of 1.17% compared to the
negative growth rate in the previous decade. Pulses, as a source of
protein, can ensure increased nutritional security, although concerns
regarding productivity also need to be factored in.
2.17 An analysis of the growth in area under major crops during 2004-
05 to 2009-10 is presented in Table 2.10. The area under commercial
crops, viz., cotton, sugarcane, Jute& Mesta had a faster growth in
comparison to other crops. The increase in area under commercial crops
has been more marked at 3.12%, compared to any other group. This can
be viewed more or less, as an indicator of a perceptible shift in the
cropping pattern. The area under cereals during this period did not show
a remarkable increase, although it recorded a positive growth rate.
Although on a decadal basis, the area under pulses seemed to have
recorded substantial growth, the trend during the period from 2004-05 to
2008-09 is not very encouraging, showing a negative growth rate of -
0.1%. The area under oilseeds also recorded a negative growth during
this period.

19
Table 2.10: Area under Major Crops (million hectares) Year Cereals Pulses Oilseeds
* P&H**
Commercial Crops @
2004-05 99.7 22.8 27.5 19 13.37 2005-06 99.2 22.4 27.9 20 13.78 2006-07 100.5 23.2 26.5 20.8 15.23 2007-08 100.4 23.6 26.7 21.6 15.43 2008-09 100.7 22.1 27.5 20.65 14.73 CAGR 0.81 -0.107 -0.44 2.47 3.12 * : Includes nine oilseeds- groundnut, rapeseed and mustard, sesamum, linseed, castor oil, nigerseed, safflower, sunflower and soyabean **: Plantation crops include tea, coffee and rubber @: Includes cotton, sugarcane, jute& mesta
2.18 It would be worthwhile ascertaining how the yield figures have
moved, and in terms of overall farm level viability and profitability has
there been any shift. (Table 2.11).
2.19 In the case of commercial crops, the most spectacular increase in
yield was observed in the case of cotton, which was more than
commensurate with the increase in area under cultivation, probably due
to the introduction of Bt cotton. The increase in the yield of sugarcane
was marginal during the past decade, as compared to the 90’s.
Table 2.11: All India Compound Growth Rates of Area, Production and Yield of Major Crops Crop 1990-91 to 1999-2000 2000-01 to 2009-10 Area Prod Yield Area Prod Yield Rice 0.68 2.02 1.34 -0.03 1.59 1.61 Wheat 1.72 3.57 1.83 1.21 1.89 0.68 Coarse Cereals -2.12 -0.02 1.82 -0.76 2.46 3.97 Total Cereals 0.04 -0.02 1.59 0.09 1.88 3.19 Total Pulses -0.60 0.59 0.93 1.17 2.61 1.64 Food grains -0.07 2.02 1.52 0.29 1.96 2.94 Sugarcane -0.07 2.73 1.05 0.77 0.93 0.16 Oilseeds -0.86 1.63 1.15 2.26 4.82 3.79 Cotton 2.71 2.29 -0.41 2.13 13.58 11.22 Non-food grains 1.18 2.69 1.09 2.19 2.86 1.78 All crops 0.27 2.29 1.33 0.84 1.83 2.82 Source: Agricultural Statistics at a Glance, Ministry Of Agriculture, GOI, 2010
2.20 As stated earlier, a very plausible trend that has been emerging of
late, is the shift in cropping pattern from foodgrain to non- foodgrain
crops. However, in terms of yield, the trend is quite encouraging, as the
yield of foodgrains registered a growth of 1.52% in the 1990s, which

20
further increased to 2.94% during the period from 2000-01 to 2009-10
despite the slow growth in area under the same. Under food grains, the
yield in cereals has been showing an upward trend with a CAGR of 3.19%
in the past decade, which is almost double the CAGR it witnessed in the
decade of the 90’s. In the case of pulses, both production and yield
figures have shown an increase.
Major priorities for the XII plan period:
2.21 Focus on public capital formation and investments on agriculture
[particularly on the support systems] so that the overall risk in
agriculture is minimized and agriculture is made more and more viable:
a. More weather stations
b. Warehouses for inputs
c. Warehouses for outputs and cold chains
d. Focus on extension
e. Investments in irrigation structures, local watersheds etc
f. Focus on the biggest constraints in accessing credit for
the genuine customers:
g. Land records
h. Tenancy rights
i. Examine the AP ordinance to ensure that farmers having
a right to cultivate can access credit
j. Examine the WB system
k. Focus on term finance and investments
l. Make it mandatory for a part of the agricultural credit to
go to term finance.
2.22 Public investment is usually non-discriminatory in nature unlike a
subvention, since it goes to an individual who is, by definition self-
selected. Given the nature of agricultural advances, it can be safely
argued that there could be an elite capture.

21
Interest Subvention
2.23 The interest subvention scheme of the GoI for crop loans envisages
that the farmer receives short- term credit @ 7% p.a with an upper limit
of Rs. 3 lakh on the principal amount per year. This policy came into
effect from Kharif 2006-07.
2.24 The general observation is that the interest subvention for prompt
repayee farmers introduced during 2009-10 was not made available by
the bankers to the full extent. Concerns have been articulated regarding
the banks’ reluctance to pass on the benefit of interest subvention to
farmers for prompt repayment and claim the same from NABARD.
Another concern is regarding the delay in submission of claims by banks
and what can be done to redress the same.
Impact of Debt Waiver
2.25 According to the Report of the Task Force on Credit Related Issues
of Farmers, as a result of the debt waiver, the percentage of accounts
benefited as a proportion of operational holdings ranged from 0.79% in
Sikkim to 37.58% in Odisha and the per account debt waiver ranged
from Rs. 6,391 in Manipur to Rs. 81,652 in Delhi. According to the
Report, on the one hand, there were farmers who obtained gold loan for
agricultural purposes and could not benefit from the waiver as the loan
was recorded under ‘other’ purposes. There were also a category of non-
farmers who benefited from the waiver who had taken gold loan from
non- agricultural purposes, as the loan was recorded in the bank ledger
as ‘agricultural’, to meet its priority sector target.
Approach for Estimation of Likely Credit Flow for the Agriculture
Sector-12th FYP
22
2.26 This section elaborates the methodology adopted for estimation of
credit flow to agriculture by various methods. Broadly, the following
approaches were used for projecting GLC flow in Agriculture.
1.Projections based on Trend (Trend rate of growth approach).
2.Projections based on various GDP growth rates (Term Structure wise).
3.Projections based on trend in ratio of GLC to GDP in Agri.
4.Projections based on sectoral requirement (Sectoral approach).
Estimates based on Trend
2.27 The actual disbursement to the agriculture sector since 1992 has
been analysed. The trend growth rates for aggregate credit flow,
production credit and investment credit have been estimated for various
periods. Based on the credit flow disbursements achieved in 11th FYP the
likely flow for 12th plan period has been estimated. Most appropriate trend
value, (using linear) were used for the agency-wise estimations. For
estimating the equation GLC figures have been converted into logform
and regressed against time.
Linear trend
Y = a + bt Where:
Y = GLC flow during the year.
a = Y - intercept
b = The slope of the line(unit change over the year).
t = Year.
Projection Based on the Required Rates of Growth
2.28 A prominent method that seeks to estimate the level of investment
in a particular period is the Harrod-Domar modal, which is based on the
envisaged growth rates. Based on predetermined growth rates (overall
GDP growth, growth in GDP in agriculture sector), desired levels of

23
investment can be arrived at using the incremental capital output ratio
(ICOR).
2.29 Likely flow of investment credit was determined based on the share
of public and private sector in total investments as well as the share of
institutional credit involved in the sector.
2.30 For estimating the short-term credit requirement in the sector the
trends in the value of purchased inputs used in the crop production was
considered. Since, the value of inputs series is dated with the latest
available figures being of 2007-08, the projections based on these would
necessarily underestimate the requirements of short-term credit. To
overcome this deficiency, we have resorted to estimating the production
credit requirements based on existing ratio between investment and
production credit. With a view to give a thrust to investment credit
changes the ratio has been incrementally raised by one per cent for each
year of the 12th FYP. The method adopted has been explained with the
help of following equations:
GLCA 12fyp(e) = GLCAinv.c + GLCApdn.c …… (1) Where :
GLCA12fyp(e) = Projected ground level credit flow in agriculture during the 12th
FYP
GLCAinv.c = Projected investment credit in agriculture during the 12th FYP
GLCApdn.c = Projected production credit in agriculture during the 12th FYP.
GLCAinv.c = GDPm(cu.p) * Ag(s)*Gag(p)*ICOR(e)*PvtS(s)*InsS(s) ……(2)
Where: GDPm(cu.p) = GDP at market price(current price).
Ag(s) = Share of Agriculture inGDP.
Gag(p) = Projected growth in agriculture sector.
ICOR(e) = Incremental capital output ratio.
PvtSi(s) = Share of private sector in total investment in agriculture.
InsSi(s) = Share of institutional credit(investment) in total investment in
private sector.

24
Projections based on trend in ratio of GLC to GDP in Agriculture
2.31 Since the year 2000, the share of GLC (in agriculture) in the overall
GDP emanating from agriculture has been rising and there exists a
strong correlation between the two variables. Total GLC in agriculture as
a proportion to GDP in agriculture in the country was very low till 1999-
2000 when it reached 10 per cent for the first time. The ratio showed
substantial growth since 1999-2000 to reach almost 24 per cent by
2005-06. We have fitted a linear trend since 2000-01 and we estimate
that the ratio is likely to grow and reach almost 37 per cent by the
terminal year of the 11th FYP. With the targeted growth rate in agriculture
GDP, the projected GLC agri. GDP in agri ratio, likely credit flow in
agriculture has been estimated.
Sub-Sectoral requirement based estimates
2.32 For the major sub-sectors as far as investment credit is considered
we have attempted to estimate sub-sectoral investment requirements. An
attempt was also made to assess the likely investment credit flow in the
sector by assessing from the point of view of sectoral demand. The
existing trend, growth prospects of various sectors, were analysed to
arrive at the likely credit flow for the major sub sectors in agriculture and
allied activities. Two sets of estimation were attempted (i) using sub
sector wise estimation for the sectors(wherever available) and using
projections based on trend in GLC in the sub sector; and, (ii) based on
projections based on trend in GLC in each of the sub sectors.
Data Sources accessed and used
2.33 The exercise is based on secondary data collected from suitable
and authentic sources. The following data sources were used :
1. Publications of Central Statistical Organisation (accessed online)
25
2. Documents / Reports of the Planning Commission
3. Data/documents from Ministry of Agriculture, GoI (accessed online)
4. Publications of Commission on Agricultural Costs and Prices (CACP)
5. Economic Survey, Various Years, GoI
6. RBI publications (accessed online)
7. NABARD Publications
8. Various Committee Reports (Vyas Committee on Rural Credit,
Vaidyanathan
Committees I & II, Investment Credit Committee, CD Ratio Committee,
etc.)
9. Publications of Centre for Monitoring Indian Economy(CMIE)
Ground Level Credit Flow during 12th FYP – Projections
2.34 The credit flow to agriculture increased from `2, 85,146 crore
during the Ninth Plan [1997-2002] to ` 6, 85,146 crore during the Tenth
Plan [2002-07]. In all likelihood, the credit disbursement target of `
4,75,000 crore set for the last year of the Eleventh Plan shall also be
achieved which would in turn take the total disbursements to `18,62,859
crore for the 11th FYP period. This section discusses the likely credit flow
in agriculture during the 12th FYP based on the various methods that
have been used to arrive at the projections of agriculture credit flow.
Projections Based on Various Required Rates of Growth
Aggregate GLC Flow- Projections
2.35 Four broad scenarios have been projected for estimating the total
GLC in agriculture during the 12th FYP period. In order to achieve the
overall GDP growth envisaged in 12th FYP period, agricultural sector
needs to grow at 3% annually for 8.5% overall GDP growth and at 4%
annually for overall GDP growth of 9 to 9.5%. Of the total required
investment in the sector, share of the private sector was arrived at based
on the past trend (10 years). Similarly, the ratio of institutional sources

26
in the total private investment has been estimated and used for
estimating the credit flowthrough the banking channel. The GLC flow for
the total plan period has been estimated in the range of ` 33,89,261 crore
to ` 42,08,454 crore, depending upon the various scenarios.
Table 2.12: Aggregate Ground Level Credit Flow to Agriculture Sector during 12th FYP- Projections (`.crore)
Scenario 2012-13 2013-14 2014-15 2015-16 2016-17 Total CAGR
*Scenario 1 564293 616095 672652 734402 801820 3389261 11 Scenario 1A 672919 734693 802138 875774 956170 4041694 15 Scenario 2 575303 634214 699158 770751 849676 3529102 12 Scenario 2A 686049 756300 833745 919121 1013239 4208454 16 Assumption: For Scenario 1: GDP Agriculture grows at 3% annually, ICOR (agri) at 4 For Scenario 1A: GDP Agriculture grows at 3% annually, ICOR (agri) at 4.5 For Scenario 2: GDP Agriculture grows at 4% annually, ICOR (agri) at 4 For Scenario 2A: GDP Agriculture grows at 4% annually, ICOR (agri) at 4.5
Other Ratios common to all Scenario’s 1 Annual Inflation assumed at 6% 2 Private sector share in total investment in agriculture is at 80%(existing share) 3 Private sector investment financed by institutional sources is 80%of the total private sector investment (existing share) *-Compound Annual Growth Rate (calculated over terminal year of 11th FYP target of `4,75,000 crore)
2.36 For each of the four scenarios, further bifurcation of the estimates
in terms of agency-wise division along with short term (production credit)
and long term (investment credit) credit has been estimated. These
estimates are elaborated in Tables below:
Share of various agencies-Projections
2.37 To start with (for the first year of 12th FYP) the existing shares
among the three agencies viz. Commercial Banks (CBs), Co-operative
Banks and Regional Rural Banks (RRBs) have been used to arrive at the
contribution of each agency in the credit flow. But to provide a thrust
to the credit needs of small and marginal farmers for each
subsequent year, the share of cooperative banks in the short term

27
credit flow has been increased by 0.75% per year so that the share of
cooperatives shall reach 30% by the terminal year of the 12th FYP.
Similarly, for RRBs an increase of 0.5% has been envisaged so that their
share by the end of the 12th FYP reaches 13.5 % in the short-term credit
flow. The recent impetus and policy measures due to the implementation
of the Vaidyanathan Committee have made it possible for the
cooperatives to reach a higher share in the short term credit (production
credit). Some of the measures in view of the sub-group that the
implementation Short Term Cooperative Credit Structure (STCCS) Revival
Package and its Impact that would increase the share are as follows:
• As implementation of the GoI revival package progressed, 25 States
joined the Package. Cooperative State Acts (CSAs) have been
amended in 21 states. Professional CEOs or Directors have been or
are being appointed in most of the states. Statutory audit by
Chartered Accountants have commenced in 16 states. The GoI has
released ` 9,016.6 crore so far for recapitalisation of 52,000 PACS
in 16 states and the process for further releases is on.
• The most significant activity carried out under the Revival Package
is that of HRD initiatives. Moreover 80,000 staff and secretaries of
PACS, 1.09 lakh elected members of PACS, 370 CEOs of CCBs and
SCBs, 2,000 elected Board Members of CCBs and 1,500 branch
managers of CCBs have been trained within two years through
modules, specially designed by NABARD. The focus of these
training programmes has been business diversification and
prudent financial and business management. This is a continuing
initiative.
• Standardised Accounting and MIS package has been designed and
implemented in PACS and the process of computerising the same
in all the PACS that have received assistance under the package is
underway. NABARD is in the process of organising a CBS based
package for interested CCBs and SCBs on application service
provider (ASP) basis outside the GoI package and 125 banks have
already joined the initiative.
28
• These efforts, together with the financial cleansing received by the
cooperatives under the Agriculture Debt Waiver and Debt Relief
Scheme (ADWDR) of the GoI has seen agri-credit by cooperatives
increase substantially from ` 48,000 crore disbursed to 2.02 crore
farmers to ` 63,500 crore disbursed to 2.04 crore farmers. Given,
however, that PACS have a membership of over 12 crore and CCS
has issued more than 3.79 crore KCC, there is substantial scope
for increasing agri-credit dispensation by cooperatives.
2.38 In the case of long-term credit (investment credit) the average
contribution of each agency achieved in the 11th FYP has been kept intact
and the same has been used for arriving at the share of each agency in
long-term credit. Since, the long term cooperative structure is weak the
sub-group is of the opinion that given its status an increase in
cooperative banks share in investment credit may not be realistic to
strive for and at best they can hold on to their existing share.

29
Table 2.13: Scenario 1A: Projections of GLC for agriculture and allied activities for XII FYP (2012-17)
(GDP Agriculture grows at 3 % annually, ICOR (agric) at 4.5) (` Crore)
Agency 2012-13
2013-14
2014-15
2015-16
2016-17 Grand Total
Short –Term 471043 506938 545454 586769 631072 2741276 Cooperatives 127182 140675 155454 171630 189322 784263 Regional Rural Banks 54170 60833 68182 76280 85195 344659 Commercial Banks 289692 305430 321818 338859 356556 1612354
Term Credit 201876 227755 256684 289005 325098 1300418 Cooperatives 14131 15943 17968 20230 22757 91029 Regional Rural Banks 9084 10249 11551 13005 14629 58519 Commercial Banks 178660 201563 227165 255770 287712 1150870
Total Credit 672919 734693 802138 875774 956170 4041694 Cooperatives 141313 156618 173422 191860 212079 875292 Regional Rural Banks 63254 71082 79732 89285 99824 403178 Commercial Banks 468352 506993 548983 594629 644267 2763224 Notes:
1. Private Sector Share in Total Investment in Agriculture is 80%. 2. Private Sector investment financed by institutional sources is 80% of the total investment
in private sector 3. Ratio of Production to Investment credit assumed at 70:30(existing share) and by the end
of the terminal year to reach 66:34.
4. For ST: The existing shares of Cooperatives, RRBs and CBs in the total credit are 27,11.5 and 61.5 per cent respectively.
5. For LT: The shares of Cooperatives, RRBs and CBs in the total credit are 7, 4.5 and 88.5 respectively

30
Table 2.14: Scenario 2: Projections of GLC for agriculture and allied activities for XII FYP (2012-17)
(GDP Agriculture grows at 4 % annually, ICOR (Agri) at 4 ) (` Crore)
Agency 2012-13 2013-14 2014-15 2015-16 2016-17 Grand Total Short –Term 402712 437608 475427 516403 560786 2392936 Cooperative 108732 121436 135497 151048 168236 684949 Regional Rural Banks 46312 52513 59428 67132 75706 301092 Commercial Banks 247668 263659 280502 298223 316844 1406896
Term Credit 172591 196606 223730 254348 288890 1136165 Cooperative 12081 13762 15661 17804 20222 79532 Regional Rural Banks 7767 8847 10068 11446 13000 51127 Commercial Banks 152743 173997 198001 225098 255668 1005506
Total Credit 575303 634214 699158 770751 849676 3529102 Cooperative 120814 135199 151158 168852 188458 764481 Regional Rural Banks 54078 61360 69496 78578 88706 352219
Commercial Banks 400411 437655 478503 523321 572512 2412402
Notes: 1. Private Sector Share in Total Investment in Agriculture is 80%. 2. Private Sector investment financed by institutional sources is 80% of the total
investment in private sector 3. Ratio of Production to Investment credit assumed at 70:30(existing share) and by
the end of the terminal year to reach 66:34. 4. For ST:The existing shares of Cooperatives, RRBs and CBs in the total credit are
27,11.5 and 61.5 per cent respectively. 5. For LT: The shares of Cooperatives, RRBs and CBs in the total credit are 7, 4.5
and 88.5 respectively.

31
Table 2.15: Scenario 2 A: Projections of GLC for agriculture and allied activities for XII FYP (2012-17)
(GDP Agriculture grows at 4 % annually, ICOR (Agri) at 4.5 ) (` crore)
Agency 2012-13 2013-14 2014-15 2015-16 2016-17 Grand Total
Short –Term 480234 521847 566947 615811 668738 2853577 Cooperatives 129663 144813 161580 180125 200621 816802 Regional Rural Banks 55227 62622 70868 80055 90280 359052 Commercial Banks 295344 314413 334499 355631 377837 1677723
Term Credit 205815 234453 266799 303310 344501 1354877 Cooperatives 14407 16412 18676 21232 24115 94841 Regional Rural Banks 9262 10550 12006 13649 15503 60969 Commercial Banks 182146 207491 236117 268429 304884 1199066
Total Credit 686049 756300 833745 919121 1013239 4208454 Cooperatives 144070 161224 180256 201356 224736 911643 Regional Rural Banks 64489 73172 82874 93704 105782 420021 Commercial Banks 477490 521904 570615 624060 682720 2876790 Notes:
1. Private Sector Share in Total Investment in Agriculture is 80%. 2. Private Sector investment financed by institutional sources is 80% of the total
investment in private sector 3. Ratio of Production to Investment credit assumed at 70:30(existing share) and by the
end of the terminal year to reach 66:34 4. For ST: The existing shares of Cooperatives, RRBs and CBs in the total credit are
27,11.5 and 61.5 per cent respectively 5. For LT: The shares of Cooperatives, RRBs and CBs in the total credit are 7, 4.5 and
88.5 respectively Projections Based on Trend (Trend Rate of Growth Approach)
2.39 The trend in GLC flow to agriculture during the 10th and 11th FYP
has been considered for projections of the likely credit flow during the
12th FYP. Agency-wise trends in GLC flow during the 10th and 11th FYP
were considered to estimate total likely GLC during the 12th FYP. Since
the tenth plan period incorporated the GOI’s “Special Farm Package”
which sought for doubling the agriculture credit flow in three years
starting 2004-05, which led to high rate of growth in agriculture credit.
Keeping this in view the projections have used the trend growth rate
32
achieved during the first four years of the 11th FYP. If the tenth plan
period data is incorporated then it would lead to over estimation of the
growth rate. Based on the above the total GLC flow to agriculture during
the 12th FYP is estimated at ` 37,39,022 crore at an annual growth rate
of 15.53%.
Projections based on trend in the ratio of GLC to GDP in Agriculture
2.40 The proportion of total GLC to GDP in agriculture in the country
was low till 1999-2000, the year when it reached 10% for the first time.
The ratio has seen a substantial growth since 1999-2000 and became
24% by 2005-06. Incorporating this aspect by the end of 11th FYP the
ratio is estimated to reach 37 per cent. Based on this trend and
anticipated 4.0% growth in agriculture and 6.0% inflation, the total GLC
flow in agriculture during the 12th plan period is estimated at `
31,24,624 crore.

33
Table 2.16: Projections of GLC for agriculture and allied activities for XII FYP (2012-
17) (GLC TO GDP RATIO METHOD)
(` Crore) Twelfth Five Year Plan
Agency 2012-13 2013-14 2014-15 2015-16 2016-17 Grand Total Short –Term 411976 418273 424578 430884 437187 2122898 Cooperatives 111234 116071 121005 126034 131156 605499 Regional Rural Banks 47377 50193 53072 56015 59020 265677 Scheduled Commercial Banks 253365 252010 250501 248836 247010 1251722
Long Term 176561 187920 199801 212226 225217 1001726 Cooperatives 12359 13154 13986 14856 15765 70121 Regional Rural Banks 7945 8456 8991 9550 10135 45078 Scheduled Commercial Banks 156257 166309 176824 187820 199317 886528
Total Credit 588537 606193 624379 643111 662404 3124624 Cooperatives 123593 129225 134991 140889 146921 675619 Regional Rural Banks 55323 58649 62063 65565 69155 310755 Scheduled Commercial Banks 409622 418319 427325 436656 446328 2138250 Note:
1. Ratio of Production to Investment credit assumed at 70:30(existing share) and by the end of the terminal year to reach 66:34
2. For ST: The existing shares of Cooperatives, RRBs and CBs in the total credit are 27,11.5 and 61.5 per cent respectively.
3. For LT: The shares of Cooperatives, RRBs and CBs in the total credit are 7, 4.5 and
88.5 respectively

34
Investment Credit: Major Sub Sector Projections 2.41 The credit flow projections for the various major sub-sectors is
estimated by projecting the trend in the share of each of the sectors in
the Ground Level Credit Flow to Agriculture.
Summary of various projections Table 2.17: Summary of various projections of GLC for agriculture and allied activities for XII FYP (2012-17)
Sr.No. Method Total Projection for 12th FYP
period (` Crore) 1 Scenario 1- GDP Agriculture grows at 3%
annually, ICOR (Agri) at 4 33,89,261 2 Scenario 1A - GDP Agriculture grows at 3%
annually, ICOR (Agri) at 4.5 40,41,694 3 Scenario 2- GDP Agriculture grows at 4%
annually, ICOR (Agri) at 4 35,29,102 4 Scenario 2A -GDP Agriculture grows at 4%
annually, ICOR (Agri) at 4.5 42,08,454 5 Trend Method 37,39,022 6 Ratio of GLC to GDPA method 31,24,624 2.42 The total projections by various methods are in the range of `
31,24,624 crore to ` 42,08,454 crore.

35
Limitations of the Projection 2.43 As with all projections, these are also constrained by the
assumptions and the premises on which these are built. The behaviour of
the macroeconomic parameters on the suggested lines influences the
estimates. An area of concern is the likely behaviour with regard to
inflation. Though in the short term, the assumption of 6% inflation may
not be very realistic but it is very much plausible if a five year period is
kept in horizon.
Direct Cash Transfer Policy of Government of India
2.44 The Government of India intends to implement the direct cash
transfer scheme proposed by a panel headed by Shri. Nandan Nilekani,
being tested on a pilot before finalization. Under this new system, the
beneficiary gets cash to make his purchase of inputs etc., instead of the
current system in which they get subsidised products (e.g. fertilizers).
This may result in better targeting and checking of leakages. In direct
cash transfer mechanism, the Finance Ministry provides money for cash
payments to the States, from where it is transferred to the Nodal Bank
that allocates money to beneficiaries through the payment network after
checking with the Core Subsidy Management System (CSMS). The CSMS
will maintain information on entitlements and subsidies and carry out a
comprehensive check on beneficiaries. As a result, likely boost in demand
for credit per annum is expected to be around ` 55,000 crore.
Strategies for meeting the Projections
Increase Credit Flow to small and marginal farmers
2.45 With commercial banks constituting 75% of the total GLC to
agriculture it is imperative that the commercial banks should step up
their financing towards the small and marginal farmers. In terms of
share in account for the respective agency cooperatives and RRBs have

36
shown a distinct preference for financing small and marginal farmers.
Recent trends indicate that commercial banks have shown a distinct
preference for financing large farmers and this aspect is captured in the
widening gap in terms of per account credit disbursed between the three
categories of farmers especially since 2001-02. The policy makers should
impress upon the commercial bankers that they have to step up
financing to small and marginal farmers.
Expanding the role of Regional Rural Banks (RRBs)
2.46 The share of RRBs has been hovering around 10% in total GLC
Flow. There is a need to further push it up by at least 10% in the next
five years. In the next three years, their branch network needs to be
upscale (or adopt the tech route).
Big Push to Collectives of SF / MF, tenant farmers
2.47 For increasing the share of tenant farmers, oral lessees, marginal
and small farmers in their agricultural financing, commercial banks need
to take up the formation and financing of JLGs on a ‘mission mode’.
There is a need to push this intervention aggressively on the Central and
Eastern region of the country where 84% and 90% of the total number of
holdings in the respective regions are less than 2 hectares. Further, if
these groups have to be mainstreamed and benefit from the organized
retail chains, there is a need to give a push to formation of ‘producer
companies’ and other such collectives like ‘Farmers Clubs’. Formation
of these collectives should not be an end in itself but importantly
handholding and skill development with respect to marketing aspects is
also an essential. This brings into focus the need for adopting the ‘credit
plus’ approach to development but with a reorientation.
Understanding the current trends in marketing of rural products

37
2.48 Rural production needs to be increasingly undertaken in tune with
the trends in the market, if development needs to be market-led. For
achieving this, the role of market intelligence and its dissemination in the
form required by farmers is essential. A systematic network of ‘market
intelligence’ for farmers need to be created as currently the efforts are
sporadic and hence do not really add up.
Coping Mechanism for risk management for SF / MF
2.49 Given the increasing trends towards commercialization of
agriculture, farmers are also prone to risks-increasingly happenings in
the world markets. For SF / MF agricultural insurance markets have to
be made ‘friendlier’ so that they can access it better. In coming times,
volatility in prices would increasingly erode the income realization of
farmers. The instrument of Price Stabilization Fund (PSF) for such
designated commodities is the way out to absorb the price shock.
Exploit the Complementarities between Public and Private
Investment to the fullest
2.50 Public sector investment in agriculture is imperative for creation of
necessary infrastructure, whereas private investment in agriculture feeds
the necessary momentum to the sector by improving productivity, by
optimizing the existing infrastructure as well as by providing enhanced
income to the farmers. Thus, development of the sector necessitates that
both grow in tandem with each other. The Rural Infrastructure
Development Fund (RIDF) has emerged in recent years as a major rural
infrastructure creation initiative and can be made more effective if this
complementarity can be exploited to the fullest. The creation of Public
infrastructure through RIDF investment provides an opportunity for
bank finance (Private Investment) to be channalized for long-term
development of agriculture, if the enabling factors viz., extension services,
research and development etc are in place. Bank financed ‘ Area

38
Development Plan’ can be formulated by the banks to effectively work
the above complementarity.
Dispel the notion that agricultural financing is ‘necessarily’ risky
2.51 There is a perceived notion on the part of bankers that financing to
small and marginal farmers is “risky” vis-à-vis large farmers. This
perception however, is not based on any empirically validated data. This
perception stems out of the perception that agricultural financing is risky
and the first casualty are the small and marginal farmers. The evolving
concept of “aggregation” in Indian agriculture ought to be examined in
the broader context of the need to enhance productivity and improving
farmer livelihoods. Economic theory speaks of the problem of
indivisibility of fixed capital and how it is linked to the economies of
scale. Aggregation models on the one hand help benefitting from the
scale, on the other hand help in creating credit absorption capacity and
in accessing technology and markets. With its experience in promoting
ground level, people centric institutions in the past, NABARD may
be advised to initiate pilots in this area. JLGs promoted by NABARD
could also serve as intermediate interventions within this framework.
Recommendations
2.52 There is a need to completely re-look at the philosophical approach
to agricultural credit. Instead of looking at credit as a “push” of one more
input for agriculture, it should be seen as a product that would delight
the customer. Therefore, it is important to ensure that subsidies that
could be earmarked for this sector and the subventions for the sector are
designed and delivered smartly.
The Changing Landscape

39
2.53 The approach to agricultural credit should keep in mind the
changing landscape and build in those elements. The changing landscape
can be described as follows:
UID project: The ambitious Unique Identity project of the central
government is moving towards not only providing bio-metric identity, but
alongwith it linking the project with the financial inclusion agenda.
Banks are active partners in the project by being registrars and the
central government has issued a notification indicating that the UID
number would be sufficient evidence for opening accounts as necessary
documentation for meeting the Know Your Customer [KYC] requirements.
The implication of the UID project is that it makes the opening of
accounts much simpler. It might not remove the hasseles in transactions.
2.54 Policy thrust towards having transactions in formal channels:
By mandating that all payments such as wages under MGNREGA,
pension payments and possible future cash transfers of subsidies to be
routed through bank accounts, the policy has almost made it mandatory
for the beneficiaries to open and operate bank accounts.
2.55 Policy thrust on Financial Inclusion: There has been a major
thrust in the policy of financial inclusion which has been undertaken
both by the central government as well as the Reserve Bank of India.
Both these initiatives ensure that all the villages with more than a
population of 2,000 will be covered by banking services. The definition of
banking services includes [a] offering a savings account [with overdraft],
[b] a remittance service, [c] a accumulating savings service in the form of
a recurring deposit, and [d] an enterprise loan. All these initiatives are
being taken up through multiple channels including banking
correspondents and thus the services are getting individualised. In
addition The Reserve Bank of India has:
• Liberalized its licencing policy in favour of unbanked areas by allowing
the banks to open branches in locations that have less than 50,000
population without the need for a licence.

40
• Asked the banks to submit a financial inclusion plan and how they
would provide banking services to villages that have less than 2,000
population in a clear timeframe.
• Taken initiatives to extend banking to the last mile by allowing the
appointment of business correspondents, allowing them to undertake
cash transfers to a limited extent and by encouraging mobile
companies to be a part of the financial inclusion initiatives.
• Removed caps on interest rates on all forms of loans [except
agricultural loans and loans by MFIs using the banks loans under
priority sector lending] so that the banks can operate in the markets
freely by fixing a fair interest rate that gives them a decent risk
adjusted return.
2.56 Reform of Co-operatives: The agricultural co-operatives are being
revived and revitalized through the implementation of the Vaidyanathan
Task Force recommendations. Most of the states have signed an MOU
with the central government and the co-operative structure is being
brought back to life. Several states have passed a new, parallel and
liberal co-operative legislation. In addition the states have also amended
the old legislation to bring it in line with the recommendations of the
Vaidyanathan Task Force. This people-friendly legislation will foster more
and more self-managed financial institutions in the days to come and
hopefully will revive a vibrant primary co-operative movement.
The post offices have a significant presence in the last mile. We will have
to examine ways of using this infrastructure for products that is natural
to this channel.
2.57 Technology, Infrastructure: The next big change that is going to
happen pertains to the technology platform. All the commercial banks,
and now the regional rural banks will be on a Core Banking Platform,
providing seamless connectivity. The telecom infrastructure will play a
significant role. The accounts of the individuals will become branchless

41
and inter-operable through multiple channels and the pressure on the
banking at the “counter” will significantly reduce. If there are innovative
ways in which cash-in, cash-out transactions can be avoided, then the
hierarchy of customers in banking might shrink as the technology will be
capable of undertaking very small transactions as well. The technology is
in place and the infrastructural costs are borne by a purpose other than
banking and banking can benefit by providing marginal revenues on the
marginal costs of an existing infrastructure.
2.58 The cost of the client end equipment is ported to the client unlike
the smart card technology where a POS terminal had to be present. Given
that the instrument is in the hands of the client, almost always, that
could potentially become a wallet, with settlements happening without
the necessary exchange of physical currency. Technology is growing at
this pace and evolving fast to meet the poorest, it is possible that the
access to financial services will be fundamentally redesigned in the
coming years.
2.59 A major part of the attractiveness of the evolution of technology
[unlike in the past] is that most of the technological interventions [except
CBS] is not being developed exclusively for banking. Therefore the
banking channel need not bear the full cost of the evolving technology. It
just will have to bear the carrying cost. With mobile phones and signals
being available in the remote parts, this would turn out to be a POS
device, which essentially could also increase the banking penetration at
the individual level. All this means that an individual data capture will
happen on the banking platform. The transaction trail will partly remove
the information asymmetry that the banking system suffers from.
Approach
2.60 The approach to the delivery of credit should be based on the
principle of data, information, technology and flexibility. There should be

42
a constant monitoring of where the credit is going, how effective is credit
and whether the horizon is that of creating a long term sustainability.
If we look at why it is necessary for an individual to make multiple trips
to the bank, we clearly realize that initially it is for the purposes of
documentation. The next stage, the individuals have to visit the bank in
order to either withdraw or deposit the cash. At present, there is enough
technology available that can minimise this cash-in cash-out
transactions. For this to happen, a KCC for instance has to be literally a
credit card that is not only inter-operable across bank branches, but also
swipable with the local commercial establishments. If the basic mantra of
the plan period is to shift agricultural credit towards limits and cashless
transactions, we would find that this would lead to two benefits:
a. the overall transaction costs for the farmer, particularly her/his
out of pocket expenses will significantly reduced
b. the transactions can be potentially captured by the usage pattern.
This data can be mined [without violating the privacy norms] on a
gross basis to understand the usage patterns and to understand
how policy could be directed.
2.61 All subsidies intended for this sector should be directed towards
building robust and friendly systems that make banking and credit
accessible – that instead of reducing the interest cost – which gives rise
either to arbitrage at the farmer level or transactional arbitrage, it should
be directed towards making systems and technology work for the purpose
of reaching a larger set of people. While it is true that agricultural
subsidies in India are much less when compared to the rest of the world,
especially European countries, and the Indian farmers do need support;
the question of affordability of subsidies and direction of subsidies to the
appropriate segments cannot be sidelined. In the context of credit
subsidy, it is pertinent to note that those who really deserve subsidies
are perhaps not covered under the institutional credit. Theoretically, as
well as empirically, evidences of subsides creating market distortions are

43
available. The WG has flagged the issue of subvention/subsidy in the
above context. The recommendation is to rationalize subsidy in such a
way that it creates minimum distortion in the market and also the
amount involved is used more productively.
2.62 A simple exercise to calculate interest subvention/subsidies over
the projected short term credit requirement for the 12th FYP (for all
agencies together) was carried out. The subsidy or interest subvention
amount is the difference between the interest amounts at two different
rates viz., 10% (assumed) and the prevailing 7%. The crop loan amount
has been assumed to be outstanding over a period of six months. With
this assumption, over the projected Short term credit of about
Rs.28,53,577 crore, subvention works out to Rs. 42,000 crore at the
prevailing rate of interest of 7%, implying an average expenditure of Rs.
8500 crore on subsidies per year. This amount does not include the state
government subsidies which have brought down the interest rates further
to about 4%, indicating involvement of roughly similar quantum of
subsidy. These two sets of subsides thus, together, represent a pool of
resources which can be utilized more rationally. The WG is of the view
that with this pool of resources, it may be possible to retain the interest
rate at 7% and also create a corpus to take care of risk mitigation
requirements or weather based instabilities and climate change. These
resources could also be dedicated to creation of rural infrastructure,
especially ‘soft infrastructure’ which will go a long way in meeting the
needs of the farmers. Large public investment in either case, will facilitate
building confidence of the bankers and the farmers in investing in
agriculture.

44
Chapter III
Cooperative Credit Institutions
3.1 The XII Plan Sub Group on cooperatives was appointed with the
ToR to review the contribution and performance of credit cooperatives
towards outreach of credit to agriculture and allied activities and
recommend measures for their increased proactive participation.
Cooperative Credit Structure in the country consists of two wings,viz.,
Short Term Co-operative Credit Structure (STCCS) and Long Term Co-
operative Credit Structure (LTCCS). The STCCS deals with Short and
Medium Term Credit requirements for agricultural purposes and it is
largely federal in character. The federal structure based on a three-tier
pattern with the State Cooperative Banks (SCBs) at the Apex level,
District Central Co-operative Banks (DCCBs) at the intermediary level
and Primary Agricultural Credit Societies (PACS) at the village level.
Under the LTCCS, the Agricultural and Rural Development Banks
(ARDBs) cater to the investment credit requirements in the rural areas
and, thus, promote fixed capital formation in the agriculture sector. The
organisational pattern is not uniform all over the country. Majority of
states have a federal set-up with the State Cooperative Agriculture and
Rural Development Banks (SCARDBs) at the state level and affiliated
Primary cooperative Agriculture and Rural Development Banks
(PCARDBs) at the district or taluka levels while in some states, the
structure is of unitary type, the operational units below the SCARDBs
being its branches (Table 3.1).

45
Table 3.1: Structure of cooperative credit institutions Type of Institution Number
Short-term
PACS 95614
DCCB 370
SCB 31
Long-term Number
PCARDB 69
SCARDB 20
Agricultural credit flow from cooperatives during X and XI Plans
3.2 During the X Five Year Plan, agricultural credit flow from all
institutional agencies was ` 6,47,101 crore, the share of cooperative
banks, being 25.3 per cent (` 1,63,626). There had been regional
variations in the share of cooperative banks and the shares ranged from
3.49 per cent in the NE region to 33.98 per cent in the western region
(Table 3.2).
Table 3.2: Share of different agencies in total GLC disbursements during the X Plan (` crore)
Region Comml Banks
Share (%)
SCB/ DCCB
Share (%)
SCARDB/ PCARDB
Share (%)
RRB Share (%)
Total
Northern Region
118945 64.2 52244 28.2 4384 2.4 9723 5.2 185305
NE Region
2112 80.5 87 3.3 4 0.2 418 15.9 2622
Eastern Region
28691 65.6 9707 22.2 333 0.8 5007 11.4 43764
Central Region
52438 55.7 19392 20.6 4799 5.1 17456 18.6 94085
Western Region
57765 62.1 31342 33.7 287 0.3 3319 3.6 93074
Southern Region
161267 70.7 38861 17.0 2185 1.0 25790 11.3 228251
Total 421218 65.1 151634
23.4 11992 1.9 61713 9.5 647101
Year wise disbursements in respect of co-operatives are given in Annexure 1
3.3 During the first three years of XI Five Year Plan, viz. 2007-08, 2008-
09 and 2009-10, agricultural credit flow from institutional sources was `
9,39,161 crore; the share of cooperative banks declining to 15.95 per

46
cent. However, the annual average credit flow from cooperatives was `
32,725 crore during the X Plan and ` 50,030 crore during XI Plan.
(Table 3.2 & 3.3).
*: Commercial Banks Year wise disbursements in respect of co-operatives are given in Annexure 2
Growth in agricultural credit by cooperatives
3.4 Agricultural credit from cooperatives which registered a compound
annual growth rate (CAGR) of 17 per cent during the X Plan, decelerated
to 7 per cent during the XI Plan. While the STCCS registered a positive
growth in credit, the LTCCS registered negative growth during both the
Plan periods. This is an area of concern as it can jeopardize capital
formation in the farm sector (Table 3.4).
Table 3.3: Share of different agencies in total GLC disbursements during the XI Plan (First 3 Years)
(` crore) Region CBs* Share
(%) SCB/ DCCB
Share (%)
SCARDB/
PCARDB
Share (%)
RRB Share (%)
Total
Northern Region
185155 71.8 53044 20.56 2276 0.9 17328 6.7 257947
NE Region 3279 79.8 119 2.89 2 0.1 710 17.3 4110 Eastern Region
48226 70.4 11399 16.64 422 0.6 8429 12.3 68493
Central Region
78018 62.8 17069 13.74 1657 1.3 24535 19.8 124195
Western Region
98210 74.5 24503 18.60 226 0.2 4101 3.1 131757
Southern Region
281032 79.7 38054 10.79 1321 0.4 32190 9.1 352657
Total 693920 73.9 144187 15.35 5904 0.6 87294 9.3 939161

47
Table 3.4: Growth in flow of agricultural credit from cooperatives during X and XI plan
Region Growth in Credit flow (CAGR %)
X plan XI plan SCB/ DCCB
PCARDB SCARDB
Total SCB/ DCCB
PCARDB SCARDB
Total
Northern Region 22 -3 20 8 8 8 NE Region 12 -2 11 20 -4 20 Eastern Region 24 -3 23 25 17 25 Central Region 16 -23 7 9 23 10 Western Region 21 13 21 18 -16.0 17 Southern Region 16 -11 14 23 -7.0 22 ALL INDIA 20 -13 17 7 -12.00 6.7
Number of agricultural accounts and SF/MF coverage
3.5 Number of accounts and GLC for agricultural credit for 2007-08
and 2008-09 are presented in Table 3.5. It could be seen that during
2007-08, cooperatives had the largest number of total accounts and
SF/MF accounts under agricultural credit .
Table 3.5: Number A/Cs and GLC for agricultural credit (Number of A/Cs in lakh and GLC in (` crore)
Financial Institutions
2007-08 2008-09 2009-10 Total No. of A/Cs
No. of SF/MF A/Cs %
Total No. of A/Cs
No. of SF/MF A/Cs %
Total No. of A/Cs
No. of SF/MF A/Cs %
Comm. Banks 174.79 97.44 55.75 202.45 105.59 52.16
205.30
106.72
52.0
Co-op Banks 201.81 117.86 58.40 178.18 97.05 54.47
203.92
128.17
62.9
RRBs 62.74 42.21 67.28 75.47 42.71 56.59
73.08
49.84
68.2
Total 439.34 257.51 58.61 456.1 245.35 53.79 482.30 284.73 59.0 GLC SF/MF % GLC SF/MF % GLC SF/MF %
Comm. Banks 181087.61 52230.75 28.84 228951.31 121859 53.22 285799.
73 67668.9
3 23.6
Co-op Banks 48258.19 22608.79 46.85 45965.61 26188.43 56.97 63496.8
5 29519.1
2 46.5
RRBs 25311.65 15018.97 59.34 26764.68 16443.96 61.44 35217.6
2 21089.0
6 60.0
Total 254657.45 89858.51 35.29 301681.6 164491.
39 54.52 384514.20
118277.11 30.8
Source: NABARD

48
Credit flow projections for XII plan
3.6 Four broad scenarios have been projected for estimating the total
GLC in agriculture during the 12th FYP period. In order to achieve the
overall GDP growth envisaged in 12th FYP period, agricultural sector
needs to grow at 3% annually for 8.5% overall GDP growth and at 4%
annually for overall GDP growth of 9 to 9.5%. Of the total required
investment in the sector, share of the private sector was arrived at based
on the past trend (10 years). Similarly, the ratio of institutional sources
in the total private investment has been estimated and used for
estimating the credit flow through the banking channel. Rrequirement of
agricultural credit flow during XII plan are presented in Table 3.6.

49
Table 3.6: Summary of various projections of GLC for agriculture and allied activities for XII FYP (2012-17)
(` crore) Sr.No
Particulars Total Projection for
12th FYP period
(` crore)
Share of Co-
operatives (` crore)
% Share of co-operatives
Per anuum average credit from co-
operatives during 12th FYP period
(` crore) 1 Scenario 1- GDP
Agriculture grows at 3% annually, ICOR (Agri) at 4
33,89,261 7,33,998 21.66
1,46,800
2 Scenario 2 - GDP Agriculture grows at 3% annually, ICOR (Agri) at 4.5
40,41,694 8,75,292 21.66
1,75,058
3 Scenario 3 - GDP Agriculture grows at 4% annually, ICOR (Agri) at 4
35,29,102 7,64,481 21.66
1,52,896
4 Scenario 4 - GDP Agriculture grows at 4% annually, ICOR (Agri) at 4.5
42,08,454 9,11,643 21.66
1,82,329
5 Scenario 5 -Trend Based Projections
37,39,022 8,25,252 22.07
1,65,050
6 Scenario 6-Ratio of GLCA to GDPA method
31,24,624 6,75,619 21.62 1,35,124
Notes:
1. Private Sector Share in Total Investment in Agriculture is 80%. 2. Private Sector investment financed by institutional sources is 80% of the total investment in private sector 3. Ratio of Production to Investment credit assumed at 70:30(existing share) and by the end of the terminal year to reach 66:34 4. For ST: The existing shares of Cooperatives, RRBs and CBs in the total credit are 27,11.5 and 61.5 per cent respectively 5. For LT: The shares of Cooperatives, RRBs and CBs in the total credit are 7, 4.5 and 88.5 respectively

50
Issues in increasing credit flow through cooperatives Poor resource base
3.7 PACS have an average membership of about 1,400 and owned
funds of ` 13 1akh per society. As PACS were almost always set up due
to state initiatives, which were themselves driven on provision of credit,
hardly any attempts were made towards making primary cooperatives
(PACS) self sufficient through share capital and member deposits in most
states. Thus, excepting about 22,000 PACS in the four southern states
and West Bengal where average PACS deposits are about ` 90 lakh, the
average deposits in the remaining 74,000 PACS in the country even today
hardly average ` 9 lakh, or less than ` 650 per member. Continued poor
governance, management and institutional infrastructure in PACS also
did not aid the cause. The poor resources of PACS were expected to be
supplemented by the upper tiers, CCBs and SCBs, by tapping deposits
from non agricultural areas and clients. Over a period, they also seem to
have lost way, and although deposits of CCBs are close to ` 1.25 lakh
crore, and their CD ratio is also high at 72%, the ratio of their
agricultural credit1 to deposits (or, the agricultural-credit deposit ratio) is
less than 35%. In other words, even CCBs have started shying from
agricultural credit, the primary reason for which they were set up, and
are finding other businesses for themselves. The story of SCBs is not
much different. The ST CCS has therefore continued to rely heavily on
refinance support from apex institutions like NABARD, an approach that
was initiated by the RBI a long time ago.
Table 3.7: Resource base of co-operatives as on 31 March 2009 (` crore) Agency Share cap. Reserve Deposits Borrowings Total SCB
1390.48
(1.35) 8763.95
( 8.50) 71315.07
(69.20) 21582.21
(20.94) 103051.71
(100.00) DCCB
6071.41
(3.45) 17808.01
(10.11) 123721.82
(70.26) 28477.64
(16.17) 176078.88
(100.00) PACS
7007.32
(8.05) 4888.5 (5.61)
26245.38 (30.14)
48938.44 (56.20)
87079.64 (100.00)
1 primarily, their liquidity support to PACS

51
3.8 The limited loanable resources of PACS forced them to initiate
credit rationing by setting credit ceilings per member1. Simultaneously,
their borrowing capacities, limited because of low share capital
contributed by members and poor profitability, were sought to be
enhanced by infusion of state funds as share capital. State funds,
coupled with poor human resources in both governance and
management structures proved to be the ideal backdrop for state-led
interference in their administrative and financial decision-making.
3.9 The net result of this approach that continued for over 50 years
was that the cooperatives never became member driven and member
centric, and could not be relied on for a massive increase in provision of
agricultural credit that the country needed for boosting agricultural
production under the grow more food campaign in the 1970’s. It is this
failure of the ST CCS that first mandated commercial banks to move to
rural areas and provide agricultural credit, and later prompted designing
of small sized localised banks called RRBs2 that were expected to have
the local touch of cooperatives and financial management abilities of
commercial banks.
Financial health 3.10 The financial health of the credit institutions is a cause for
serious concerns. While the majority of the institutions in the STCCS are
in profit and the accumulated losses are also coming down over the
years, the LTCCS presents a totally different picture. Not only do the
LTCCS as unit register increasing losses over the years, its accumulated
1 Such ceilings are called individual maximum borrowing power (IMBP) and were designed to ensure that
a few dominating members do not usurp the limited resources available. In most cases, IMBP has not been revised for years, and members often do not get adequate credit even if resources are available. Another reason is that the PACS tries to avoid large defaults by limiting the loan size itself.
2 Commercial banks and RRBs now have about 50,000 rural and semi-urban branches

52
losses in 2010 was to the extent of ` 5,275 crore by end-2010, i.e., it has
eroded its owned funds to the extent of 59%.
Share of Cooperatives in Agricultural Credit
3.11 Despite the entry of commercial banks and RRBs in the 1970’s,
cooperatives continued to provide significantly larger portion of
agricultural credit for another two decades. Even until early 1990’s,
cooperatives provided almost 62% of the agri-credit in the country, with
commercial banks providing a little more than 30%, and the RRBs
meeting a meagre 7%. By the turn of the century, however, the
commercial banks had overtaken the cooperatives, and were providing
74% of agri-credit by 2010-11 and the share of cooperatives dwindling to
a meagre 10%.
Status of Implementation STCCS Revival Package and its Impact
3.12 As implementation of the GoI revival package progressed, 25
States joined the Package. Cooperative State Acts (CSAs) have been
amended in 21 states. Professional CEOs or Directors have been or are
being appointed in most of the states. Statutory audit by Chartered
Accountants have commenced in 16 states. The GoI has released `
9,016.6 crore so far for recapitalisation of 52,000 PACS in 16 states and
the process for further releases is on.
3.13 The most significant activity carried out under the Revival Package
is that of HRD initiatives. Moreover 80,000 staff and secretaries of PACS,
1.09 lakh elected members of PACS, 370 CEOs of CCBs and SCBs, 2,000
elected Board Members of CCBs and 1,500 branch managers of CCBs
have been trained within two years through modules, specially designed
by NABARD. The focus of these training programmes has been business
diversification and prudent financial and business management. This is a
continuing initiative.

53
3.14 Standardised Accounting and MIS package has been designed and
implemented in PACS and the process of computerising the same in all
the PACS that have received assistance under the package is underway.
NABARD is in the process of organising a CBS based package for
interested CCBs and SCBs on application service provider (ASP) basis
outside the GoI package and 125 banks have already joined the initiative.
3.15 These efforts, together with the financial cleansing received by the
cooperatives under the Agriculture Debt Waiver and Debt Relief Scheme
(ADWDR) of the GoI has seen agri-credit by cooperatives increase
substantially from ` 48,000 crore disbursed to 2.02 crore farmers to `
63,500 crore disbursed to 2.04 crore farmers. Given, however, that PACS
have a membership of over 12 crore and CCS has issued more than 3.79
crore KCC, there is substantial scope for increasing agri-credit
dispensation by cooperatives.
Is the CCS capable of meeting the future challenges?
3.16 While crop loans in the banking system grew at 28% during
1997 to 2007, crop loans by the CCS grew only at 14%1. Crop loans
outstanding were 65% of the deposit base of CCBs in 20072. The overall
CAGR for crop loans was 24 per cent during the first three years of the XI
Plan and are expected to grow at at least 20% in the next five years.
Agricultural credit by the CCS would continue to increase but the pace of
growth is expected to flatten to about 16% and the amount expected to
be disbursed would be ` 2.05 lakh crore by 2018, or three times the
disbursements in 2011.
3.17 The deposits of CCBs grew only at about 8% from 2002 to 2007
compared to 15% by RRBs. Even if the growth rate of deposits in CCBs
increases by another 50% to touch 12% in the next decade, these
1 Crop loans by RRBs grew at 31 % during the corresponding period. 2 As mentioned earlier, deposits were negligible in PACS excepting in a few states, and CCBs were
therefore, meant to mobilise deposits from the semi urban and small town areas so as to provide loanable funds to PACS.

54
deposits would still not support more than ` 1.40 lakh crore of crop loans
thereby needing NABARD refinance support of at least ` 65,000 crore by
2018, if cooperatives have to even maintain their share in the total agri-
credit provided by the banking system. With this limited, but still fast
growth of credit flow in PACS which would in any case not be matched by
deposits mobilised from members of PACS, the concept of mutuality of
thrift and credit would continue to be weak in PACS and PACS would
continue to be poorly governed despite implementation of Vaidyanathan
recommendations.
3.18 To sum up the WG is of the view that, the revival package
represents one of the largest programmes of the Government to bring
back the STCCS on rails to take care of outreach especially to the small
and marginal farmers. The implementation is now more or less over and
it can be seen that while the revival package has helped in financial
terms, it has still raised concerns like states not making changes in the
law and some states reverting to tight control by RCS, external
interferences after receiving assistance waivers etc.. The WG
recommends that unless legal and institutional reforms in the
package are implemented in letter and spirit, cooperatives cannot be
rebuilt.
3.19 An area of concern that needs to be addressed with a sense of
urgency is the debilitating financial health of the LTCCS and their
inability to finance capital formation in the agriculture sector, the
purpose for which they were set up in the first place. Such a situation
could have long time deleterious consequences on sustaining growth in
the agriculture sector. A decision, perhaps, may have to be taken quickly
on the package for revival of the LTCC and its implementation can
commence forthwith.
Action for the Future
Improving Share Capital and Deposit Safety

55
3.20 The critical issue for the future is therefore increasing member
participation in the affairs of PACS and ensuring that members have a
substantial financial stake in the cooperative. As PACS were often formed
as state led initiatives in the name of the “poor farmer”, the face value of
membership fee or a share in a PACS has often remained at a paltry ` 10,
or at best ` 100 per member, and more often than not, even this was
provided by the state under “universal membership” campaigns. It is
clear that in today’s world, such a low share-price has no value as far as
capital of even a small financial institution like a PACS is concerned.
True that the share capital of a member is linked to the quantum of loan,
thereby, notionally increasing the capital base of the cooperative but the
fact remains that unless dividend is paid on such share capital, the cost
of credit from a cooperative becomes much higher than that from
competing banks, i.e., RRBs and Commercial Banks. Unfortunately, even
profit making PACS were often denied permission for paying dividend. In
any case, half the PACS were making losses. It is therefore necessary to
increase per member share capital to at least ` 500 which, technically, is
not even two or three day’s wages of a single member of a rural family.
3.21 Members today are hesitant to keep deposits even with their own
PACS as they are rightfully concerned about the safety of their deposits.
Since such deposits would not be covered by DICGC, and the deposit
insurance schemes of states have remained only on paper, NABARD has
formulated an “Institutional Protection and Deposit Safety Scheme
(IPDSS) for PACS on the lines of similar schemes operating in Germany
and Hungary1. Sustained campaign, incentivising a habit of making
regular thrift among farmers, a la SHGs, is therefore necessary as part of 1 The very fact that most loans of a PACS are concentrated in a
small geographical area of a few villages and for a single economic activity, agriculture, makes the assets of a PACS riskier. A variety of safety nets other than crop insurance are therefore essential. The “institutional protection” part of the scheme focuses on preventing a PACS from failing by taking remedial action as soon as any disturbing signs emerge. The action may include mandating managerial intervention, liquidity support, temporary or long term restructuring, or even merger with another PACS and so on. Entry barriers are proposed under the scheme to ensure serious participation. Only when closure of a PACS becomes inevitable does the “deposit safety” aspect gets activated which is a pure pay-out from a deposit safety fund. The scheme has been sent to DFS for establishing a Central IPDSS Fund.

56
the financial literacy and counselling initiatives. Immediate launching of
IPDSS would give a boost to this initiative.
Increasing Member Participation 3.22 Farmers have become used to treating themselves as mere “clients”
of PACS from where they avail credit with their responsibility limited to
voting in the occasional elections in the PACS. Even these votes are often
cast on party affiliations with little reference to functioning of the PACS
or the capability of the Committee Members. This needs to change
immediately. Campaigns to make members aware of their rights and
responsibilities, and formation of village committees of members to
monitor and activate members in the regular functioning of PACS would
have to be immediately planned and executed.
3.23 With the increasing number of small and marginal farmers and
oral tenancy, formation of JLGs within these village committees then
becomes the next necessary step1. NABARD has already initiated such a
move that needs to be converted into a mission mode.
3.24 The central theme for increasing member participation in the
affairs of the PACS is take steps which increase the number of contacts
between the member and the PACS. It is easy to surmise that the most
effective contact can only be through fruitful business between the two,
and the product range offered by the PACS therefore needs to widen
significantly.
Improving product Range of PACS.
3.25 PACS today primarily offer crop loans and have been legally
enabled to provide loans for farm investment and other activities. Some
1 Though oral tenants are being financed by banks through JLGs,
such tenants still find it difficult to get services like crop insurance, various subsidies, etc. It is time land tenancy laws are changed in all the states. In W Bengal, sharecropping is legalized and A.P. is contemplating issuing a land use certificate valid for a crop season to such tenants to help them get bank loans. Similar initiatives are necessary in all the sates.

57
PACS also stock fertilisers. Most members, however, have to look to other
agencies not necessarily located in their village to even get other products
and services required for their farming operations. This increases the
farmer’s transaction costs.
3.26 It would be necessary to convert PACS into one stop shop for
farmers – the member farmer must first think of his PACS whatever he
needs for his farming operations and also otherwise, and the PACS needs
to be enabled to either itself provide that product or service or arrange for
that expeditiously. Examples of PACS engaged in procurement, providing
warehousing facilities, stocking and providing other inputs including
seeds and saplings, leasing out farm equipments, becoming e-enabled
common service centres providing land records and information on
weather, market prices, and extension advisories, and so on are now
available in some states1. PACS also need to provide other financial
products, especially insurance, and enhance their fee based income. A
planned initiative to develop at least 5 such multi-purpose PACS in each
district within one year could be the first step of a national drive. These
will have demonstration and demand effect and help other PACS in the
district to develop similarly. Substantive and well planned HR initiatives
will be part of any such drive including providing managerial support and
manpower wherever required.
3.27 In Punjab, some of the cooperative societies have started
maintaining a stock of farm machinery including tractors which can be
hired by farmers at will. This model was found to be highly successful as
the farmers are relieved from the stress of having to buy the equipment
from the market at high costs. This initiative in Punjab is mainly
cooperative- driven and is amenable for replication in areas where
cooperatives have a strong presence. Such initiatives are particularly
significant as they help in relieving the debt burden on farmers. Whether
1 Some PACS have even been found to be selling cooking gas (rather than diesel for farm operations) to
households because they believed the womenfolk also need to be closely associated with the PACS to improve member participation and loyalty !
58
this has to be taken forward as a state-driven or cooperative-driven
initiative, if replicated in other states, was deliberated by the Working
Group. It was suggested that well- functioning PACS in different states
should be identified, so that the model could be implemented. The
successful functioning of the Cooperative Development Fund in Tamil
Nadu was also cited, wherein, the amount aggregated under the fund was
disbursed as interest- free loans to farmers by several cooperatives.
Legal and Regulatory Enablement 3.28 As mentioned earlier, Cooperative Societies Acts (CSA) have been
amended in 21 states on the sidelines of the Vaidyanathan Committee
recommendations1. These amendments aimed at providing flexibility to
the CCS entities to make them more efficient. For example, any CCS
entity can now take loans from any financial institution regulated by RBI.
Technically, this enables a PACS or CCB to take loans from any other
cooperative bank, commercial bank or an RRB or even refinance directly
or indirectly from NABARD. However, consequential amendments in
NABARD Act to provide refinance to any PACS directly or through a
commercial bank or RRB are yet to be made which practically nullifies
the enablement created through the CSA amendments. Likewise,
amendments are yet to be made to enable cooperatives registered under
the parallel cooperative societies Acts or the multi state cooperative
societies Act (MSCSA) to be recognised as banks2. Consequential
amendments would also be required in the DICGC Act, BR Act, and RBI
Act. Without such amendments, the intended reforms of the
Vaidyanathan package will go only half the way and leave sufficient scope
with the states to continue interfering in the affairs of the cooperatives. 1 States like Punjab and Uttarakhand, apart from some NER states, have not amended their Coop
Societies Acts so far. 2The present MSCSA allows a primary multi state cooperative to be recognized as a bank but does not allow a federal cooperative to be recognized as a bank. A recent Supreme Court ruling that a cooperative working the whole of a state is deemed to be automatically functioning under the MSCSA if the state is divided has created a legal impasse as some of the SCBs are now deemed multi state cooperatives but the MSCSA itself has no provision for such federal coops to be recognized as banks.

59
To Sum Up
3.29 A national programme for PACS focussing on the following may
be designed and launched :
(a) Design and run a media based sustained campaign to increase
awareness among members of PACS on their rights and responsibilities
and how they can fulfil the same to improve its functioning to help the
members themselves. The campaign to propagate importance of savings
and encouraging the members to keep deposits with their own PACS has
to be initiated.
(b) Launch Institutional Protection and Deposit Scheme for PACS.
Using the inputs from the above campaign, transform five PACS in each
district to provide a range of financial and non-financial products to its
members which improve the profitability of member farmers themselves.
( c )Design and execute the required HRD plan for this initiative.
Immediately amend MSCSA, Parallel Cooperative Societies Acts of various
states, NABARD Act, BR Act, DICGC Act, and RBI Act.

60
Annexure 3.1: Year-wise credit flow from ST cooperatives and their share in GLC during X Plan
(` lakh)
Region
2002-03
2003-04
2004-05
2005-06 2006-07
SCB/ DCCB
Total credit
% SCB/ DCCB
Total credit
% SCB/ DCCB
Total credit
% SCB/ DCCB
Total credit
% SCB/ DCCB
Total credit
%
Northern Region
693930
1745488
39.76
782457 2181869
35.86
1020760
3212464
31.77
1276005
5044838
25.29
1451261
6345800
22.87
North Eastern Region
1399 15386 9.09
1258 29994 4.19
1392 40733 3.42
3113 93571 3.33 1564 82529 1.90
Eastern Region
114774
386889
29.67
168308 504740 33.35
172796 723769 23.87
225853 1221627
18.49
289009 1539356
18.77
Central Region
280569
1002957
27.97
329681 1248734
26.40
383645 1714180
22.38
426099 2313365
18.42
519222 3129312
16.59
Western Region
447994
914223
49.00
451247 1012247
44.58
578206 1411102
40.98
745424 2617793
28.48
911333 3352062
27.19
Southern Region
555358
2155794
25.76
639112 2613740
24.45
725263 3683078
19.69
1057903
6351206
16.66
908473 8021263
11.33
ALL INDIA
2094024
6220737
33.66
2372063
7591324
31.25
2882062
10785326
26.72
3734397
17642400
21.17
4080862
22470322
18.16

61
Annexure 3.2: Year wise credit flow from ST cooperatives and their share in GLC during XI Plan (` lakh)
Region
2007-08 2008-09 2009-10 SCB/ DCCB
Total credit
% SCB/ DCCB
Total credit
% SCB/ DCCB
Total credit
%
Northern Region
1701746
6828000 24.92
1617527
8434283
19.18
1985158
10532500
18.85
North Eastern Region
3433 95798.31 3.58 3499 151407
2.31 4966 163786 3.03
Eastern Region
313745 1782180 17.60
333768
2239780
14.90
492338
2827339 17.41
Central Region
657717 3382004.94
19.45
556820
3829524
14.54
783940
5207987 15.05
Western Region
906514 3725131 24.34
759805
4225070
17.98
1255342
5225528 24.02
Southern Region
1066578
9583525 11.13
1116457
11234265
9.94 1622342
14447948
11.23
ALL INDIA 4649733
25396639.3
18.31
4387876
30114329
14.57
5360146
33197101
16.15
Annexure 3.3: Year wise credit flow from LT cooperatives and their share in GLC during XI Plan ( ` lakh)
Region
2007-08 2008-09 2009-10 PCARDB/ SCARDB
Total credit
% PCARDB/SCARDB
Total credit
% PCARDB/ SCARDB
Total credit
%
Northern Region
64947 6828000 0.95 86733
8434283 1.03
75912 10532500 0.72
North Eastern Region
87 95798.31
0.09 61 151407 0.04
81 163786 0.05
Eastern Region
12057 1782180 0.68 13672
2239780 0.61
16457 2827339 0.58
Central Region
44796.9 3382004.94
1.32 53045
3829524 1.39
67885 5207987 1.30
Western Region
9059 3725131 0.24 7090 4225070 0.17
6410 5225528 0.12
Southern Region
45139 9583525 0.47 48084
11234265
0.43
38854 14447948 0.27
ALL INDIA
176086 25396639.3
0.69 208685
30114329
0.69
137714
33197101 0.41

62
Annexure 3.4: National Cooperative Development Corporation (NCDC) 1. NCDC is a Development Financing Institution with the aim to promote the
Cooperative Sector. In recent years, in order to extend the outreach of credit
availability for cooperatives, NCDC has amended its Scheme and included newer
areas of funding. For NCDC to continue to play an effective role to provide
support and assistance to cooperatives for their overall development, in the 12th
Five Year Plan period, NCDC will continue to provide support and assistance to
cooperatives for their overall development. Moreover, with a view to broaden its
scope of funding, NCDC has taken following measures:
New services such as tourism, hospitality & transport, electricity
and power, rural housing, hospital, health care and education
cooperatives have been notified and suitable schemes, pattern of
assistance etc. have been introduced and intimated to the States/UTs.
A proposal for amendment in NCDC Act to include ‘Producer
Company’ in the definition of ‘Cooperative Society’ has been moved and
the same is under consideration of the Government of India so as to
enable producer companies to avail financial assistance from NCDC.
Creation of Enterprise Development Fund for financing new and
smaller cooperatives, which could not be earlier covered under direct
funding norms by liberalizing financing terms.
A Corporation Social Responsibility Programme has been
introduced by creating a non-lapsable fund for financing community
welfare oriented projects through small intervention of grant in aid as a
natural corollary to NCDC’s Schemes/activities.

63
A scheme for working capital assistance to credit cooperatives for
all activities covered under the purview of NCDC and for disbursement
of loans by women credit cooperatives to their members for
activities/services under the purview of NCDC has been introduced.
NCDC has also introduced scheme for assistance towards creation of
infrastructure facilities by credit cooperative.
The Corporation has laid special emphasis for sanctioning smaller
cooperatives/projects in large numbers to enlarge its coverage.
ι) With a view on sustaining a higher growth path for the cooperatives, it is
imperative that cost of funds to be made available should be cheaper than
prevailing market rates. The existing rate of interest being charged by NCDC
ranges between 11% to 13%. Cooperatives in general are unable to sustain
higher rate of interest and have been from time to time, requesting for
reduction in the rate of interest. Hence, an additional proposal for 3%
interest subvention amounting to ` 825.00 crore on loans is moved to be
included in the prospective 12th Five Year Plan Programme. The funds so
earmarked will be entirely passed on to the cooperatives availing financial
assistance from NCDC.
ιι) In order to overcome the constraints of adequate security coverage under
Direct Funding Scheme, it is proposed that a Guarantee Fund Scheme in
the line of Credit Guarantee Fund Scheme for micro and small enterprises
be introduced to cover financing by NCDC to cooperative societies to obviate
the need for collateral security cover, thereby giving scope to large number
of cooperatives to avail assistance directly from NCDC. NCDC should be
allowed to run the trust fund Scheme with a corpus of ` 100 crore provided
for the purpose.

64
ιιι) NCDC is providing assistance for computerisation to SCB/DCCB
involving a subsidy component ranging from 20% – 25% of the project
cost to Under Developed and Least Developed States. The Scheme for
computerization of SCB/DCCB was introduced by NCDC in 2005-06
and met with success. So far NCDC has sanctioned ` 91 crore to 23
projects. As per Vaidyanathan Committee recommendation, for
computerisation of Primary Agriculture Credit institution there is a
provision for 100% grant. Accordingly to widen the reach of this Scheme ,
the GOI may earmark ` 150 crore as 50% subsidy to assist 100 units @
` 3 crore per unit with in the 12th Plan period.
Keeping in view the requirement of funds during the 12th Plan period, NCDC’s
requirement of subsidy and grant from Govt. of India during the 12th Plan period
is as under:
S.N. Details ` in crore i Subsidy: a. under Restructured Central Sector
Scheme for on going projects b. Rehabilitation of Coop. Processing units c. MIS Scheme for SCBs & DCCB’s
Sub Total:
720.00
50.00 150.00 920.00
ii. Interest Subsidy: a. under Restructured Central Sector
Scheme for on going projects b. Rehabilitation of Coop. Processing units c. Interest subsidy of 3% from GOI for
loans by NCDC Sub Total:
90.00
265.00 825.00
1180.00
iii. Grants: a. Contribution to Corpus Fund of NCDC
b. Creation of Corpus for rehabilitation of sick Coop. units
c. Corpus Fund for creation of Cooperative Credit Guarantee Fund Scheme
Sub Total:
1500.00 150.00
100.00
1750.00
GRAND TOTAL (i+ii+iii) 3850.00

65
Chapter IV
Risk Mitigation Introduction
4.1 Agriculture in India despite its relatively diminishing contribution to Gross
Domestic Product (GDP), accounts for over 50 percent of employment, and
sustains close to 70 percent of the population. In addition to satisfying the food
and nutritional requirements of the nation, agriculture also provides important
raw materials to many key industries and accounts for a significant share of total
exports. Another salient feature of the Indian agriculture sector is the large
number of small sized landholdings. Of the estimated total 120 million farm-
holdings, 63 per cent of farm-holdings were less than one hectare in size, with
average holding size of merely 0.4 hectares. The performance of agriculture is vital
not only for the Indian farmers and the agribusiness entities, but also for the
Indian economy as a whole.
Climate of India and Climate Variability
4.2 The Indian Meteorological Department (IMD) was established as a National
agency in 1875 merging various provincial meteorological services which existed
in the 19th century. However, instrumental data and records for a few stations in
India existed since the 18th century. Broadly, the climate of India revolves around
the South-West Monsoon (June to September) that contributes nearly 3/4th of the
annual rainfall received by the country (IMD). Floods and droughts in India are
two key aspects of the weather arising from the excess or shortfall of monsoon
rains. A large number of studies are available on various aspects of floods and
droughts. One of the studies ranks 1918 as the year with the worst drought of the
20th century: a year when about 68.7 percent of the total area of the country was
severely affected by drought.
4.3 Because of the dominant influence of the monsoon, the climate and weather
profile of India exhibits the heaviest seasonal concentration of precipitation in the

66
world. Nearly 2/3rd of the land of the country is rain-fed, and almost 20 percent
of the total land area is perennially drought prone. The Ganges-Brahmaputra and
the Indus river systems are highly prone to flooding. The magnitude of flooding
has increased in the recent decades, from approximately 19 million hectares
affected 50 years ago to 40 million hectares in 2003, about 12 percent of India’s
geographic area. Though agriculture faces a multitude of risks including price
risks, financial risks, institutional risks, personal risks etc., production risk
however is the most important one from the perspective of scale and severity.
Indian agriculture is often and rightly termed as ‘the gamble of monsoon’ and is
characterized by high variability of production outcomes. Many exogenous and
endogenous factors in play during the production season make it impossible for
entities to forecast the output from agricultural production reliably.
4.4 The agriculture sector in India is thus subject to a great many uncertainties.
Uncertainty of crop yield is one of the fundamental risks, which farmers face,
more or less, in all countries, whether developed or developing. These risks are
particularly high, in developing countries particularly in the ‘tropics’ as in most of
these countries, the overwhelming majority of farmers are poor, with extremely
limited means and resources. Given these limitations, they cannot bear the risks
of crop failure of a disastrous nature.
Crop Insurance
4.5 Benjamin Franklin is likely to be the first person to have thought of Crop
Insurance. Based on a severe storm of 24th October 1788 in French countryside
which destroyed crops, he observed – “I have sometimes thought that it might be
well to establish an office of insurance for farms against the damage that may occur
to them by storms, blight, insects etc. A small sum paid by a number of farms would
repair such losses and prevent much distress”. However, the first crop insurance
programme in the form of hail insurance started in 1820s in France and Germany
for Grapes, while it started in USA in 1883 for tobacco crop. The earliest Multi-
67
Peril Crop Insurance (MPCI) started in USA in 1939, with formation of Federal
Crop Insurance Corporation (FCIC).
4.6 Agriculture, particularly prone to systemic and co-variant risk, doesn’t lend
itself to insurance easily. Lack of historical yield data, small sized and fragmented
farm holdings, low value crops and the relatively high cost of insurance, have
made it more difficult to design a workable crop insurance scheme.
4.7 A brief evolution and present status of Indian crop insurance is presented
below:
(i) Program based on ‘individual’ approach (1972-1978): The first ever crop
insurance program started in 1972 on H-4 cotton in Gujarat, and was extended
later, to a few other crops & states. The program by the time it wound up in 1978,
covered merely 3,110 farmers for a premium of Rs. 454,000 and paid claims of
Rs. 37.90 lakhs.
(ii) Pilot Crop Insurance Scheme – PCIS (1979-1984): PCIS was introduced on
the basis of report of Prof. V.M. Dandekar and was based on the ‘Homogeneous
Area’ approach. The scheme covered food crops (cereals, millets & pulses),
oilseeds, cotton, & potato; and was confined to borrowing farmers on a voluntary
basis. The scheme was implemented in 13 states and covered about 627,000
farmers, for a premium of Rs. 197 lakhs and paid indemnities of Rs. 157 lakhs.
(iii) Comprehensive Crop Insurance Scheme – CCIS (1985-1999): The scheme
was an expansion of PCIS, and was made compulsory for borrowing farmers. Sum
insured which was initially 150 percent of the loan amount, was reduced to a
maximum of Rs. 10,000 per farmer. Premium rates were 2 percent of the sum
insured for cereals & millets and 1 percent for pulses & oilseeds, with premium
and claims, shared between the Centre & States, in 2:1 ratio. The scheme when
wound up in 1999, was implemented in 16 States & 2 Union Territories and
cumulatively covered about 763 lakh farmers, for a premium of Rs. 403.56 crore
and paid indemnities of Rs.2319 crore.
National Agriculture Insurance Scheme –NAIS (1999)

68
4.8 NAIS replaced CCIS starting from Rabi 1999-00 season, presently
administered by Agriculture Insurance Company of India Limited (AIC) that
provides coverage to approximately 35 different types of crops during the Kharif
season and 30 during the Rabi season. Till Rabi 2010-11, NAIS cumulatively
covered 269.26 million hectares of crops grown by 176.18 million farmers covering
a risk of Rs. 221260 crore for a premium of Rs. 6592 crore and paying
indemnities of Rs. 22176 crore. The overall loss cost (indemnities to sum insured)
stands at 10.02 percent (Source: Agriculture Insurance Company of India
Limited). The following provides details of coverage and benefits under NAIS.
Table 4.5: Coverage and Benefits under NAIS (from Rabi 1999-2000) Rs. Crores
Season States/UTs Covered
Farmers Covered (millions)
Area covered (million ha)
Sum Insured
Premium
Claims
Farmers Benefited
Kharif 2000 17 8.41 13.22 6903.38 206.74 1222.48 3635252 2001 20 8.70 12.89 7502.46 261.62 493.54 1741873 2002 21 9.77 15.53 9431.69 325.47 1824.31 4297155 2003 23 7.97 12.36 8114.13 283.33 652.68 1712269 2004 25 12.69 24.27 13170.62 458.94 1038.17 2674743 2005 25 12.67 20.53 13519.10 449.95 1059.94 2666221 2006 25 12.93 19.67 14759.46 467.29 1774.91 3131511 2007 25 13.40 20.75 17007.96 524.32 915.20 1591277 2008 25 12.99 17.64 15665.41 511.92 2376.72 4216435 2009 27 18.25 25.83 27616.68 862.85 4564.38 7958106 2010 26 12.68 17.20 23706.45 721.69 1268.63 1787491 TOTAL 130.46 199.89 157397.34 5074.12 17190.96 35412333 Rabi 1999- 9 0.58 0.78 356.41 5.42 7.69 55288 2000- 18 2.09 3.11 1602.68 27.79 59.49 526697 2001- 20 1.96 3.15 1497.51 30.15 64.66 453325 2002- 21 2.33 4.04 1837.55 38.50 188.55 926408 2003- 22 4.42 6.47 3049.49 64.06 497.06 2098125 2004- 25 3.53 5.34 3774.21 75.85 160.59 772779 2005- 25 4.05 7.22 5071.66 104.82 338.30 980748 2006- 25 4.98 7.63 6542.21 142.88 515.96 1390430 2007- 25 5.04 7.39 7466.64 158.71 810.05 1578608 2008- 26 6.21 8.86 11148.59 295.72 1508.84 1977328 2009- 26 5.65 7.87 10875.61 287.35 566.61 1034504 2010- 25 4.88 7.51 10640.36 286.31 266.87 404771 TOTAL 45.72 69.37 63862.92 1517.56 4984.67 12199011 Grand Total 176.18 269.26 221260.26 6591.68 22175.63 47611344

69
Note: 2010-11 figures are provisional and doesn’t include all claims
4.9 NAIS despite best suited for Indian conditions, has some shortcomings. The
most important one is ‘basis risk’ as the area (insurance unit) is rarely
homogenous. Efforts are being made to lower the size of the area for minimizing
basis risk. As the index is based on yield, the insurance cover primarily operates
from ‘sowing till harvesting’, and for this reason pre-sowing and post-harvest
losses are not reflected in the yield index. Yet another challenge is the
infrastructure and manpower required to conduct over a couple of million crop
cutting experiments across the country to estimate the yields of crops. The
process also contributes to delay in settlement of indemnities as the crop cutting
experiments takes around three months and further data compilation, & final
claims settlement can sometimes take upto a year after harvest. Moreover, yield
index based insurance can be designed only for those crops where historical yield
data for at least 10 years (at insurance unit level) is available. Despite these
shortcomings, the area yield index crop insurance operational in India is still
regarded as one of the most illustrious crop insurance programmes in the world.
Modified National Agricultural Insurance Scheme (MNAIS)
Overview
4.10 The government announced a pilot on improved version of NAIS titled
‘Modified NAIS’ (MNAIS) w.e.f. Rabi 2010-11 season for experimentation in 50
districts. The new version has to a large extent taken care of the lacunae in the
existing NAIS. During Rabi 2010-11 season the pilot was implemented in 34
districts across 12 States.
Features 4.11 The following are a few salient features of MNAIS:
(i) Insurance Unit for major crops is village panchayat or other equivalent
unit;

70
(ii) In case of prevented / failed sowing, claims upto 25 percent of the sum
insured is payable, while insurance cover for subsequent period gets
terminated;
(iii) Post-harvest losses caused by cyclonic rains are assessed at farm level
for the crop harvested and left in ‘cut & spread’ condition upto a period of 2
weeks;
(iv) Individual farm level assessment of losses in case of localized calamities,
like hailstorm and landslide;
(v) On-account payment up to 25 percent of likely claim as advance, for
providing immediate relief to farmers in case of severe calamities;
(vi) Threshold yield based on average yield of past seven years, excluding
upto two years of declared natural calamities;
(vii) Minimum indemnity level of 70 percent is available (instead of 60 percent
as in NAIS); and
(viii) Premium rates are actuarial supported by up-front subsidy in premium,
which ranges from 25 percent to 75 percent, equally shared by Centre and
States. Insurer is responsible for the claims liabilities, hence the
government liability is only limited to premium subsidy which helps them in
planning their finances better.
4.12 MNAIS pilot has been approved for three seasons starting from Rabi 2010-
11 season and it is quite likely that the pilot may gradually replace NAIS over next
two to three years.
4.13 Issues
1. Insurance unit for major crops has been lowered to village / village
panchayat which is good for the farmers, but exponentially increases the
work load required for crop cutting experiments (CCEs). Many States are
shying away from the pilot because of the enormity of the workload. Some
states are requesting GoI to share part of the cost of CCEs. From the
insurer’s point of view, accurate and timely data is needed to price the
product accurately and to make timely pay-outs. It may be worthwhile in

71
the long run to employ technologies like satellite imagery for estimating the
yield.
2. Present premium subsidy structure does not provide much support for
lower to medium risk layers. For example for Rabi 2010-11 season farmers’
share of premium was Rs. 23.23 crore (out of total Rs. 47.30 crore). In other
words, farmers paid 50 percent of the cost of the insurance under MNAIS
compared to only about 30 percent under NAIS & WBCIS. There is a strong
need for increasing the premium subsidy for lower and medium tiersStates
also requesting for coverage of all local events/perils in the category of
‘localized calamities’, which presently includes only hailstorms and
landslides.
3. Weather index based insurance caught the imagination of policy makers at
the beginning of the 21st century. Development institutions like the World
Bank initiated pilots of this form of crop insurance in low income countries
where traditional crop insurance could not take off for various reasons that
include unavailability of historical yield and/or loss data. The underlying
principle for ‘weather index’ insurance is the quantitative relationship
between weather parameters and crop yields. There are various crop
modeling and statistical techniques to estimate the impact of deviations in
weather parameters on the crop yields.
4.14 It is noteworthy that a model of weather index insurance, as a mechanism
to compensate crop losses, was conceived as early as 1912 by Shri JS Chakravarti
of Mysore state. It was between 1912 and 1920 that he published technical papers
on the subject of ‘Rainfall Insurance’ and a book entitled ‘Agricultural Insurance:
A Practical Scheme Suited to Indian Conditions’, in 1920, describing how
rainfall index could be used to guarantee payouts to farmers due to adverse
deviations. He used rainfall data from 1870 to 1914 from India Meteorological
Department (IMD) to demonstrate the utility of the index. Surprisingly, the piece of
pioneering work from Chakravarti, probably one of the earliest monographs on the
subject, does not seem to have been taken into account in the analytical literature
on agricultural insurance. It was some 85 years later that the idea for developing a

72
weather index based insurance for managing the production risks of farmers in
low income countries was put forth by international development finance
institutions and academicians.
Weather Index: Key Advantages
4.15 One key advantage of weather index based crop insurance is that the
payouts can be made faster, besides the fact that the insurance contract is more
transparent and the transaction costs are lower. Because index insurance uses
objective, publicly available data it is less susceptible to moral hazard. Most
importantly there are many low income countries where no historical data
whatsoever is available, except weather data, affording an opportunity to try out
index insurance of some sort. Now a large amount of literature is available on
weather index insurance, mostly commissioned by the World Bank.
4.16 By virtue of the advocacy by the World Bank, many countries are piloting
weather index based crop insurance. Countries like Mexico, India, Ukraine,
Malawi, Ethiopia and China have been running pilots of weather index based crop
insurance for quite some time, while others like Tanzania, Nicaragua, Thailand,
Kazakhastan, Senegal, Morocco, Bangladesh, Vietnam etc. are witnessing the
development and fine-tuning of weather index products for pilots.
Weather Index Insurance: Indian Experience
4.17 An impressive repository of historical weather data, high dependence on
rains for crop production and huge pool of scientific resources place India at the
forefront when it comes to piloting different models of weather index insurance. The
government, on realizing the need for encouraging pilots of this promising risk
management tool has supported the weather index insurance program from 2007
onwards by providing financial support in the form of premium subsidy, paid up-
front. Boosted by the state support, private sector insurers, along with AIC, have
been running pilots in various parts of the country. The weather parameters that
have so far been incorporated in weather index insurance include rainfall (deficit,

73
excess, dry-spell, wet-spell), temperature (minimum, maximum, mean), humidity,
wind speed etc.
Pilot Weather Risk based Crop Insurance
4.18 The first pilot on weather index insurance was carried out in 2003 by ICICI
Lombard which was followed by pilots on weather risk index-based insurance by
Agriculture Insurance Company of India (AIC) and IFFCO-Tokio, both during
2004. Building on the existing weather risk insurance products, the Government
asked AIC in 2007 to design the Weather risk-Based Crop Insurance Scheme
(WBCIS) as a pilot.
4.19 Through WBCIS, location specific (Tehsil / Block) products were introduced
by AIC during Kharif 2007 season along with a composite weather risk index-
based insurance that included perils like rise in temperature, un-seasonal rainfall,
humidity, frost risks, etc. relevant for the Rabi season. In its quest for more
scientifically robust weather insurance products, AIC availed technical assistance
from Indian Agriculture Research Institute (IARI) to enable product structuring
using Crop Growth Simulation Modeling platform. AIC has been using various
constructs based on weather parameters, some of which are enlisted in the
following table.
Table 4.6: Constructs Used in Weather Index based Insurance
S. No. Weather Parameter Components 1
Rainfall Deficit rainfall, Consecutive Dry Days (CDD),
Number of Rainy Days, Excess rainfall
2 Temperature Max. Temperature (heat), Min. Temperature
(frost), Mean Temperature, Hourly Chilling units 3 Relative Humidity High Humidity 4 Wind Speed High Wind Speed

74
5 Disease proxy Combination of Weather parameters like rainfall,
temperature & humidity
4.20 From the Rabi 2007 season, insurers from private sector were also allowed
by the Government to participate in WBCIS; initially for non-loanee farmers and
subsequently for both loanee and non-loanee farmers. The insurers from private
sector along with AIC developed parametric weather risk based crop insurance for
a variety of crops ranging from seasonal to perennial crops and low value to high
value crops. Crops presently covered under Weather Index based Insurance are
listed in the table below.
Table 4.7: Crops covered by AIC under Weather Index based Insurance
CEREALS &
ANNUAL COMM / HORT CROPS S.NO CROP SEASON S.N CROP SEASON
CEREALS & MILLETS COMMERCIAL CROPS 1 Paddy Kharif & Rabi 1 Potato Rabi 2 Sorghum Kharif 2 Coriander Rabi 3 Pearl millet Kharif 3 Cumin Rabi 4 Maize (Corn) Kharif 4 Fenugreek Rabi 5 Finger millet Kharif 5 Isabgol Rabi 6 Wheat Rabi 6 Onion Kharif 7 Barley Rabi 7 Garlic Rabi
PULSES 8 Chilly Kharif-Rabi 1 Blackgram Kharif 9 Cotton Kharif 2 Greengram Kharif 10 Tomato Kharif & Rabi 3 Pigeon Pea Kharif 11 Banana Annual 4 Chick Pea Rabi PERENNIAL HORTICULTURAL CROPS 5 Peas 1 Grapes Rabi 6 Lentil Kharif 2 Mango Rabi
OILSEEDS 3 Cashew nut Rabi 1 Groundnut Kharif 4 Pepper Kharif 2 Soyabean Kharif 5 Apple Rabi 3 Linseed Rabi 6 Coffee Annual 4 Rape Seed & Rabi 7 Orange Annual 5 Sunflower Kharif 8 Kinnow Rabi 6 Sesamum Kharif 9 Pomegranate Annual
4.21 During 2010-11, as many as 15 States have implemented the pilot WBCIS
in over 100 districts covering more than 800 blocks/tehsils. Most importantly,

75
Rajasthan became the first state of India to implement pilot WBCIS across the
entire state. Bihar did not lag behind by much as it took WBCIS to all but three
districts of the state. During 2010-11, AIC piloted weather index based crop
insurance for over 35 different crops. As per estimates it insured nearly 8 million
farmers constituting acreage of more than 12 million hectares for a sum insured
of approximately Rs. 9635 crore at a premium of ` 883 crore. The cumulative
number of Indian farmers covered under Weather Index based Insurance during
2010-11 is estimated to have crossed 9.27 million. These farmers have
contributed a coverage of over 13.23 million hectares and risk exposure of `14300
crore which were insured at a premium of ` 1290 crore.
4.22 Going by the spectacular growth witnessed in the past four years, there
appears to be greater awareness and acceptance of Weather Index based Crop
Insurance by majority of states and other stakeholders, though a segment of
farmers and a few states still see advantage in NAIS.
Weather Risk Insurance: Challenges
4.23 The two biggest weaknesses and challenges of the present weather risk
index-based insurance product are (i) designing a proxy weather risk index with
predictive capability to realistically measure crop losses and (ii) basis risk. Basis
risk results if the actual experience of weather risk (rainfall) in the neighborhood
significantly differs from the data recorded at the weather station. The two aspects
led to compounding of the problem: both may not trigger a payout despite the
occurrence of damages at an individual farm, or these may trigger a payout when
loss did not occur. The combined effect of the two challenges represents a
significant barrier to the scale up of the product. Nevertheless, weather risk index-
based insurance performs well on data accuracy, transparency and quick claims
settlement, which are very attractive to both farmers and the reinsurance market.
Weather Index Insurance: Moderate and Catastrophic Losses
76
4.24 State of Knowledge Report1 brought out a few important observations on
using weather index for small, moderate and large losses, which are briefly
discussed in this section.
4.25 When rainfall is around the optimal level for a crop, many other important
factors affect crop yields (e.g., soil quality, fertilizer use, pesticide use, crop
husbandry practices, etc.). Around this level, the correlation between rainfall and
crop yields is likely to be not very strong. When rainfall is extremely low, however,
the relationship between rainfall and yields is expressed more strongly, because at
low levels of rainfall, other variables such as use of fertilizers, pesticides have very
little effect on yields.
4.26 Due to high transaction costs, insurance is perceived to be a rather
expensive financial instrument, However with increasing awareness, penetration
and efficiency, the per unit cost is going down rapidly. The schemes like WBCIS
are in fact more desirable as they have the ability to mitigate even small to
moderate losses and also provide extended coverages like for pre-sowing
periods and quality of output which are difficult to cover under other schemes.
4.27 On the other hand, catastrophic events affect not just yields, but assets and
long term income. A ‘generic’ insurance product (in place of a sophisticated
product), therefore, can do well for mitigating such losses. Moreover the data
requirements for catastrophic cover are relatively lower and hence the basis risk is
lower. Insurance, therefore, can create much higher ‘recognition’ for index
insurance. Cost of administration is lower for catastrophic covers. Premium for
catastrophic cover is generally affordable, which leads to extending insurance for
almost all important assets, which in-turn can lead to increased demand for
insurance and ultimately high level of insurance penetration.
1 ‘State of Knowledge Report – Data Requirements for the Design of Weather Index Insurance’ by Global
AgRisk, Inc. (June 2010)

77
Government Evaluation of Weather Index Insurance
4.28 Government of India conducted an evaluation study on WBCIS through
Agriculture Finance Corporation (AFC) during 2010. The farmer beneficiaries of
WBCIS were asked to share their satisfaction w.r.t. 16 different aspects of weather
index insurance. An overview of the key findings is presented with the help of the
radar chart on the next page:
4.29 In the following radar chart, the aspects of weather index insurance with the
maximum ‘not satisfied’ respondents are indicated. Based on the sample study,
as many as 80 percent of the respondents highlighted basis risk (location of
weather station), and 57 percent were not satisfied with the grievance redressal
mechanism and an almost equal proportion with the convenience in enrollment.
4.30 Considering the minimum ‘not satisfied’ respondents, only 17 percent and
19 percent were not satisfied with transparency and reliability of weather data,
while about 25 percent were not satisfied with weather index as a substitute for
yield index insurance.
4.31 From the chart below, it can be seen that weather risk index-based
insurance performs well on data accuracy, transparency and quick claims
settlement, which are very attractive to both farmers and the reinsurance market.
Chart 4.1: Percentage of Farmer Respondents ‘Not Satisfied’ with 16 Aspects of WBCIS

78
Source: Report on Evaluation of WBCIS, Government of India, October 2010
4.32 Insurers have to find a way to offer a technically sound product that is, at
the same time, simple and easily accessible to farmers. Farmers must be able to
understand the products sufficiently in order to calculate claims and expect
realistic payouts. The lack of benchmarking for Weather Index-based Insurance
products erodes the value of financial support provided by the state under WBCIS.
4.33 By their very nature, weather insurance products are difficult to
comprehend for a typical Indian farmer who is equipped with limited capabilities
and experience. The multitude of weather insurance products offered by various
weather insurance providers necessitates the need for benchmarking the various
products to enable the farmer to make an informed choice. Through
benchmarking, it may be ascertained whether the products offered by different
insurance companies carry at least comparable benefits (Protection vis-a-vis
Premium). The complex weather insurance products may be disintegrated into the
constituent covers for different perils.
Weather Insurance: Requirements and Way Forward

79
4.34 The WBCIS program is perceived by States as a good alternative to NAIS,
but there seems to be a few bottlenecks in universalizing it. Some of the key
requirements for scaling up the scope and benefits of Weather Index based Crop
Insurance in India are as following:
1. Scope of WBCIS is limited to parametric weather exigencies like rainfall,
temperature, humidity etc. Quite often, crops also suffer due to hailstorm,
flooding, pests & diseases, etc. which to a large extent are difficult to cover
under the scheme. However, over the years, with increasing understanding
between weather parameters and effects on crops, indices have been designed
which do provide cover against pests and diseases by including combinations of
various weather parameters, resulting in the inclusion of weather conditions
conducive for infestation as well.
2. Product design under WBCIS is challenging as crop yield and weather
relationship is not only complex, but also influenced by the date of sowing, soil
type, crop variety, etc. The experience reveals that there were instances of crop
losses due to weather deviations, which could not be entirely captured by the
weather index. It requires focused research by ICAR and State Agriculture
Universities (SAUs) to fine-tune the weather-yield relationship; However with
evolution of the scheme and perils, insurance companies are trying to offer
products with dynamic risk commencement dates. It must be noted that such
dynamic products may not be suited for ‘mass subscription’ as is the case with
WBCIS.
3. The growth of WBCIS demands that every village has a weather station so that
basis risk in Weather Index based Insurance is minimized. The acceptable
radius for insuring rainfall constructs is about 5 km and for other constructs is
10 km. For achieving these levels, nearly 50,000 weather stations are required
as against about 5000 stations which are presently available including both
public and private stations. Calibration of sensors and data at weather station
is another challenge, as presently weather data providers are using stations of

80
different make and quality. This would require third party accreditation and
calibration services to vouch for reliability and accuracy of the data.
Maintaining weather stations properly and making them tamper-proof is
another challenge even if the aforementioned requirement of 50,000 stations is
met through public-private partnerships or other arrangements. It may be
worthwhile to explore technologies like Terrestrial Observation & Prediction
Systems (TOPS), which uses many available meteorological satellites and the
ground data to generate village level weather surfaces. Nevertheless, with
consistent increase in coverage under WBCIS, the penetration of weather
stations is also increasing. The weather stations are now available at about a
radius of 15 Km for locations where they were available at more than 30 Km a
few years ago. Also, in order to cater to the above concerns, Ministry of
Agriculture (Government of India) has already set up a committee under guidance
of the Indian Meteorological Department (IMD) to look into the standardization of
the weather stations that are installed by various vendors across the country.
4. Insurance products are generally finalized after discussions with States, but
still lack proper bench-marking standards among the insurers. In order to pass
on the best value to the farmers, it’s imperative that proper bench-marking
standards are created.
4.35 States under NAIS are used to financing the claims at the end of the season
if the claims exceed the premiums collected from farmers. However, under WBCIS
the entire support of the Government comes as an up-front subsidy towards
premiums. Many times, states are not able to release premium subsidy to
insurance companies timely as required by the insurance laws.
Improvements in Crop Insurance
4.36 Index based products are the staple form of crop insurance products. The
two major products are yield index based NAIS & MNAIS and weather index based
WBCIS. Though these products are doing well, the need for product innovation
and combinations to meet the risk management is being increasingly felt. At the
81
same time, there is a need to streamline the delivery and distribution of crop
insurance products. Some of the improvements in both the design and
implementation of crop insurance products are discussed below.
Weather ‘Index Plus’ Crop Insurance Products
4.37 Index insurance products (yield or weather) by nature are ‘area’ based and,
to a large extent, may not be effective in covering localized perils like hailstorm,
cloud burst etc. Moreover, in weather index, the scope of the cover is limited to
parametric weather exigencies like rainfall, temperature, humidity etc. and, at
present, has no scope for covering hailstorm. Cloudburst - a high intensity rain
over a short span and a localized event is unlikely to be captured by a weather
station.
4.38 Given the inadequacies of index based insurance products in covering
localized weather exigencies like hailstorm and cloudburst, there has been a
demand from growers of horticulture crops that insurance coverage be extended to
guard against these important perils.
4.39 The existing weather index insurance product available for perennial / tree
crops shall continue. An additional insurance cover protecting the growers against
hailstorm and cloudburst is provided to every grower who availed weather index
product, as ‘add-on’ cover. The grower in effect gets insurance cover called ‘Index
Plus’, which is a combination of ‘weather index’ and ‘traditional insurance’. Under
‘Index Plus’ the losses arising out of parametric weather adverse deviations would
be paid strictly as per the present WBCIS, while the losses due to hailstorm and
cloudburst would be assessed at individual farm / orchard level by the loss
assessors. The insurance companies providing ‘Index Plus’ insurance have to
strengthen their field staff, so as to assess farm level losses from time-to-time, if
and when they occur. Additionally, insurance companies can explore if technology
like hail sensors and satellite imagery based hail loss estimation can be employed
to minimize dependence on humans for assessing crop losses.

82
Double Trigger Insurance Products
4.40 Area Yield Insurance (the earlier Comprehensive Crop Insurance Scheme
and the present National Agricultural Insurance Scheme) have had its share of
shortcomings, despite serving a broader objective. Some of these shortcomings
like delay in the settlement of claims, large size of insurance unit (basis risk), non-
availability of historic yield data for some crops, requirement of huge
infrastructure and man-power for conduct of crop cutting experiments, etc. have
already been highlighted during the reviews undertaken by the Government.
4.41 Weather Insurance products that are being tried from Kharif 2007 under a
pilot project supported by the Government have proven to be reasonably
successful. However, technical limitations like restricted scope of weather index
(losses arising out of events like hailstorm, thunderstorm, flooding, besides
biological incidences like pests and diseases are presently not covered under
weather index), imperfect correlation between weather index and the production
process for some of the crops, lack of historical weather data at sub-district or
lower level, requirement of huge density of weather station network etc. have
tended to reduce the effectiveness of weather insurance.
4.42 Besides the relative shortcomings of yield index and weather index based
insurance products as mentioned above, there are a few issues like adverse
selection and moral hazard which can significantly alter the viability of the crop
insurance programme. In an actuarial regime (supported by up-front subsidy in
premium by the Government) with the insurance unit as Gram Panchayat, it
would not be perverse to assume a certain degree of pressure on the crop cutting
machinery to report the yields in a manner that benefits the local farming
community. Until we move onto a technology platform like satellite imagery based
yield estimation (which may take 5-10 years despite huge break-through in the
technology), the insurer and the reinsurer would be wary of possible interferences
in yield estimation at the grass-root level. No amount of ‘audit’ procedures
including random witnessing of crop cutting experiments, near real-time reporting

83
of yield data of individual crop cutting experiments, etc. can prevent the
systematic interference at the grass root level.
4.43 Keeping in mind the above, i.e., relative strengths and shortcomings of yield
index and weather index insurance products, it would be worthwhile to pilot an
insurance product, the claim payout of which is based on both the yield index and
the weather index, instead of any one exclusive index . The proposed product is
based on ‘Double Trigger’, deciding the final claim partly based on the weather
index and partly on yield index. This way it would be possible on one hand to
enhance the strong points of these indices, and on the other to minimize the
adverse impact of weaknesses of the indices.
4.44 The model is based on bifurcating/distributing the total sum insured for a
crop insured by the farmer under two different categories, keeping in mind relative
influence of weather on the yield. For a crop like wheat where the major issue
contributing to yield loss is ‘rise in heat’, weather index could be given higher
weightage. As an illustration it could be 60% distribution of sum insured under
weather and the balance 40% under yield. Similarly for a crop like groundnut,
where rainfall and other factors like pests and diseases affect the yield equally, the
distribution of sum insured could be- weather 50% and yield 50%. In other words
of the total sum insured by a farmer under the groundnut crop is bifurcated on
50-50 basis under weather and yield index. Assuming a farmer growing
groundnut crop on 2.5 hectares is insured for a sum of ` 50,000, it’s distributed
as ` 25,000 each under weather index and yield index. For settlement of claims,
the payout on a sum insured of ` 25,000 under weather index would be purely
dealt as per the applicable weather insurance product, while the balance ` 25,000
under yield index is strictly as per yield data. For illustration sake, let’s assume
that the claim payout rate under weather insurance is 25% and that under yield is
40%. The total claim received by the farmer in this case is ` 6,250 (25% of
Rs.25,000) under weather index and ` 10,000 (40% of ` 25,000) under yield index.
In all, the farmer would receive ` 16,250 of which ` 6,250 (weather index) is
expected to be received early, possibly within a month of crop harvest, and `

84
10,000 (yield index) by about 3-4 months from the crop harvest. In this way the
‘Double Trigger’ product can actually obviate the need for ‘on-account’ claim
payment envisaged under the proposed mNAIS.
4.45 In a nut shell, the ‘Double Trigger’ product can be a unique solution in
improving the crop insurance programmes making it affective and farmer friendly.
An illustration with more details worked out is appended.
Savings Linked Weather Insurance Product
4.46 A few studies conducted by the insurance companies and independent
researchers were unanimous in confirming that cultivators are less enthusiastic to
avail weather insurance if there is no pay-out during the previous crop season. In
other words, every ‘claim-free season’ throws-up a challenge to the insurance
company. The problem gets compounded if the cultivator doesn’t receive a pay-out
in the initial two or three years, and more so when he suffered a loss which could
not get reflected because of basis risk either in product-design or weather station.
4.47 For a seasonal insurance like weather insurance, a cultivator gets the
payout if the season is adverse; but he would have a sense of loss of the premium
amount if it is a normal season. One way to address the problem would be to sell
a multi-season / year weather insurance, assuming that the cultivator would at
least get one payout in a multi-year contract of five years, which should help him
to understand the value of insurance. However, weather insurance is still evolving
and neither the cultivators nor the insurance company is comfortable to buy / sell
multi-year contracts. In order to circumvent the challenge, a majority of weather
insurance products are designed as ‘working insurance covers’ with regular (every
2nd or 3rd year) small payouts which are neither here nor there.
4.48 Agriculture Insurance Company of India (AIC) has come up with a pilot for
testing the concept of savings-linked crop insurance. As part of this pilot, AIC
shall work with a grass-root level entity, possibly an NGO which has a strong

85
presence and good reputation in the area. A customized weather insurance
product shall be developed by AIC keeping in mind the specific requirements of
the cultivators in that area and if necessary, a third party automatic weather
station would also to be set-up to minimize the basis risk.
4.49 In an attempt to popularize the insurance concept and create understanding
of the value of insurance, cultivators shall be encouraged to buy the insurance
year after the year (irrespective of the pay-outs). In order to encourage the
cultivators to regularly buy weather insurance, a small amount of premium paid
by the cultivator would be transferred to the ‘saving basket’. As an illustration, if
a cultivator has two acres of paddy on which he has paid a premium of ` 1200
covering a risk of ` 12,000, an amount of ` 200 from the premium amount of `
1200 would be transferred to the saving basket. This money shall be invested on
behalf of the cultivator, to earn a reasonable investment return. Cultivators can
access the saving component only if they participate in the insurance programme
continuously for 5 years. As a matter of fact, a cultivator could take the money
from the saving basket at the end of the fifth year. Alternatively, he could be
allowed to access the money at the end of the third year up to 50% of the savings
component, if there has been a ‘bad year’.
Catastrophic Insurance: Universal Coverage of Farmers
4.50 Despite the existence of country-wide crop insurance programme for over 25
years, only about 1/5th of the farmers or cropped area could be insured. Only a
minority of non-loanee (institutional non-borrowers) who constitute about 60
percent of the total farmers participate in crop insurance despite high level of
premium or claim subsidies. Moreover, there are many crops particularly
vegetables & fruits etc. for which insurance products are not available. At present,
though there are provisions to extend relief to such farmers in case of catastrophic
weather events or crop disasters, but the quantum of such relief is largely ad-hoc,
limited and subject to availability of funds. In order to protect the non-borrowing
farmers from extreme financial distress and to provide basic economic security,
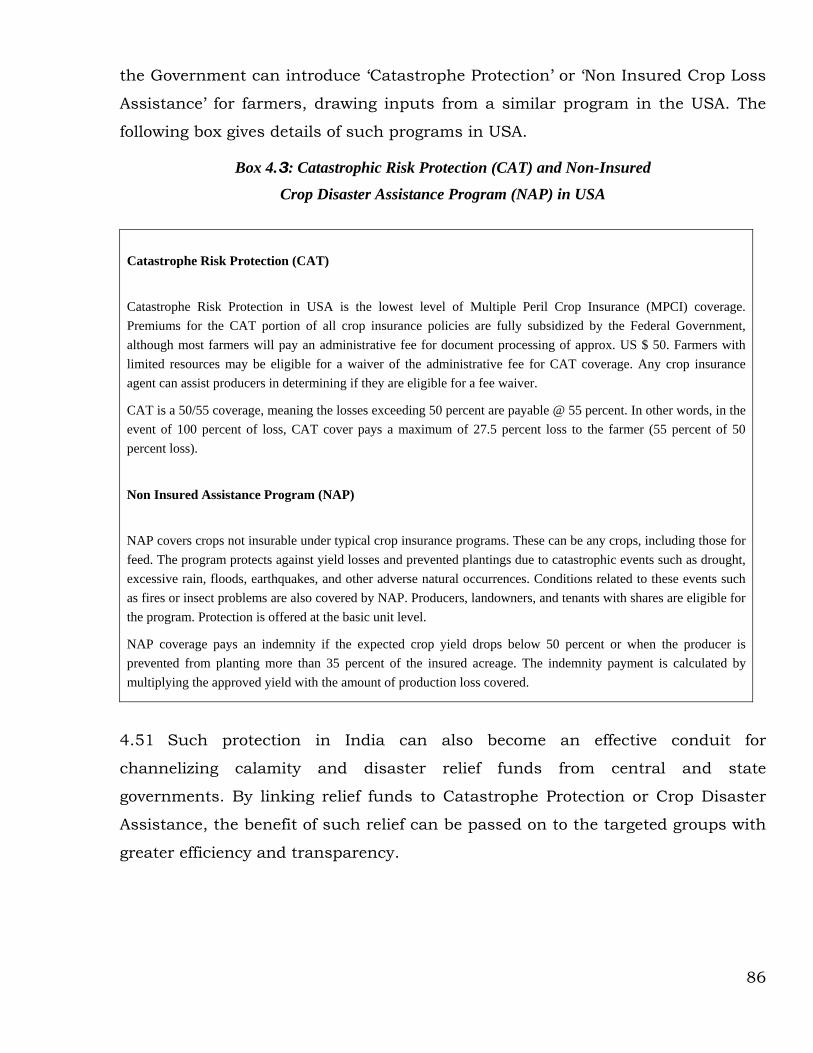
86
the Government can introduce ‘Catastrophe Protection’ or ‘Non Insured Crop Loss
Assistance’ for farmers, drawing inputs from a similar program in the USA. The
following box gives details of such programs in USA.
Box 4.3: Catastrophic Risk Protection (CAT) and Non-Insured
Crop Disaster Assistance Program (NAP) in USA
Catastrophe Risk Protection (CAT)
Catastrophe Risk Protection in USA is the lowest level of Multiple Peril Crop Insurance (MPCI) coverage. Premiums for the CAT portion of all crop insurance policies are fully subsidized by the Federal Government, although most farmers will pay an administrative fee for document processing of approx. US $ 50. Farmers with limited resources may be eligible for a waiver of the administrative fee for CAT coverage. Any crop insurance agent can assist producers in determining if they are eligible for a fee waiver.
CAT is a 50/55 coverage, meaning the losses exceeding 50 percent are payable @ 55 percent. In other words, in the event of 100 percent of loss, CAT cover pays a maximum of 27.5 percent loss to the farmer (55 percent of 50 percent loss).
Non Insured Assistance Program (NAP)
NAP covers crops not insurable under typical crop insurance programs. These can be any crops, including those for feed. The program protects against yield losses and prevented plantings due to catastrophic events such as drought, excessive rain, floods, earthquakes, and other adverse natural occurrences. Conditions related to these events such as fires or insect problems are also covered by NAP. Producers, landowners, and tenants with shares are eligible for the program. Protection is offered at the basic unit level.
NAP coverage pays an indemnity if the expected crop yield drops below 50 percent or when the producer is prevented from planting more than 35 percent of the insured acreage. The indemnity payment is calculated by multiplying the approved yield with the amount of production loss covered.
4.51 Such protection in India can also become an effective conduit for
channelizing calamity and disaster relief funds from central and state
governments. By linking relief funds to Catastrophe Protection or Crop Disaster
Assistance, the benefit of such relief can be passed on to the targeted groups with
greater efficiency and transparency.

87
Mutual Crop Insurance by People’s Mutuals of Dhan Foundation
4.52 Mutual Crop Income Insurance (MCII) was piloted in Nattarampalli, in
Vellore district of Tamil Nadu through support of DHAN Foundation. After three
years of experience with rainfall insurance, it was decided to abandon this project
because of the inability to design a product that reflects the relationship between
crop yields and rainfall accurately. The search for an alternative brought them to
Eureko Re, a Dutch reinsurance company offering its support to crop insurance.
4.53 Under MCII, farmers are indemnified based on actual losses, with loss
assessment and price monitoring done by older and wiser farmers. As
participating farmers are already organized into various collectives, the necessary
social capital for piloting Mutual Crop Insurance (MCI) is already in existence. The
covariant nature of rainfed agriculture, which makes it difficult to insure, was
addressed through pooling of risks of diverse collectives, each with different risk
profile.
4.54 To design the MCII product, the data on past experience of rain-fed
groundnut cultivation in Nattarampalli was collected from a group of farmers. This
included frequency, levels and causes of loss, variations across the location and
cost of cultivation. The preliminary product was discussed in detail with the
Mutual Insurance Committee (MIC) which customized it in terms of sum insured
and premium per acre. The design of the product was such that cost of cultivation
was considered as the benchmark for compensation and not the expected income,
to make the product affordable.
4.55 Moral hazard risk was addressed by introducing retention, requiring
farmers to pay a pre-determined percentage of their loss themselves. The insured
farmers own the mutual pool and thus critically assess the farmers accepted as
members of the insurance pool. This environment of social control and familiarity
of colleague farmers with production circumstances have resulted in avoiding
farms that repeatedly face loss, thereby addressing adverse selection.
88
Collaboration with AIC
4.56 While it was purely a mutual insurance programme during the period of
2007 to 2009, a giant leap forward came out during 2010 by way of collaboration
with AIC. The products are designed in tune with the needs of the farmers and the
payout would be based on the rainfall at the village level rain gauges established
by DHAN Foundation.
4.57 At the community level, the programme is not in any way different from that
of the earlier years. Only difference being that the risk is transferred / ceded to
AIC under insurance contract. The product designed jointly with AIC is
comparatively more affordable with wider range of risk coverage and benefits. The
claims are duly received from AIC and paid to the farmers immediately after the
risk period is completed. Since the farmers know about the triggers and eligible
benefits, the time delay in receiving claims is minimal for eligible farmers. The
daily rainfall data is shared with the farmers through SMS and black boards at
the federation offices and common places.
4.58 During Rabi 2010 crop season, when the programme was implemented in
12 locations, claims were triggered only in 5 locations. Even within these five
locations, only 15 rain gauges out of 50 rain gauges crossed the eligibility. This
underlines the existence of microclimates within small geographies. During the
past two years, about 2064 hectares of dry land crops cultivated by 6284 farmers
were covered under crop insurance by this approach. It is proposed to cover over
10000 acres of crops cultivated by about 20000 farmers during Rabi 2011.
Important Interventions for Sustaining Improvements in Crop Insurance
Agriculture Risk Protection Act
4.59 Agriculture insurance is specialty insurance, and different from traditional
general insurance in many respects. As an illustration, agriculture insurance,

89
particularly crop insurance programme is conceived as a ‘multiple-agency’
approach in which Rural Financial Institutions (RFIs), State government, Central
government etc. are actively involved, with the government providing significant
financial support. Moreover the programme is compulsory for loanee farmers. The
programme, thus, is seen more as a social instrument of the government rather
than a commercial instrument. A programme of this nature and magnitude is
unlikely to be effectively administered unless backed by a statute. It may be
worthwhile to note that the countries like United States of America, Canada,
Spain, Japan, Philippines etc. where crop insurance is being used as an integral
part of ‘agriculture risk management’, a separate statute is in force, thus
facilitating smooth implementation of the programme.
4.60 A number of countries also have clearly articulated their policy commitment
through specific legislations for agricultural protection. It may be interesting to
note that many countries in European Union have specific guidelines delineating
the role of agriculture insurance vis-à-vis ad-hoc and disaster relief. For example,
in Austria, Spain, Portugal, Greece and Sweden no payments are made from a
public fund if there is insurance available. Similarly the status of agricultural risk
protection in a few countries of European Union is provided in the box below:
Box 4.4: Agriculture Risk Protection in EU Countries
France: Payments include those damages for which there is no insurance at all or that
insurance has not reached yet a significant diffusion level. Italy: Only subsidized risks are excluded from public ad-hoc payments after natural
disasters. Romania: Only payments from the public budget are given to farmers in the case of natural
disasters if they have insured risks called “standard risks” like hail.
Source: Agriculture Insurance Schemes by European Union (Modified Report of February 2008)
Financial Literacy
4.61 Despite agriculture insurance existing in the country for over 25 years, its
awareness levels regarding it are poor not only among the farmers, but also among

90
policy makers and key government functionaries. Only a sustained capacity
building for stakeholders and financial literacy programme aimed at the farming
community could help in understanding the merits of agriculture insurance,
which in-turn shall be helpful in increasing the spread of agriculture insurance.
Incentives for Sustainable Agriculture Practices
4.62 While subsidies are must in agriculture insurance, it would be equally
important to build risk management stipulations and incentives into the
programme for sustainable agricultural practices, like integrated pest
management, low Green House Gases (GHG) crops, etc.
Service Tax Exemption
4.63 The Government exempted service tax on the premium for index based crop
insurance schemes financially supported by Ministry of Agriculture (GoI). As a
result, NAIS, pilot WBCIS and pilot MNAIS are exempted from service tax
provision. There are crop insurance schemes which are either financially
supported by other ministries (like Ministry of Commerce in cased of Coffee etc.) or
traditional crop insurance schemes supported by Ministry of Agriculture (through
Coconut Development Board) and also weather index insurance and other
schemes where there is no premium subsidy from the Government, and these
deserve service tax exemption as much as the schemes already exempted. In view
of this, there is a strong need to exempt all agriculture insurance schemes from
service tax provision.
NEW TECHNOLOGIES IN CROP INSURANCE
4.64 Currently, there is a critical gap between our need to efficiently manage our
limited resources and the proliferation of information collected by a variety of
sensors, processed through sophisticated computer models and algorithms. There
are a number of state, federal agencies and institutions already in place to collect,

91
collate, curate, and analyze information about economically important aspects of
ecosystems and the environment such as crop yields, pollution, groundwater, and
weather. What we lack is a broad environmental monitoring capacity that can
deliver on-demand information at regional to national scales. Secondly, we also
lack the infrastructure to create information as needed by the end-user. For
example, we provide information about weather, including forecasts to farmers,
but they are rarely tailored to what the farmers need at a given time and place in a
format that they can understand and act upon.
4.65 There is a growing recognition of this problem around the world. Terrestrial
Observation and Prediction System (TOPS) is an attempt at organizing
disparate streams of information into a cohesive framework to serve a variety of
societal needs. This need for information synthesis for producing actionable
information is greatest in rural India where nearly 70% of the population lives and
works.
Ecological Forecasting: Taking Weather and Climate Forecasts Further 4.66 Ecological forecasts are akin to weather and climate forecasts, but deal with
biological systems instead of the physical climate system. They seek to predict the
effect of changes in the physical, chemical and biological environment on
biological organisms, communities, and ecosystems. Ecological forecasting
provides an important capability for optimizing resource use and supporting
decision making for a wide range of applications, from forecasting irrigation
demand for agricultural crops, to identification of precursors of outbreaks of crop
pests or epidemics of vector-borne diseases, to monitoring habitat conditions for
threatened and endangered species, to tracking ecosystem conditions and
forecasting potential climate change impacts.
New Frontiers in Technology-enabled Ecological Forecasting
4.67 Terrestrial Observation and Prediction System (TOPS) is a software
modeling system designed to produce ecological forecasts. TOPS brings together
advances in information technology, weather/climate forecasting, ecosystem

92
modeling, and satellite remote sensing to enhance management decisions related
to floods, droughts, crop condition, human health, forest fires, and forest
production. TOPS provides a suite of ecosystem ‘nowcasts’ (measures of current
conditions) and forecasts. These data products include measures of vegetation
condition and productivity, snow dynamics, soil moisture, and meteorological
conditions and forecasts.
4.68 A key feature of TOPS is the ability to integrate surface, satellite, and
climate data using ecosystem simulation models. TOPS component models can be
used together or independently to support modeling at multiple spatial and
temporal scales ranging from hourly or daily irrigation forecasts for individual
agricultural fields to countrywide monthly estimates of ecosystem productivity.
4.69 Another key feature of TOPS is an automated system for ingesting climate
observations from local, regional, and global networks of meteorological stations in
real-time to produce spatially continuous gridded meteorological fields. This
capability allows TOPS to provide continuous estimates of ecosystem conditions
for any location in the country, even regions that are remote or sparsely
instrumented. In addition to the gridded meteorological surfaces, multiple meso-
scale weather models have been integrated into TOPS to provide short-term
forecasts. TOPS also incorporates scenarios from global climate models, such as
those used in the IPCC assessments, to produce long-term simulations of
ecosystem conditions and to assess potential climate change impacts on patterns
in snow melt, soil moisture, stream-flow, phenological cycles, and vegetation
growth.
Role of Social Networks in TOPS
4.70 With advances in mobile computing, mobile phones and ready access to the
web, it is now possible to facilitate two-way communication that allows systems
such as TOPS to be informed of near-real time conditions and also help
disseminate the knowledge. Preferred social networks include progressive farmers,
93
retired and current scientists, and others interested in contributing or help in
transmitting the forecasts.
Scalable Infrastructure Reduces Costs of Implementation
4.71 TOPS integrates the utility of information gathered by existing networks
such as orbiting satellites and weather stations. By integrating the time
continuous observations of weather stations with spatially explicit data from
satellites, TOPS provides the ability to map, monitor and assess ecosystem
conditions at a variety of space and time scales. Assuming that various observing
networks (satellite, weather, etc.) are in place, maintained by state or federal
agencies and that the data are available, it costs about $900,000 a year per state
to implement TOPS and produce various products in a 1KM resolution. The
products include daily gridded weather data, weekly satellite measures of surface
conditions, modeled fluxes of evapotranspiration losses, gross and net primary
production, crop condition and stress, flood risk maps, forest fire risk maps, along
with forecasts of these variables at weekly and monthly time-scales up to 6
months in advance. Studies in a number of western countries particularly in a
number of states in US particularly California, Texas, North Carolina found the
return on investment to be 1:28.
Benefits of TOPS to Society
4.72 Information from TOPS can benefit the society in a number of ways. Some
examples are:
1. Risk Mitigation through Crop Insurance: Insurance against catastrophic
crop failures is becoming an important tool for managing climate variability
and change. However in several regions of the world, the process of insurance
is complicated by the lack of adequate quality data. For example, there may be
few weather stations with sufficient data to assess the basis risk. This situation
is common in many parts of India with highly vulnerable communities. By
blending data from a few weather stations with satellite data available for over
30 years, TOPS creates high-quality information at village level. Similarly

94
the integrated information from TOPS allows one to verify fraudulent claims, in
a way acting as third party verification.
2. Climate Variability and Change: Climate change has the potential to alter
patterns in snow dynamics, hydrology, vegetation phenology and productivity,
and habitat for insects that transmit disease. Using TOPS capabilities for long-
term simulations of vulnerabilities, key insights about the potential
consequences of climate change in a variety of sectors can be generated and
disseminated.
3. Food Security: TOPS aims to support the sustainable management of
agriculture by disseminating weather forecasts, early warnings of storms and
other extreme events, water pollution, long-term forecasts of likely climate
change impacts, and information on water supplies. These and other data are
being integrated so that they can be used in models for simulating and
predicting agricultural trends.
Network of Virtual Weather Stations Network: Boon for Weather Insurance 4.73 At present, weather index insurance is serviced using on an average, one
weather station per tehsil / block. Ideally we should have weather stations in each
village to minimize basis risk. However this needs huge investment in weather
station networks. Still the stations are not total tamper-proof, as also
maintenance cost is high and being electronic machines, the life time of a weather
station would 5 or 6 years. Keeping in mind these constraints, we should use the
concept of ‘virtual weather station network’ based on ‘Terrestrial Observation
and Prediction Systems (TOPS) platform, which can actually produce the daily
weather data at one km grid. Moreover, the system can generate past 10 years
data at this level. The expected cost of generating village level daily weather data
for the country for the entire XII Plan period could be only about ` 200 crore. It’s
worthwhile to conduct experiments by making use of technology, in order to
prepare a comprehensive weather data base for the entire XII Plan period, along
with past 10 years’ data. The data thus generated can be placed in public domain

95
for the larger public good. This would hugely help in scaling up the weather
insurance products.
The Terrestrial Observation and Prediction System (TOPS) integrates a
wide variety of data sources at various spatial and temporal scales to
produce spatially and temporally consistent input data fields, upon
which ecosystem models operate to produce ecological nowcasts and
forecasts.
Crop Insurance Subsidy Mechanism
4.74 The insurance premium calculated by the insurance companies for bearing
the risk is more than what is affordable to the farmer. It makes sense for the
government to offer financial assistance in the form of the subsidies to the farmers
to educate them about the importance of the insurance in the long run. Insurance
can help the farmers to mitigate the drastic impacts of risks and at the same time,
reduce the volatility of losses which could have jeopardized their livelihoods in the
absence of insurance.

96
4.75 It is very difficult to model the transfer of assistance from the government to
farmers keeping every stakeholder satisfied and meeting their demands. The
approach to understand the determinants which can have an impact on subsidy
transfers can lead us to draw some conclusions. It is sure to lead to policy
measures having far reaching implications.
4.76 Following are some of the determinants that have an impact on the subsidy
models
a) Mode of Transfer
b) Nature of the Recipients
c) Calculation Methodology of the Subsidy
d) Nature of Beneficiary Regions
e) Type of Crops to be Insured
f) Nature of the Risk
Mode of Transfer
4.77 The subsidy can be transferred from the government to the farmers either
directly or indirectly. Direct transfer can be made in the form of the re-
imbursement on claims made by farmers after getting enrolled in the insurance
scheme. The drawback in this approach is time delay. The farmer has to pay
premium upfront for buying insurance. Some of the farmers may not have enough
funds to pay the insurance premium. They may have to take recourse to money
lenders or other financial institutions for taking the loan. Secondly, the issue is of
timely transfer of claims to the farmers. Delays in transfer of claims will deter
farmers from enrolling themselves under the insurance scheme. An alternative
would be to pass on the subsidy to the farmers through the insurance companies.
Insurance companies will be responsible for enrolling farmers under the insurance
scheme. Under this arrangement, farmers will not be paying that part of the
premium covered by the subsidy. The subsidy in turn will be transferred to the

97
insurance companies by the government, based on the data furnished by them.
There is a drawback associated with this arrangement. The penetration of
insurance companies may be low and may not be across all regions and across all
categories of farmers. There is also the possibility of reporting of wrong data or
misuse of the scheme if the control processes are weak.
Nature of the Recipients
4.78 The nature of recipients should play a role in deciding to whom the
subsidies should be directed. The beneficiaries can be decided based on the
factors such as irrigation availability, farm size. In terms of irrigation availability,
farmers can be demarcated into rain-fed farmers and irrigated farmers. Since the
resources are limited, any preferential treatment to rain-fed farmers will not evoke
great interest in the insurance scheme among the irrigated farmers. It will also
create moral hazard problem as the rain fed farmers may not build the irrigation
infrastructure or report their irrigation status correctly. In terms of size, the
farmers can be classified as small & marginal farmers, medium farmers and large
farmers. It may not be possible to cover all of them because of resource
constraints. The suggested approach will be to extend the coverage to the entire
category with more focus on the small & marginal farmers, as they do not have
enough resources to pay the insurance premium. The inclusion of large farmers
with resource constraints is based on the premise that the pool of participants in
the crop insurance scheme is constituted by farmers of varying risk levels thus
minimizing adverse selection. The rates of subsidy can be modulated to provide
differential benefits to specific segments of farmers which are disadvantaged. In
any case, the objective to make farmers understand the importance of the
insurance scheme in the long run should not take a back-seat and emphasis must
be laid to overcome difficulties in this regard.
Calculation Methodology for the Subsidy
4.79 The subsidy can be calculated based on a number of factors which include
inputs from yield loss distributions, demographic distributions and risk profiles

98
having a bearing on the livelihood of the farmers. After arriving at the numerical
figure, the next puzzling question is the distribution of the subsidies. As it is
impossible for inclusion of the farmers on a pan-India level, it is of utmost
importance that subsidy should make an impact for the majority of them, if not
all. The distribution can be flat, proportionate, and disproportionate. In case of flat
subsidy, a farmer will be getting a fixed amount as incentive for enrolling in the
insurance scheme. Small and marginal farmers shall be benefited the most as all
farmers are being paid the same amount, whereby large farmers will have to pay
the premium from their own pocket. This will create a disincentive for large
farmers and they may opt out of the insurance scheme making the insurance pool
lopsided. In case the subsidy is rolled out on a proportionate basis, each farmer
will be allocated a certain portion of the insurance premium. It will incentivize the
farmers to bring more area under insurance coverage. This will create a moral
hazard problem as farmers who have infrastructure and equipped to bear the
risks will drive out the limited resources available with the government. Also
farmers having access to irrigation facilities will benefit from the scheme even if
they don’t require it. Small & marginal farmers will have to pay a higher amount
of their production costs and earning towards premium. They may decide to
withdraw from the scheme in case of no-claims for 2-3 seasons of coverage. In
case, the subsidy is rolled out on a disproportionate basis, the farmers who are
more vulnerable and have to be prioritized for greater benefits will get a higher
level of subsidy than farmers who are less vulnerable and can afford the cost of
the premium relatively easily.
Nature of Beneficiary Regions
4.80 Regions or zones can be classified as high, medium and low risk based on a
detailed assessment of their vulnerability to agricultural risks. Based on this
classification, the government can earmark higher subsidies for regions with
higher risks and poor endowments, to mitigate disparities and to bring the
farmers of such regions on an equal footing. The farmers from the low risk region
may not welcome this move of the government and may find it discriminatory,

99
leading to non-enrolment or less enrolment from the farmers belonging to low risk
and medium risk regions.
Type of Crop Insured
4.81 The government can provide higher level of subsidy to crops of national
importance or vital from the perspective of food security. However, this may
impact the cropping pattern and also impact agricultural diversification and crop
rotation. Farmers will be interested to grow the crops for which government is
offering higher level of subsidy towards insurance premiums. This may affect soil
fertility and the balance in the cropping system adversely.
Nature of the Risk
4.82 The nature of the risk covered in the insurance scheme is one of the most
important factors that must be considered while deciding the model of the
subsidy. It is practically impossible to cover all the risk events. The risk events
can be classified on the two important attributes – frequency and impact.
4.83 The government can allocate higher subsidies to high impact and high
frequency risks. The rationale is that such risks have a devastating impact on the
livelihoods of the farmers. Besides most instruments or tools for risk management
are unable to provide a solution for such risks. Such occurrence does not follow
any definite trend and therefore, it may be difficult to predict the occurrence and
therefore the insurance companies will also price this factor leading to high
premium. The government can decide to allocate medium subsidy to high impact
and low frequency events. Another point for consideration is that if the
government does not subsidize this insurance and no high-risk event occurs
during a certain period, the farmers get a feeling that they have wasted significant
amount of the money and it will lead to dropouts as insurance companies will be
factoring such risks at a higher premium due to limited history or data on such
risks.

100
4.84 The government can allocate low subsidy to the high frequency and low
impact events to create balance in the risk pool and to generate interest of farmers
in crop insurance schemes. It can gradually facilitate these farmers to shift from
coverage of high frequency low impact risks to low frequency and high impact
risks.
Livestock Insurance
4.85 Agriculture provides only seasonal employment. Therefore majority of those
engaged in agriculture are unemployed or underemployed except during the
intensive activity periods in a crop season. Due to non-availability of irrigation
facilities most of the cultivated area is mono-crop area. Most of the farmers still
adopt traditional farming practices and so crop yields are poor even during
seasons when weather is favourable. The average farmer, who depends exclusively
on agriculture for subsistence, continues to be poverty-ridden. Hence, the
Government of India has encouraged livestock rearing as an ancillary livelihood
activity for small, marginal, landless farmers by providing technical training,
funds for capital and working expenditure, and easy access to efficient marketing
facilities.
4.86 Livestock constitutes a significant proportion of rural assets and is an
important livelihood activity across the country. Livestock-related economic
activities are an integral component of the agricultural ecosystem in India.
Moreover livestock-related activities are the only source of income for some rural
communities in India.
4.87 As a result of the pioneering efforts of the General Insurance Corporation
(GIC) and its (erstwhile) four subsidiary companies and financial institutions
which finance purchase of cattle by dairy farmers, the authorities of the Rural
Development Projects as well as all the well-organised dairy co-operatives in the
country realised the valuable support that cattle insurance can provide to their
dairy development programmes. If the milch animal financed by them dies or

101
becomes disabled due to accident or disease or natural calamities like floods or
cyclone, then all their efforts are set at naught unless the animal is insured. In
such a context, the uninsured farmer’s indebtedness increases, whereas the
insured farmer can purchase another animal promptly with the insurance claim
proceeds. It is in this sense that cattle insurance is considered an essential input
of great strategic importance for the development of the dairy industry in India.
4.88 India boasts of having 16 percent of cattle and 57 percent of the global
population of buffaloes (Basic Animal Husbandry Statistics, Deptt of Animal
Husbandry, Dairying & Fisheries, Ministry of Agriculture, GOI) with a total
livestock population of over 485 million and poultry of 490 million.
Table 4.8: Key Data from Census of Livestock & Poultry
(Numbers in million)
Item 1977 1987 1997 2003
Livestock 369.50 445.40 485.20 485.20
Cattle 180.10 199.80 198.80 185.20
Males over 3 yrs 74.90 74.70 68.70 57.60
females over 3 yrs 57.60 62.10 64.40 64.50
young stocks 47.60 63.00 65.70 63.10
Buffaloes 62.10 76.00 89.90 98.00
males over 3 yrs 8.40 7.50 7.90 6.70
females over 3 yrs 31.90 39.10 46.80 51.00
young stocks 21.80 29.40 35.20 40.30
Other Livestock 127.30 169.60 196.50 202.00
Sheep 40.90 45.70 57.50 61.50
Goats 75.60 110.20 122.70 124.40
Horses & ponies 0.90 0.80 0.80 0.80
Others 9.90 12.90 15.50 15.30
Poultry 160.90 275.30 347.60 489.00
Fowls 149.30 251.00 315.40 457.40
Ducks 10.10 23.50 30.90 30.00
Others 1.30 0.80 1.30 1.70

102
Livestock & Dairying accounts for about 25 percent of the agriculture GDP, valued
at approx. INR 2 Trillion (Report of the Working Group on Crop Husbandry,
Agricultural Inputs, Demand and Supply Projections and Agricultural Statistics
for the Eleventh Five Year Plan (2007-12)). The value of output of milk is much
higher than either of the two dominant crops of India, i.e. rice and wheat (Working
Group-RMA).
4.89 Apart from the absolute size of the livestock sector, it should be recognized
that livestock related economic activities have some unique features, in terms of
income generation, for the agricultural community. For instance, livestock is often
the source of continuous income for many, or at least one that generates income
more frequently, than regular agriculture. While conventional agricultural activity
produces seasonal incomes (typically twice a year in lump sums), it is left to the
individual farmers to manage their cash flow uncertainties over the rest of the year.
In contrast, livestock related activities may give a regular flow of income as in the
case of dairy, poultry etc.
4.90 Policy paper No. 15 of National Centre for Agricultural Economics & Policy
and Research (NCAP), ‘Assessment of Research Priorities for Livestock Sector in
India’, 2003, projects the livestock economy, which at present is 25 percent, would
eventually grow to 40 percent. The contribution of livestock to Agricultural GDP,
which was 18 percent in 1980s grew to 22 percent in 1990s and to 25 percent in
2000s. Since 1980, livestock GDP has been growing at an annual rate of about 6
percent, which is higher than the growth in overall agricultural GDP. This indicates
that livestock sector is likely to emerge as the engine of growth of the agricultural
sector in the near future.
4.91 Prior to nationalization of the General Insurance Industry in 1973, some
insurance companies made efforts to introduce cattle insurance on a very limited
scale, but due to adverse claims experience, these efforts were abandoned. The
premium rate was over 6 percent. Cattle insurance was introduced on a regular

103
countrywide basis by the General Insurance Corporation (GIC) in 1974 during
which about 30,000 animals were insured. The main objective was to effectively
protect the cattle owners against financial loss due to death / accident to the
cattle (subject to certain exclusions).
GIC introduced ‘Market Agreement’ came into force from 1.4.1976. Under
the Agreement uniform premium rates, policy terms and conditions and
procedures were adopted by the four subsidiary insurance companies of
GIC. Basic premium rate was 4 percent gross and 1 percent for permanent
total disability (PTD). A Central Cattle Committee consisting of
representatives of GIC and the four companies was set up (a) to ensure
smooth implementation of the Market Agreement and (b) to fix special rates
and terms for cattle within the purview of major co-operative dairies and
those owned by well-managed dairy farms.
4.92 In order to protect the assets (animals) financed under the government
schemes like Integrated Rural Development Programme (IRDP) / Small Farmers
Development Agency (SFDA) etc, to the weaker sections such as small and
marginal farmers, landless labourers, rural artisans, members of scheduled castes
and tribal communities who suffer from economic and social handicaps, the
government introduced special premium rates for (a) Insurance of milch cattle (b)
Insurance of cross-bred female calves/ heifers and (c) Insurance of bullocks used
for agricultural operations. Concessional premium rate under these schemes is
2.25 percent (net) p.a. The long-term premium rate for a 3 year policy is 4.80
percent. For any additional year over 3 years, the premium would be at1.60
percent p.a. For PTD cover, the premium for 3 years policy would be 1.80 percent.
The livestock insurance products in India are largely of “plain vanilla”
nature, neither varying geographically, nor varying with the insurance
service provider, these being almost exclusively the public sector general
insurance companies, at least till 2004-05.

104
4.93 The insurance policies cover basically two contingencies:
1. Death of the animal due to all causes except ageing
2. The policy can be extended to cover permanent total disability. This is
optional and requires payment of additional premium.
4.94 Livestock insurance of public sector general companies provides coverage to
Milch cows (Indigenous /Cross-bred / Exotic), Milch buffaloes, Stud bulls (Cattle
/ buffalo species), Indigenous/ Cross-bred / exotic calves /heifers, Bullocks
(castrated bulls and male buffaloes), sheep, goats, horses, ponies, donkeys,
camels etc. Identification of the animal is done by putting polyurethane ear tags.
At the time of underwriting, the proposed livestock is identified by applying
polyurethane tags on the ears by the Veterinarian who performs the health
inspection also and issues the Veterinary Health Report, as one of the valuable
documents of underwriting.
Claims experience of Livestock insurance for the General Insurance Public
Sector Association (GIPSA) companies for the period upto 2004-05 is shown
in Table 5. Incidentally, private sector general insurance companies started
operating from the year 2001, but hardly any livestock insurance has been
done by these companies till 2004-05. A few private insurance companies
are now showing interest in livestock insurance as these insurers see
livestock insurance as not merely a way of meeting rural insurance
obligations stipulated by IRDA, but also as a business proposition. Private
sector insurance companies like ILGI, Royal Sundaram General Insurance,
Bajaj Allianz General Insurance etc. are among the insurers who are now
developing livestock insurance. As a business strategy for the fast growing
rural economy, other private sector insurers are likely to follow suit.
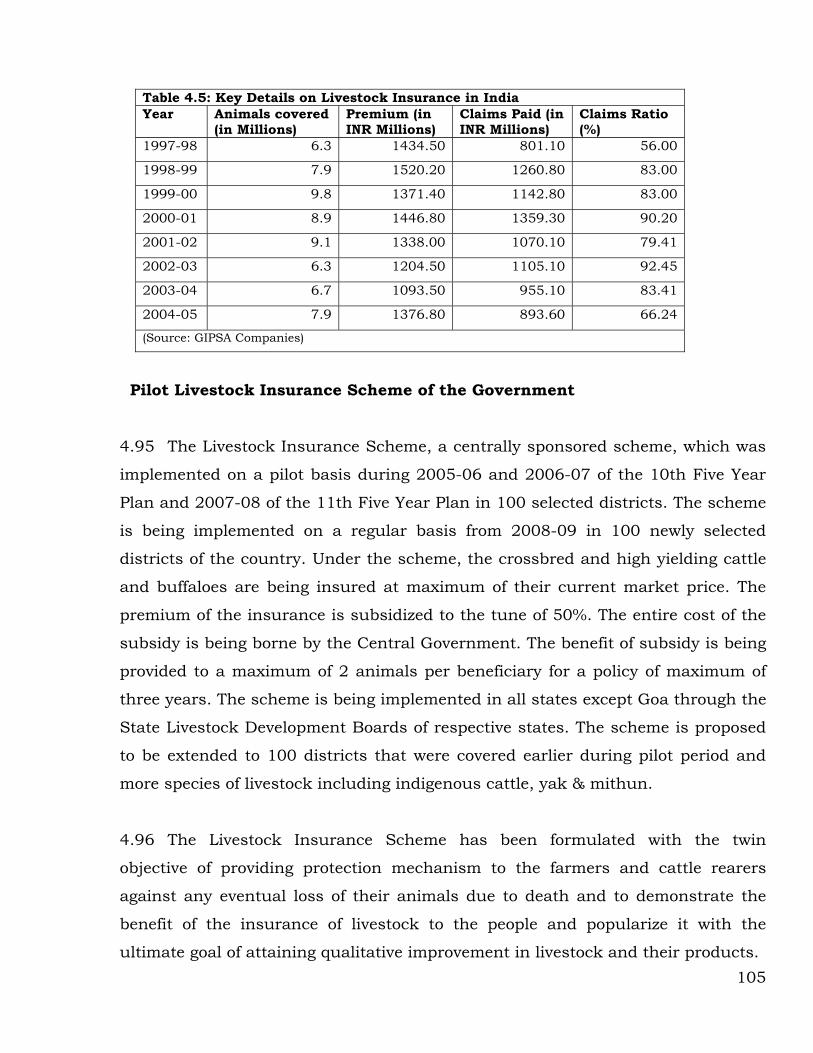
105
Table 4.5: Key Details on Livestock Insurance in India Year Animals covered
(in Millions) Premium (in INR Millions)
Claims Paid (in INR Millions)
Claims Ratio (%)
1997-98 6.3 1434.50 801.10 56.00
1998-99 7.9 1520.20 1260.80 83.00
1999-00 9.8 1371.40 1142.80 83.00
2000-01 8.9 1446.80 1359.30 90.20
2001-02 9.1 1338.00 1070.10 79.41
2002-03 6.3 1204.50 1105.10 92.45
2003-04 6.7 1093.50 955.10 83.41
2004-05 7.9 1376.80 893.60 66.24
(Source: GIPSA Companies)
Pilot Livestock Insurance Scheme of the Government
4.95 The Livestock Insurance Scheme, a centrally sponsored scheme, which was
implemented on a pilot basis during 2005-06 and 2006-07 of the 10th Five Year
Plan and 2007-08 of the 11th Five Year Plan in 100 selected districts. The scheme
is being implemented on a regular basis from 2008-09 in 100 newly selected
districts of the country. Under the scheme, the crossbred and high yielding cattle
and buffaloes are being insured at maximum of their current market price. The
premium of the insurance is subsidized to the tune of 50%. The entire cost of the
subsidy is being borne by the Central Government. The benefit of subsidy is being
provided to a maximum of 2 animals per beneficiary for a policy of maximum of
three years. The scheme is being implemented in all states except Goa through the
State Livestock Development Boards of respective states. The scheme is proposed
to be extended to 100 districts that were covered earlier during pilot period and
more species of livestock including indigenous cattle, yak & mithun.
4.96 The Livestock Insurance Scheme has been formulated with the twin
objective of providing protection mechanism to the farmers and cattle rearers
against any eventual loss of their animals due to death and to demonstrate the
benefit of the insurance of livestock to the people and popularize it with the
ultimate goal of attaining qualitative improvement in livestock and their products.
106
4.97 Till 31st December 2006, close to 200,000 animals were insured and more
than 500 claims were also settled giving immediate benefit to the concerned
farmers. The GOI expenditure on this scheme was INR 242.1 Million during 2005-
06 and INR 251 Million during 2006-07 (Annual Report of Dept. of Animal
Husbandry & Dairying – 2006-07).
Constraints in growth of livestock insurance
4.98 A few major constraints in the growth of livestock insurance are discussed
below:
(1) The claims ratios for livestock insurance stand on the brink of un-
profitability – the average of 1997 to 2004 is 80 percent. If we consider that 15
percent are paid as commissions, and management expenses are another 10
percent of premiums, with other administrative costs 10 percent more, then the
ratio of claims to premiums would stand at about 115 percent of premium. The
adverse claims ratio and hence, adverse profitability is what is preventing the
supply-side, from extending livestock insurance vigorously.
(2) There is a severe constraint from the demand side too, viz., the demand for
livestock insurance, is extremely price elastic. Any attempt to increase the
livestock insurance premium rate rapidly, brings drown the number of animals
insured, as well as the premium income. As illustrations, two actual market
experiments analyzed by National Insurance Academy (NIA) are presented below:
i. Mehsana District Co-operative Milk Union, Gujarat, was experiencing an
adverse claim ratio of 180 percent during the period 1999-2001. To control
the claims ratio, the premium rate was hiked up from 5 percent to 6 percent
in 2001. The result was sharp decline in the number of animals covered
from 39,000 to 14,000 and annual premium collection from INR 10.8
Million to INR 5.8 Million between 2001 and 2005.

107
ii. The second example is that of the Sabarkantha District Co-operative Milk
Union (Gujarat), which also had an adverse claims experience. The lead
insurer, United India Insurance, decided to correct the premium rate and
tighten the claims procedure in the year 2001. The number of animals
insured dropped sharply from 25,000 to 15,000 and the annual premium
collections from INR 11.0 Million to INR 6.5 Million between 2002 and 2005.
Both the case studies above, show how large is the price elasticity of demand for
livestock insurance is. There is widespread withdrawal from insurance, with even
a small increase, in the premium rate. The cause for such high price elasticity is
obviously the low income. Raising the premium rate to make the livestock
insurance operation viable may prove to be self-defeating.
(3) At present, the livestock penetration is just about 1.5 percent of total
livestock population (see Table-6) and about 6.5 percent of the potentially
insurable cattle. This is hardly anything given that a great majority of rural
population derives a share of its income from the livestock.
Table 4.6 : Livestock Insurance Penetration
Year Total Livestock (in Millions)
Livestock insured (in Millions)
Insurance Penetration
1997-98 485.20 6.3 1.30%
1998-99 485.20 7.9 1.63%
1999-00 485.20 9.8 2.02%
2000-01 485.20 8.9 1.83%
2001-02 485.20 9.1 1.88%
2002-03 485.20 6.3 1.30%
2003-04 485.20 6.7 1.38%
2004-05 485.20 7.9 1.63%
The probability of increasing levels of claims can be expected to improve, as the
insurance penetration increases. As is the case with any other insurance, large
number of insured cattle and geographical spread can bring down the incurred

108
claim ratios to below 50 percent, and thus, can help in lowering the premium rates
to less than 3 percent.
4. Issues like, ‘moral hazard’ and ‘adverse selection’, a likely outcome of low
insurance penetration, is perceived as one of the major reasons for high claim
ratio and consequent high premium rates. Proper and tamper-proof devices to
identify the insured animals, effective claim monitoring and control systems can
go a long way in addressing the moral hazard.
5. Insurance awareness in general is very poor, and more so in the rural areas.
Despite some efforts by GIPSA companies in the 1980s and 1990s, not many in
the rural areas are aware of livestock insurance. Those who are aware and have a
need for livestock insurance are skeptical because of perceived complex
procedures, lack of transparency and cooperation on the part of the insurance
staff. Concerted efforts on insurance education & awareness followed up with
farmer friendly insurance procedures and prompt service is the need of the hour
and this will go a long way in making livestock insurance very popular among the
villagers.
4.99 Suggestions for Improving Coverage & Performance of Livestock Insurance A detailed actuarial investigation may be undertaken at a disaggregated level to
ascertain the mortality and morbidity probabilities for various animal
categories in different regions in India and to identify the extent and causes of
mortality and morbidity. This would help the insurance providers to design
appropriate and tailor-made insurance covers suiting the requirements of
livestock owners.
Insurance providers may think in terms of introducing an endowment type
livestock insurance scheme, which combines both risk coverage as well as
investment elements. From available experience of insurance in India, it

109
appears that poor Indian farmers are interested in obtaining some kind of a
return on the insurance premiums that they pay.
Despite allowing a number of private insurance companies the livestock
insurance penetration is just a small fraction of the livestock population. The
most important reason for very low penetration of livestock insurance is ‘moral
hazard’ losses suffered by insurers. Despite technology like RFID, insurers are
not sure to control moral hazards. In order to encourage insurers to promote
livestock insurance, on one hand the government should provide some subsidy
in premium, and on the other should be made indirectly compulsory. As an
illustration, a livestock owner can avail free veterinary services only on the
proof of availing livestock insurance. It’s equally important to start
identification of all livestock through unique ID, which can help both
streamlining veterinary services, and in controlling moral hazard in case of
insurance
Insurance agencies should also consider using a strategy similar to what
financial institutions have followed (in case of microfinance) by bringing in peer
monitoring for control of moral hazard. However, insurers can continue to play
their typical role by taking care of the covariant risks.
Quality of the livestock insurance portfolio can also be improved through long-
term plans. Through these plans the size of the maturity refund can be made to
vary inversely with the actual claims experienced which will incentivize
policyholders to make low claims and also attract and retain good risks into the
pool. Also in cases of fraudulent claims the maturity refund can be forfeited so
that moral hazard can be checked at least in part.
Further ways to make livestock insurance policies more buyer
friendly and better-suited to the payment capacities of the insured could be:
i.Proportional and non-proportional risk through deductibles sharing
arrangements so as to moderate the premium payable by the insured.

110
ii.In case of large farms with more than say 50 to 100 animals, profit and
loss sharing arrangements can be worked out such that, at the end of say
5 years, depending on the profit or loss based on actual claims experience,
it may be shared between insurer and insured.
iii.Staggered premium paying system can be introduced especially for
milch animals in which the premiums can be collected by district co-
operative societies from the weekly milk bills.
Technical Support UNIT FOR Crop Insurance
Background and Rationale 4.100 In recent years, the crop insurance domain in India has witnessed an
increase in focus from key stakeholders amidst a quest for dynamism and
constant improvement in design and delivery of crop insurance products. Weather
insurance - introduced in the developing world through a pilot in India during
2003 instantly caught the fancy of policymakers and developmental entities by
virtue of its potential for shielding the Indian farmers from the spectre of weather
risks. Starting on a high note, the hopes from weather insurance started
dwindling in India until the Indian Government lent a vital impetus to it through
the launch of WBCIS in 2007. Ever since, the penetration and outreach of weather
insurance in India has increased phenomenally.
4.101 The large quantum of financial support by the Government to weather
insurance (mainly in the form of premium subsidy) in particular and to crop
insurance (both as premium subsidy and claims subsidy to NAIS) in general,
warrants that crop insurance delivers best value to farmer-subscribers. With the
increased scope for blending of different types of crop insurance indices
(yield/weather/remote-sensing) and resultant limitless number of designs possible
for crop insurance products, the task of appraising a diverse portfolio of crop
insurance products and their contextual suitability is a specialized task that

111
unfortunately has not been able to attract the level of attention and technical rigor
which it truly deserves. The challenges in comprehensive evaluation of the current
and upcoming crop insurance products are compounded by the fact that these
insurance products lie at a crossover of multiple specialized fields of knowledge.
4.102 A need for a well-equipped Technical Support Unit (TSU) with a
mandate for ensuring the best value from crop insurance and making the Indian
crop insurance programme a shining example for other crop insurance
programmes around the world cannot be overemphasized. India has already
gained a leadership stature in implementation of weather insurance and is poised
to become the innovation factory of the world with respect to new developments in
crop insurance. Besides the argument for best value realization from public funds,
the rationale for a specialized Technical Support Unit for crop insurance is
reinforced by the following observations:
i. Besides Agriculture Insurance Company (AIC), presently at least four insurers
from private sector have been empanelled for selling WBCIS, and more and
more private insurers are showing interest, primarily driven by the level-
playing field and premium subsidies. As the number of insurers grow, the need
for bench-marking of insurance products increase, as the farmers buying
insurance products from different insurers have to carry comparable benefits
for farmer-subscribers. Benchmarking of crop insurance products would be a
fundamental mandate of the proposed TSU which would ensure the roll-out of
only those crop insurance products which can ensure balance between
expectations of the demand side and deliverability of the supply side.
ii. In the current scenario when the cumulative annual premium for weather
insurance for 2011-12 can be projected to exceed ` 2000 crores, which involve
a premium subsidy of almost ` 1400 crores equally shared by the Government
of India and participating States. Similarly, the Modified NAIS approved as pilot
w.e.f. Rabi 2011 season is expected to mop up a premium of Rs. 300 crore
during 2011-12, with subsidy element of almost ` 180 crore. Also, there is

112
every chance that present NAIS will be replaced by MNAIS in one or two years.
In other words, the Government’s outlay towards crop insurance premium
subsidies in the next few years may go upto as much as ` 3000 crore per
annum, and this figures will climb up with increased insurance penetration.
Given this level of funding, the Government has to make sure that its getting
full value out of the subsidy, which is possible when there is a strong technical
team within the Government capable of not only understanding how insurance
premium is set by insurers, but also guide them on larger issues of public
good.
iii. Some of the key stakeholders in the crop insurance domain have indicated
loopholes and weaknesses in the institutional design and process control of
crop insurance. The relatively flexible stipulations related to underwriting and
process control for a product like WBCIS, need to be reviewed rigorously and
tightened which may be best carried out by a specialized agency like the
proposed TSU
iv. Lack of adequate and reliable weather and crop loss data is considered to be a
major constraint in developing an accurate understanding of the current and
future crop production loss variability. An integrated data system for
managing agricultural risk management initiatives in India is the need of the
hour. The responsibility for development and implementation of such an
integrated data system can be entrusted to the proposed Technical Support
Unit. Improvements in crop and weather system will lend a cutting-edge to the
Indian crop insurance programme in which long-term investments like
development of an integrated databank for agricultural risk management, large
investments in awareness/capacity building for crop insurance etc. have taken
a backseat.
v. To complement the process for improving weather insurance products,
medium-term research projects may be commissioned by the Government
under the purview of the proposed Technical Support Unit. As part of these

113
projects, taluka level weather indices for catastrophic insurance can be
developed as an initial step towards more robust systems to mitigate climate
change impacts. Catastrophic risks being low probability and high severity
events, have, in principle, a lower actuarially fair premium compared to more
frequent and moderately severe crop loss events. The low premium
catastrophic covers would ensure an excellent risk mitigation alternative to
farmers at a higher level of granularity (e.g. at taluka level). Simultaneously,
high quality weather data from IMD and other agencies may be analyzed
through inter-disciplinary research exercises involving research institutions,
agricultural universities and industry think-tanks which can take up
region/crop specific calibration exercises for improvement of crop insurance
through blending of indices and actual field pilots.
vi. Service delivery issues in crop insurance have emerged as the key concerns of
farmers during the field research undertaken as part of this study. The
proposed Technical Support Unit can develop service and quality guidelines for
crop insurance and ensure their proper implementation through mechanisms
like audits, monitoring, customer feedback etc.
Design and Composition of Technical Support Unit for Crop Insurance 4.103 The proposed Technical Support Unit (TSU) should ideally be a
separate, independent unit operating under the overall leadership and guidance of
the Ministry of Agriculture and Cooperation (GoI). The suggestions of insurers and
premier research institutions can be invited for identifying such subject matters
experts from India who can objectively assess crop insurance products and
provide inputs for improving them. Since weather-based crop insurance and
blended crop insurance products are relatively new financial instruments even
globally, the possibility of involving international experts (like actuaries, crop-
weather simulation experts etc) in such a body may also be considered. The
proposed TSU can have both full-time and invited members and a small team of
full-time professionals. A broad composition of the TSU is suggested below:

114
Table 4.7: Composition of Proposed TSU for Crop Insurance
Role Background / Organization Number Membership Type
Overall Direction Expert with at least 20 years of experience in agriculture insurance
1 Full-time
Crop Insurance Experts Insurance Companies / Crop Insurance Consultants
4 1 Full-time / 3 Invited
Field Crops Experts Agricultural Research Institutions / Govt. Organizations / Agribusiness Companies
2 1 Full-time / 1 Invited
Horticultural Experts Agricultural Research Institutions / Govt. Organizations / Agribusiness Companies
2 1 Full-time / 1 Invited
Plantation Crop Experts Agricultural Research Institutions / Govt. Organizations / Agribusiness Companies
1 1 Invited
Actuarial Experts Insurance Companies / Independent Practitioners
2 1 Full-time / 1 Invited
Agricultural Statistics Professionals / Data Modellers
Agricultural Research Institutions / Govt. Organizations / FIs
3 2 Full-time / 1 Invited
Agro-meteorology Experts IMD/ Agricultural Research Institutions
2 1 Full-time / 1 Invited
Agricultural Economists Agricultural Research Institutions / Govt. Organizations / FIs
2 1 Full-time / 1 Invited
Reinsurance Experts Reinsurance Brokers / Insurance Consultants
1 1 Invited
IT Professionals (Database Mgmt & S/W Development)
IT Companies / IT Consultants 3 2 Full-time / 1 Invited
Legal & Regulatory Issues Expert IRDA / Insurance Companies 1 1 Invited
Rural Insurance Marketing Experts
Insurance Brokers / Corporate Insurance Agents /
1 1 Invited
Rural Development Specialists NGOs 2 2 Invited
System Development Experts (System Architects)
IT Companies / Risk Mgmt. or Insurance Consultants
2 1 Full-time / 1 Invited
GoI / State Representatives 3 3 Invited
Total Members in Proposed TSU 12 Full-time & 20 Invited
Operational Leadership of Technical Support Unit for Crop Insurance 4.104 The responsibility of the operational leadership of the proposed TSU
should be assigned to an individual with a minimum experience of 20 years in
handling major areas related to crop insurance. The operational head of TSU

115
should be at least a postgraduate in agriculture and should ideally have earned a
doctorate in a relevant area. The ideal candidate would be someone who is familiar
with the process for development of weather insurance products and other
upcoming blended crop insurance. A judicious mix of implementation work,
research, academic publication and relevant international experience in crop
insurance will enhance the suitability of the candidate for the operational
leadership of TSU and will enable a better utilization of the diverse profile of the
TSU members.
Financing 4.105 In the current scenario when the cumulative annual premiums in
2011-12 can be projected to exceed ` 2000 crores under WBCIS, and ` 300 crores
under MNAIS thus involving a premium subsidy of about Rs. 1500 crore from the
Government. Assuming the Government levies a technical fee of 1% on the
premium subsidy given by it to the insurance companies, an annual corpus of `
15 crore per annum can be created easily to fund the proposed TSU, including the
funds required for conducting specific research and pilot projects from time to
time.
4.106 Key Recommendations
Introduction of a pilot Modified National Agricultural Insurance Scheme
(MNAIS) with major improvements in NAIS is a good move. However, there
are two key areas which merit further intervention: (a) premium subsidy
structure requires amendment as premium subsidy is less for areas with
lower to medium risk. There is a strong need for increasing the premium
subsidy for lower and medium tiers; (b) Insurance unit for major crops has
been lowered to village / village panchayat which is good for the farmers,
but exponentially increases the work load of crop cutting experiments
(CCEs). Centre may share part of the cost of CCEs in the short run while
moving to technologies like satellite imagery to estimate the yield in the long
run.

116
Weather Insurance is fast expanding, with number of farmers insured
expected to touch 10 million during 2011-12. Though its growth has been
spectacular, there is still a concern about ‘product design’ of important
crops wherein the weather indices designed so far have largely been unable
to capture the crop losses reliably. It is therefore important that focused
research be undertaken by ICAR and State Agriculture Universities (SAUs)
for fine-tuning weather-yield relationship for crop insurance applications.
Besides Agriculture Insurance Company (AIC), presently at least four
insurers from private sector have been empanelled under WBCIS. More and
more private insurers are showing interest, primarily driven by the level-
playing field and premium subsidies. With increasing competition and
understanding on the subject, involvement of state governments and local
agricultural universities is also increasing. This is leading to development of
products that are customized and most suitable for the area. Moreover with
experience, insurance companies are also coming out with innovative
approaches to provide better coverage and assess risk more accurately. In
such a scenario it would be best to let the respective state governments set
their internal guidelines for product evaluation and monitoring of scheme
implementation by different companies under the overall benchmarking and
standardizing at an aggregate level. However, in order to ensure proper
implementation of the scheme and extract the best value for the government
funds, a dedicated ‘Technical Support Unit (TSU)’ should be created under
the aegis of the ministry of Agriculture (GoI).
Presently most of the weather data requirement for computing weather
insurance claims is met though private weather data providers who are
using variety of sensors of different make and type. Often the data is
challenged by farmers in courts of law, thereby creating problems in
implementation of weather insurance. In order to maintain the sanctity of
the weather data supplied by private data providers, the requirement of
accreditation from a competent third-party designated by the Government
should be mandatory. The accreditation of weather stations should

117
encompass both the equipment and the routine operation for ensuring
consistent and high quality of weather data.
At present Weather index insurance is serviced using on an average one
weather station per tehsil / block. Ideally we should have weather station at
each village to minimize basis risk. However this needs huge investment in
weather station network. The stations still cannot be taken as completely
tamper-proof; besides their maintenance cost is also high. Keeping in mind
these constraints, the concept of ‘virtual weather station network’ based on
‘Terrestrial Observation and Prediction Systems (TOPS) platform can be
tested through suitable pilots. TOPS can actually produce the daily weather
data at the level of one KM grid. Moreover, the system can generate past 10
years data at this level. The expected cost of generating village level daily
weather data for the country for the entire XII Plan period is merely in the
order of ` 200 crore. It may be worthwhile to test the technology to prepare
a comprehensive weather data base for the entire XII Plan period, along with
the data of past 10 yea` The data thus generated can be placed in public
domain for the larger public good, including use in development of weather
insurance products.
While yield index and weather index products could be the mainstay of the
Indian crop insurance programme, there is also need for product innovation
in crop insurance. Some of such products include (a) community-based
mutual insurance (b) savings linked insurance (c) double trigger (index)
insurance (d) index-plus insurance products. These products not only
provide better value but also help in establishing insurance principles and
culture of insurance customization. The Government can look at promoting
pilots on these new products during the period of the XII plan.
Despite the existence of country-wide crop insurance programme for over 25
years, only about 1/5th of the farmers or cropped area could be insured.
Only a minority of non-loanee (institutional non-borrowers) who constitute
about 60 percent of the total farmers participate in crop insurance despite
high level of premium or claim subsidies. At present, though there are
provisions to extend relief to such farmers in case of catastrophic weather

118
events or crop disasters, but the quantum of such relief is largely ad-hoc,
limited and subject to availability of funds. In order to protect the non-
borrowing farmers from extreme financial distress and provide basic
economic security, and other farmers cultivating crops which do not have
insurance products the Government should introduce ‘Catastrophe
Protection’ or ‘Non Insured Crop Loss Assistance’ for farmers.
Agriculture insurance is special kind of insurance program with huge
governmental intervention, and is different from traditional general
insurance in many respects. Thus is seen more as a social instrument of the
government rather than a commercial instrument. A programme of this
nature and magnitude is unlikely to be effectively administered unless
backed by a statute. This would also help in stream-lining agriculture relief.
The most important reason for very low penetration of livestock insurance is
loss suffered by insurers due to ‘moral hazard’. Despite technology like
RFID, insurers are not able to control the moral hazard. In order to
encourage insurers to promote livestock insurance, the government should
provide some subsidy in premium while it makes it mandatory in an indirect
manner by making livestock insurance a pre-requisite for availing key
government schemes for livestock development. As an illustration, a
livestock owner can avail free veterinary services only after providing proof
of insurance of the livestock. It is equally important to start enrolment of all
livestock through unique ID, which can help in streamlining veterinary
services as well as in controlling moral hazard under insurance. Other
suggestions include endowment / long-term policies and mutual insurance
on the lines of Dhan Foundation.
Service Tax Exemption: The Government may exempt all crop insurance
products from service tax, as is the case with NAIS, MNAIS and WBCIS.
Note: Some of the ideas discussed in this document are already under the
consideration of the Government
119
Chapter V
Micro Finance Institutions
Have NBFCs/MFIs a role in the agricultural space? Focus 5.1 The focus of this note is to explore the role in agriculture for Micro Finance
Institutions like i) NBFCs/MFIs which borrow from Banks and other financial
institutions and on-lend to individuals and to individuals in Joint Liability
Groups (JLGs); ii) SHGs under the SHG Bank Linkage program, where SHGs
borrow directly from Banks - one bulk loan is given by the Bank to a SHG -
allowing the SHG to decide on the size and purpose of loans to individual
members - (as envisioned by NABARD; refer Circular to all Commercial Banks
dated 26 February 1992 , sd by Shri J.C. Nanda GM). Since the Kissan Credit
Card is also a major instrument which plays an important role in financial
inclusion in the agricultural sector, this note will also elaborate briefly on its
potential to be relevant to the needs of Small & Marginal (S&M) farmers, provided
it is restructured.
History of initiatives to provide credit to S&M Farmers
5.2 Small and marginal farmers (S&M) have been the “target” of financial
inclusion policy and practice since 1904 when the first Cooperative Society was
registered in Gadag Taluk-Karnataka.. Since then several major institutional steps
have been taken to expand the network of financial institutions in order to
“include” S&M farmers in to the country’s financial sector. The major ones were: i)
the nationalisation of Banks (1969); the launching of NABARD (1982); iii) of
Regional Banks (1975-76); iv) of the SHG-Bank Linkage program (1992).Several
micro finance schemes were introduced targeting S &M farmers, which were
managed by these institutions, starting with the Integrated Agricultural
Development program in 1960-67 to the SGSY in 2000. Under these various
schemes, financial institutions provided small loans (later called Micro Finance) as

120
well as subsidies, opened no frills accounts, issued kisan credit cards etc. The
latest addition to this range of financial institutions are : ii) the NBFCs/MFIs
which mobilise credit from Banks/Financial Institutions and private investors for
on lending M&S farmers, either to individuals or to individuals in JLGs and ii)
the Self Help Groups incorporated in the SHG-Bank Linkage program where
Banks advance one bulk loan directly to each SHG.
Impact not adequate
5.3 In spite of these initiatives of the Government to include the S & M farmers
into the country’s financial sector, studies show that the number of small loans
provided by financial institutions for agriculture is declining steadily over the
years. The credit-deposit ratio indicates an outflow of credit from the rural areas;
the percentage of rural savings is less than urban and the overall growth in the
agricultural sector has languished behind the services and manufacturing sectors.
Though the government has taken several measures to increase credit flow to the
rural sector (which is largely restricted to agriculture and on farm activities like
livestock), the off-take is clearly not increasing
Major Reasons for shortfall
5.4 One reason why the off-take of credit has not improved is that the
Government’s policy remains restricted to “credit for agriculture”. But the small
and marginal farmer , in order to cope with several factors which have resulted in
declining income from traditional agriculture, has increasingly taken up several
activities outside agriculture in order to sustain the family for which credit is not
available. A few of them who have the resources and networks have diversified
into cash crops, which require much larger loans than provided under regular
schemes. The majority however have evolved a “family livelihood strategy”
consisting of several activities many outside agriculture for which credit is not
available. Therefore they need financial institutions and instruments which
provide credit for the set of activities (agricultural and non agricultural)which

121
comprise their livelihood strategy. Unfortunately none of the Government
sponsored programs provides adequate space to cope with this diversity.
5.5 Secondly, in many areas, where S&M farmers have taken irrigated lands on
lease, they do not have documents to prove ownership of land; this makes them
ineligible to borrow from official financial institutions and makes them dependent
on private money lenders. As this is an increasing trend, the gap needs to be
filled.
5.6 Thirdly, banks are facing major staff shortages, which makes it difficult for
them to lend directly to SHGs under the SHG Bank Linkage program and to JLG;
hence they are increasingly moving towards extending large loans to NBFCs/MFIs
under the priority sector. The assumption is that the purpose of loan stated by
borrowers prior to availing of the loan sanctioned is actually true. Surveys indicate
that this assumption is not valid. The clients have used the loan for a variety of
purposes including purchase of household goods and gold. As a result they have
resorted to multiple borrowing in order to repay.
5.7 Fourthly, as Banks amalgamate, they tend towards extending large loans
which marginalises SHGs ( under the SHG-Bank Linkage program). Banks have a
practice of testing SHGs in the first loan and hence give them small amounts,
often less than ` 50,000 in the first loan. Large banks do not find this small loan
viable. This is particularly the case with Commercial Banks and increasingly with
RRBs which have become large entities over the past few years. Here the banks’
response is to lend to NBFCs/MFIs in bulk.
5.8 Fifthly, Banks find it extremely difficult to cover the last mile in spite of
several Government directives to extend banking services to each village; this
again pushes them to extend bulk loans to NBFCs/MFIs.

122
5.9 The stance of the WG is as follows:
1. The SHG-Bank Linkage program is the most appropriate financial mechanism
to extend credit to the poor who have no assets and to marginal dryland
farmers because:
a. the SHG provides space for diversity in loan purposes and sizes and
hence provides credit for all activities which the family selects as part
of its livelihood strategy; in the case of marginal dryland farmers,
evidence shows that the dependence on income from agriculture is
minimal;
b. the SHG does not require land records to extend a loan; the affinity
which exists among the members who self select themselves and their
stake in the group (common fund) provide the guarantee;
c. SHGs are in the village and have first hand knowledge of whether the
member needs a loan and how they use it
d. Most importantly, inclusion must go beyond the provision of finance
to include the poor into the growth process; for this, the SHG member
requires other support besides credit. This support could range from
building confidence and management skills to training in marketable
skills, providing technical support for small investments in land or
livestock. This support needs to be provided by the NGO which has
formed and trained the SHG and is now, in many cases, acting as
Business Correspondent. In other words for the poor to be included in
the growth process, the strategy needs to go beyond financial
inclusion. The Business Correspondent model where the NBFC/MFI
works in partnership with an NGO, Federation of SHGs, Cooperative
or Company, provides both credit and the support required to use it
productively and earn an income . The NBFC promoted by NABARD
called Nabard Financial Services (NABFINS) has found the BC model
appropriate to include the poor into the growth process. NABFINS has
also provided working capital to second level institutions like
Companies and Cooperatives which aggregate, add value and market

123
commodities. The SHGs and their members have a stake in all these
second level institutions which are required for their livelihood base
to expand.
5.10 Challenges faced by the SHG Bank Linkage Program which need to be
addressed:
i) The SHG-Bank Linkage was downgraded in recent years because it was
considered to be too slow in extending credit.
ii) The quality of SHGs declined due to the haste in forming SHGs and above
all because of the lack of Institutional Capacity Building (ICB). ICB Modules are
provided by NABARD but seldom used.
iii) Shortage of Bank staff: Government needs to ensure that banks have a
cadre of staff who can each out to SHGs
iv) Lack of adequate funds for Institution Capacity Building (not ICT): NABARD
and Banks need to provide adequate funds for Institutional Capacity Building –
both to form new SHGs and to upgrade the quality of existing ones which did not
receive any ICB .
vi) The practice of breaking up SHGs to form JLGs which became common in
some States must be contained.
vi) Funds (grants/loans) need to be provided to the Business
correspondent/Company/Federation/Cooperative to provide the support required
by the client to make the loans productive. These funds can take the shape of
grants to promote watershed management programs which reduce the risk of
investment in dryland agriculture, to provide skills training and the shape of
soft loans for working capital to support second level institutions to aggregate,
add value and market agricultural commodities. The need for working capital as
well as for some infrastructure to enable these second level institutions (Producer
companies, Companies, Cooperatives, Federations of SHG) achieve stability is
acute. This need must be met by the NBFCs/MFIs lending to these second level
institutions which is not being done. Credit from Banks is also very difficult to
access since they lack physical security and the risk of failure is comparatively
124
high. As a result the livelihood sources of SHG members continue to be few,
traditional and incapable of competing with market forces.
2. The JLGs are appropriate for small farmers and livestock owners –those who
have productive assets but cannot access credit from banks because they
have no land records; because they are too far from banks or because banks
have problems in covering the last mile.
5.11 Challenges faced by the JLG program: While the features of a well
functioning SHG and the inputs required to form one have been defined by
NABARD, this is not the case with a JLG. Hence many JLGs failed to really
develop a “joint liability” practice and culture. As a result the pressure to use
loans for the purpose mentioned in the application is missing and the pressure to
repay does not arise from the internal dynamics of the JLG but from the staff of
the NBFC/MFI, which (together with repayment linked incentives to staff) resulted
in coercive measures and multiple borrowings.
5.12 The suggestion given here is that the members of a JLG should self select
themselves. A JLG should be given at least 3-4 months time before loans are
extended. During these 3-4 months the members should meet at least 4-6 times
and save regularly. The savings should be deposited in a group account. This will
increase the sense of affinity and develop a sense of joint responsibility among the
group members. Further the loan from the NBFC/MFI should be deposited into
this group account and then extended to each member who opens an account in
his or her name.
3. NBFCs/MFIs have a role in the agricultural space: Given the problems faced
by banks, there is little doubt that the NBFCs/MFIs will play an increasing
role in the agricultural space. Banks will once again provide bulk loans
(after the stress created by the AP crisis is managed). The NBFCs/MFIs

125
have also been officially accepted as a separate category of institutions
which have a legitimate role to play in financial inclusion. While the major
bulk of their clients are not the asset less or marginal farmers, they still
have a major stake in closing the credit gap in agriculture.
5.13 Challenges faced by the NBFCs/MFIs: However for the NBFCs/MFIs to really
include their clients in the growth process (beyond financial inclusion), they need
to re-engineer their business models, especially if they are to lend for agriculture
and livestock. Their present practice to provide small loans of the same size
together with standardised repayment schedules ranging from weekly to monthly,
will not fit the cash flow pattern of the agricultural sector. Returns from
agriculture are lumpy. No crop has a duration of less than 3-4 months and
livestock are sold after a year (in the case of minor ruminants which are being
neglected by credit institutions). Small poultry units need regular working capital
and a customised recovery schedule. The present systems and procedures
adopted by NBFCs/MFIs is entirely geared to reduce the risk to the NBFC/MFI
and in many cases (especially where venture capital is invested) to maximise
profits in a short time. This in turn increases the risk to the client by imposing a
standard product and short repayment periods. Unless software is customised to
the clients needs (which will add to transaction costs), this business model will
continue to increase the risk of the clients and fail to include them in the growth
process.
5.14 Since many NBFCs/MFIs find the recommendations flowing from RBI’s
norms based on Malegam Committee restrictive, many of them are shifting to gold
loans which are the fastest growing sector in credit provision. Several senior
Managers have left or are leaving since high profits and remunerations will no
longer be possible. However, once the dust settles, there will still be a few that
will adopt the RBI’s norms and continue to function in the agricultural space. But
for these to include the clients the growth process they need to re-engineer their
business model.

126
5.15 It is relevant here to recommend that the Not For profit Section 25
Companies extending credit to SHGs and JLGs in the rural areas should be
encouraged. Since they are not vulnerable to the pressures arising from venture
capital (fast growth, profit maximisation and quick exit) and tend to have
members on the governing boards who have a social mission, they can play a
significant role in financial inclusion and beyond in inclusion in the growth
process. However their place must be recognised in the overall financial structure.
At present they have not been given official space.
5.16 Kissan Credit Card: While NBFCs/MFIs and the SHG Bank Linkage
Program are promoted either by the private sector only or in partnership with
formal financial institutions, initiatives taken by banks and the Cooperative sector
are also present, which can fill the agricultural space is a much bigger way in the
future, if they are re-engineered. One example is the Kisan Credit Card.
Re-engineering KCC
5.17 It is suggested that the farmer be allowed to use the KCC to draw credit
for any livelihood activity including agriculture, on farm occupations, (livestock,
poultry) fisheries, small micro business/enterprises, horticulture, as well as to
acquire livelihood skills through training in farm and non farm occupations ;
education and health loans should be included.
5.18 The repayment should be allowed in multiple, but non-rigidly structured
instalments. This will enable the farmer to pay whenever he/she has liquidity.
Though this is allowed in the present KCC product, each withdrawal is due to be
repaid in 12 months. Such a due date determination should be withdrawn.
Instead, in KCC, if credit in the account equals 50% or more of the total amount
withdrawn in a period of 12 months, the account may be taken as a standard,
performing loan.

127
5.19 Like the financial inclusion drive, a Farm Family Credit appraisal drive is
needed. This could be assigned to Bank branches and/or outsourced. On the
basis of this data the credit limits for each family could be decided. This can be
met from an SHG loan or a JLG Loan or through the KCC depending on the
ground situation.
5.20 The farm credit / KCC product may be enhanced to cover holding of
produce by farmers. A credit arrangement from production credit to storage credit
is required. If the farmer decides to keep his/her produce in a warehouse, the
storage credit will take over. The FI/Banks need to lend for aggregation and
storage through outreach programs.
5.21 Arrangements of door-step collection of repayments should be made
through a single point contact. This will enable each farmer to handover cash
whenever available with him/her.
5.22 Background data: The suggestions offered above are based on data and
analysis of surveys done by Government and NGOs. A brief overview of this data
and analysis is in place which may help to provide the background for the
suggestions given in this paper.
1. One reason why Government policy continues to focus on agriculture
activity is the data from surveys like the NSSO which show that about 60%-
70% of the population are “farmers”. The question asked in the NSSO
survey is: “During the past year, have you practised agriculture for 30
days?” If the answer is “yes” the person is listed as a “farmer” even if he is
engaged in other activities for the rest of the year. Besides, other members
of the family also take up activities which are often not related to agriculture
for which the family needs credit. The output as a result, does not give an
accurate picture of the diverse credit needs of an S&M farmer family. Loans

128
need to be given to the “S&M Farmer family” for all activities which comprise
their livelihood strategy and not for agriculture alone.
2. Evidence of the various activities that comprise a dryland faming family’s
livelihood strategy: Two examples of the various activities that two marginal
dryland farmer families selected to make up a family livelihood strategy
bring out the diversity which the financial institutions/instruments (like
KCC) need to be able to support. These two samples are drawn from SHG
group members; the SHGs wee formed in Myrada’s projects. Note that these
SHGs were nurtured by Myrada for 2-3 years in a declining manner.
Adequate institutional capacity building (ICB) was provided.
Table 5.1: Self Help Affinity group Chikkajajur, Holalkere Taluq,Chitradurga Dt.,Karnataka Year Amount
(Rs) Purpose Year Amoun
t(Rs) Purpose
(1) Kausar Banu *(2) Nagarathnamma 1996 1,000 Trading 1997 2,000 Education 1996 3,000 Trading 1997 500 Education 1997 5,000 Trading 1997 2,000 Education 1997 500 Education 1998 4,000 LPG for home use 1997 5,000 Medical expenses 1998 5,000 Education 1997 300 Medical expenses 1998 5,000 Vehicle loan
repayment 1998 4,000 Trading 1999 7,100 House repair 1998 5,000 Trading 1999 8,000 Vehicle loan
repayment 1998 5,000 Trading 2000 8,000 Vehicle loan
repayment 1999 5,000 Trading 2000 15,000 Vehicle loan
repayment 1999 12,000 Trading 2000 325 To purchase SHG
uniform 2000 25,000 To release house
mortgage 2001 18,000 Business
2000 325 To purchase SHG uniform
2002 30,000 Vehicle repairs
2001 2,000 Education 2003 28,000 Vehicle loan repayment
2002 40,000 House purchase 2003 8,325 Sewing machine (SGSY)
2003 325 Household expenses 2004 2,300 LPG for home use 2003 8325 Sewing machine (SGSY) 2005 40,000 Vehicle repairs 2003 50,000 Agriculture land
purchase 2005 1000 Jewellery loan

129
Table 5.1: Self Help Affinity group Chikkajajur, Holalkere Taluq,Chitradurga Dt.,Karnataka Year Amount
(Rs) Purpose Year Amoun
t(Rs) Purpose
2004 2300 LPG for home use 2006 2,000 Jewellery loan 2005 58,000 To release agriculture
land from mortgage 2007 62,000 Tempo purchase
and gold 2005 6,000 House repair 2008 22,820 Tempo repair and
insurance 2005 1,000 Jewellery loan 2009 11,000 Tempo repair 2006 2,000 Jewellery loan 2010 40,500 House repair and
gold 2007 2,000 Gold 2008 53,820 Cycle shop business
and gold
2009 Nil - 2010 500 Gold Total 4,59,390 Total 3,
22,870
Note: Before SAG No Land – had mortgaged land which family had; After SAG 3 acres –released land and purchased. Installed irrigation. Continuing in SAG
Note: The family purchased a used tempo on loan; borrowed from the group to pay the loan in instalments and to repair and refurbish the vehicle. Note: Before SAG 2 ¾ acre dryland; after SAG 2 ¾ acre dryland, but no investment in dryland
Box 5.1: Two examples Kausar Banu: The major traditional activity of the family’s livelihood strategy was
trading; their land had been mortgaged before the Self Help Affinity Group (SAG)
was formed for capital to do trading; later several loans were taken from the SAG
for trading. As income from trading increased, the family reclaimed the mortgaged
land and purchased land and dug a well. Income generating activities increased to
three viz., : i) trading ii) cycle shop iii) agriculture and long term investment
education. They took only one small loan for household expenses. Finally loans
were taken for gold and jewellery- a sign that the family is now confident. The total
investment was Rs 4.5 lacs.
Nagarathamma. The family owned dry land but decided not to invest in agriculture.
Instead it opted to invest in a pre-owned Tempo. The SAG provided capital for
maintenance. Alongside they gave priority to education. It also purchased gold
Total investment in family livelihood strategy -Rs 3.2 lacs.

130
Conclusion
5.23 Food security is no longer achieved by a majority of small farmer families
through agriculture alone. A one track approach in credit provision for agriculture
therefore needs to expand into a systems approach where credit is extended for a
variety of purposes many of which are not related to agriculture. Most small
farmer families are in this transition process. They must be supported to make the
adjustments so that the income from all activities undertaken by the family is
enhanced. Most of them want to educate their children and need loans to do so,
since they are keen to send their children to private schools. They also need loans
to send their youth for training in non agricultural skills. Credit to the small
farmer must include loans for these purposes as well.
5.24 The NSS shows that the percentage of employment in the rural non farm
sector in total rural employment increased from 21.6 percent in 1993-94 to 23.8
% in 1999-2000. This trend has continued and has grown stronger during the
past 10 years
5.25 Maybe it is time to suggest that the focus on credit for “agriculture” should
shift to “credit to small farmer families” living in rural areas. The need for credit to
support ground level institutions which aggregate, add value and market is also a
priority. Initiatives must be taken by banks and Government to cover the higher
risk involved at this second level.
5.26 The following part does not deal directly with agricultural credit although
the issues listed here do have a bearing on implementation of the objectives to
shift 400-500 million rural people out of agriculture.
5.27 If a more holistic or systems approach is to be adopted in the credit policy to
support livelihood security for small and marginal farmers, it is necessary to bring
131
all Government funds allotted to various activities of a small farming family
under one administration /management .At present this is highly fractured.
5.28 For example: At present NRLM is under the Ministry of Rural Development.
Ministry of Human Resource Development and Ministry of labour (and a few
others) also manage training courses like Skill development Initiative (SDI). Then
there is the National Skill Development Council, National Skill Development
Coordination Board and the National Skill development Corporation. There is little
co-ordination between these bodies and the Ministries concerned.. Further these
bodies have done very little since they were established. In this scenario the
Government target of training 400-500 million youth by 2022 will be difficult to
achieve.
5.29 How to achieve this coordination: Two suggestions: 1) Set up a Separate
Ministry at the Centre and in each State for Skill development ii) Convert NRLM
presently managed by MoRD into a Mission mode. It may be easier to opt for the
latter.
Concerns in MFI sector
5.30 The SHG- Bank linkage programme has helped in enlarging the spread of the
availability of financial services to the hitherto unbanked sections of the society
for over 20 years now. It has been witnessing significant growth since it’s
inception. As on March 2010, total 69.53 lakh SHGs were having ` 6198.71
crores savings with banks. On the other hand a total of ` 14453.30 crores loan
have been disbursed to 15.87 lakh SHGs during 2009-10 and leading to greater
financial outreach for poor. The SBLP is a home grown programme that has
elevated India to a respectable position in the global micro-finance scenario
besides attracting the attention of international academia. Lot of theoretical as
well as empirical research has been focussed on micro-finance in India.

132
5.31 Major benefits emanating from the SBLP are the positive impacts on income
from linking SHGs to banks, broadening financial markets through provision of
credit and other financial services to small scale entrepreneurs and thereby on
reduction of poverty, attainment of the Millennium Development Goals,
favourable impact on household income, labor market activity, health and
education and helpful role in ushering in women’s empowerment.
5.32 Several studies have demonstrated positive impacts of SHG on the socio-
economic conditions of SHG members, like an increase in the average value of
assets per household and average value of borrowing since the inception of SHG-
BLP. With regard to social aspects, the SHGs have contributed significantly in
raising the self-confidence of SHG members. As the SHG movement progressed
and more and more SHGs were formed and linked to the banking system, second
generation issues such as sustainability, financial aspects, community actions,
issues of social harmony and social justice cropped up and subsequent studies
focussed on these aspects.
5.33 The problem of financial exclusion of rural masses from institutional fold has
been purportedly due to higher transaction and default risk costs of reaching
them for purveying small ticket loans. SHG linkage has been put forth as a cost
effective alternative to reduce transaction costs and reduce default risk through
joint liability and peer pressure mechanism. Some studies have examined the
viability and sustainability of SHG lending by banks and found that the financial
return ratios for regional rural banks are more favourable in case of SHG lending
than normal lending operations, as the financial risks are significantly less in the
case of the former. Of late, MFIs have been found to operate only on financial
terms, without providing training or capacity building to the SHGs or carrying out
grading of the SHGs or encouraging group savings. These vitiate the very
founding principles on which the SHG movement was built up by NABARD.
133
Chapter VI
Summary and Recommendations
6.1 The Working Group’s approach, deliberations, credit projections and
recommendations have been primarily guided by the 12th Five Year Plan
objective of “faster, more inclusive and sustainable growth”.
6.2 The Terms of Reference [TOR] of the Working Group [WG] deal with
estimation and provision of institutional credit for agriculture, the ability of
cooperatives to participate in enhanced credit dispensation, the status and
role of agricultural risk management programmes and an assessment of MFIs
as a delivery mechanism for agricultural credit. In order to provide focussed
attention to the TOR, the WG constituted four Sub-Groups (SGs) – one each
for the four areas related to the TOR. While the WG held meetings with
various stake holders including representatives of States and Union
Territories and with Industry Associations, the SGs held detailed discussions
internally and with experts in their respective subject areas. This report is
based on the inputs and WG’s own analysis of the subject matter.
Stance of the Working Group
6.3 The Working Group recognizes that agriculture growth in the 12th FYP
faces stiff challenges like less land, less water, adverse impact of climate
change, pressure on farm labour and stagnant productivity. Rapidly
diversifying food basket, related supply management & inflation concerns and
urgency to minimise widening gap between rural & urban incomes are the
other major emerging issues. The credit strategy therefore, will have to be
aligned with the agriculture growth strategy, keeping in view the above
considerations.
Issues and Concerns

134
6.4 After a detailed review of the institutional credit, the WG noted that
despite significant reforms undertaken by rural financial institutions with
regard to systems, processes and delivery, coupled with a sizable increase in
the flow of institutional credit to agriculture, the sector continues to be
characterised by a wide range of concerns. The WG believes that the
achievement of quantitative ‘credit flow’ targets is necessary, but not sufficient
for ensuring inclusive growth.
i. Despite robust credit growth, nearly 8 crore farmers are still outside the
institutional fold. The WG therefore, recommends that it is
imperative to find ways, means and strategies for widening credit
consistent and deepening it, so that those outside the purview of
institutional credit are covered as quickly as possible, if not in the
12th FYP itself.
ii. The increased numbers do not necessarily increase the comfort level on
several counts. The available analysis and literature suggest that quality
of lending and direction of it in the incremental lending leaves much to
be desired. Emerging evidences of regional imbalances in credit flow,
term lending taking a backseat, sluggishness of the share of small and
marginal farmers, dilution in synchronisation of credit flow with
agricultural seasonality, increase in the share of indirect finance, and
poor MIS which is unable to decipher the direction of flow, are such
concerns which imply that the sense of priority is getting deteriorated,
even while credit is being pushed in the sector in a big way. The WG
recommends that there is need to look into the definition of
priority sector keeping in view the emerging concerns. The Reserve
Bank of India has already appointed a Committee and the WG is hopeful
that the Committee will look into this aspect.
iii. The WG’s discussions on the emerging agrarian structure -heavily tilted
towards ‘small farming’ - have important implications for the credit
strategy. The number of small and marginal farmers (83%) and the area
cultivated by them is also increasing and has reached around 41%.
135
However, credit dispensation by banks, (including by cooperative banks,
which traditionally cater to the relatively smaller farmers), was at best
sluggish. This disequilibrium posits the need to address the factors
which constrain small-scale farming and suggest suitable and equitable
forms of aggregation which can be supported by adequate and affordable
credit flows.
iv. On credit flow to small and marginal farmers, the WG feels it necessary
to look in to the composition of their incomes which has crucial bearing
on the flow and composition of credit. One of the major reasons for small
& marginal farm families pursuing a combination of agricultural and
non-agricultural livelihood activities is the steadily diminishing size of
household land holdings and the income there from. For achieving
more inclusive growth, if small, marginal farmers, landless
labourers are on the centre stage, the WG is of the view that the
extant policy needs to factor in the complexity of rural livelihoods
and move from the “credit for agriculture” approach to a broader
and more flexible, “credit for rural livelihoods” approach. Designing
appropriate financial products and putting in place supportive risk
mitigation measures will be required for this shift.
Institutional issues
6.5 With regard to institutional issues, it was represented to the WG that
branches of commercial banks at the field level have a tendency to interpret
regulatory prescriptions in a manner most conducive to their own ‘safety’ and
‘security’. Thus, for example, despite clear instructions to the contrary from
their Head Offices etc., rural bank branches continue to insist on 'collateral'
even for small loans. The existing set up (Ombudsman) at the state level
perhaps may not be able to address these localised issues. The Working
Group therefore recommends setting up of decentralised ground level
mechanism to address regulatory violations and keep a check on such
tendencies.

136
6.6 Spatial coverage and staff shortages are also issues in some remote
areas. Other factors constraining the flow of institutional credit include delay
in stabilisation of the BC model, increasingly larger exposures of bank to
NBFC-MFIs for easy compliance with priority sector lending requirements and
the inability, sometimes disinclination, of banks to bridge the 'last mile gap'.
Cooperatives
6.7 The financial health of the long-term cooperative credit structure
continues to deteriorate as evidenced by the fact that at the end of 2010, the
accumulated losses of the LTCCS were of the order of Rs 5,275 crore
translating into a 59% erosion in owned funds, leaving very little hope for
revival of the structure, precisely at the time when an urgency is felt to
accelerate the pace of asset generating investment credit. The WG therefore,
feels that an alternate mechanism /dispensation needs to be put in place.
6.8 After a detailed review of short-term cooperative credit structure
[STCCS], the Group observed that after implementation of the Debt waiver
Scheme and the recapitalisation assistance, a large number of units in the
short-term cooperative credit structure [STCCS] are now in profit and
accumulated losses are beginning to show a declining trend. Notwithstanding
a relatively better financial health of the STCCS than before, the share of the
STCCS continues to show a declining trend. During the 10th FYP, in the
agricultural credit flow share of cooperatives was around 25 per cent which
has declined to around 16 per cent. This was notwithstanding the fact that
the annual average credit flow to the sector during the 10th FYP increased from
Rs. 32,725 crore to Rs. 50,030 crore during the 11th FYP. The declining share
of cooperatives is worrisome because as an institutional sub-set, they support
a very large number of small and marginal farmer accounts.

137
6.9 The poor resource base of Primary Agricultural Credit Societies
(PACS), their poor management and governance and lack of effective member
participation were identified by the WG as significant barriers to increasing
credit flow through this institutional mechanism. It was noted that PACS have
an average membership of about 1,400 and owned funds of Rs. 13 lakh per
society. Barring around 22,000 PACS in the four southern states and West
Bengal (where the average PACS level deposits are around Rs.90 lakh), the
average deposits in the remaining 74,000 PACS in the country are around Rs.9
lakh per society or less than Rs. 650 per member.
6.10 The position is exacerbated by the fact that the upper tiers in the
structure [Central Cooperative Banks (CCBs) and State Cooperative Banks
(SCBs)] are not in a position to supplement the resources of ground level
institutions by mobilising deposits from non-agricultural areas and clients.
Over the last few decades they seem to have lost their way as evidenced, for
example, by the fact that though, the deposits of CCBs are close to Rs. 1.25
lakh crore, and their CD ratio high at 72%, the ratio of their agricultural credit
to deposits is less than 35%. In other words, CCBs appear to be shying away
from supporting agricultural credit which was, and continues to be, the raison
de tere for their existence. The story of SCBs is similar. Overall, the limited
loanable resources at the PACS level lead to credit rationing, driving members
to moneylenders for accessing the shortfall in their credit requirements. In
fact, it is well known that the STCCS survives primarily on the refinance
support received from NABARD.
6.11 The low level of member participation at the PACS level is also a cause
for concern despite the initiatives taken in the wake of the Vaidyanathan Task
Force. A critical issue for the future, therefore, is how to find ways and means
of increasing member participation at the PACS level and ensuring that they
have a financial stake in these organisations.

138
Risk management in agriculture
6.12 The agriculture sector is characterised by adversity of risks such as
weather, yield, price, calamity etc. which, on occurrance, render farmers
unable to service debt, provide sufficient nutrition to the family or meet health
needs. The frequency and severity of these risks, particularly in last few
decades, has increased on account of climate variability and change.
6.13 Risk management in agriculture ranges from informal mechanisms
like avoidance of high risk crops, diversification across crops and income
sources to formal mechanisms such as agricultural insurance, minimum
support price system and futures markets.The primary crop insurance scheme
in the country is currently, the credit linked NAIS. While the scheme has
certain merit as a risk intervention mechanism, it suffers from several design
and implementation defects such as low indemnity levels, delays in claim
settlement, absence of cover for horticultural crops, poor servicing, low
awareness levels, especially amongst non loanee farmers and inadequate loss
coverage. The concerns of insurers include large insurance unit sizes, high
claims to premium ratios, high costs of distribution and adverse selection
particularly amongst non-loanee farmers who constitute the majority of the
farming community. The fact that government subsidy is available for both
premium and claims, makes the burden large and difficult to budget. Further,
there is need for insurance products in other sectors such as horticulture and
post production phases which requires to be addressed urgently.
Changes in financial landscape during 12th Plan
6.14 In addition to the concerns outlined above, the WG has also taken
into account certain key developments and changes which, in its view, are
likely to impact the financial landscape in the 12th FYP. The first of these is
the UID project of the Government of India which by providing biometric
identity will make the opening of bank accounts much simpler and give an

139
impetus to the Financial Inclusion agenda. Secondly, the Core Banking
Platform will provide seamless connectivity and, together with the telecom
infrastructure, help reduce pressure at bank counters and facilitate the
emergence of a new architecture for accessing financial services. Similarly, the
Business Correspondent model since fine-tuned to demand side requirements
coupled with the encouragement now being given to mobile companies to be
part of the financial inclusion agenda, will also contribute significantly. The
Post Offices can have a significant role to play in providing last mile
connectivity. There is a need to recognize and leverage this potential. The
mandating of payments (e.g. wages under NREGA, pension dues etc.) through
formal channels, including Post Offices, will significantly help in reaching the
unreached with financial services.
Recommendations
6.15 In context of the concerns and changes likely to take place in the
rural landscape, the WG has considered both quantitative and qualitative
aspects of agricultural credit. The thinking of the WG and recommendations in
regard to projected credit requirements, interest rate subsidies, a holistic
approach to agriculture, institutional issues, agricultural risk management
etc. is discussed in the following paragraphs.
Credit projections
6.16 On the basis of various macroeconomic parameters envisaged by the
Planning Commission for 12th FYP, the Group has worked out different
scenarios regarding the estimated flow of credit to the agriculture sector.
These projections are summarised below:

140
Table 6.1: Projections of GLC for agriculture & allied activities for 12th FYP (2012-17)
Sr.
No.
Particulars Total Projection
for 12th FYP period
(Rs crore)
1 Scenario 1- GDP Agriculture grows at 3% annually, ICOR (Agri) at 4 33,89,261
2 Scenario 2 - GDP Agriculture grows at 3% annually, ICOR (Agri) at 4.5 40,41,694
3 Scenario 3- GDP Agriculture grows at 4% annually, ICOR (Agri) at 4 35,29,102
4 Scenario 4 -GDP Agriculture grows at 4% annually, ICOR (Agri) at 4.5 42,08,454
5 Scenario 5 -Trend Based Projections 37,39,022
6 Scenario 6-Ratio of GLCA to GDPA method 31,24,624
6.17 It will be seen from the above that the projections arrived at by various
methodologies vary between Rs 31,24,624 crore and Rs 42,08,454 crore. Building
up of alternative scenarios had become necessary as important parameters like
the expected rate of growth rate in agriculture and required ICOR had not been
frozen. Now that the parameters have been fixed (Agriculture growth at 4% and
ICOR 4.5) the band of the credit requirement can be restricted to scenarios at 3,4
and 5 in the above table, viz., between Rs.35 lakh crore and 42 lakh crore. This
band appears reasonable, as the estimate based on the past trend works out
about 37 lakh crore. Incidentally, WG on Savings under the Chairmanship of Dr
Subir Gokarn also has adopted 4% growth in agriculture and ICOR of 4.5 in their
recommendations. WG hopes that the Steering Committee will take an appropriate
view in this regard.
6.18 The issue of choosing a growth rate for agriculture an appropriate ICOR was
also was deliberated in the WG. For the 11th FYP the recommended ICOR was 4. It
can be seen from the projections, that with a change in the ICOR from 4 to 4.5,
the credit requirement jumps by about 7 lakh crore. Considering that most of the
resources required are to be generated by the system, it was felt to stick to an
ICOR 4.5. When the methodology of the credit projections was deliberated, the WG
Group had observed that the approach has limitations, as the projections rest on
the supply side considerations. However, with the inadequacies of data base, given

141
time frame & available manpower, it was not possible to address the task from the
demand side. Even in such an exercise, we would have had to make several
assumptions. Under the circumstances, the Group felt that the time tested
methodology of approaching the issue from the supply side used for the 11th FYP
be adopted.
6.19 While the WG hopes that the Steering Committee will take a final call on the
preferred alternative, the projections of Ground Level Credit [ GLC ] for agriculture
and allied activities have been firmed up among the three major credit purveying
agencies viz. commercial banks, cooperative banks and RRBs on the basis of the
trends observed in the shares of these agencies in the credit flow to agriculture
over a ten year time frame. For the first year of the 12th FYP, the relative shares
institutional shares have been kept constant, during the later four years the share
of the cooperatives has been increased by 0.75% and that of RRBs by 0.50% every
year. In doing so, the WG had taken to account the improved financials on
account of debt waiver scheme and release of recapitalization assistance. The
increase of disbursements from Rs. 2,54,658 crores to Rs. 3,84,514 crores during
the past 3 years and the steady increase in the number of accounts also was kept
in view.
6.20 The first issue in regard to the projected credit requirements is whether the
system as a whole has the ability to finance the incremental ‘load’ out of its own
resources. The Group is of the view that as far as commercial banks and most of
the RRBs are concerned, their deposit growth is likely to cover the additional
resources required for meeting the projected credit requirements from within the
system.
6.21 The Group's primary concern relates to cooperatives where the deposit
growth is not likely to be ‘adequate’. The Group noted that in regard to crop loans
(which constitute 70% of the aggregate agricultural credit flow), the requirements
of the banking system had grown at around 28% between 1997 to 2007 while the
loans purveyed by the CCS grew at only 14%. The overall CAGR for crop loans

142
which was around 24 per cent during the first three years of the 11th FYP is
expected to grow at least 20% in the remaining period. The Group is, therefore, of
the view that while agricultural credit purveyed by the CCS will continue to
increase, the pace of growth is likely to flatten to around 16% translating into a
credit disbursal of around Rs. 2.05 lakh crore by 2018, or three times the
disbursements in 2011.
6.22 As against this, the deposits of CCBs during the same period, grew by only
8% as compared to 15% by RRBs. Even if the growth rate of deposits in CCBs
increases by another 50% to reach 12% in the next decade, it will not be in a
position to support more than Rs. 1.40 lakh crore of crop loans implying that
NABARD may have to increase its refinance to enable the structure to maintain its
share in the system!!
6.23 In the circumstances, The WG is of the view that NABARD may have to be
adequately supported to augment its own resources and be given suitable
instruments so that NABARD can access market resources for meeting the
requirements of the cooperatives and of those RRBs which may not be able to
generate adequate resources to meet the enhanced credit demand.
6.24 The revival package represents one of the largest programmes of the
Government to bring back the STCCS on rails to take care of outreach especially
to the small and marginal farmers. The implementation is now more or less over
and it can be seen that while the revival package has helped in financial terms, it
has still raised concerns like states not making changes in the law and some
states reverting to tight control by RCS, external interferences after receiving
assistance waivers etc.. The WG recommends that unless legal and
institutional reforms in the package are implemented in letter and spirit,
cooperatives cannot be rebuilt.
6.25 The Group also believes that eventually in the interest of the small farmers
what matters is strengthening of the ground level tier which has the outreach.

143
Therefore, the recent development of making financing of PACS possible
through Commercial Banks where the higher tiers of the STCCS are not in a
position, is a step in this direction and the WG endorses the measure.
6.26 The Group also debated on the financial implications of the projected growth
for the 12th FYP. Assuming that agriculture has to grow at 4% with ICOR at 4.5%,
the Group has estimated that the projected credit flow in the 12th Plan period is
likely to be significantly higher at Rs.42 lakh crore or double the flow anticipated
during the 11th Plan translating into Rs. 8 lakh crore (+) per year, as against the
present level of about Rs.4.5 lakh crore per year achieved during 2010-11.
6.27 As regards fiscal implications of such a growth, the Group is of the view that
given the present mix of 70:30 for crop loans and investment credit, the projected
credit flow is likely to entail a significant increase in subvention for banks and
NABARD for production (crop loan) finance. If to this, are added the subsidies
which different state governments are extending to farmers to make such loans
still cheaper, the overall subsidy bill cannot but balloon. It is therefore clear that
existing input subsidies taken together with the interest subsidies as above, are
likely to have significant fiscal implications.
6.28 While it is true that agricultural subsidies in India are much less when
compared to the rest of the world, especially European countries, and the Indian
farmers do need support; the question of affordability of subsidies and direction of
subsidies to the appropriate segments cannot be sidelined. In the context of credit
subsidy, it is pertinent to note that those who really deserve subsidies are perhaps
not covered under the institutional credit. Theoretically, as well as empirically,
evidences of subsides creating market distortions are available. The WG has
flagged the issue of subvention/subsidy in the above context. The
recommendation is to rationalize subsidy in such a way that it creates minimum
distortion in the market and also the amount involved is used more productively.

144
6.29 A simple exercise to calculate interest subvention/subsidies over the
projected short term credit requirement for the 12th FYP (for all agencies together)
was carried out. The subsidy or interest subvention amount is the difference
between the interest amounts at two different rates viz., 10% (assumed) and the
prevailing 7%. The crop loan amount has been assumed to be outstanding over a
period of six months. With this assumption, over the projected Short term credit of
about Rs. 28,53,577 crores, subvention works out to Rs. 42,000 crore at the
prevailing rate of interest of 7%, implying an average expenditure of Rs. 8500
crore on subsidies per year. This amount does not include the state government
subsidies which have brought down the interest rates further to about 4%,
indicating involvement of roughly similar quantum of subsidy. These two sets of
subsides thus, together, represent a pool of resources which can be utilized more
rationally. The WG is of the view that with this pool of resources, it may be
possible to retain the interest rate at 7% and also create a corpus to take care of
risk mitigation requirements or weather based instabilities and climate change.
These resources could also be dedicated to creation of rural infrastructure,
especially ‘soft infrastructure’ which will go a long way in meeting the needs of the
farmers. Large public investment in either case, will facilitate building confidence
of the bankers and the farmers in investing in agriculture.
6.30 On the qualitative side, the experience of the 11th Plan so far shows that the
increased credit flow has been achieved to a large extent through the process of
credit deepening. Resultantly, small farmer coverage has increased only
marginally. With about 8 crore farmers still remaining outside the fold of
institutional credit, desired outcomes can only be achieved with a thrust on credit
widening. If small and marginal farmers have to effectively participate in the
growth process, various aggregation methodologies including collectives,
cooperatives, corporate and contractual arrangements need to be explored.
The evolving concept of “aggregation” in Indian agriculture ought to be examined
in the broader context of the need enhance productivity and improvement of
farmer livelihoods. Economic theory speaks of the problem of indivisibility of fixed
capital and how it is linked to the economies of scale. Aggregation models on the

145
one hand help benefitting from the scale, on the other hand help in creating credit
absorption capacity and in accessing technology and markets. enable dealing with
the scale having economies of scale for production and marketing, on the other
hand help in accessing marketing. With its experience in promoting ground
level, people centric institutions in the past, NABARD may be advised to
initiate pilots in this area. JLGs promoted by NABARD could also serve as
intermediate interventions within this framework.
6.31 In light of the observations made earlier, the WG has deliberated on how to
take PACS one step further in the reform process towards a more vibrant model.
The WG recommends the following:
• Making PACS member driven and ensuring that members have a
meaningful financial stake in the cooperative.
• Increasing the face value of membership fee or share price from the
existing level of Rs.10 (or at best Rs.100) per member to Rs.500. The
suggestion takes into account that within the cooperative structure, share
capital is linked to borrowing. While this has the effect of notionally
increasing the capital base, the fact that no dividend is paid makes the
cost of credit from cooperatives higher than that from competing agencies
such as RRBs and commercial banks.
• Inducing confidence among members regarding placement of deposits.
Generally, members of cooperatives are hesitant to keep deposits even
with their own PACS as they are rightfully concerned about the safety of
their funds. This is quite understandable because such deposits are not
covered by the DICGC, and the deposit insurance schemes of state
governments are mostly on paper. In this context, the scheme formulated
by NABARD [Institutional Protection and Deposit Safety Scheme (IPDSS)]
for PACS on the lines of similar schemes operating in Germany and
Hungary1 needs to be considered. The scheme is already with the
1 The very fact that most loans of a PACS are concentrated in a small geographical area of a few
villages and for a single economic activity, agriculture, makes the assets of a PACS riskier. A variety of safety nets other than crop insurance are therefore essential. The “institutional protection” part of the scheme focuses on preventing a PACS from failing by taking remedial action as soon as any disturbing signs emerge. The action may

146
Ministry of Finance which needs to be approved quickly for
implementation.
• Incentivizing member farmers to save regularly on the SHG pattern as
part of financial literacy and counseling initiatives the premise being that
this will give an impetus to members to keep deposits with their PACS
and facilitate the IPDSS, when introduced.
• Increasing member participation and making members aware of their
rights and responsibilities and to form village committees of such
members to monitor and activate others to participate in the regular
functioning of PACS.
• Supporting NABARD in the formation of JLGs to address the issues
arising out of the increasing number of small and marginal farmers and
oral tenancy.
• By mooting additional amendments to the Cooperative Societies Acts and
related legislation so as to enable members to reap the full benefit of the
extant reform package.
6.32 As regards the ways and means to accelerate investment credit, the
deliberations of WG show that uncertain viability of the agriculture operations
itself and limitations due to small size of the holding, together pose a major
challenge. Under the circumstances, innovative approaches will have to be used
and aggregation models could be the possible solutions. For example, labour
shortages now being experienced across the sector point to the need for
supporting enhanced farm mechanization initiatives through higher levels of
investment credit. Farm mechanization is generally equated with tractors or
harvesters where investments are heavy. Promotion of small equipments like seed
dribblers, small power tillers, weeders etc., need to be popularised. Where
investments are higher, either group mode may have to be explored or promotion
of custom hiring services may be necessary. PACS could be encouraged to provide
include mandating managerial intervention, liquidity support, temporary or long term restructuring, or even merger with another PACS and so on. Entry barriers are proposed under the scheme to ensure serious participation. Only when closure of a PACS becomes inevitable does the “deposit safety” aspect gets activated which is a pure pay-out from a deposit safety fund. The scheme has been sent to DFS for establishing a Central IPDSS Fund.

147
custom hiring services in a big way. This will help in increasing effective 'contact'
between members and PACS by widening and diversifying the products and
services on offer and converting PACS into 'one stop shop' for farmers. In Punjab,
some of the cooperative societies have started maintaining a stock of farm
machinery including tractors which can be hired by farmers at will. This model
was found to be highly successful as the farmers are relieved from the stress of
having to buy the equipment from the market at high costs. This initiative in
Punjab is mainly cooperative- driven and is amenable for replication in areas
where cooperatives have a strong presence. Such initiatives are particularly
significant as they help in relieving the debt burden on farmers. Whether this has
to be taken forward as a state-driven or cooperative-driven initiative, if replicated
in other states, was deliberated by the Working Group. It was suggested that well-
functioning PACS in different states should be identified, so that the model could
be implemented. The successful functioning of the Cooperative Development Fund
in Tamil Nadu was also cited, wherein, the amount aggregated under the fund was
disbursed as interest- free loans to farmers by several cooperatives.
6.33 In the recent years, capital formation in agriculture (as a percentage of GDP
in agriculture) is showing steady increase. This increase however, is driven
primarily by private investment. Considering that public investment has an
enabling impact on private investment, increased public investment in rural
infrastructure is essential. This will improve the confidence level of banks and
farmers in undertaking investments.
6.34 While the scaling up investments for ‘hard’ infrastructure has often been
emphasized, the need for putting in position ‘soft’ infrastructure remains relatively
less articulated. Easy access by farmers to information (on prices, weather, etc.),
demonstrative extension support and adequate and appropriate risk mitigation
measures come under this category. Developing such an infrastructure is a
challenging task. The solutions require innovative approaches and technology
support so that the required scales can be achieved through low cost solutions.
The WG feels that along with the development of hard infrastructure, NABARD

148
may be entrusted with the responsibility of development of soft infrastructure
also.
Risk Mitigation
6.35 With regard to Risk Management, the WG has examined a range of
modifications and options regarding agricultural risk reduction and mitigation.
These include a comprehensive set of modifications relating to agricultural
insurance, agricultural insurance support services and price support measures. In
this context, the Group reviewed a NAIS pilot project implemented in 50 districts
during the season of 2010/11 which had introduced a number of useful
innovations. Some of the specific recommendations about the modified NAIS are
summarized as under:
• Premium subsidy structure for modified NAIS requires amendment as
premium subsidy is less for areas with lower to medium risk.
• Address the impact of lowering insurance unit for major crops to village /
village panchayat which exponentially increases the work load of crop
cutting experiments (CCEs).
- Centre may share part of the cost of CCEs in the short run.
- Shift to technologies like satellite imagery to estimate the yield in the long
run.
6.36 In regard to insurance in the allied activities space, the Group noted that
livestock related economic activities contribute 20% to the agricultural GDP. Some
segments of the livestock economy are significantly larger than traditional
agriculture, for example, the value of milk output is Rs 1,10,000 crores as
compared to paddy which is Rs 78,200 crores or wheat which is Rs 48,450 crores.
Notwithstanding this, the penetration of livestock insurance is very low and
stands barely at 6.58% of the insurable livestock population. Clearly, the premium
needs to be subsidized so that penetration can be raised to 30% or more during
the 12th FYP. This is particularly relevant since the focus of the Group is on

149
sectors within agriculture rather than merely the crop sector. Some of the other
recommendations about the livestock insurance are as under:
• The most important reason for very low penetration is loss suffered by
insurers due to ‘moral hazard’. Despite technology like RFID, insurers are
not able to control the moral hazard.
• In order to encourage insurers to promote livestock insurance, the
government should provide subsidy in premium while it makes it mandatory
in an indirect manner by making livestock insurance a pre-requisite for
availing key government schemes for livestock development. As an
illustration, a livestock owner can avail free veterinary services only after
providing proof of insurance of the livestock.
• Enroll all livestock through unique ID, which can help in streamlining
veterinary services as well as in controlling moral hazard under insurance.
• Service Tax Exemption: The Government may exempt all crop insurance
products from service tax, as is the case with NAIS, MNAIS and WBCIS.
6.37 Noting that there are assets such as agricultural implements, bullock carts,
pump sets, etc. which seriously impact a farmer’s ability to earn an adequate
income, the Group recommends a single insurance policy covering all assets of the
farmer under a single contract.
6.38 In making its recommendations on risk mitigation, the Group is cognisant
of the role played by private insurance companies. It notes that a large number of
private insurance companies have been operating in the Indian Insurance market
since October 2000. Two of these have done pioneering work in agricultural
insurance chiefly by way of introduction of weather insurance products. The
Group believes that the issue of private sector involvement in agricultural
insurance can be creatively addressed through a system of co-insurance under
which the AIC will be the lead insurer (with underwriting responsibilities and
contacts with multiple agencies) and private insurance companies will take shares
according to their respective capabilities. The Group also recommends for greater
customization most suitable for the area.
150
6.39 The WG, on their deliberations on its role the State governments, have
recommended that State Governments may set up internal guidelines for product
evaluation and monitoring of scheme implementation by different companies
under the overall benchmarking and standardizing at an aggregate level. They
may also create a dedicated ‘Technical Support Unit (TSU)’ under the aegis of the
ministry of Agriculture (GoI) to ensure proper implementation of the scheme and
extract the best value for the government funds.
6.40 Keeping in view the need and scope for putting in place pilots and product
innovations the WG has recommended the following.
i. Mandatory accreditation from a competent third-party designated by the
Government to ensure consistent and high quality weather data.
ii. Testing of ‘Terrestrial Observation and Prediction Systems (TOPS) platforms
through pilots.
iii. Developing innovative products like community-based mutual insurance,
savings linked insurance , double trigger (index) insurance, index-plus
insurance products for better value, and also in establishing insurance
principles and culture of insurance customization.
iv. Broad based insurance- protect the non-borrowing farmers from extreme
financial distress and other farmers cultivating crops which do not have
insurance products, the Government may introduce ‘Catastrophe Protection’
or ‘Non Insured Crop Loss Assistance’.
v. Agriculture insurance being specialty insurance with huge governmental
intervention, is different from traditional general insurance. Thus, is seen
more as a social instrument of the government rather than a commercial
instrument. A programme of this nature and magnitude is unlikely to be
effectively administered unless backed by a statute. This would also help in
stream-lining agriculture relief.
6.41 The Group is of the view that for making insurance effective, it has to be
surrounded by a set of mutually reinforcing support services. Of these, accurate

151
and timely data is one. Further, since insurance operates on the law of large
numbers, it requires effective distribution channels. For the former, the working
Group recommends large-scale use of remote sensing technology blended with
rain gauge data to provide a single, comprehensive and nationally consistent data
base. It believes that such a data base will entail timely settlement of claims
including on - account payments and facilitate the introduction of new
distribution channels like post offices and micro insurance agencies etc.
6.42 The Group notes that MSP is a vital tool in achieving food security while at
the same time providing remunerative prices to farmers for their produce. Having
said this, it feels that a number of modifications are needed to make the scheme
more effective and is considering certain proposals in this regard.
6.43 As regards Commodity Derivatives markets the WG noted that though
elsewhere such markets have a long history, they had only recently been
reintroduced in India to enable farmers to derive the benefit of price discovery and
protect them from adverse price fluctuations. Through the mechanism of these
markets, farmers can ‘hedge’ by taking positions in the Futures Market and
insulate themselves against adverse price fluctuations in the physical market.
However, due to factors such as the predominance of small and marginal farmers
and the lack of awareness and other restrictions, the participation of Indian
farmers in the Commodity Futures market has been low. Creating conditions for
farmers to access such markets is a challenge for agricultural policy planners and
the WG is considering measures to encourage the participation of farmers in such
markets.
6.44 The WG is also looking at contract farming as an instrument of risk
management. It believes that if contract farming is properly and equitably
structured, it can bring about beneficial changes in agricultural production and
marketing. The chief aim of contract farming is to bring the management of
agriculture in line with the best practices of agricultural production. The Group
believes that facilitation, of contract farming requires support in terms of changes

152
in legislation e.g., the APMC Act, putting in position an effective conflict resolution
mechanism and quality control facilities, prescribing flexible norms of pricing and
education and training for stakeholders with a view to safeguard the common
interests of all concerned.
6.45 The Group reviewed the initiatives taken by MFIs to provide credit to small
& marginal farmers and concluded that, overall, the impact has been inadequate.
One reason for this is that while the overall stance of policy has been restricted to
'credit for agriculture', field observations show that fragmentation of land over
time and the consequent decline in income therefrom has ‘forced’ small and
marginal farmers to take up several activities outside of agriculture to sustain
their families. In the main, such activities have not been supported by bank
credit. While few a farmers having education, networks and resources have
diversified into cash crops requiring larger loans than admissible under regular
schemes, the majority have adopted 'family livelihood strategies', in addition to or
outside agriculture to sustain themselves. In the context of these findings, the
strategic intervention needs to reorient institutions to provide credit for
agriculture and non-agriculture purposes both on a standalone basis and within
Government sponsored programmes.
6.46 The Group noted that a large number of small and marginal farmers
undertake agricultural operations without having appropriate documents to prove
their legal status. This being the case, they have no option but to take recourse to
moneylenders as formal sector institutions are disinclined to extend credit to
them. This needs to be addressed.
6.47 It also observed that banks have staff shortages - whether in sanctioned or
operating strength - at the rural branch level which makes it difficult for them to
lend directly to SHGs under the SHG Bank Linkage program and to JLGs.
Further, the trend of 'consolidation' within the banking system has led to banks
extending large loans which marginalize SHGs under the SHG-Bank Linkage
Programme. Experience tends to suggest that banks do not find purveying of

153
small loans to SHGs an attractive commercial proposition. This is particularly the
case with commercial banks and increasingly with RRBs whose response, by and
large, is to gravitate towards the provision of bulk finance to the NBFCs and MFIs
in preference to smaller loans to SHGs under the SHG-Bank Linkage scheme,
primarily for easy compliance with priority sector requirements. Lastly, banks find
it extremely difficult to cover the last mile despite Government directives
exhorting them to extend banking services to each village. This too pushes them
to extend bulk loans to NBFCs/MFIs.
6.48 The Group notes that the assumption underlying lending to the MFI sector
is that the purpose of loans as stated by borrowers in the loan application forms
are the true ones. Surveys, however, indicate that this assumption is not valid
and MFI clients are known to use the loans taken for a stated purpose for a
variety of other purposes including purchase of household goods and gold. As a
result they resort to multiple borrowing to repay the same.
6.49 Notwithstanding the aforesaid, the deliberations of the Group point to the
fact that given the predilections and problems faced by banks, NBFCs - MFIs are
likely to play an increasing role in the agricultural space once the dust settles on
the controversy surrounding the sector. The Group believes that following the
recent regulatory pronouncements which include acceptance of NBFC-MFIs as a
separate category of institutions, as long as they comply with the regulatory
prescriptions, they will have a legitimate role in the agricultural and the financial
inclusion space notwithstanding the fact that the major bulk of their clients are
not asset less or marginal farmers.
6.50 However for the NBFC-MFIs to really include their clients in the growth
process (beyond financial inclusion), they need to re-engineer their business
models especially if they are to lend for agriculture and livestock. Their present
practice of providing small loans of uniform size together with standardised
repayment schedules ranging from weekly to monthly intervals, may not dovetail
with the cash flow patterns in the ‘real’ (agricultural) sector. The fact is that

154
returns from agriculture are lumpy, since crops have diverse cultivation periods
ranging from 3-4 months upwards; livestock are usually sold after a year, small
poultry units need regular working capital support and customised recovery
schedules has to be factored in the design structures of the products offered.
6.51 Further, it is observed that the extant systems and procedures adopted by
NBFC-MFIs are geared primarily to reduce the risk to themselves and to maximise
profits in the short run. This entails imposing standard products and short
repayment schedules on borrowers thus increasing the risk to them. Unless the
software used by these institutions is customised to the needs of the clients
(which will, add to transaction costs), their business model will continue to
enhance the risk of borrowers and impede their efforts, where made, to include
them in the growth process.
6.52 The deliberations of the Group also indicate that the SHG-Bank Linkage
programme is the most appropriate financial mechanism for extending credit to
marginal and dry land farmers as it plays an important role in income
smoothening. It is now established that SHGs provide space for diversity in loan
purposes and sizes, and enable financing of a variety of activities which such
families select as part of their livelihood strategies their income from agriculture
being minimal.
6.53 In this context the Group believes that ‘inclusion’ must go beyond the
provision of finance so as to include the poor in the 'growth process'. For this,
'supports' other than credit have to be provided to SHG members. These supports
include confidence building, imparting management know-how, linking them to
markets and providing technical support for small investments in land or livestock
by “SHG – promoting – NGOs” acting as Business Correspondents. In other
words, for the poor to be included in the growth process, the 'strategy' needs to go
beyond financial inclusion. The Group notes that where the NBFC-MFI works in
partnership with an NGO, Federation of SHGs, cooperative or company, the BC
model ensures both credit and the support required to use the credit productively.

155
For example, NABFINS, a NBFC promoted by NABARD, uses the BC model to
include the poor in the growth process. It also provides working capital to second
level institutions like companies and cooperatives which aggregate, add value and
market commodities. The SHGs and their members have a stake in these second
level institutions which are required for the expansion of their livelihood base.
6.54 The Group is of the view that Joint Liability Groups (JLGs) are the
appropriate mechanisms for farmers and livestock owners who have productive
assets but cannot access credit from banks because they have no land records,
are located too far from banks or have problems in covering the last mile.

156
Annexure
Nomination of Members Credit Chairman- Prof. M. S. Sriram
1. G. Leeladhar 2. Shri Vijayendra – co-opted 3. Jt. Secy., Agriculture 4. Jt. Secy., Plantation (Min. of Commerce) 5. CMD, SBI 6. CMD, PNB 7. KUB Rao, RBI
Cooperative Credit Institutions Chairman – Dr. Prakash Bakshi
1. ED, NAFSCOB 2. MD – NCDC 3. Director, VAMNICOM
Risk Management Chairman- Dr. Rajas Parchure
1. Dr. Gopal Naik 2. Dr. R Kannan 3. Dr. R S Sidhu 4. MD & CEO, ICICI Lombard 5. MD & CEO, IFFCO-TOKIO 6. CMD, AIC 7. Kapil Mandal
Micro Finance Chairman – Aloysius Fernandez
1. D N Rao 2. MD, AFC 3. Vijay Mahajan