consolidated results for nine months ended 2015 - ricoh global · 2014 2020 expanding industrial...
TRANSCRIPT

The mPower mP10i direct-to-garment printer from new Ricoh Group member AnaJet, Inc.
ConsolidatedResults for Nine Months EndedDecember 31,2015
February 1, 2016Ricoh Company, Ltd.

(C)2016 Ricoh Company, Ltd. All Rights Reserved 1February 1, 2016
Forward-looking statements
The plans, prospects, strategies and other statements, except for the historical events, mentioned in this material are forward-looking statements with respect to future events and business results. Those statements were made based on the judge of RICOH's Directors from the information that is now obtainable. Actual results may differ materially from those projected or implied in such forward-looking statements and from any historical trends. Please refrain from judging only from these forward-looking statements with respect to future events and business results. The following important factors, without limiting the generality of the foregoing, could affect future results and could cause those results to differ materially from those expressed in the forward-looking statements:
a. General economic conditions and business trendb. Exchange rates and their fluctuations c. Rapid technological innovation d. Uncertainty as to RICOH's ability to continue to design, develop, produce and market
products and services that achieve market acceptance in hot competitive market
No company's name and/or organization's name used, quoted and/or referenced in this material shall be interpreted as a recommendation and/or endorsement by RICOH.
This material is not an offer or a solicitation to make investments. Please do not rely on this material as your sole source of information for your actual investments, and be aware that decisions regarding investments are the responsibility of themselves. We have adopted a net basis for reporting a portion of lease transactions from this fiscal year in place of gross basis. Past sales figures and related indicators have also been adjusted retroactively to conform to the current year.

(C)2016 Ricoh Company, Ltd. All Rights Reserved 2February 1, 2016 (C)2015 Ricoh Company, Ltd. All Rights Reserved 2
� Sales: ¥1,643.8 billion, up 4.6% from a year earlier, on the strength of growth in Imaging & Solutions and Industrial Products
� Operating profit was ¥85.4 billion, a 0.7% decrease that reflected an adverse business climate and the impact of foreign exchange fluctuations, which overshadowed greater-than-anticipated cost reductions from progress in restructuring
� Net profit was ¥51.4 billion, down 1.8%
� Management is lowering its full-year net sales forecast while maintaining its earnings projection in view of cost-cutting progress in companywide restructuring efforts and enhanced contributions in non-hardware performance from growth in number of machines in field
� Year-end dividend plans unchanged
FY2016/03 Apr-Dec Results Overview

(C)2016 Ricoh Company, Ltd. All Rights Reserved 3February 1, 2016
Key Indicators
Sales ChangesExcl. Forex
Japan -0.6%The Americas -2.6%EMEA +5.9%Other +8.0%Consolidated +1.2%
FY16/03Apr-Dec
Change
Sales 1,643.8 bil. yen +4.6%
Operating profit 85.4 bil. yen -0.7%
Operating margin 5.2% -0.3 pt
Profit attributable to owners of the parent
51.4 bil. yen -1.8%
EPS 70.93 yen -1.29 yen
FCEF* 6.9 bil. yen +38.2 bil. yen
R&D expenditures 86.5 bil. yen -0.3 bil. yen
Capital expenditures 61.6 bil. yen +6.6 bil. yen
Depreciation 52.5 bil. yen -0.7 bil. yen
Exchange rate Yen/US$Yen/Euro
121.67 yen134.42 yen
+14.83 yen- 5.84 yen
*FCEF : Free cash flow excluding finance business

(C)2016 Ricoh Company, Ltd. All Rights Reserved 4February 1, 2016 (C)2015 Ricoh Company, Ltd. All Rights Reserved 4
-28.2
+6.0
+29.2
-3.0
-4.7
FY16/03Apr-Dec
OperatingProfit
-0.6
FY15/03Apr-Dec
OperatingProfit
• Earnings declined amid efforts to step up sales, intensifying competition, foreign exchange fluctuations, and other factors
• Produced greater than anticipated savings from groupwide restructuring initiatives
FY2016/03 Apr-Dec Operating Profit Comparisons
Sales&
Product Mix
Lower product costs
R&D
Forex,net
OtherExpenses
(billions of yen)
Gross profit items SG&A items
SG&A expense reduction +13.7Other Income +15.5

(C)2016 Ricoh Company, Ltd. All Rights Reserved 5February 1, 2016 (C)2015 Ricoh Company, Ltd. All Rights Reserved 5
1,055.1 1,068.3
137.9 165.4
201.0 234.2
125.7 119.4
Business Segments (1)
Imaging & Solutions
FY15/03Apr-Dec
FY16/03Apr-Dec
+1.3% (-2.5%)
+20.0% (+13.8%)
+16.5% (+15.5%)
+5.3%
8.1%
・ Expanded A4 MFP lineup with SP 3610SF, MP C306, and MP 305+
・ Reinforced Eastern European sales structure by acquiring Czech and Slovakian operations of Impromat
・ Expanded in commercial printing market:
RICOH Pro C7100/C9100 remained popular
RICOH Pro VC60000 sales grew
• Overseas IT services expanded on solid performance of Indian operations
• Kept investing to reinforce IT services structure
Acquired Ridgian(UK), Graycon (Canada), Nassion(Malaysia), Capa 4 (Mexico) and Upfront (Belgium)
• Steadily expanded visual communications business overseas
Sales Operating profit
Sales Operating profit
1,394.11,468.0
OfficeImaging
NetworkSystem
Solutions
Office Imaging
Production Printing
Network System Solutions
Operating margin
9.0%
Operating margin
Note: Excluding corporate and eliminations.
yoyyoy
(Excl. forex)
(+1.7%)
MP 305+
( Excl. forex)
(billions of yen)
Highlights
ProductionPrinting

(C)2016 Ricoh Company, Ltd. All Rights Reserved 6February 1, 2016 (C)2015 Ricoh Company, Ltd. All Rights Reserved 6
Supplement: Imaging & Solutions Hardware and Non-Hardware Sales
Overview of FY16/03 Apr-Dec
・ Expanded unit sales of A3 color MFPs and A4 MFPs and increased number of MFPs in field
・ In production printing, generated strong gains in cut sheet color models; non-hardware growth continued
・ Non-hardware recovery reflecting production printing contributions in Americas and hardware expansion in Europe
・ In Asia-Pacific & China, non-hardware sales grew solidly
Hardware
Non-hardware
By category
By region
MFPPrinterPPTotal
Hardware Non-hardware
JapanThe AmericasEMEAOtherTotal
Unit Value → Q3
(Value, excl. Forex)
(Value, excl. forex)
+1%+11%+8%
-5%+2%
+20%
-3%-1%+9%
0%-10%+8%-1%
-3%0%-1%+4%
-2% -1%
-2% -1%
FY16/03 Apr-Dec
FY16/03 Apr-Dec
2016/03Apr-Dec
2015/032014/032013/032012/03
Note: See Appendix for details of quarterly trends.
Hardware Non-hardware
Yoy changes for MFPs, Printers, and Production Printing combined(Value, excl. forex)
1H -2%3Q +0%
-8%+8%
+31%-2%
Value → Q3
-1%-3%
+11%+0%
• Experienced non-hardware recovery as machines in field increased for production printing and multifunctional printers
• Non-hardware sales growth rate unchanged in Q3

(C)2016 Ricoh Company, Ltd. All Rights Reserved 7February 1, 2016 (C)2015 Ricoh Company, Ltd. All Rights Reserved 7
0
500
1,000
1,500
FY11/03 FY12/03 FY13/03 FY14/03 FY15/03 FY16/03
Q1-Q3
RidgianGrayconNassionCapa4Upfront
0
500
1,000
1,500
2,000
2,500
FY11/03 FY12/03 FY13/03 FY14/03 FY15/03 FY16/03
Q1-Q3
Supplement: Imaging & Solutions Growth Areas
Production printing sales IT services and visual communications sales*
*Including network solutions
(billions of yen)
(billions of yen)
Low
High
• Maintained sales growth in color cut-sheet and continuous feed models with sales over nine months reaching levels for entire previous year
• Steadily expanded in commercial printing
・Grew IT services worldwide through strategic investments
・Expanded new value proposition through imaging, IT and visual communications
Momentum
ADAIMC Communications01 Innnovations
Aventia
mindSHIFTNpo SistemiFutureTech
■Color cut-sheet and continuous feed printers
■Production Printers (excl. color cut-sheet and continuous feed models)

(C)2016 Ricoh Company, Ltd. All Rights Reserved 8February 1, 2016 (C)2015 Ricoh Company, Ltd. All Rights Reserved 8
87.9 94.6
4.4 8.4
Industrial Products
FY15/03Apr-Dec
FY16/03Apr-Dec
8.1%
• Expanded thermal media business in Indonesia, setting up a company to process and market thermal ribbons
• Expanded industrial inkjet business in industrial printing and 3D printer areas
• Acquired AnaJet
• Increased optical module sales
• Rolled out automotive power management semiconductors and set up European sales units
Highlights
4.5%
Note: Excluding corporate and eliminations.
RICOH MH/GH series of industrial inkjet heads
R1272S series automotive
semiconductor
+7.6%yoy
(Excl. Forex)
(+4.8%)
Business Segments (2)
Sales Sales
(billions of yen)
Operating margin
Operating margin
Operating profit
Operating profit

(C)2016 Ricoh Company, Ltd. All Rights Reserved 9February 1, 2016 (C)2015 Ricoh Company, Ltd. All Rights Reserved 9
0
500
1,000
1,500
2,000
2014 2020
Expanding Industrial Products Business through AnaJet Acquisition in January 2016
Digital industrial printing market forecast
*Ricoh research
+
Textiles Labels and packaging
Ornamentation and decorating 3D printing
Industrial printing growth areas
� World-class industrial inkjet heads
� Proprietary UV-curable inks
� Global sales and service structure
� Leading U.S. producer and seller of direct-to-garment printers
� Strong customer base in printing and apparel industries
� Around 50 employees
mPower mP10i direct-to-garment printer employs a Ricoh inkjet head
(billions of yen)

(C)2016 Ricoh Company, Ltd. All Rights Reserved 10February 1, 2016 (C)2015 Ricoh Company, Ltd. All Rights Reserved 10
89.4 81.1
0.0 2.0
Other
2.6%
Highlights
0.0%
・ Lower sales owing to divestment of apparel business
・ Strengthened camera lineup with high-end GRII compact model and water- and impact-resistant RICOH WG-40W
・ In camera business, expanded spherical imaging solutions by enhancing image processing and resolution of THETA S and bolstered business-to-business solutions in real estate and other areas
RICOH THETA
-9.3%yoy
(Excl. Forex)
(-9.7%)
RICOH WG-40W
Business Segments (3)
FY15/03Apr-Dec
FY16/03Apr-Dec
Note: Excluding corporate and eliminations.
Sales Sales
Operating marginOperating
margin
Operating profit
Operating profit
(billions of yen)
(C)2016 Ricoh Company, Ltd. All Rights Reserved 11February 1, 2016 (C)2015 Ricoh Company, Ltd. All Rights Reserved 11
AssetsHighlights
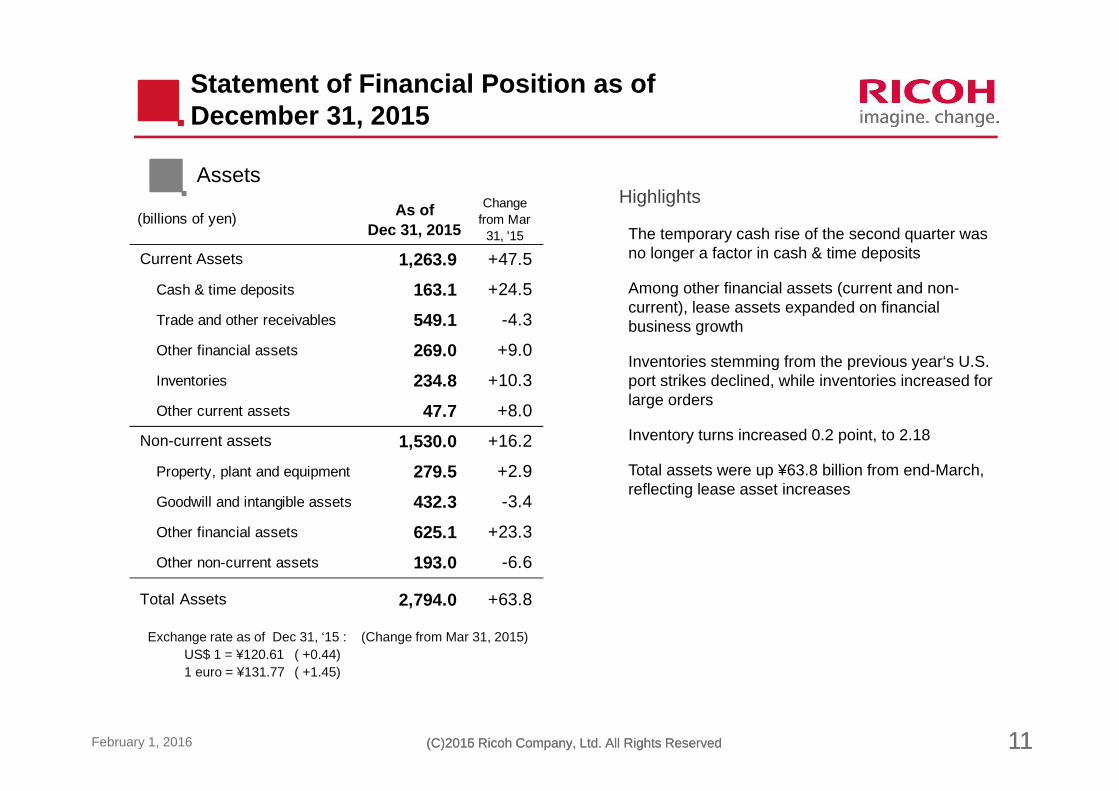
The temporary cash rise of the second quarter was no longer a factor in cash & time deposits
Among other financial assets (current and non-current), lease assets expanded on financial business growth
Inventories stemming from the previous year‘s U.S. port strikes declined, while inventories increased for large orders
Inventory turns increased 0.2 point, to 2.18
Total assets were up ¥63.8 billion from end-March, reflecting lease asset increases
Statement of Financial Position as of December 31, 2015
Exchange rate as of Dec 31, ‘15 : (Change from Mar 31, 2015)US$ 1 = ¥120.61 ( +0.44)1 euro = ¥131.77 ( +1.45)
As ofDec 31, 2015
Changefrom Mar
31, '15
Current Assets 1,263.9 +47.5
Cash & time deposits 163.1 +24.5
Trade and other receivables 549.1 -4.3
Other financial assets 269.0 +9.0
Inventories 234.8 +10.3
Other current assets 47.7 +8.0
Non-current assets 1,530.0 +16.2
Property, plant and equipment 279.5 +2.9
Goodwill and intangible assets 432.3 -3.4
Other financial assets 625.1 +23.3
Other non-current assets 193.0 -6.6
Total Assets 2,794.0 +63.8
(billions of yen)

(C)2016 Ricoh Company, Ltd. All Rights Reserved 12February 1, 2016 (C)2015 Ricoh Company, Ltd. All Rights Reserved 12
Highlights
Total interest-bearing debtincreased ¥94.8 billion from end-March 2015 in line with finance business expansion
The ratio of equity attributable to owners of the parent remained unchanged, at 39.7%
Liabilities and Equity
Statement of Financial Position as of December 31, 2015
Exchange rate as of Dec 31, ‘15 : (Change from Mar 31, 2015)US$ 1 = ¥120.61 ( +0.44)1 euro = ¥131.77 ( +1.45)
As ofDec 31, 2015
Changefrom Mar
31, '15
Current Liabilities 778.4 +6.3
Bonds and borrowings 272.5 +50.4
Trade and other payables 245.9 -31.0
Other current liabilities 259.9 -13.0
Non-current Liabilities 835.8 +32.0
Bonds and borrowings 612.9 +44.4
Accrued pension&retirement benefits 132.5 -11.5
Other non-current liabilities 90.2 -0.8
Total Liabilities 1,614.2 +38.3
2,794.0 +63.8
Total Debt 885.4 +94.8
(billions of yen)
Total Liabilities and Equity

(C)2016 Ricoh Company, Ltd. All Rights Reserved 13February 1, 2016 (C)2015 Ricoh Company, Ltd. All Rights Reserved 13
-15.9
50.6
-7.1
-36.1-31.5
34.0
-30.1
39.7
-51.7
0.0 0.0
19.5
-29.7-21.2
60.7
1.1 4.8 0.9
FY11/03
FY12/03
FY13/03
FY14/03
FY15/03
IFRSUS-GAAP
Q22015/032014/03
Q3 Q4 Q1 Q3 Q4 Q1 Q22016/03
FCFFCFFCEF
*FCEF : Free cash flow excluding finance business
15/03Apr-Dec
16/03Apr-Dec
IFRS
FY2016/03 Apr-Dec Statement of Cash Flows
Free cash flow (billions of yen)
Quarterly
AnnualFCFFCF
FCEF
Q3
FCEF improved ¥38.2 billion on factors such as enhanced working capital and asset revisions
(billions of yen)FY2015/03
Apr-DecFY2016/03Apr-Dec
Profit 56.8 55.4 Depreciation and amortization 80.8 81.2
[ Net profit + Depreciation and amortization ] [ 137.7 ] [ 136.6 ] Other operating activities -102.0 -103.5
Net cash by operating activities 35.6 33.1 Plant and equipment -53.7 -43.6 Purchase of business -8.4 -4.8 Other investing activities -48.3 -26.9
Net cash by investing activities -110.6 -75.3 Increase (Decrease) of debt 84.5 96.5 Dividend paid -24.2 -25.0 Other financing activities -0.7 -3.1
Net cash by financing activities 59.5 68.3 Effect of exchange rate 11.8 -1.1
Net increase in cash and equivalents -3.5 24.9 Cash and equivalents at end of period 136.5 162.6
Free cash flow ( Operating + Investing net cash ) -74.9 -42.2 FCEF (Free cash flow excluding finance business) -31.3 6.9
IFRS
(C)2016 Ricoh Company, Ltd. All Rights Reserved 14February 1, 2016 (C)2015 Ricoh Company, Ltd. All Rights Reserved 14
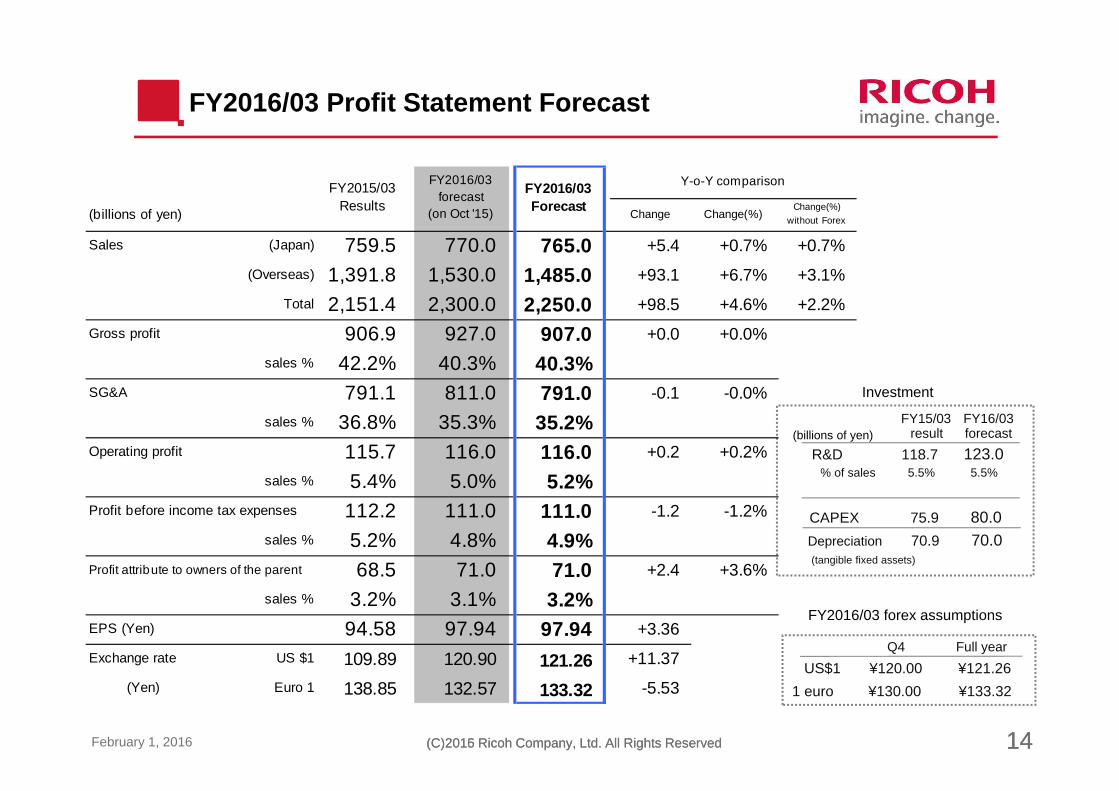
FY2016/03 Profit Statement Forecast
FY15/03 FY16/03result forecast
R&D 118.7 123.0% of sales 5.5% 5.5%
CAPEX 75.9 80.0Depreciation 70.9 70.0(tangible fixed assets)
Investment
(billions of yen)
Q4 Full year
US$1 ¥120.00 ¥121.26
1 euro ¥130.00 ¥133.32
FY2016/03 forex assumptions
Y-o-Y comparison
(billions of yen) Change Change(%)Change(%)
without Forex
Sales (Japan) 759.5 770.0 765.0 +5.4 +0.7% +0.7%
(Overseas) 1,391.8 1,530.0 1,485.0 +93.1 +6.7% +3.1%
Total 2,151.4 2,300.0 2,250.0 +98.5 +4.6% +2.2%
Gross profit 906.9 927.0 907.0 +0.0 +0.0%
sales % 42.2% 40.3% 40.3% SG&A 791.1 811.0 791.0 -0.1 -0.0%
sales % 36.8% 35.3% 35.2% Operating profit 115.7 116.0 116.0 +0.2 +0.2%
sales % 5.4% 5.0% 5.2% Profit before income tax expenses 112.2 111.0 111.0 -1.2 -1.2%
sales % 5.2% 4.8% 4.9% Profit attribute to owners of the parent 68.5 71.0 71.0 +2.4 +3.6%
sales % 3.2% 3.1% 3.2% EPS (Yen) 94.58 97.94 97.94 +3.36
Exchange rate US $1 109.89 120.90 121.26 +11.37
(Yen) Euro 1 138.85 132.57 133.32 -5.53
FY2015/03Results
FY2016/03forecast
(on Oct '15)
FY2016/03Forecast

(C)2016 Ricoh Company, Ltd. All Rights Reserved 15February 1, 2016 (C)2015 Ricoh Company, Ltd. All Rights Reserved 15
115.7 116.0
(billions of yen)
+0.2
FY16/03Operating
ProfitForecast
R&D
Forex,net
OtherExpenses
FY15/03Operating
Profit
+18.8 +27.8 -10.7+10.0 -8.0Previous forecast
Gross profit items SG&A items
H1 -22.2Q3 - 6.0Q4 + 1.5
H1 +3.5Q3 +2.5Q4 +4.0
H1 -3.1Q3 0.0Q4 -4.9
H1 +23.1Q3 + 6.1Q4 + 6.5
H1 -1.0Q3 -3.7Q4 -6.0
-26.7 -8.0+10.0 +35.7 -10.7New forecast
Full-Year Operating Profit Comparisons
Lower product costs
Sales&
ProductMix SG&A expense reduction +20.2
Other Income +15.5

(C)2016 Ricoh Company, Ltd. All Rights Reserved 16February 1, 2016 (C)2015 Ricoh Company, Ltd. All Rights Reserved 16
16.5 16.512.5
16.5 17.0 17.5
16.58.5 16.5
16.5 17.0 17.5
33.0
25.029.0
33.0 34.0 35.0
FY11/03 FY12/03 FY13/03 FY14/03 FY15/03 FY16/03
1.9% -1.4% 2.5%4.7% 4.2% 4.2%
2.0%
-5.1%
3.8%
7.5%6.5% 6.5%
FY11/03 FY12/03 FY13/03 FY14/03 FY15/03 FY16/03
Supplement: Management Indices
ROE/ROA* Dividends
(yen)
122% 64%( - ) 32% 35%36%
*Before income taxes
Forecast
Payout ratio
Annual dividend
Year-end dividend
Interim dividend
US-GAAP IFRS
●ROE●ROA
Forecast

(C)2016 Ricoh Company, Ltd. All Rights Reserved 17February 1, 2016 (C)2015 Ricoh Company, Ltd. All Rights Reserved 17
http://jp.ricoh.com/IR/