constitutive overexpression of the osnasgene …...constitutive overexpression of the osnasgene...
TRANSCRIPT

Constitutive Overexpression of the OsNAS Gene FamilyReveals Single-Gene Strategies for Effective Iron- andZinc-Biofortification of Rice EndospermAlexander A. T. Johnson1,2*, Bianca Kyriacou2,3, Damien L. Callahan4, Lorraine Carruthers2, James
Stangoulis3, Enzo Lombi5, Mark Tester2
1 School of Botany, The University of Melbourne, Melbourne, Victoria, Australia, 2 Australian Centre for Plant Functional Genomics, University of Adelaide, Glen Osmond,
South Australia, Australia, 3 School of Biological Sciences, Flinders University of South Australia, Adelaide, South Australia, Australia, 4 Metabolomics Australia, School of
Botany, The University of Melbourne, Melbourne, Victoria, Australia, 5 Centre for Environmental Risk Assessment and Remediation, University of South Australia, Mawson
Lakes, South Australia, Australia
Abstract
Background: Rice is the primary source of food for billions of people in developing countries, yet the commonly consumedpolished grain contains insufficient levels of the key micronutrients iron (Fe), zinc (Zn) and Vitamin A to meet daily dietaryrequirements. Experts estimate that a rice-based diet should contain 14.5 mg g21 Fe in endosperm, the main constituent ofpolished grain, but breeding programs have failed to achieve even half of that value. Transgenic efforts to increase the Feconcentration of rice endosperm include expression of ferritin genes, nicotianamine synthase genes (NAS) or ferritin inconjunction with NAS genes, with results ranging from two-fold increases via single-gene approaches to six-fold increasesvia multi-gene approaches, yet no approach has reported 14.5 mg g21 Fe in endosperm.
Methodology/Principal Findings: Three populations of rice were generated to constitutively overexpress OsNAS1, OsNAS2or OsNAS3, respectively. Nicotianamine, Fe and Zn concentrations were significantly increased in unpolished grain of allthree of the overexpression populations, relative to controls, with the highest concentrations in the OsNAS2 and OsNAS3overexpression populations. Selected lines from each population had at least 10 mg g21 Fe in polished grain and twoOsNAS2 overexpression lines had 14 and 19 mg g21 Fe in polished grain, representing up to four-fold increases in Feconcentration. Two-fold increases of Zn concentration were also observed in the OsNAS2 population. Synchrotron X-rayfluorescence spectroscopy demonstrated that OsNAS2 overexpression leads to significant enrichment of Fe and Zn inphosphorus-free regions of rice endosperm.
Conclusions: The OsNAS genes, particularly OsNAS2, show enormous potential for Fe and Zn biofortification of riceendosperm. The results demonstrate that rice cultivars overexpressing single rice OsNAS genes could provide a sustainableand genetically simple solution to Fe and Zn deficiency disorders affecting billions of people throughout the world.
Citation: Johnson AAT, Kyriacou B, Callahan DL, Carruthers L, Stangoulis J, et al. (2011) Constitutive Overexpression of the OsNAS Gene Family Reveals Single-Gene Strategies for Effective Iron- and Zinc-Biofortification of Rice Endosperm. PLoS ONE 6(9): e24476. doi:10.1371/journal.pone.0024476
Editor: Ivan Baxter, United States Department of Agriculture, Agricultural Research Service, United States of America
Received June 23, 2011; Accepted August 11, 2011; Published September 6, 2011
Copyright: � 2011 Johnson et al. This is an open-access article distributed under the terms of the Creative Commons Attribution License, which permitsunrestricted use, distribution, and reproduction in any medium, provided the original author and source are credited.
Funding: The Australian Research Council and the HarvestPlus Challenge Program have provided funding that supported the work. The funders had no role instudy design, data collection and analysis, decision to publish, or preparation of the manuscript.
Competing Interests: The authors have declared that no competing interests exist.
* E-mail: [email protected]
Introduction
Rice is the primary source of food for roughly half of the world’s
population yet the polished grain, also known as white rice,
contains nutritionally insufficient concentrations of iron (Fe), zinc
(Zn) and pro-vitamin A to meet daily requirements in diets based
on this staple [1,2]. Other widely consumed cereals, such as wheat
and maize, are also poor sources of several key micronutrients. As
a result, micronutrient deficiencies afflict billions of people
throughout that world and are particularly prevalent in developing
countries where cereals are widely consumed. Fe deficiency affects
more than two billion people worldwide, with symptoms ranging
from poor mental development and depressed immune function to
anaemia, and is the most widespread nutritional deficiency in the
world [3]. The development of new cereal varieties containing
increased concentrations of Fe and other essential micronutrients,
an approach known as biofortification, offers an inexpensive and
sustainable solution to the chronic micronutrient malnutrition
problems that currently plague people in developing countries.
Rice has the lowest Fe concentration of the cultivated cereal
crops and a striking lack of genetic variation for this trait has
hindered conventional breeding efforts from increasing its Fe
concentration beyond 6 mg g21 in polished grain [4,5]. To
produce polished grain with 14.5 mg g21 Fe, the target
concentration that nutritionists have recommended to meet Fe
requirements in a rice-based diet, novel sources of genetic
diversity for grain Fe concentration are required [6,7].
Numerous biotechnological strategies have been employed to
produce rice with increased concentrations of Fe in endosperm
tissues; the principle constituent of polished grain. Grain-specific
PLoS ONE | www.plosone.org 1 September 2011 | Volume 6 | Issue 9 | e24476
overexpression of genes encoding ferritin, a Fe storage protein
found in plants, animals and bacteria, has been utilized to increase
the ‘‘sink’’ for Fe in endosperm [8]. While this approach has
resulted in a two-fold increase in endosperm Fe concentration, the
relatively modest increases in Fe concentration do not match the
13-fold increase in endosperm ferritin protein levels that often
occur via this strategy [9], suggesting that transport of Fe to the
endosperm sink is also limiting.
Nicotianamine (NA) is a chelator of transition metals that plays
important roles in long- and short-distance transport of metal
cations, including Fe2+ and Fe3+, in higher plants [10,11]. NA is
biosynthesized by trimerization of S-adenosylmethionine, a
reaction catalyzed by the NA synthase (NAS) enzymes. Genes
encoding NAS are known to be differentially regulated by iron
status in a variety of plant species including maize, Arabidopsis,
barley and rice [12–15], and show strong induction by Fe
deficiency. Two of the three rice NAS genes (OsNAS1 and
OsNAS2), for instance, show stelar-specific root expression under
Fe sufficiency that becomes more ubiquitous throughout root and
shoot tissues under Fe deficiency, while a third NAS gene (OsNAS3)
changes from a primarily shoot-specific expression pattern under
Fe sufficiency to more root-specific expression under deficiency
[13]. Aside from its role in metal transport in plants, NA is an
antihypertensive substance in humans and rice lines with
enhanced NA concentration have been developed as potential
candidates for the functional food industry [16].
Transgenic approaches to increase NA concentration have often
focused on overexpression of exogenous NAS genes in plants.
Constitutive overexpression of a barley NAS gene, HvNAS1, in
Arabidopsis and tobacco led to a several-fold increase in seed Fe,
Zn and Cu concentration of both species [17]. Similar
overexpression of HvNAS1 in rice led to greatly enhanced NA
concentration (15-fold increase over wild type) and 2.3- and 1.5-
fold increases in Fe and Zn concentrations of polished grain,
respectively [18]. Constitutive expression of an Arabidopsis NAS
gene, AtNAS1, in conjunction with endosperm-specific expression
of genes encoding ferritin and phytase, led to a 6.3-fold increase in
Fe concentration of rice endosperm [19].
Relatively few studies have been done to overexpress the
endogenous rice NAS genes (OsNAS) in rice. Endosperm-specific
overexpression of OsNAS1 resulted in polished grain with signifi-
cantly increased concentrations of NA and Zn and, although Fe
concentration was not increased by this strategy, the bioavailability
of Fe was double that of controls as measured by ferritin synthesis in
Caco-2 cells [20]. Recently, activation tagged lines of rice with
increased expression of OsNAS2 and OsNAS3 were identified and
characterized [21,22]. An OsNAS2 activation tagged line had 20-
fold more NA and 2.7-fold more Zn in polished grain, while two
OsNAS3 activation tagged lines had up to nine-fold more NA, 2.6-
fold more Fe and 2.2-fold more Zn in polished grain. Most
significantly, polished grain from an OsNAS3 activation tagged line
reversed signs of Fe-deficiency when fed to anemic mice [21].
The overall aim of this study was to constitutively overexpress
all three members of the OsNAS gene family, individually, to assess
their utility for Fe biofortification of polished rice grain via a
single-transgene approach. Characterization of more than 90
independent transgenic lines overexpressing these genes revealed
that all three OsNAS genes increase not only Fe, but also Zn
concentrations in unpolished and polished grain when expressed
constitutively and those increases are positively correlated with NA
concentration. One member of the OsNAS gene family, OsNAS2,
was particularly effective at increasing Fe and Zn concentrations in
rice endosperm and this increase was mapped in unprecedented
detail using synchrotron X-ray fluorescence spectroscopy (m-XRF).
Results
Construction of three rice populations overexpressingOsNAS1, OsNAS2 and OsNAS3
The 0.7 kb dual CaMV 35S promoter contained in the pMDC
vector system [23] was used to drive constitutive expression of the
OsNAS1 (LOC_Os03g19427), OsNAS2 (LOC_Os03g19420) and
OsNAS3 (LOC_Os07g48980) coding sequences in rice. The
T-DNA region of the binary vectors used for transformations also
contained the selectable marker gene neomycin phosphotransferase II
that detoxifies aminoglycoside antibiotics such as geneticin (G418)
and kanamycin (Figure 1). Embryogenic callus of japonica rice
cultivar Nipponbare was used for Agrobacterium-mediated transfor-
mation of the binary vectors containing the three different OsNAS
coding sequences. The production of 30 independent transgenic
lines carrying the OsNAS1 overexpression vector, designated the
OE-OsNAS1 population, 39 independent transgenic lines carrying
the OsNAS2 overexpression vector, designated the OE-OsNAS2
population, and 24 independent transgenic lines carrying the
OsNAS3 overexpression vector, designated the OE-OsNAS3
population, was confirmed by resistance to geneticin in T0 and
T1 plants, PCR and Southern blot analysis (data not shown).
Constitutive overexpression of the OsNAS genes leads toincreased Fe and Zn concentrations in unpolished andpolished grain
Because nicotianamine is known to chelate and mobilize a
variety of metal cations including Fe, Zn, Mn, Cu and Ni in plants
[24,11] we employed inductively coupled plasma optical emission
spectrometry (ICP-OES) to characterize the elemental composi-
tion of unpolished T1 grain harvested from a single season of
growth of the three transgenic rice populations in the glasshouse.
Two metals in particular, Fe and Zn, were several-fold higher in
unpolished grain of the OE-OsNAS population, relative to WT
grain (Figure 2), while Mn, Cu and Ni did not show significant
differences from WT grain (Table S1).
Unpolished grain Fe concentrations ranged from 25 to 56 mg g21
dry weight (DW) in the OE-OsNAS1 population, 19 to 81 mg g21
DW in the OE-OsNAS2 population and 21 to 63 mg g21 DW in the
OE-OsNAS3 population, representing up to 2.4-fold, 3.5-fold and
2.7-fold increases, respectively, over wild type (WT) in each
population (Figure 2A). Unpolished grain Zn concentrations ranged
from 40 to 59 mg g21 dry weight (DW) in the OE-OsNAS1
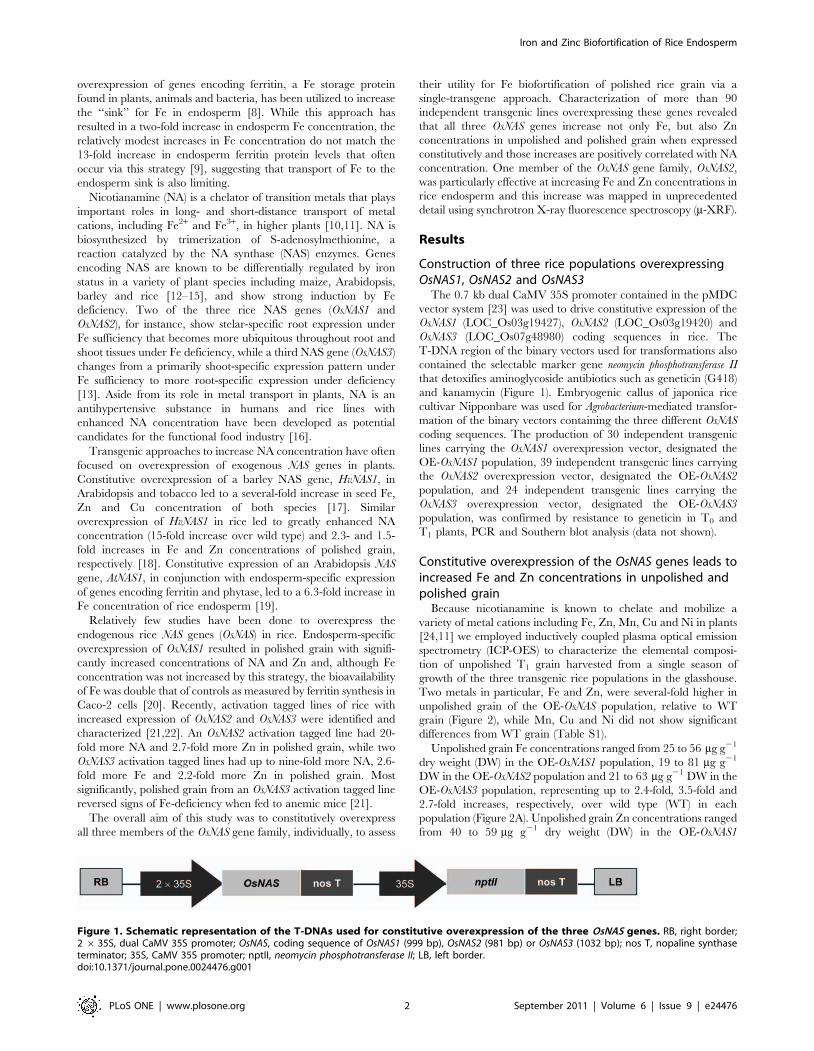
Figure 1. Schematic representation of the T-DNAs used for constitutive overexpression of the three OsNAS genes. RB, right border;2 6 35S, dual CaMV 35S promoter; OsNAS, coding sequence of OsNAS1 (999 bp), OsNAS2 (981 bp) or OsNAS3 (1032 bp); nos T, nopaline synthaseterminator; 35S, CaMV 35S promoter; nptII, neomycin phosphotransferase II; LB, left border.doi:10.1371/journal.pone.0024476.g001
Iron and Zinc Biofortification of Rice Endosperm
PLoS ONE | www.plosone.org 2 September 2011 | Volume 6 | Issue 9 | e24476

population, 30 to 95 mg g21 DW in the OE-OsNAS2 population and
30 to 79 mg g21 DW in the OE-OsNAS3 population, representing up
to 1. -fold, 2.5-fold and 2.1-fold increases, respectively, over wild
type (WT) in each population (Figure 2B). Furthermore, Fe and Zn
concentrations of unpolished grain were highly correlated in
transgenic lines (r = 0.83, 0.94 and 0.97 for the OE-OsNAS1,
OE-OsNAS2 and OE-OsNAS3 populations, respectively) which
accounts for the similar Fe and Zn profiles in Figure 2A and 2B
(genotype order is the same in both panels).
Polished grain was produced from selected transgenic lines using
a modified non-contaminating Kett Mill. One transgenic line
overexpressing OsNAS1 (OE-OsNAS1S), two independent transgenic
lines overexpressing OsNAS2 (OE-OsNAS2B and OE-OsNAS2J) and
one transgenic line overexpressing OsNAS3 (OE-OsNAS3B) were
selected for this analysis based on large numbers of available grain to
mill and Fe concentrations that fell within the upper 20% of each
overexpression population. WT had a Fe concentration of
4.5 mg g21 DW in the polished grain, representing approximately
20% of Fe concentration in the unpolished grain (Table 1). The
OE-OsNAS1S and OE-OsNAS3B lines had Fe concentrations of
approximately 10 mg g21 DW in polished grain, representing
(like WT) 20% of Fe concentrations in the unpolished grain and a
two-fold increase over WT concentration. The two OsNAS2
overexpression lines (OE-OsNAS2B and OE-OsNAS2J) had Fe
concentrations of 14–19 mg g21 DW in polished grain, representing
26–30% of Fe concentrations in the unpolished grain and up to a
4.2-fold increase over WT concentration. Zinc concentrations were
also increased in polished grain of the transgenic lines. The OE-
OsNAS1S and OE-OsNAS3B lines had approximately 49 mg g21 DW
Zn in polished grain, representing a 1.4-fold increase over WT
concentration. The OE-OsNAS2B and OE-OsNAS2J lines had 52–
76 mg g21 DW Zn in polished grain, representing up to a 2.2-fold
increase over WT concentration. As with unpolished grain, the Fe
and Zn concentrations in polished grain were highly correlated
(r = 0.94).
Constitutive overexpression of the OsNAS genes leads toincreased NA concentrations in unpolished grain that arepositively correlated with Fe and Zn concentration
Liquid chromatography-mass spectrometry (LC-MS) was em-
ployed to determine if OsNAS overexpression leads to significantly
increased NA concentration of the grain. Single-insert transgenic
lines were selected for nicotianamine quantification experiments to
ensure that null segregant lines (lines that have the lost the
overexpression vector due to meiotic segregation) were produced
as additional controls to WT. Three sibling T1 lines, comprising
two transgenic lines and one null segregant line, were derived from
a single T0 parental line within each of the three OE-OsNAS
Figure 2. Fe (A) and Zn (B) concentrations in unpolished grain of wild type and transgenic rice. WT, three wild type lines of rice; OE-OsNAS1, 30 independent transgenic lines overexpressing OsNAS1; OE-OsNAS2, 39 independent transgenic lines overexpressing OsNAS2; OE-OsNAS3,24 independent transgenic lines overexpressing OsNAS3. Unpolished grain was analyzed by ICP-OES to determine Fe and Zn concentrations. Thethree populations of overexpression lines are sorted in order from lowest to highest Fe concentration in panels A and B.doi:10.1371/journal.pone.0024476.g002
Iron and Zinc Biofortification of Rice Endosperm
PLoS ONE | www.plosone.org 3 September 2011 | Volume 6 | Issue 9 | e24476
9

populations and grown to maturity in a growth room to yield T2
grain. The T0 parents of the OE-OsNAS1, OE-OsNAS2 and OE-
OsNAS3 T1 siblings had unpolished grain Fe concentrations of 56,
64 and 51 mg g21 DW, respectively, and unpolished grain Zn
concentrations of 59, 80 and 65 mg g21 DW, respectively. In
addition to nicotianamine quantification by LC-MS, the Fe and
Zn concentrations of T2 grain were determined by ICP-OES.
The unpolished grain NA concentration was 18 mg g21 DW for
WT and did not differ significantly from unpolished grain NA
concentrations of null segregant (NS) lines (Figure 3A). By
contrast, unpolished grain NA concentrations ranged from 96 to
115 mg g21 DW in the OE-OsNAS1 sibling lines, 152 to 168 mg g21
DW in the OE-OsNAS2 sibling lines and 174 to 210 mg g21 DW
in the OE-OsNAS3 sibling lines, representing up to 6.4-fold, 9.3-
fold and 11.7-fold increases, respectively, over wild type (WT)
concentrations of NA. Figure 3B demonstrates the statistically
significant, positive correlation that was found between unpol-
ished grain NA concentration and Fe and Zn concentration for
the ten genotypes utilized in this experiment. While the OE-
OsNAS3 siblings produced T2 grain with the same Fe and Zn
concentrations as the T0 parent, the Fe concentration of T2
grain from the OE-OsNAS1 siblings and Fe and Zn concentra-
tions of T2 grain from the OE-OsNAS2 siblings were lower than
that of the T0 parents (approximately 10–15 mg g21 DW lower).
These results indicate that grain Fe and Zn concentrations of
certain transgenic events are more consistent than others across
varying environments (in this case glasshouse vs. growth room)
and that all events should be evaluated over several sexual
cycles and under differing conditions including the field.
m-XRF elemental maps reveal significant increases in Feand Zn accumulation in specific tissues of OE-OsNAS2grain
Synchrotron X-ray fluorescence spectroscopy (m-XRF) was used
to generate elemental distribution maps of several NA-related
cations (Fe, Zn, Mn and Cu) in two longitudinal sections each of
WT and OE-OsNAS2A grain (four sets of elemental distribution
maps total). Elemental distribution in the two longitudinal sections
of each grain type was very similar and therefore only one set of
images for each grain type is presented in Figure 4.
The maps of Fe distribution in WT and OE-OsNAS2A grain
(Figures 4B and C, respectively) show a striking lack of detectable
Fe signal in large portions of the endosperm. In WT grain, the
highest signal occurs in scutellum and outer regions of the embryo
while a very low Fe signal is detected in the outermost layers of the
endosperm and the single-layered aleurone that surrounds the
endosperm. No signal is detected from the inner layers of the
endosperm. The OE-OsNAS2A grain, by contrast, has a high Fe
signal in the outer endosperm and aleurone layers in addition to
high aleurone and embryo signals. The inner layers of endosperm,
as with WT grain, have no signal.
The maps of Zn distribution in WT and OE-OsNAS2A grain
(Figures 4D and E, respectively) depict a radically different
distribution of this element compared to Fe. In WT grain, the
highest signal is observed inside the embryo (likely corresponding
to the plumule) while the scutellum and outer embryo has
intermediate signals. A low signal is detected in a thick band
comprising many outer layers of endosperm and the single-layered
aleurone that surrounds the endosperm. Unlike Fe, the Zn signal
extends (albeit at very low levels) throughout the endosperm of
WT grain. In OE-OsNAS2A grain a similar pattern of Zn
distribution is observed, however, the signal in the embryo and
throughout endosperm tissues is considerably higher. In the
outermost layers of the endosperm and the single-layered
aleurone, the signal borders on intermediate signal intensity.
The maps of Mn and Cu in WT and OE-OsNAS2A grain
(Figures 4F and G, 4H and I, respectively) show that these metals,
like Fe, have no signal in much of the endosperm. The Mn signal is
higher in the outermost layers of the endosperm and the single-
layered aleurone of OE-OsNAS2A compared to WT, and this may
be explained by the slightly higher Mn concentration detected by
ICP-OES for the OE-OsNAS2A grain relative to WT (14 vs.
11 mg g21 DW Mn, respectively). The Cu signal is higher in the
embryo of OE-OsNAS2A compared to WT, and this may be
explained by the slightly higher Cu concentration detected by
ICP-OES for the OE-OsNAS2A grain relative to WT (9 vs. 7 mg
g21 DW Cu, respectively).
XRF line scans reveal significantly more Fe and Zn, andlarger Fe:Zn ratios, in aleurone, subaleurone andendosperm tissues of OE-OsNAS2 grain
Two 135 mm line scans across the grain, away from the embryo
region, are reported for WT and OE-OsNAS2A in Figure 5. These
line scans were obtained by laterally averaging a box (represented
by a square in Figure 4A) with a width of 23 pixels so that each
count represents the average of 23 line scans of the grain. The rice
grain contains a single aleurone layer that is rich in phosphorus (P,
primarily in the form of phytic acid) while starchy endosperm
tissues contain only trace P [25,26]. The P distribution, which had
highly similar counts and profile in both WT and OE-OsNAS2A
grain, was thereby used to assign regions of the line scan to
aleurone, subaleurone and endosperm layers of grain. As the
Table 1. Concentrations of Fe and Zn in unpolished and polished grain of WT and transgenic rice.
Genotype Unpolished (mg g21) Polished (mg g21) % Fe in polished % Zn in polished
Fe Zn Fe Zn
WT 22 42 4.5 34 21 81
OE-OsNAS1S 47 63 9.7 48 21 76
OE-OsNAS2B 64 91 19 76 30 84
OE-OsNAS2J 54 68 14 52 26 77
OE-OsNAS3B 51 65 9.9 49 19 75
Grain samples from WT, one transgenic line overexpressing OsNAS1 (OE-OsNAS1S), two independent transgenic lines overexpressing OsNAS2 (OE-OsNAS2B and OE-OsNAS2J) and one transgenic line overexpressing OsNAS3 (OE-OsNAS3B) were analyzed by ICP-OES. The percentage of Fe and Zn concentration in polished grain,relative to unpolished grain concentration, is presented in the last two columns of the table.doi:10.1371/journal.pone.0024476.t001
Iron and Zinc Biofortification of Rice Endosperm
PLoS ONE | www.plosone.org 4 September 2011 | Volume 6 | Issue 9 | e24476

rectangular-shaped aleurone cells of rice endosperm are approx-
imately 25–30 mm in length [27], we conservatively assigned the
first 50 mm of the line scan to the aleurone layer (the additional
20 mm accounting for the pericarp, seed coat and nucellus that
precede the aleurone layer). Consistent with the phytic acid-
enriched aleurone layer, the average P counts for both WT and
OE-OsNAS2A grain were by far the highest in this 50 mm section
(70 and 81 counts, respectively). P counts began to rapidly drop off
after 50 mm and we assigned 51–90 mm to the subaleurone layer
and 91–135 mm to the endosperm (assuming average cell lengths
of 40 mm in these two layers). Average P counts for WT and OE-
OsNAS2A grain were roughly halved in the subaleurone layer (44
and 30 counts, respectively) and nearly background levels in the
endosperm layer (20 and 18 counts, respectively).
The line scan of WT grain (Figure 5A) shows that Fe and Zn
counts increase rapidly through the aleurone layer and are nearly
equal towards the start of the subaleurone layer (,1550 counts for
both Fe and Zn at 50 mM). The Fe count begins to drop off
beyond this point while Zn continues to climb for most of the
subaleurone and endosperm layers before leveling off in the last
10 mm of the scan. The results demonstrate that while the
aleurone layer has significant amounts of Fe and Zn,
the subaleurone layer and endosperm layers, combined, have
higher amounts of both of these metals. The results also show that
there is more Zn relative to Fe for nearly all of the scanned region,
leading to Fe:Zn signal ratios of ,1 for the aleurone, subaleurone
and endosperm layers (Table 2).
The line scan of OE-OsNAS2A grain (Figure 5B) shows that Fe
and Zn counts increase rapidly through the aleurone layer but at a
much steeper slope for Fe, so that Fe counts surpass Zn counts
early in the aleurone layer. The Fe count shows a first peak in the
aleurone layer (5482 counts at 41 mm), similar to WT. Unlike the
WT grain, however, the OE-OsNAS2A grain has two, successively
higher, Fe peak regions in the subaleurone (6498 counts at 81 mm)
and endosperm (6958 counts at 101 mm) layers. The Fe count
begins to drop off beyond this point, most rapidly in the final
20 mm of the scan. The Fe counts in WT and OE-OsNAS2A grain
are plotted on linear scale in Figure 6 to clearly visualize the
differences in Fe quantity and distribution between the two
genotypes.
The Fe count is approximately 4.4-fold higher in the aleurone,
subaleurone and endosperm layers of OE-OsNAS2A grain relative
to WT (Table 2). The Zn count in OE-OsNAS2A grain rises
progressively through the scan, but does not surpass the Fe count
until the final 20 mm of the scan. The Zn count is 1.4-fold higher
in the aleurone layer and two-fold higher in the subaleurone and
Figure 3. Fe and Zn concentrations in unpolished grain are positively correlated with nicotianamine (NA) concentration. (A) NS, nullsegregant lines of rice; WT, wild type line of rice; OE, overexpression lines of rice. Three sibling T1 lines, consisting of two OE lines and one NS line,were obtained from a single-insert T0 mother line in each of the three OsNAS overexpression populations. The three OsNAS1 sibling lines are labeledOE1-1, OE1-2 and NS1; the three OsNAS2 sibling lines are labeled OE2-1, OE2-2 and NS2; the three OsNAS3 sibling lines are labeled OE3-1, OE3-2 andNS3. Unpolished grain was analyzed by LC-MS to determine nicotianamine concentration (mean 6 SE, n = 4). Significant differences from WT weredetermined by Student’s t test and are indicated by asterisks (P,0.05). (B) Statistically significant positive correlations were found betweenunpolished grain NA concentration and Fe (black shapes; r = 0.9769 and p,0.01) and Zn (gray shapes; r = 0.9288 and P,0.01) concentrations for theten genotypes described in panel A. The six OE1, OE2 and OE3 sibling lines are represented by triangles, diamonds and squares, respectively. Thethree NS lines appear just next to the WT line (represented by circles) on the scatter chart.doi:10.1371/journal.pone.0024476.g003
Iron and Zinc Biofortification of Rice Endosperm
PLoS ONE | www.plosone.org 5 September 2011 | Volume 6 | Issue 9 | e24476

endosperm layers of OE-OsNAS2A grain relative to WT. These
fold increases for Fe and Zn count are remarkably consistent with
the 4.2-fold and 2.2-fold increases of Fe and Zn concentration,
respectively, that were reported for polished OE-OsNAS2B grain,
relative to WT, as determined by ICP-OES (Table 1). Because Fe
counts are higher than Zn counts for most of the line scan, Fe:Zn
signal ratios are much larger for OE-OsNAS2A and .1 for both
the aleurone and subaleurone layers (Table 2).
Discussion
The results of this study demonstrate significantly increased Fe
and Zn concentrations in rice endosperm as a result of constitutive
overexpression of single OsNAS genes. Within each of the
three transgenic rice populations – OE-OsNAS1, OE-OsNAS2
and OE-OsNAS3 – lines were identified with at least 2- and 1.5-
fold increases in Fe and Zn concentrations, respectively, of
unpolished grain. Large differences, however, were observed
regarding the upper limits of Fe and Zn enrichment that were
found in each population (Figure 1). The OE-OsNAS1 and OE-
OsNAS2 populations differed most significantly from each other,
with the highest Fe-containing OE-OsNAS1 line (56 mg g21 DW)
representing only 70% of the unpolished grain Fe concentration of
the highest OE-OsNAS2 line (81 mg g21 DW). In fact, the five
highest Fe-containing OE-OsNAS2 lines had more than 60 mg g21
DW Fe in unpolished grain. The observed differences between the
OE-OsNAS1 and OE-OsNAS2 populations are surprising consid-
ering that the coding sequences of OsNAS1 and OsNAS2 share 87%
identity and the first 233 amino acids of the two, roughly 330 aa
long enzymes, are identical. The OsNAS1 and OsNAS2 enzymes
Figure 4. m-XRF elemental maps of WT and OE-OsNAS2A longitudinal grain sections. WT grain had 23 mg g21 DW Fe and 38 mg g21 DW Znwhile OE-OsNAS2A grain had 64 mg g21 DW Fe and 80 mg g21 DW Zn, as determined by ICP-OES. (A) Light microscopy photo of a representative grainsection with numbers indicating the location of scutellum (1), embryo (2) and endosperm (3); the green box represents the area used to obtain theline scans in Figures 5–6. (B–I) Elemental maps of Fe distribution in WT (B) and OE-OsNAS2A (C) grain; Zn distribution in WT (D) and OE-OsNAS2A (E)grain; Mn distribution in WT (F) and OE-OsNAS2A (G) grain; Cu distribution in WT (H) and OE-OsNAS2A (I) grain. The colour scale represents differentelemental concentrations, with black and white corresponding to the lowest and highest concentrations, respectively.doi:10.1371/journal.pone.0024476.g004
Iron and Zinc Biofortification of Rice Endosperm
PLoS ONE | www.plosone.org 6 September 2011 | Volume 6 | Issue 9 | e24476

may show differential activity in the synthesis of NA, or
overexpression of the OsNAS1 and OsNAS2 coding sequences
may cause significant, as yet unknown, pleiotropic effects on
nutrient transport processes in rice. Studies regarding both of these
possibilities are now underway.
While only a subset of lines were milled to produce polished
grain, results obtained with the two OE-OsNAS2 lines revealed
some of the highest Fe concentrations that have been reported for
rice endosperm. OE-OsNAS2B and OE-OsNAS2J had Fe concen-
trations of 19 and 14 mg g21 DW, respectively, in rice endosperm
(Table 1). These concentrations are 4.2- and 3-fold higher,
respectively, than the Fe concentration observed for WT polished
grain (4.5 mg g21 DW) and represent the first time that rice lines
have been reported with Fe concentrations at or above the
14.5 mg g21 DW threshold recommended for a Fe-biofortified rice
diet [6]. Zn concentrations of the two OE-OsNAS2 lines were also
1.5- to 2.2-fold higher than WT polished grain. The increased Fe
concentrations of polished OE-OsNAS2 grain appear due to not
only higher metal concentration in unpolished grain, but also
reduced losses of Fe during milling of the grain. While Fe
concentrations of WT, OE-OsNAS1 and OE-OsNAS3 polished
grain represented 20% of unpolished grain Fe concentrations, Fe
concentrations of the two OE-OsNAS2 polished grain samples
represented 26–30% of unpolished grain Fe concentration
(Table 1). These results suggest that Fe penetrates further into
endosperm tissues of the OE-OSNAS2 grain relative to WT,
however, more overexpression lines within each of the three
populations require similar characterization to determine whether
this trait is specific to only the OE-OsNAS2 population. The
OE-OsNAS overexpression lines should also be evaluated under
field conditions to determine the stability of the high-Fe trait under
different environments where Fe may be more limiting. Field trials
will also enable agronomic performance of the lines to be
accurately assessed.
Figure 5. Line scans for P, Fe and Zn in WT (A) and OE-OsNAS2A (B) grain. Line scans begin on the outer margin of grain and continue135 mm towards the endosperm; data is displayed as average count (mean 6 SE, n = 23). Counts are plotted on logarithmic scale in the y-axis toaccount for the low P counts (blue) relative to Fe (red) and Zn (green). As the rice grain contains a single aleurone layer that is rich in phosphorus (P,primarily in the form of phytic acid) while endosperm contains little P, 1–50 mm was assigned to the aleurone layer, 51–90 mm to the subaleuronelayer and 91–135 mm to the endosperm.doi:10.1371/journal.pone.0024476.g005
Table 2. Average counts of Fe and Zn in aleurone,subaleurone and endosperm layers of WT and OE-OsNAS2Agrain.
Genotype Aleurone Subaleurone Endosperm
Fe Zn Ratio Fe Zn Ratio Fe Zn Ratio
WT 715 1055 0.68 1252 1779 0.70 935 2236 0.42
OE-OsNAS2A 3194 1460 2.19 5472 3512 1.56 4268 4757 0.90
The Fe:Zn signal ratio is presented for each of the three layers.doi:10.1371/journal.pone.0024476.t002
Iron and Zinc Biofortification of Rice Endosperm
PLoS ONE | www.plosone.org 7 September 2011 | Volume 6 | Issue 9 | e24476

The positive correlations between Fe and Zn concentrations in
both unpolished and polished grain of the three OE-OsNAS
populations provided strong evidence that a common mechanism –
most likely NA – was responsible for transporting these
micronutrient metals into the grain. The LC-MS experiments
with segregating T1 lines confirmed this hypothesis and showed
that NA concentrations in unpolished grain were 6.4- to 11.7-fold
higher in the OsNAS overexpression progeny relative to WT and
null segregant lines. The NA concentration that we calculated
for WT unpolished grain using the LC-MS method – 18 mg g21
DW – is very close to published values of 21.2 mg g21 DW for
unpolished rice grain [28] and gave us confidence that our
analytical technique was accurate and representative of actual
NA concentrations. The fact that null segregant lines did not
differ significantly from WT with respect to unpolished grain
NA concentration, while all of the transgenic progeny had
significantly higher concentrations, provided conclusive evidence
that the OE-OsNAS constructs were responsible for the increases
in NA concentration (Figure 3A). Additionally, these experi-
ments demonstrated that the OE-OsNAS constructs of single-
insert lines were transmitted to progeny lines in typical
Mendelian fashion and stably expressed in progeny. The
statistically significant, positive correlations between NA con-
centration and Fe and Zn concentrations (r = 0.9769 and
0.9288, respectively) demonstrated that increased NA concen-
trations of unpolished grain were not only higher in the OsNAS
transgenic progeny, but also indicative of Fe and Zn
concentration (Figure 3B). NA concentration can therefore be
considered a major regulator of Fe and Zn concentrations in
rice grain, and NA may very well be a limiting factor in the
accumulation of Fe and Zn in WT rice grain.
To further explore the distributions of Fe, Zn and other metal
cations (that are known to chelate with NA) in rice grain, we
employed synchrotron X-ray fluorescence spectroscopy (m-XRF)
to generate detailed elemental maps of WT and OE-OsNAS2
longitudinal grain sections. A single-insert transgenic line from the
OE-OsNAS2 population, OE-OsNAS2A, with high levels of Fe and
Zn (64 and 80 mg g21 DW, respectively) was selected as a
comparison to WT grain. The elemental maps of Fe and Zn in
WT grain (Figure 4B and D) are in agreement with what we know
about the distribution of these two metals in cereal grain – namely
that Zn has a higher concentration and more broad distribution
profile in the grain compared to Fe and, away from the embryo
region, is not limited to outer layers of endosperm and the
aleurone. The abundance of Zn in the central portion of the
embryo, most likely in the plumule, has been observed in similar m-
XRF studies of barley grain [29]. The complete absence of Fe
signal from much of the endosperm, as opposed to Zn which
extends (faintly) throughout the endosperm, demonstrates why
polishing of rice grain causes much greater losses of Fe compared
to Zn and is in line with previous findings [30]. When maps of WT
grain were compared to those of OE-OsNAS2A grain, one of the
most striking differences was in Fe distribution (Figure 4B and C).
Whereas WT had very low signals of Fe in the outer endosperm
and aleurone layer of the grain, OE-OsNAS2A grain had
intermediate to high signals in the same position. Another major
difference between WT and OE-OsNAS2A grain concerned the
overall higher signals for Zn throughout the transgenic grain.
Although the Zn distribution pattern did not appear altered in
OE-OsNAS2A grain, the signal intensity was considerably higher.
The small differences observed in Mn and Cu intensity between
the two grain types were likely due to small (2–3 mg g21 DW)
increases of those elements in the embryo and/or aleurone layer of
OE-OsNAS2A grain.
Line scans allowed us to focus in on the outer region of the
grain, away from the embryo region (the area highlighted, as an
example, in green in Figure 4A), where the large differences for Fe
signal intensity had been observed between WT and OE-OsNAS2A
grain. Of crucial importance to this experiment was the ability to
detect phosphorus (P) as a direct indicator of the aleurone
Figure 6. Line scans for Fe in WT and OE-OsNAS2A grain. Line scans begin on the outer margin of grain and continue 135 mm towards theendosperm; average WT counts indicated by the black line and average OE-OsNAS2 counts indicated by the gray line (mean, n = 23). The location ofthe successively higher Fe peaks in aleurone, subaleurone and endosperm regions of OE-OsNAS2A grain is indicated on the figure.doi:10.1371/journal.pone.0024476.g006
Iron and Zinc Biofortification of Rice Endosperm
PLoS ONE | www.plosone.org 8 September 2011 | Volume 6 | Issue 9 | e24476

layer. The aleurone cells of cereals accumulate high levels of
phosphorus-containing phytic acid (PA), which normally occurs as
a mixed salt of potassium (K), magnesium (Mg), calcium (Ca), Fe
and Zn in the cells [31]. The primary function of PA is to provide
storage of phosphorus and minerals for germinating seeds. The
consequences of PA binding to minerals and micronutrients such
as Fe and Zn, however, are undesirable from a nutritional point of
view. PA is a strong inhibitor of mineral and micronutrient
absorption and is reported to inhibit Fe, Zn, Ca and manganese
(Mn) absorption in humans [32]. It is thought that mineral binding
to PA forms an insoluble complex that precipitates, thereby
rendering the mineral unavailable to human intestinal absorption.
By detecting P in our line scans, we were able to not only
distinguish aleurone cells from starchy endosperm (which has only
trace levels of P), but also accurately determine if Fe and Zn were
localized to a region where they were likely to be bound by PA
(and therefore unlikely to be bioavailable).
The line scans of WT grain showed the highest counts of Fe
towards the aleurone/subaleurone junction, after which Fe counts
began to slowly decline through the subaleurone and endosperm
layers (Figure 5A). Zn counts, on the other hand, steadily increased
through the aleurone, subaleurone and endosperm layers, so that
the highest Zn counts were detected in the endosperm. Because Zn
count was higher than Fe for most of the scan, the Fe:Zn signal
ratio in all three layers was ,1 (Table 2). The line scan of WT
grain provides novel insights into the distribution of Fe in the outer
layers of rice grain. While significant quantities of Fe and Zn are
localized in the aleurone cells, and therefore likely bound to PA,
the subaleurone and endosperm contain substantial quantities of
Fe and Zn that are likely to be bioavailable; particularly in the
endosperm region where only trace P was detected. What
molecule(s) the micronutrient metals are chelated to in this region
remains unknown.
The line scans of OE-OsNAS2A grain revealed a radically
different distribution and quantity of Fe and Zn in all three layers
(Figure 5B). A major difference was apparent in the relative
amounts of Fe and Zn, with more Fe than Zn counts detected in
most of the scanned region. This is essentially the reverse of what
was seen in WT grain, and is reflected in Fe:Zn signal ratios of .1
for aleurone and subaleurone cells, and close to 1 in the
endosperm, for OE-OsNAS2A grain (Table 2). Furthermore, the
Fe count did not tail off after a peak in the subaleurone layer,
rather, it continued to peak at progressively higher levels in the
subaleurone and endosperm layers. In fact, the highest count of Fe
in OE-OsNAS2A grain (6958 at 101 mm) occurred in a region of
endosperm where only trace counts of P (21) were detected,
thereby indicating that most of the Fe could not be complexed
with PA and may be readily bioavailable. To better visualize the
distribution of Fe in OE-OsNAS2A grain, and how it differs from
that of WT, the Fe counts for both grain types were plotted on
linear scale in Figure 6. Increased Fe concentrations in the
aleurone, subaleurone and endosperm layers of OE-OsNAS2A
grain, relative to WT, are readily apparent in this chart and,
furthermore, the enrichment of Fe in the endosperm layer of
transgenic grain is clear. The Zn counts in OE-OsNAS2A grain
were also significantly higher than those of WT grain, but followed
a similar trend to that of WT by gradually increasing towards the
endosperm.
It is tempting to speculate that the increased concentrations of
Fe and Zn in aleurone, subaleurone and endosperm layers of
OE-OsNAS2A grain are present as complexes with NA. NA is
known to have high binding affinities for Fe and Zn at alkaline pH,
while the Fe2+NA complex in particular demonstrates unusually
high kinetic stability that does not show autoxidation at
physiological pH ranges [11]. Preferential binding of NA to Fe2+
as it is transported to the grain through phloem tissues, and high
stability of the Fe2+NA complex within the grain, could explain
why the trend of Zn.Fe counts in WT grain is reversed in
OE-OsNAS2A grain. The hypothesis that Fe and Zn are bound to
NA is bolstered by recent analyses of grain from previously
mentioned OsNAS3 activation tagged line of rice which contains
nine-fold more NA in the grain [21]. Whereas WT and the
OsNAS3 activation tagged grain did not differ with regards to the
amount of PA-bound Fe, the OsNAS3 activation tagged grain had
seven-fold more Fe bound to a low molecular weight mass
compound that is likely to be NA. A similar result was found in
grain of the OsNAS2 activation tagged line with regards to Zn [22].
We are currently using X-ray Absorption Near Edge Structure
(XANES) to identify compounds that bind to Fe and Zn in the
endosperm of WT and OE-OsNAS2A grain. XANES should also
yield speciation information for Fe (Fe2+ vs. Fe3+), and we expect the
OE-OsNAS2A grain to have more Fe2+ relative to Fe3+ due to
preferential chelation of Fe2+ by NA under aerobic conditions [11].
More than 2 billion people are currently afflicted by iron
deficiency, a serious nutritional problem that has been exacerbated
by high dependences on nutrient poor cereal crops in many
developing countries of the world. Billions also suffer from equally
devastating micronutrient disorders such as Zn and Vitamin A
deficiency. Worryingly, micronutrient malnutrition problems may
become even more prevalent as the Earth’s atmospheric
concentration of carbon dioxide (CO2) continues to rise. Many
studies have shown that carbon enrichment, while increasing
productivity of many crops, also causes significant decreases in the
concentration of key micronutrients such as Fe and Zn [33]. In
light of these results it is imperative that conventional breeding and
biotechnology are exploited to the fullest extent to increase
nutritional composition of the world’s major food staples. Using
constitutive overexpression of single members of the OsNAS gene
family, we have produced biofortified rice lines that contain
significantly enhanced Fe and Zn concentrations in polished grain.
The use of rice genes to increase the micronutrient concentration
of rice shows that cisgenic plants could be developed using similar
technology [34]. Most importantly, the Fe concentrations detected
in particular OsNAS2 overexpressing lines meet or surpass the
target concentration for Fe biofortification of rice endosperm. The
enhanced Fe concentrations are preferentially located in areas of
the rice grain where they are unlikely to be bound by phytic acid
and therefore likely to be bioavailable in human diets.
Materials and Methods
Plant growth conditionsOryza sativa ssp. japonica cv. Nipponbare was used for all
experiments. Seeds were germinated on moist filter paper for one
week before transfer to 15 cm (1 L capacity) containers of
University of California (UC) potting mix in a glasshouse or
growth room maintained at 28uC day, 24uC night, 12 h light/
dark. The UC potting mix was prepared by mixing 1,200 litres of
sterlised sand with 750 litres of peatmoss with the addition of
calcium hydroxide (hydrated lime, 1 kg), calcium carbonate
(agricultural lime, 1.8 kg) NPK fertilizer and 4 kg Osmocote per
1000 kg soil. Transgenic plantlets were grown under the same
conditions. Grain harvested from plants was dried for 3 d at 37uCand then used for elemental, NA and m-XRF studies.
Vector construction and rice transformationRNA was extracted from 2-week old seedlings of japonica rice
cultivar Nipponbare and used for cDNA synthesis. The OsNAS1
Iron and Zinc Biofortification of Rice Endosperm
PLoS ONE | www.plosone.org 9 September 2011 | Volume 6 | Issue 9 | e24476

coding sequence was PCR amplified from cDNA with forward
primer 59 – ATGGAGGCTCAGAACCAAGAGGTCG – 39and
reverse primer 59 – GTTAGACGGACAGCTCCTTGTTGGC –
39 to yield a 1000 bp fragment containing the OsNAS1 cDNA; the
OsNAS2 coding sequence was PCR amplified with forward primer
59-ATGGAGGCTCAGAACCAAGAGGTCG – 39 and reverse
primer 59 – ATGCACGCACTCAGACGGATAGCCT – 39to yield
a 991 bp fragment containing the OsNAS2 cDNA; and the
OsNAS3 coding sequence was PCR amplified with forward primer
59 – ATGACGGTGGAAGTGGAGGCGGTGA – 39 and reverse
primer 59 – GGTGAGGTAGCAAGCGATGGAAGCA – 39 to
yield a 1072 bp fragment containing the OsNAS3 cDNA. The three
PCR fragments were cloned, separately, into the Invitrogen
GatewayH Entry vector pCR8H/GW/TOPOH. Error free sequences
were then recombined into a modified pMDC100 vector [23] that
placed the OsNAS coding sequences under the control of a dual
CaMV 35S promoter (Figure 1). Embryogenic nodular units arising
from scutellum-derived callus were inoculated with supervirulent
Agrobacterium tumefaciens strain AGL1 (carrying the OsNAS overexpres-
sion vectors) and 200 l21 geneticin-resistant shoots were regenerated
after nine weeks using established protocols [35]. Rooted T0 plantlets
were transferred to the growth room in Jiffy peat pots, and moved to
soil after 15 days.
Elemental analyses of rice grainSamples consisting of approximately 25 unpolished grain, or 35
polished grain, were analyzed by ICP-OES to determine metal
concentrations. Polished grain was produced using a modified
non-contaminating Kett Mill with a milling time of 2 min 30 sec,
as preliminary studies with KOH staining had shown this time
period to be sufficient for removal of the bran layer.
Liquid chromatography-mass spectrometry (LC-MS)The LC-MS method is based on published methods [36]. Four
individual rice grains were obtained from each line, 20 mg of
ground rice from each grain was weighed into separate Eppendorf
tubes and 200 mL of EDTA solution (5 mM), containing the
internal standard 2-aminobutyric acid (25 mM), was added. The
EDTA was used to release any metal complexed with NA. The
derivatization of nicotianamine involved mixing of 10 mL
supernatant with 70 mL borate buffer (0.2 M; pH 8.8), followed
by the addition of 10 mL of AQC solution (10 mM) in dry
acetonitrile. The reaction mixture was then heated at 55uC for
10 min and analyzed by LC-MS. Chromatograms and mass
spectra were evaluated using the MassHunter Quantitative
analysis program (Agilent). Quantification was based on the
external calibration curve method using the internal standard for
error correction. A 1 mg/mL stock nicotianamine standard was
prepared and subsequently diluted with the EDTA solution
(5 mM) to prepare calibration standards in the concentration
range between 2.75 – 100 mM.
Synchrotron X-ray fluorescence spectroscopy (m-XRF)Thin longitudinal sections of rice grain were obtained using
published methods [30]. Briefly, grains were glued to a plastic
support and then sliced using a vibrating blade microtome in order
to obtain a flat surface (Leica VT1000 S). A piece of Kapton
polyimide film was then pressed on the surface of the sample with
the blade of the microtome cutting underneath. In this way,
longitudinal sections, 70 mm thick, were directly placed on Kapton
tape without the need for embedding. Two longitudinal sections
each of WT and OE-OsNAS2A grain were analyzed. m-XRF
elemental maps were collected at the X-ray Fluorescence
Microscopy (XFM) beamline at the Australian Synchrotron.
Whole grain elemental maps were collected at 7.5 keV using a
96-element prototype Maia detector [37]. The detector was placed
perpendicular to the beam path at a distance of 20 mm and was
used to collect the full spectra fluorescence signal from the sample.
The samples were analysed continuously in the horizontal
direction with steps of 1.25 mm in the vertical direction. The
sample stage was set to a speed of 2 mm s21, resulting in a pixel
transit time of roughly 0.6 ms. The full XRF spectra were
analysed using GeoPIXE [38,39].
In order to map P distribution together with the distribution of
the micronutrients of interest, a Vortex detector was employed as
the Maia detector is unable to analyse elements lighter than K.
Rectangular areas of 406135 mm were mapped at the margin of
grains with a dwell time for pixel of 1 sec. The line scans were
obtained by laterally averaging the rectangular areas scanned
(represented by a green box in Figure 4A).
Supporting Information
Table S1 Average concentrations of Fe, Zn, Mn, Cu andNi in unpolished grain of WT and transgenic lines. Grain
samples of 3 WT, 30 OE-OsNAS1, 39 OE-OsNAS2 and 24
OE-OsNAS3 lines were analyzed by ICP-OES. Average values for
each group of plants are presented as means 6 standard error
(S.E.) of the mean.
(DOC)
Acknowledgments
The synchrotron X-ray fluorescence microscopy work was undertaken on
the X-ray fluorescence microscopy beamline at the Australian Synchro-
tron, Victoria, Australia. The authors thank David Paterson, Martin de
Jonge and Daryl Howard for their help at the beamline. Micronutrient
analyses of rice grain were performed at Waite Analytical Services,
University of Adelaide, Australia.
Author Contributions
Conceived and designed the experiments: AATJ JS EL MT. Performed the
experiments: AATJ BK DLC LC EL. Analyzed the data: AATJ DLC EL.
Contributed reagents/materials/analysis tools: AATJ JS MT. Wrote the
paper: AATJ.
References
1. Khush G (2005) What it will take to feed 5.0 billion rice consumers in 2030.Plant Mol Biol 59: 1–6.
2. Mayer JE, Pfeiffer WH, Beyer P (2008) Biofortified crops to alleviate
micronutrient malnutrition. Curr Opin Plant Biol 11: 166–170.
3. Ramakrishnan U (2002) Prevalence of micronutrient malnutrition worldwide.
Nutrition Rev 60: S46–S52.
4. Kennedy G, Burlingame B (2003) Analysis of food composition data on rice from
a plant genetic resources perspective. Food Chemistry 80: 589–596.
5. Pfeiffer WH, McClafferty B (2008) Biofortification: breeding micronutrient-dense crops. Breeding Major Food Staples: Blackwell Publishing Ltd. 61–91.
6. Hotz C, McClafferty B (2007) From harvest to health: challenges for developing
biofortified staple foods and determining their impact on micronutrient status.
Food Nutr Bull 28: S271–279.
7. Lucca P, Hurrell R, Potrykus I (2002) Fighting iron deficiency anemia with iron-
rich rice. J Am Coll Nutr 21: 184S–190.
8. Goto F, Yoshihara T, Shigemoto N, Toki S, Takaiwa F (1999) Iron fortification
of rice seed by the soybean ferritin gene. Nat Biotech 17: 282–296.
9. Qu LQ, Yoshihara T, Ooyama A, Goto F, Takaiwa F (2005) Iron accumulationdoes not parallel the high expression level of ferritin in transgenic rice seeds.
Planta 222: 225–233.
10. Takahashi M, Terada Y, Nakai I, Nakanishi H, Yoshimura E, et al. (2003) Roleof nicotianamine in the intracellular delivery of metals and plant reproductive
development. Plant Cell 15: 1263–1280.
11. von Wiren N, Klair S, Bansal S, Briat J-F, Khodr H, et al. (1999) Nicotianamine
chelates both FeIII and FeII. Implications for metal transport in plants. Plant
Physiol 119: 1107–1114.
Iron and Zinc Biofortification of Rice Endosperm
PLoS ONE | www.plosone.org 10 September 2011 | Volume 6 | Issue 9 | e24476
12. Higuchi K, Suzuki K, Nakanishi H, Yamaguchi H, Nishizawa N-K, et al. (1999)
Cloning of nicotianamine synthase genes, novel genes involved in thebiosynthesis of phytosiderophores. Plant Physiol 119: 471–480.
13. Inoue H, Higuchi K, Takahashi M, Nakanishi H, Mori S, et al. (2003) Three
rice nicotianamine synthase genes, OsNAS1, OsNAS2, and OsNAS3 areexpressed in cells involved in long-distance transport of iron and differentially
regulated by iron. Plant J 36: 366–381.14. Klatte M, Schuler M, Wirtz M, Fink-Straube C, Hell R, et al. (2009) The
analysis of Arabidopsis nicotianamine synthase mutants reveals functions for
nicotianamine in seed iron loading and iron deficiency responses. Plant Physiol150: 257–271.
15. Mizuno D, Higuchi K, Sakamoto T, Nakanishi H, Mori S, et al. (2003) Threenicotianamine synthase genes isolated from maize are differentially regulated by
iron nutritional status. Plant Physiol 132: 1989–1997.16. Usuda K, Wada Y, Ishimaru Y, Kobayashi T, Takahashi M, et al. (2008)
Genetically engineered rice containing larger amounts of nicotianamine to
enhance the antihypertensive effect. Plant Biotechnol J 7: 87–95.17. Kim S, Takahashi M, Higuchi K, Tsunoda K, Nakanishi H, et al. (2005)
Increased nicotianamine biosynthesis confers enhanced tolerance of high levelsof metals, in particular nickel, to plants. Plant Cell Physiol 46: 1809–1818.
18. Masuda H, Usuda K, Kobayashi T, Ishimaru Y, Kakei Y, et al. (2009)
Overexpression of the barley nicotianamine synthase gene HvNAS1 increasesiron and zinc concentrations in rice grains Rice 2: 155–166.
19. Wirth J, Poletti S, Aeschlimann B, Yakandawala N, Drosse B, et al. (2009) Riceendosperm iron biofortification by targeted and synergistic action of nicotiana-
mine synthase and ferritin. Plant Biotechnol J 7: 631–644.20. Zheng L, Cheng Z, Ai C, Jiang X, Bei X, et al. (2010) Nicotianamine, a novel
enhancer of rice iron bioavailability to humans. PLoS ONE 5: e10190.
21. Lee S, Jeon US, Lee SJ, Kim Y-K, Persson DP, et al. (2009) Iron fortification ofrice seeds through activation of the nicotianamine synthase gene. P Natl Acad
Sci USA 106: 22014–22019.22. Lee S, Persson DP, Hansen TH, Husted S, Schjoerring JK, et al. (2011)
Bio-available zinc in rice seeds is increased by activation tagging of
nicotianamine synthase. Plant Biotechol J 9: 1–9.23. Curtis MD, Grossniklaus U (2003) A gateway cloning vector set for high-
throughput functional analysis of genes in planta. Plant Physiol 133: 462–469.24. Benes I, Schreiber K, Ripperger H, Kircheiss A (1983) Metal complex formation
by nicotianamine, a possible phytosiderophore. Experientia 39: 261–262.25. Liu JC, Ockenden I, Truax M, Lott JNA (2004) Phytic acid-phosphorus and
other nutritionally important mineral nutrient elements in grains of wild-type
and low phytic acid (lpa1-1) rice. Seed Sci Res 14: 109–116.
26. Ogawa M, Tanaka K, Kasai Z (1979) Accumulation of phosphorus, magnesium
and potassium in developing rice grains: followed by electron microprobe X-ray
analysis focusing on the aleurone layer. Plant Cell Physiol 20: 19–27.
27. Luh BS (1991) Rice volume II: production and utilization, 2nd edition. New
York, New York: Van Nostrand Reinhold. 413 p.
28. Wada Y, Yamaguchi I, Takahashi M, Nakanishi H, Mori S, et al. (2007) Highly
sensitive quantitative analysis of nicotianamine using LC/ESI-TOF-MS with an
internal standard. Biosci Biotechnol Biochem 71: 435–441.
29. Lombi E, Smith E, Hansen TH, Paterson D, de Jonge MD, et al. (2011)
Megapixel imaging of (micro)nutrients in mature barley grains. Journal of Exp
Bot 62: 273–282.
30. Lombi E, Scheckel KG, Pallon J, Carey AM, Zhu YG, et al. (2009) Speciation
and distribution of arsenic and localization of nutrients in rice grains. New
Phytologist 184: 193–201.
31. Liang J, Li Z, Tsuji K, Nakano K, Nout MJR, et al. (2008) Milling
characteristics and distribution of phytic acid and zinc in long-, medium- and
short-grain rice. J Cereal Sci 48: 83–91.
32. Hurrell RF (2003) Influence of vegetable protein sources on trace element and
mineral bioavailability. J Nutr 133: 2973S–2977S.
33. Loladze I (2002) Rising atmospheric CO2 and human nutrition: toward globally
imbalanced plant stoichiometry? Trends Ecol Evol 17: 457–461.
34. Schouten HJ, Krens FA, Jacobsen E (2006) Cisgenic plants are similar to
traditionally bred plants. EMBO Rep 7: 750–753.
35. Sallaud C, Meynard D, van Boxtel J, Gay C, Bes M, et al. (2003) Highly efficient
production and characterization of T-DNA plants for rice (Oryza sativa L.)
functional genomics. Theor Appl Genet 106: 1396–1408.
36. Callahan DL, Kolev SD, O’Hair RAJ, Salt DE, Baker AJM (2007) Relationships
of nicotianamine and other amino acids with nickel, zinc and iron in Thlaspi
hyperaccumulators. New Phytol 176: 836–848.
37. Kirkham R, Dunn PA, Kuczewski AJ, Siddons DP, Dodanwela R, et al. (2010)
The Maia Spectroscopy Detector System: Engineering for Integrated Pulse
Capture, Low-Latency Scanning and Real-Time Processing. AIP Conference
Proceedings 1234: 240–243.
38. Ryan CG (2000) Quantitative trace element imaging using PIXE and the
nuclear microprobe. International Journal of Imaging Systems and Technology
11: 219–230.
39. Ryan CG, Jamieson DN (1993) Dynamic analysis: on-line quantitative PIXE
microanalysis and its use in overlap-resolved elemental mapping. Nuclear
Instruments and Methods in Physics Research Section B: Beam Interactions
with Materials and Atoms 77: 203–214.
Iron and Zinc Biofortification of Rice Endosperm
PLoS ONE | www.plosone.org 11 September 2011 | Volume 6 | Issue 9 | e24476