constraint-induced movement therapy for rehabilitation … · constraint-induced movement therapy...
TRANSCRIPT
Ontario Health Technology Assessment Series; Vol. 11: No. 6, pp. 1–58, November 2011
Constraint-Induced Movement Therapy
for Rehabilitation of Arm Dysfunction
After Stroke in Adults: An Evidence-
Based Analysis
Medical Advisory Secretariat, Health Quality Ontario
November 2011
Ontario Health Technology Assessment Series; Vol. 11: No. 6, pp. 1–58, November 2011 2
Suggested Citation
This report should be cited as follows:
Medical Advisory Secretariat, Health Quality Ontario. Constraint-induced movement therapy for rehabilitation of
arm dysfunction after stroke in adults: an evidence-based analysis. Ont Health Technol Assess Ser [Internet].
2011 November;11(6):1-58. Available from:
www.hqontario.ca/en/mas/tech/pdfs/2011/rev_CIMT_November.pdf
Indexing
The Ontario Health Technology Assessment Series is currently indexed in Exerpta Medica/EMBASE and the Center for
Reviews and Dissemination database.
Permission Requests
All inquiries regarding permission to reproduce any content in the Ontario Health Technology Assessment Series should be
directed to [email protected].
How to Obtain Issues in the Ontario Health Technology Assessment Series
All reports in the Ontario Health Technology Assessment Series are freely available in PDF format at the following URL:
www.health.gov.on.ca/ohtas.
Print copies can be obtained by contacting [email protected].
Conflict of Interest Statement
All analyses in the Ontario Health Technology Assessment Series are impartial and subject to a systematic evidence-based
assessment process. There are no competing interests or conflicts of interest to declare.
Peer Review
All Medical Advisory Secretariat analyses are subject to external expert peer review. Additionally, the public consultation
process is also available to individuals wishing to comment on an analysis prior to finalization. For more information, please
visit http://www.health.gov.on.ca/english/providers/program/ohtac/public_engage_overview.html.
Enquiries from the public:
The Medical Advisory Secretariat
Health Quality Ontario
20 Dundas Street West, 10th floor
Toronto, Ontario
CANADA
M5G 2C2
Tel: 416 323-6868, ext. 261
Toll-free 1-866-623-6868
Email: [email protected]
Media Enquiries:
416-323-6868, ext. 288
Ontario Health Technology Assessment Series; Vol. 11: No. 6, pp. 1–58, November 2011 3
ISSN 1915-7398 (Online)
ISBN 978-1-4435-7133-3 (PDF)
About the Medical Advisory Secretariat
Effective April 5, 2011, the Medical Advisory Secretariat (MAS) became a part of Health Quality Ontario (HQO), an
independent body funded by the Ministry of Health and Long-Term Care. The mandate of the Medical Advisory Secretariat
is to provide evidence-based recommendations on the coordinated uptake of health services and health technologies in
Ontario to the Ministry of Health and Long-Term Care and to the health care system. This mandate helps to ensure that
residents of Ontario have access to the best available and most appropriate health services and technologies to improve
patient outcomes.
To fulfill its mandate, the Medical Advisory Secretariat conducts systematic reviews of evidence and consults with experts in
the health care services community. The resulting evidence-based analyses are reviewed by the Ontario Health Technology
Advisory Committee—to which MAS also provides a secretariat function—and published in the Ontario Health Technology
Assessment Series.
About the Ontario Health Technology Assessment Series
To conduct its comprehensive analyses, the Medical Advisory Secretariat systematically reviews the available scientific
literature, making every effort to consider all relevant national and international research; collaborates with partners across
relevant government branches; consults with clinical and other external experts and developers of new health technologies;
and solicits any necessary supplemental information.
In addition, the Secretariat collects and analyzes information about how a new technology fits within current practice and
existing treatment alternatives. Details about the technology’s diffusion into current health care practices add an important
dimension to the review of the provision and delivery of the health technology in Ontario. Information concerning the health
benefits; economic and human resources; and ethical, regulatory, social and legal issues relating to the technology assist
decision-makers in making timely and relevant decisions to optimize patient outcomes.
The public consultation process is available to individuals wishing to comment on an analysis prior to publication. For more
information, please visit http://www.health.gov.on.ca/english/providers/program/ohtac/public_engage_overview.html.
Disclaimer
This evidence-based analysis was prepared by the Medical Advisory Secretariat for the Ontario Health Technology Advisory
Committee and developed from analysis, interpretation, and comparison of scientific research and/or technology assessments
conducted by other organizations. It also incorporates, when available, Ontario data and information provided by experts and
applicants to the Medical Advisory Secretariat to inform the analysis. While every effort has been made to reflect all
scientific research available, this document may not fully do so. Additionally, other relevant scientific findings may have
been reported since completion of the review. This evidence-based analysis is current to the date of the literature review
specified in the methods section. This analysis may be superseded by an updated publication on the same topic. Please check
the Medical Advisory Secretariat website for a list of all evidence-based analyses: http://www.health.gov.on.ca/ohtas.
Ontario Health Technology Assessment Series; Vol. 11: No. 6, pp. 1–58, November 2011 4
Table of Contents
LIST OF ABBREVIATIONS _______________________________________________________________________ 6
EXECUTIVE SUMMARY ________________________________________________________________________ 7
Objective ................................................................................................................................................................... 7
Clinical Need: Condition and Target Population....................................................................................................... 7
Constraint-Induced Movement Therapy .................................................................................................................... 7
Research Question ..................................................................................................................................................... 7
Research Methods ..................................................................................................................................................... 7 Literature Search ................................................................................................................................................... 7
Search Strategy ................................................................................................................................................. 7 Exclusion Criteria ............................................................................................................................................ 8 Outcomes of Interest ......................................................................................................................................... 8
Summary of Findings ................................................................................................................................................ 8
BACKGROUND ______________________________________________________________________________ 10
Objective of Analysis .............................................................................................................................................. 10
Clinical Need and Target Population ...................................................................................................................... 10 Description of Problem ....................................................................................................................................... 10 Ontario Prevalence and Incidence ....................................................................................................................... 10 Rehabilitation ...................................................................................................................................................... 10 Discharge Destination after Hospitalization ....................................................................................................... 11
Constraint-Induced Movement Therapy .................................................................................................................. 11
EVIDENCE-BASED ANALYSIS ___________________________________________________________________ 12
Research Question ................................................................................................................................................... 12
Research Methods ................................................................................................................................................... 12 Literature Search ................................................................................................................................................. 12
Search Strategy ............................................................................................................................................... 12 Inclusion Criteria ................................................................................................................................................ 12 Exclusion Criteria ............................................................................................................................................... 12 Outcomes of Interest ........................................................................................................................................... 13
Primary Outcome ........................................................................................................................................... 13 Secondary Outcome ........................................................................................................................................ 13
Description of Outcome Measures: ..................................................................................................................... 13 Action Research Arm Test (ARAT) ................................................................................................................. 13 Chedoke Arm and Hand Inventory (CAHI) .................................................................................................... 13 Fugl-Meyer Motor Assessment (FMA) ........................................................................................................... 13 Functional Independence Measure (FIM) ...................................................................................................... 13 Motor Activity Log (MAL) .............................................................................................................................. 13 Stroke Impact Scale (SIS) ............................................................................................................................... 14
Statistical Analysis .............................................................................................................................................. 14
Quality of Evidence ................................................................................................................................................. 14
Results of Evidence-Based Analysis ....................................................................................................................... 15
Characteristics of Included Studies ......................................................................................................................... 16 Systematic Reviews ............................................................................................................................................ 16 Randomized Controlled Trials ............................................................................................................................ 19
SUMMARY OF EXISTING EVIDENCE _____________________________________________________________ 24
Primary Outcome .................................................................................................................................................... 24 Arm Motor Function ........................................................................................................................................... 24
Secondary Outcomes ............................................................................................................................................... 24
Ontario Health Technology Assessment Series; Vol. 11: No. 6, pp. 1–58, November 2011 5
Arm Motor Impairment....................................................................................................................................... 24 Subgroup Analyses ......................................................................................................................................... 25
Activities of Daily Living ................................................................................................................................... 26 Perceived Arm Motor Function (Amount of Use) .............................................................................................. 26
Subgroup Analyses ......................................................................................................................................... 27 Perceived Arm Motor Function (Quality of Use) ............................................................................................... 28
Subgroup Analyses ......................................................................................................................................... 29 Quality of Life .................................................................................................................................................... 30
Summary of Findings .............................................................................................................................................. 31
EXISTING GUIDELINES FOR CIMT ______________________________________________________________ 32
Canadian Best Practice Recommendations for Stroke Care Update 2010............................................................... 32
ECONOMIC ANALYSIS ________________________________________________________________________ 33
Study Question ........................................................................................................................................................ 33
Economic Literature Review ................................................................................................................................... 33
Ontario-Based Cost Impact Analysis ...................................................................................................................... 33 Additional costs of inpatient CIMT stroke rehabilitation for arm dysfunction ................................................... 34 Total estimated costs of inpatient CIMT stroke rehabilitation for arm dysfunction ........................................... 34
APPENDICES ________________________________________________________________________________ 36
Appendix 1: Literature Search Strategies ................................................................................................................ 36 Clinical Data Search ........................................................................................................................................... 36
Economics Data Search ........................................................................................................................................... 38
Appendix 2: Characteristics of Included Studies .................................................................................................... 41
Appendix 3: GRADE Profile .................................................................................................................................. 47
Appendix 4: Arm Motor Impairment Subgroup Analyses ...................................................................................... 48
Appendix 5: Perceived Arm Motor Function Amount of Use Subgroup Analyses ................................................. 50
Appendix 6: Perceived Arm Motor Function Quality of Use Subgroup Analyses .................................................. 53
REFERENCES _______________________________________________________________________________ 56
Ontario Health Technology Assessment Series; Vol. 11: No. 6, pp. 1–58, November 2011 6
List of Abbreviations
ADL Activities of Daily Living
ARAT
AOU
BI
Action Research Arm Test
Amount of Use
Barthel Index
CI Confidence interval(s)
CIMT Constraint-Induced Movement Therapy
FIM Functional Independence Measure
FMA Fugl-Meyer Motor Assessment
FU
IADL
ICER
Forced Use Therapy
Instrumental Activities of Daily Living
Incremental Cost-Effectiveness Ratio
MAL Motor Activity Log
mCIMT Modified Constraint-Induced Movement Therapy
MD
n
Mean Difference
Sample Size
OR Odds ratio
OHTAC
QALY
QOM
Ontario Health Technology Advisory Committee
Quality Adjusted Life Years
Quality of Movement
RCT Randomized controlled trial
RR Relative risk
RTT Repetitive Task Training
SD Standard deviation
SIS
TIA
WMFT
Stroke Impact Scale
Transient Ischemic Attack
Wolf Motor Function Test
Ontario Health Technology Assessment Series; Vol. 11: No. 6, pp. 1–58, November 2011 7
Executive Summary
Objective
The purpose of this evidence-based analysis is to determine the effectiveness and cost of CIMT for persons with
arm dysfunction after a stroke.
Clinical Need: Condition and Target Population
A stroke is a sudden loss of brain function caused by the interruption of blood flow to the brain (ischemic stroke)
or the rupture of blood vessels in the brain (hemorrhagic stroke). A stroke can affect any number of areas
including the ability to move, see, remember, speak, reason, and read and write. Stroke is the leading cause of
adult neurological disability in Canada; 300,000 people or 1% of the population live with its effects. Up to 85%
of persons experiencing a complete stroke have residual arm dysfunction which will interfere with their ability to
live independently. Rehabilitation interventions are the cornerstone of care and recovery after a stroke.
Constraint-Induced Movement Therapy
Constraint-Induced Movement (CIMT) is a behavioural approach to neurorehabilitation based on the principle of
‘learned non-use’. The term is derived from studies in nonhuman primates in which somatosensory
deafferentation of a single forelimb was performed and after which the animal then failed to use that limb. This
failure to use the limb was deemed ‘learned non-use’. The major components of CIMT include: i) intense
repetitive task-oriented training of the impaired limb ii) immobilization of the unimpaired arm, and iii) shaping.
With regard to the first component, persons may train the affected arm for several hours a day for up to 10-15
consecutive days. With immobilization, the unaffected arm may be restrained for up to 90% of waking hours.
And finally, with shaping, the difficulty of the training tasks is progressively increased as performance improves
and encouraging feedback is provided immediately when small gains are achieved.
Research Question
What is the effectiveness and cost of CIMT compared with physiotherapy and/or occupational therapy
rehabilitative care for the treatment of arm dysfunction after stroke in persons 18 years of age and older?
Research Methods
Literature Search
Search Strategy
A literature search was performed on January 21, 2011 using OVID MEDLINE, MEDLINE In-Process and Other
Non-Indexed Citations, OVID EMBASE, the Cumulative Index to Nursing and Allied Health Literature
(CINAHL), and the Cochrane Library, Centre for Reviews and Dissemination. (Appendix 1) A preliminary
search completed in August 2010 found a Cochrane Systematic review published in 2009. As a result, the
literature search for this evidence-based analysis was designed to include studies published from January 1, 2008
to January 21, 2011.
Ontario Health Technology Assessment Series; Vol. 11: No. 6, pp. 1–58, November 2011 8
Inclusion Criteria
Systematic reviews of randomized controlled trials with or without meta-analysis.
Study participants 18 years of age and older with arm dysfunction after stroke.
Studies comparing the use of CIMT with occupational therapy and/or physiotherapy rehabilitative care (usual
care) to improve arm function.
Studies which described CIMT as having the following three components: i) restraining unimpaired arm
and/or wrist with a sling, hand splint or cast; ii) intensive training with functional task practice of the affected
arm; iii) application of shaping methodology during training. No restriction was placed on intensity or
duration of treatment otherwise.
Duration and intensity of therapy is equal in treatment and control groups.
Therapy beginning a minimum of one month after stroke.
Published between 2008 and 2011.
Exclusion Criteria
Narrative reviews, case series, case reports, controlled clinical trials.
Letters to the editor
Grey literature.
Non-English language publications.
Outcomes of Interest Primary Outcome
Arm motor function: Action Research Arm Test (ARAT)
Secondary Outcome
Arm motor impairment: Fugl-Meyer Motor Assessment (FMA)
Activities of daily living (ADL): Functional Independence Measure (FIM), Chedoke Arm and Hand Inventory
Perceived motor function: Motor Activity Log (MAL) Amount of Use (AOU) and Quality of Movement
(QOM) scales
Quality of Life: Stroke Impact Scale (SIS)
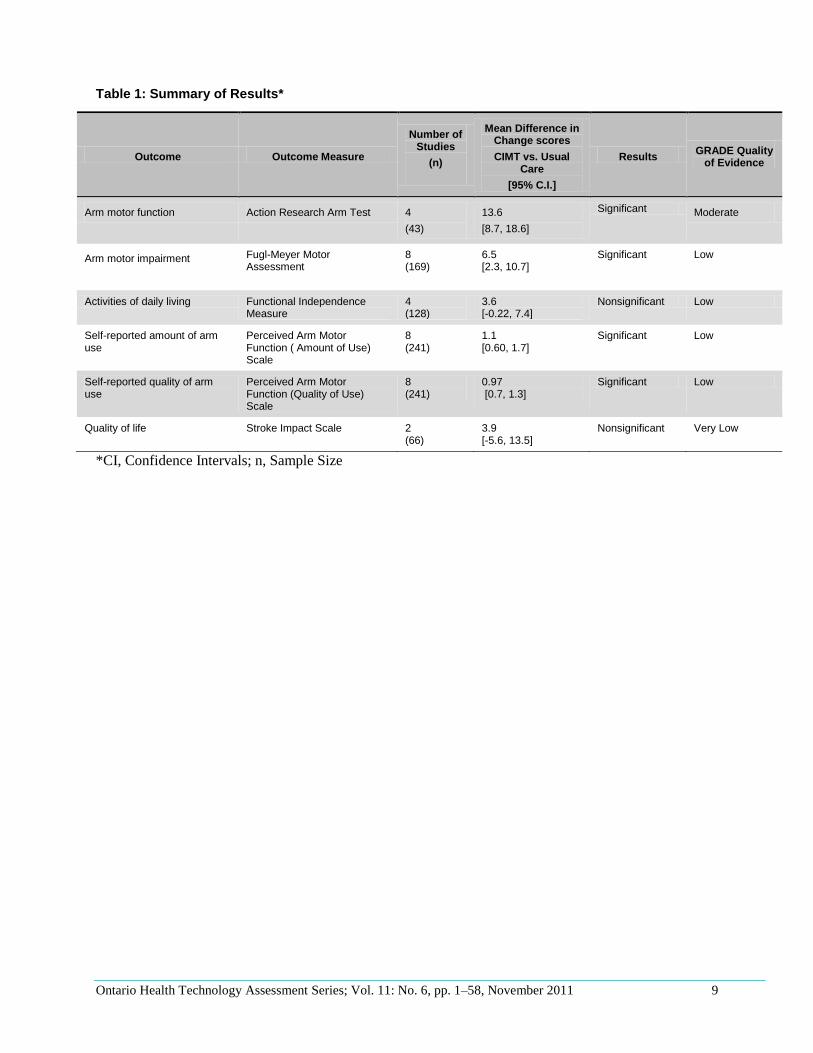
Summary of Findings
A significant difference was found in our primary outcome of arm motor function measured with the Action
Research Arm Test in favour of CIMT compared with usual care delivered with the same intensity and duration.
Significant differences were also found in three of the five secondary outcome measures including Arm Motor
Impairment and Perceived Motor Function Amount of Use and Quality of Use. There was a nonsignificant effect
found with the FIM score and the quality of life Stroke Impact Scale outcome measure. The nonsignificant effect
found with the scale score and the quality of life score may be a factor of a nonresponsive outcome measure (FIM
scale) and/or a type II statistical error from an inadequate sample size. The quality of evidence was moderate for
arm motor function and low for all other outcome measures except quality of life, which was very low.
Ontario Health Technology Assessment Series; Vol. 11: No. 6, pp. 1–58, November 2011 9
Table 1: Summary of Results*
Outcome Outcome Measure
Number of Studies
(n)
Mean Difference in Change scores
CIMT vs. Usual Care
[95% C.I.]
Results GRADE Quality
of Evidence
Arm motor function Action Research Arm Test 4
(43)
13.6
[8.7, 18.6]
Significant Moderate
Arm motor impairment Fugl-Meyer Motor Assessment
8 (169)
6.5 [2.3, 10.7]
Significant Low
Activities of daily living Functional Independence Measure
4 (128)
3.6 [-0.22, 7.4]
Nonsignificant Low
Self-reported amount of arm use
Perceived Arm Motor Function ( Amount of Use) Scale
8 (241)
1.1 [0.60, 1.7]
Significant Low
Self-reported quality of arm use
Perceived Arm Motor Function (Quality of Use) Scale
8 (241)
0.97 [0.7, 1.3]
Significant Low
Quality of life Stroke Impact Scale 2 (66)
3.9 [-5.6, 13.5]
Nonsignificant Very Low
*CI, Confidence Intervals; n, Sample Size
Ontario Health Technology Assessment Series; Vol. 11: No. 6, pp. 1–58, November 2011 10
Background
Objective of Analysis
The purpose of this evidence-based analysis is to determine the effectiveness and cost of Constraint-Induced
Movement Therapy (CIMT) for persons with arm dysfunction after a stroke.
Clinical Need and Target Population
Description of Problem
A stroke is a sudden loss of brain function caused by the interruption of blood flow to the brain (ischemic stroke)
or the rupture of blood vessels in the brain (hemorrhagic stroke). A stroke can affect any number of functions,
including the ability to move, see, remember, speak, reason, and read and write. (1) About 80% of strokes are
ischemic. About 20% of strokes are hemorrhagic, which means they are caused by uncontrolled bleeding in the
brain. A Transient Ischemic Attack (TIA), also known as a "mini-stroke," is caused by a temporary interruption
of blood flow to the brain. A TIA is an important warning sign that puts persons at increased risk of a complete
stroke. (1)
Stroke is the leading cause of adult neurological disability in Canada, with 300,000 people or 1% of the
population living with its effects. (2) Up to 85% of persons experiencing a complete stroke may have residual
arm dysfunction which will interfere with their ability to live independently. (3) Rehabilitation interventions are
the cornerstones of care and recovery after stroke.
Ontario Prevalence and Incidence
There were 19,395 persons with stroke (this includes intracerebral hemorrhage, ischemic stroke, subarachnoid
hemorrhage, and transient ischemic attack) presenting to emergency departments in 2007/2008, with 15,514
admitted to the hospital. (4)
Rehabilitation
According to the 2010 Institute of Clinical Evaluative Sciences Ontario Stroke Evaluation Report, (4) the mean
number of rehabilitation services offered by Community Care Access Centres) to patients discharged from
hospital in 2006/2007 after an acute stroke episode was 4 visits for physical therapy, 3 for occupational therapy,
and 3 for speech-language pathology. Furthermore, the CCAC service intensity was found to be low and likely
inadequate in terms of helping to bring about functional changes in those who had difficulty living independently.
Finally, no existing database collects information on outpatient therapy offered in ambulatory settings at hospitals
and clinics in Ontario. This Stroke Evaluation Report recommended the following:
1. Survey outpatient facilities to identify those providing therapies of benefit to stroke patients.
2. The National Ambulatory Care Reporting System database maintained by the Canadian Institute for Health
Information needs to evolve to capture ambulatory rehabilitation being delivered at inpatient facilities (both
acute and rehabilitative).
3. Investment in CCAC rehabilitation services could potentially reduce rates of readmission to hospitals and
admission to long-term care institutions.
Overall, the Report concluded that people with stroke living in the community who have difficulty with activities
of daily living should have access, as appropriate, to therapy services to improve or prevent deterioration in these
activities.
Ontario Health Technology Assessment Series; Vol. 11: No. 6, pp. 1–58, November 2011 11
It is generally agreed that the target FIM® score for admission to stroke rehabilitation is 40 to 80. A provincial
median admission FIM® score of 78 (average score, 76) suggests that a notable proportion of patients in the
severe group (those with an FIM® score of less than 60) did not have access to inpatient rehabilitation. This
might also suggest that patients with mild disability were going to inpatient rehabilitation due to a lack of
outpatient services and/or pressures on inpatient rehabilitation centres to reduce length of stay. (4)
Discharge Destination after Hospitalization
In their 2010 Ontario Stroke Evaluation Report, (4) the Institute of Clinical Evaluative Sciences) found that
provincially, there was a 27% increase in discharging stroke patients home with services (from 11% in 2003/2004
to 14% in 2007/2008) and an associated decrease in discharging home without services (from 45% in 2003/2004
to 41% in 2007/2008). There was a slight decrease in discharging to long-term care (from 8.5% in 2003/2004 to
7% in 2007/2008) and complex continuing care (from 9% in 2003/2004 to 7% in 2007/2008) and a 15% relative
increase in discharging to inpatient rehabilitation (from 20% in 2003/2004 to 23% in 2007/2008).
Persons with a modified Rankin score between 3 and 5, indicating moderate to severe stroke, are considered to be
the most suitable for inpatient rehabilitation. Based on the 2004/2005 provincial stroke audit, these patients
represent 36.8% of the acute stroke inpatient population. Therefore, the estimated proportion of stroke patients
needing inpatient rehabilitation is 35%-40%. (4)
On average, 2 out of 10 persons admitted to hospital due to stroke were transferred to rehabilitation. There is a
wide variation (14.1% to 32.2%) among Local Health Integration Networks regarding the proportion of stroke
patients discharged to inpatient rehabilitation. Access to rehabilitation was much higher among designated stroke
centres where 3 out of 10 patients were discharged to inpatient rehabilitation. (4)
Constraint-Induced Movement Therapy
Constraint-Induced Movement Therapy (CIMT) is a behavioural approach to neurorehabilitation based on the
principle of ‘learned non-use’. The term is derived from studies of nonhuman primates in which somatosensory
deafferentation of a single forelimb was performed, after which the animal then failed to use that limb. (5) The
major components of CIMT include: i) intense, repetitive, task oriented training of the impaired limb; ii)
immobilization of the unimpaired arm; and iii) shaping. (5;6) With regard to the first component, persons may
train the affected arm for several hours a day for up to 10-15 consecutive days. With immobilization, the
unaffected arm may be restrained for up to 90% of waking hours. And finally, with shaping, the difficulty of the
training tasks is progressively increased as performance improves and encouraging feedback is provided
immediately when small gains are achieved. (5)
Ontario Health Technology Assessment Series; Vol. 11: No. 6, pp. 1–58, November 2011 12
Evidence-Based Analysis
Research Question
What is the effectiveness and cost of CIMT compared with physiotherapy and/or occupational therapy
rehabilitative care of equal intensity and duration for the treatment of arm dysfunction in persons 18 years of age
and older?
Research Methods
Literature Search
Search Strategy
A literature search was performed on January 21, 2011 using OVID MEDLINE, MEDLINE In-Process and Other
Non-Indexed Citations, OVID EMBASE, the Cumulative Index to Nursing and Allied Health Literature
(CINAHL), and the Cochrane Library, Centre for Reviews and Dissemination (Appendix 1). The literature search
was designed to include studies published from January 1, 2008 to January 21, 2011 due to an existing Cochrane
Systematic review on CIMT which searched the literature up to and including June 2008.
Abstracts were reviewed by one reviewer and full-text articles were obtained for studies meeting eligibility
criteria. Reference lists were also examined in order to locate any additional relevant studies that were not
identified through the search. Articles that did not clearly meet the eligibility criteria were reviewed with a
second clinical epidemiologist and subsequently by a group of epidemiologists until consensus was established
about whether the articles met the criteria.
Inclusion Criteria
Studies meeting the following criteria were included in this systematic review:
Systematic reviews of randomized controlled trials with or without meta-analysis.
Study participants 18 years of age and older with arm dysfunction after stroke.
Studies comparing the use of CIMT with occupational therapy and/or physiotherapy rehabilitative care (usual
care) to improve arm function.
Studies which described CIMT as having the following three components: i) restraining unimpaired arm
and/or wrist with a sling, hand splint or cast; ii) intensive training with functional task practice of the affected
arm; and iii) application of shaping methodology during training.
No restriction was placed on intensity or duration of treatment otherwise.
Duration and intensity of therapy is equal in treatment and control groups.
Therapy beginning a minimum of 1 month after stroke.
Published between 2008 and 2011.
Exclusion Criteria
Studies meeting the following criteria were excluded from this systematic review:
Narrative reviews, case series, case reports, controlled clinical trials
Letters to the editor
Ontario Health Technology Assessment Series; Vol. 11: No. 6, pp. 1–58, November 2011 13
Grey literature
Non-English language publications
Outcomes of Interest
Primary Outcome Arm motor function: Action Research Arm Test (ARAT)
Secondary Outcome Arm motor impairment: Fugl-Meyer Motor Assessment (FMA)
Activities of daily living (ADL): Functional Independence Measure (FIM), Chedoke Arm and Hand
Inventory
Perceived motor function : Motor Activity Log (MAL) Amount of Use (AOU) and Quality of Movement
(QOM) scales
Quality of life: Stroke Impact Scale (SIS)
Description of Outcome Measures:
Action Research Arm Test (ARAT) is a 19-item test divided into 4 categories including grasp (lifting different
size objects), grip (holding and moving objects), pinch (picking up small objects), and gross movement (e.g.,
hand to mouth actions). Each item is graded on a 4-point ordinal scale (0=can perform no part of the test;
1=performs test partially; 2=completes test but takes abnormally long time or has great difficulty; 3=performs test
normally) for a total possible scale score of 57, with higher scores indicating better ability. (7) The scale has been
extensively examined and used as a ‘gold standard’ for comparison with other upper limb measures such as the
Chedoke Arm and Hand Inventory. (8)
Chedoke Arm and Hand Inventory (CAHI) is a test developed to measure functional tasks in people
poststroke. It consists of 13 functional tasks that reflect domains deemed important by survivors of stroke,
including bilateral activities, non-gender specific tasks, and the full range of movements, pinches, and grasps
covering all stages of motor recovery poststroke. Correlation between CAHI and the ARAT was high (r=0.93).
(8)
Fugl-Meyer Motor Assessment (FMA) (Upper Extremity Portion) assesses motor performance across the
domains of voluntary movement, reflex activity, grasp, and coordination. Performance is measured on 33 tasks
within these domains using a 3-point ordinal scale (0=cannot perform; 1=performs partially; and 2=performs
fully) for a total possible scale score of 66 (3;8), with higher scores representing better performance. The
reliability and construct validity of the FMA are well established.
Functional Independence Measure (FIM) is an 18-item scale grouped into 6 subscales measuring self-care,
sphincter control, transfers, locomotion, communication, and social cognition. Each item is rated from 1 to 7
based on the required level of assistance necessary to perform the basic activities of daily living (ADL)
(1= complete assistance needed; 2= maximal assistance; 3= moderate assistance; 4= minimal assistance;
5=supervision; 6= modified independence; and 7= complete independence) with a total possible scale score of
126. (9) A higher score indicates greater independence. (10)
Motor Activity Log (MAL) is a semi-structured self-report questionnaire designed to obtain information about
the use of the affected limb during 30 minutes of important ADL. There is a 6-point Amount of Use (AOU)
subscale to rate the extent to which the arm was used and a 6-point Quality of Use (QOU) subscale to rate the
quality of use or how well persons are using their affected arm. (9) Each subscale consists of 20 common
activities of daily living scored from 0 (never use the more affected arm for this activity) to 5 (always use the
more affected arm for this activity) on the AOU subscale and from 0 (unable to use the more affected arm for this
Ontario Health Technology Assessment Series; Vol. 11: No. 6, pp. 1–58, November 2011 14
activity) to 5 (able to use the more affected arm for this activity) on the QOU subscale. The MAL has good inter-
rater reliability and construct validity. (3) The MAL is considered a primary measure of CIMT outcome. (11)
Stroke Impact Scale (SIS) is a comprehensive measure of health outcomes in stroke populations. Version 2 is
a 64-item self-report scale designed to assess 8 functional domains including strength, memory, emotions,
communication, ADLs, and instrumental ADL (IADL)., Instrumental ADL include activities such as housework,
taking medications properly, mobility, hand function, and domestic and community participation. The SIS has
established reliability and validity. Version 3 is a 59-item self-report scale designed to assess eight functional
domains. These functional domains include strength, memory, emotion, communication, ADLs/IADL, mobility,
and hand function. Items in each domain in both versions are scored using a 5-point rating scale. Aggregated
scores in each domain are generated with a higher score indicating better performance. (12)
Statistical Analysis
Where appropriate, a meta-analysis was undertaken to determine the pooled-estimate of effect of CIMT
compared with usual care for explicit outcomes using Review Manager 5 version 5.0.25. Mean difference was
used as the pooled summary estimate for continuous data where the outcome among pooled studies was measured
by the same scale. The degree of statistical heterogeneity among studies was assessed by the I2 -statistic for each
outcome. A fixed or random effects model was used following the guidance of the Cochrane handbook. (13) An
I2>50% was considered as substantial heterogeneity for which a subgroup analysis was undertaken. (13) A
subgroup analysis was also undertaken to explain inconsistencies in study results. A subgroup analysis was
performed using three categories similar to Sirtori et al. (14) including: i) program (high intensity/short duration
(H/S) or low intensity/long duration (L/L); ii) position of restraint (hand or arm and hand); and, iii) time since
stroke (1-12 months or more than 12 months).
Quality of Evidence
The quality of the body of evidence was assessed as high, moderate, low, or very low according to the GRADE
Working Group criteria (15) as presented below.
Quality refers to criteria such as the adequacy of allocation concealment, blinding, and losses to follow-up.
Consistency refers to the similarity of estimates of effect across studies. If there are important and
unexplained inconsistencies in the results, confidence in the estimate of effect for that outcome decreases.
Differences in the direction of effect, the magnitude of the difference in effect, and the significance of the
differences guide the decision about whether important inconsistency exists.
Directness refers to the extent to which the population, interventions, and outcome measures are similar to
those of interest.
As stated by the GRADE Working Group, the following definitions of quality were used in grading the quality of
the evidence:
High Further research is very unlikely to change confidence in the estimate of effect.
Moderate Further research is likely to have an important impact on confidence in the
estimate of effect and may change the estimate.
Low Further research is very likely to have an important impact on confidence in the
estimate of effect and is likely to change the estimate.
Very Low Any estimate of effect is very uncertain.
Ontario Health Technology Assessment Series; Vol. 11: No. 6, pp. 1–58, November 2011 15
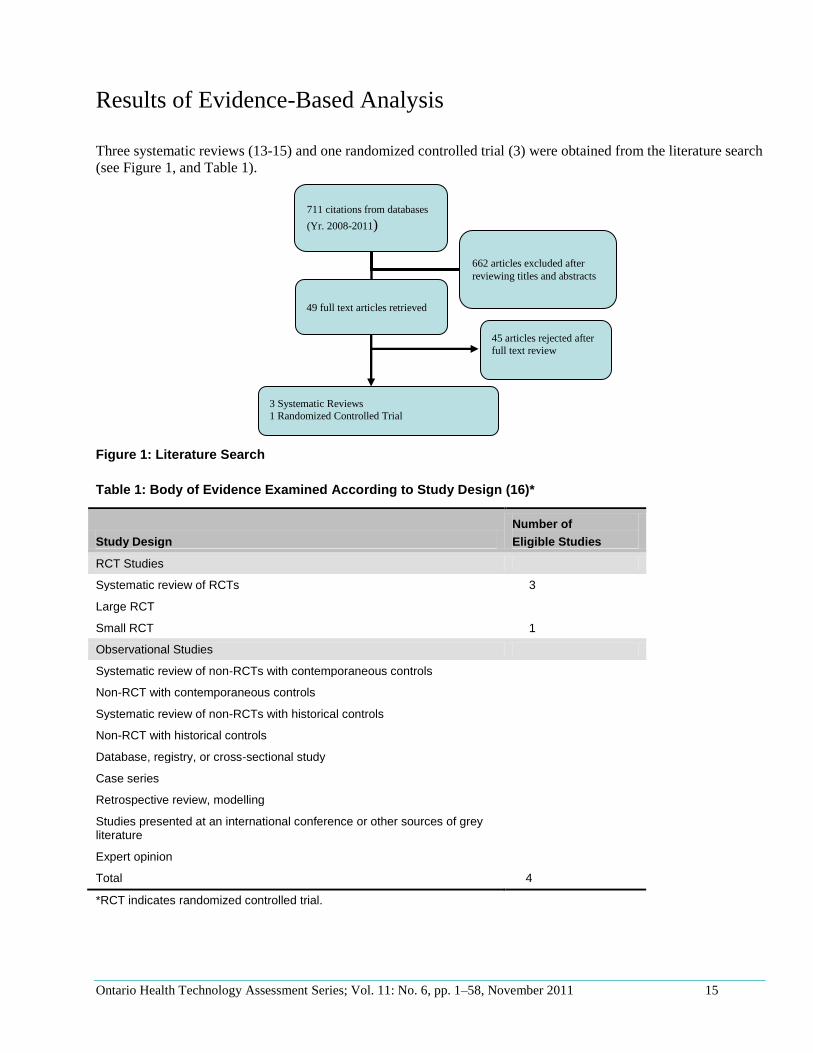
Results of Evidence-Based Analysis
Three systematic reviews (13-15) and one randomized controlled trial (3) were obtained from the literature search
(see Figure 1, and Table 1).
Figure 1: Literature Search
Table 1: Body of Evidence Examined According to Study Design (16)*
Study Design
Number of
Eligible Studies
RCT Studies
Systematic review of RCTs 3
Large RCT
Small RCT 1
Observational Studies
Systematic review of non-RCTs with contemporaneous controls
Non-RCT with contemporaneous controls
Systematic review of non-RCTs with historical controls
Non-RCT with historical controls
Database, registry, or cross-sectional study
Case series
Retrospective review, modelling
Studies presented at an international conference or other sources of grey literature
Expert opinion
Total 4
*RCT indicates randomized controlled trial.
711 citations from databases
(Yr. 2008-2011)
49 full text articles retrieved
662 articles excluded after
reviewing titles and abstracts
45 articles rejected after
full text review
3 Systematic Reviews
1 Randomized Controlled Trial
Ontario Health Technology Assessment Series; Vol. 11: No. 6, pp. 1–58, November 2011 16
Characteristics of Included Studies
Systematic Reviews
Table 2 presents an overview of the characteristics of the 3 systematic reviews found during the literature search.
The most recent review, published in 2010, was that completed by Corbetta et al. (17) which was an update of
that done by Sirtori et al. (14) and published by the Cochrane Collaboration in 2009. Corbetta et al. (17) reported
the results of CIMT compared with usual care of disability measured with the FIM and Barthel index, and motor
function measured with the ARAT scale. Sirtori et al. (14) reported the results of these measures as well as the
effects of CIMT on perceived arm motor impairment measured with the MAL, arm motor impairment measured
with the FMA, and quality of life measured with the SIS. Both Sirtori et al. (14) and Corbetta et al. (17) pooled
studies that compared Forced Use Therapy (like CIMT, this intervention involves the restraint of the non-
involved upper extremity and intensive practice with the involved upper extremity) with CIMT in their meta-
analysis. Forced Use Therapy does not include the intensive training and shaping components of CIMT.
Therefore, because studies examining Forced Use Therapy were combined with CIMT without subgroup analyses
of each, the results of these two systematic reviews are not directly applicable to the research question of this
evidence-based analysis.
The systematic review by French et al. (18) searched the databases up to September 2006 and included studies of
repetitive task training and treadmill training. A subgroup analysis determined a significant effect of CIMT on
arm function but not on hand function (Table 2).
Ontario Health Technology Assessment Series; Vol. 11: No. 6, pp. 1–58, November 2011 17
Table 2: Characteristics of Systematic Reviews of CIMT for Upper Limb Dysfunction in Adult Stroke Patients*
Author, Year Purpose of
Review Search date Population
Total No. of Studies
Meta-analysis Conclusion
Corbetta et al, 2010 (17)
The effectiveness of CIMT, modified CIMT, FU compared with other techniques, or no treatment in adult stroke patients
April 2010 Adults with ischemic or haemorrhagic stroke All interventions were considered irrespective of the number of hours of training and number of hours of constraint/day, duration of treatment, and type of exercise used in training sessions; these data were pooled and discussed under the heading of CIMT
18 RCTs 6 CIMT 10 mCIMT 2 FU
Yes For outcome of disability and arm motor function
Combined studies of CIMT, mCIMT, and FU in meta-analysis of disability and arm motor function Combined results: no effect on disability (0.21 [-0.08, 0.50] I
2=29% n=8
studies Significant effect on arm motor function (0.44 [0.03, 0.84] I
2=64% n=15 studies
Sirtori et al, 2009 (19)
To evaluate the efficacy of CIMT, mCIMT or FU as rehabilitative techniques for upper limb hemiparesis after stroke
June 2008 Adults with ischemic or haemorrhagic stroke
19 RCTs 7 CIMT 11 mCIMT 1 FU
Yes Primary outcome of disability; subgroup analyses on primary outcomes looking at amount of task practice; region of restraint; and time since stroke Secondary outcomes: arm motor function; perceived arm motor function; amount of use; perceived arm motor function; quality of us; arm motor impairment; quality of life
Combined studies of CIMT, mCIMT, and FU in meta-analysis of disability and arm motor function Combined results: significant effect on disability immediately post intervention (0.36 [0.06, 0.65] I
2=not
reported n=6 studies Nonsignificant effect on disability at 3 to 6 months follow up (-0.07 [-0.53, 0.40] I
2=not reported, n=2
studies Subgroup analyses: significant effect of task practice ≤ 30 hours (n=4 studies) Significant effect of hand only restraint n=5 studies Non significant effect of time since stroke n=2
Ontario Health Technology Assessment Series; Vol. 11: No. 6, pp. 1–58, November 2011 18
Author, Year Purpose of
Review Search date Population
Total No. of Studies
Meta-analysis Conclusion
studies
French et al, 2008 (18)
To determine effectiveness and cost effectiveness of all forms of repetitive functional task practice
Sept. 2006 Adults who had a stroke
30 RCT 5 CIMT 6 mCIMT 13 RTT 6 TM 1 nRCT 1 RTT
Yes Primary Outcome: Global and limb specific functional measures Secondary Outcome: ADL Adverse outcomes (pain, injury, falls)
Combined interventions (RTT, CIMT, TM) in meta-analysis of disability and arm motor function. Sub group CIMT included mCIMT studies: Significant effect of CIMT (including mCIMT studies) on arm function (0.77 [0.26, 1.29] I
2=41% , n=7
Non significant effect of CIMT (including mCIMT studies) on hand function (0.55, -0.24, 1.34) I
2=0%,
n=2
*RCT indicates randomized controlled trial; mCIMT, modified CIMT; RTT, repetitive task training; FU, Forced Use Therapy; TM, treadmill training
Ontario Health Technology Assessment Series; Vol. 11: No. 6, pp. 1–58, November 2011 19
Randomized Controlled Trials
Because of the comprehensiveness and current nature of the systematic reviews by Sirtori et al. (14) and
Corbetta et al. (17) We selected the RCTs from these reviews that met our inclusion criteria and added
any others obtained from our literature search that had been published from 2008 to the present. Thirteen
RCTs were therefore included in this evidence-based analysis.
Table 3 reports the characteristics of the 13 RCTs included in this review (3;7;9;10;12;20-27). They
include 11 CIMT studies from the systematic review by Sirtori et al. (14), one from the systematic review
by Corbetta et al. (17) and one small RCT (3) found during our literature search. Complete details of these
studies are reported in Appendix 2. These 13 studies represent the body of evidence for this evidence-
based review. All studies were pre and post RCT design with the change scores within the treatment and
control groups compared in the final analysis. The sample size ranged from 6 to 60. Seven studies were
completed in Asia, 5 in USA, and one in Saudi Arabia. The mean age of participants ranged from 49 to 72
years, and the mean time after stroke when treatment was started ranged from 1 to 32 months. Seven of
the 6 studies restrained the arm and hand and 7 studies used a high intensity/short duration program while
6 used a low intensity/long duration program. Regardless of the program, all but one study provided a
total of 30 hours of training. The study by Myint et al. (22) provided a total of 40 hours of training. CIMT
was delivered by an occupational therapist and/or a physiotherapist in all 14 studies. Usual care included
physiotherapy and occupational therapy, with equi-intensity and duration to that of the CIMT group. The
follow-up time began immediately after the treatment program ended in all but 2 studies, which include
Lin et al, 2010 (3) and Myint et al, 2008. (22)
Table 3: Characteristics of CIMT Studies*
Study n Country Mean Age
Mean Time after
Stroke (mos)
Restraint Training Intensity (hrs/wk)
Training Duration
(wks)
Follow-up (wks from
start of treatment)
Lin et al, 2010 (3) 13 Taiwan 49 19 Hand 10H 3S 32 Lin et al, 2009 (10) 60 Taiwan 53 21 Hand 10H 3S 3 Myint et al, 2008 (22)
43 China 64 1 Arm and Hand 20H 2S 12
Wu et al, 2007a (9)
30 Taiwan 54 18 Hand 10H 3S 3
Wu et al, 2007b (27)
47 Taiwan 55 12 Hand 10 H 3S 3
Wu et al, 2007c (28)
26 Taiwan 72 8 Hand 10H 3S 3
Lin et al, 2007 (21) 32 Taiwan 58 16 Hand 10H 3S 3 Page et al, 2008 (26)
35 USA NR 12 Arm and Hand 3H 10L 11
Page et al, 2005 (23)
10 USA 60 1 Arm and Hand 3H 10L 10
Atteya, 2004 (20) 6 Saudi A. 54 5 Arm and Hand 3L 10L 10 Page et al, 2004 (25)
17 USA 59 32 Arm and Hand 3L 10L 10
Page et al, 2002 (24)
14 USA 69 5 Arm and Hand 3L 10L 11
Page et al, 2001 (7)
6 USA 56 5 Arm and Hand 3L 10L 11
*H, High intensity training; L, Low intensity training; S, Short duration; L, Long duration; n, Sample Size
Ontario Health Technology Assessment Series; Vol. 11: No. 6, pp. 1–58, November 2011 20
Table 4 reports the outcome measures assessed in each of the 13 studies. Seven studies measured Arm
Motor Function with the ARAT scale. Data from 5 studies were available for meta-analysis. Ten studies
measured Arm Motor Impairment with the FMA scale; data from 7 studies were available for meta-
analysis. All 13 studies measured Perceived Motor Function (both Amount of Use and Quality of Use)
using the MAL scale; data from 8 studies were available for meta-analysis. The FIM scale was used to
measure activities of daily living (ADL) in 4 studies with all 4 studies having available data for meta-
analysis. Finally, 2 studies measured quality of life with the SIS; however, each used a different version
of the scale. No study used the Chedoke Arm and Hand Inventory outcome measure.
Table 4: Outcome Measures in Included Studies*
Study Arm motor
function Arm
motor impairment Perceived motor
function ADL
Quality of life
Lin et al, 2010 (3) FMA MAL
Lin et al, 2009 (10) FMA Add to forest plot
MAL FIM SIS (version 3)
Myint et al, 2008a (22)
ARAT MAL
Page et al, 2008 (26)
ARAT FMA MAL SD of change not reported.
Wu et al, 2007a (9) MAL FIM
Wu et al, 2007b (27)
FMA MAL
Wu et al, 2007c (28)
FMA MAL FIM SIS (version 2)
Lin et al, 2007 (21)
MAL FIM
Page et al, 2005 (23)
ARAT FMA MAL
Atteya, 2004 (20) ARAT FMA MAL SD of change not available
Page et al, 2004 (25)
ARAT †SD of change not available
FMA SD of change not available
MAL SD of change not available
Page et al, 2002 (24)
ARAT SD of change not available
FMA SD of change not available
MAL SD of change not available
Page et al, 2001 (7)
ARAT FMA MAL No available data
*ARAT, action research arm test; MAL, motor activity log; FIM, functional independence measure; FMA, Fugl-Meyer Motor Assessment; SIS, Stroke Impact Scale; SD, standard deviation
Ontario Health Technology Assessment Series; Vol. 11: No. 6, pp. 1–58, November 2011 21
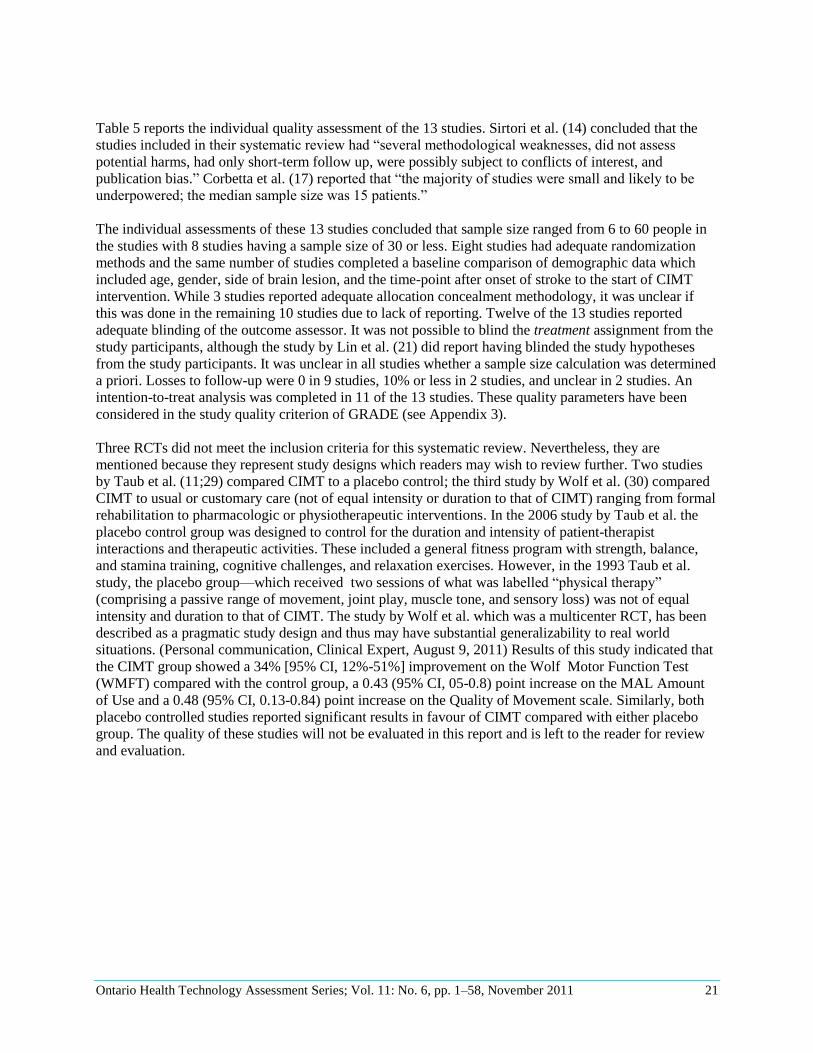
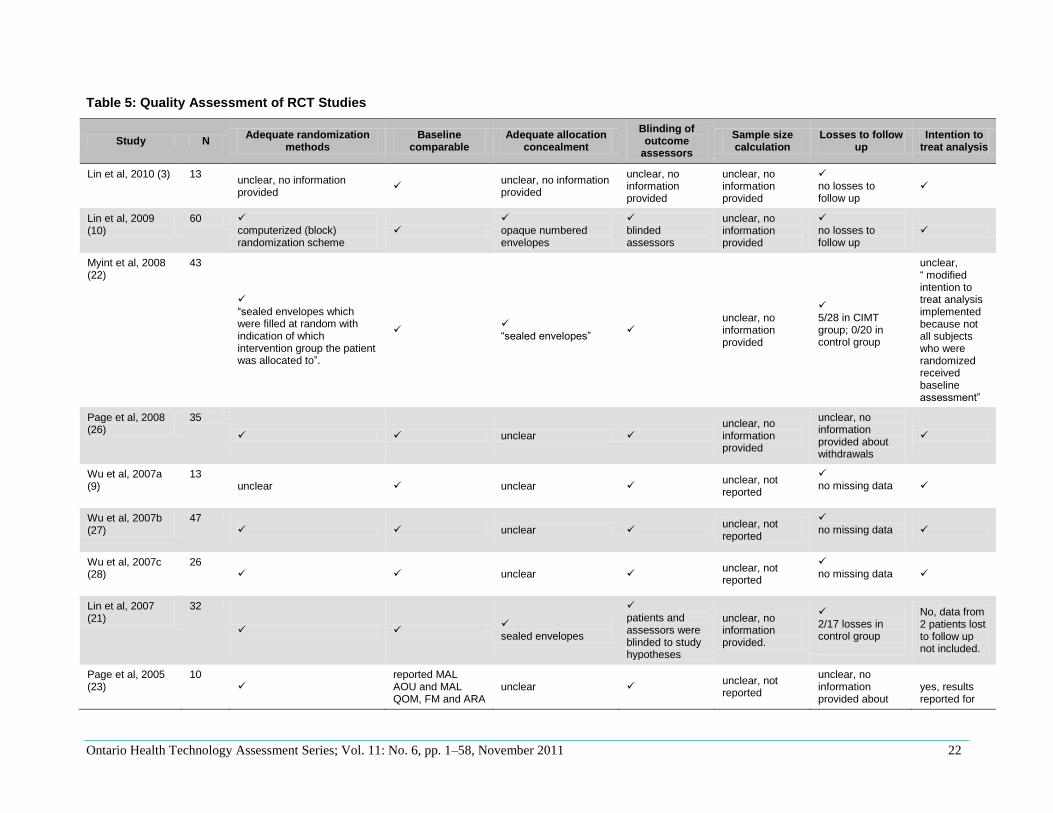
Table 5 reports the individual quality assessment of the 13 studies. Sirtori et al. (14) concluded that the
studies included in their systematic review had “several methodological weaknesses, did not assess
potential harms, had only short-term follow up, were possibly subject to conflicts of interest, and
publication bias.” Corbetta et al. (17) reported that “the majority of studies were small and likely to be
underpowered; the median sample size was 15 patients.”
The individual assessments of these 13 studies concluded that sample size ranged from 6 to 60 people in
the studies with 8 studies having a sample size of 30 or less. Eight studies had adequate randomization
methods and the same number of studies completed a baseline comparison of demographic data which
included age, gender, side of brain lesion, and the time-point after onset of stroke to the start of CIMT
intervention. While 3 studies reported adequate allocation concealment methodology, it was unclear if
this was done in the remaining 10 studies due to lack of reporting. Twelve of the 13 studies reported
adequate blinding of the outcome assessor. It was not possible to blind the treatment assignment from the
study participants, although the study by Lin et al. (21) did report having blinded the study hypotheses
from the study participants. It was unclear in all studies whether a sample size calculation was determined
a priori. Losses to follow-up were 0 in 9 studies, 10% or less in 2 studies, and unclear in 2 studies. An
intention-to-treat analysis was completed in 11 of the 13 studies. These quality parameters have been
considered in the study quality criterion of GRADE (see Appendix 3).
Three RCTs did not meet the inclusion criteria for this systematic review. Nevertheless, they are
mentioned because they represent study designs which readers may wish to review further. Two studies
by Taub et al. (11;29) compared CIMT to a placebo control; the third study by Wolf et al. (30) compared
CIMT to usual or customary care (not of equal intensity or duration to that of CIMT) ranging from formal
rehabilitation to pharmacologic or physiotherapeutic interventions. In the 2006 study by Taub et al. the
placebo control group was designed to control for the duration and intensity of patient-therapist
interactions and therapeutic activities. These included a general fitness program with strength, balance,
and stamina training, cognitive challenges, and relaxation exercises. However, in the 1993 Taub et al.
study, the placebo group—which received two sessions of what was labelled “physical therapy”
(comprising a passive range of movement, joint play, muscle tone, and sensory loss) was not of equal
intensity and duration to that of CIMT. The study by Wolf et al. which was a multicenter RCT, has been
described as a pragmatic study design and thus may have substantial generalizability to real world
situations. (Personal communication, Clinical Expert, August 9, 2011) Results of this study indicated that
the CIMT group showed a 34% [95% CI, 12%-51%] improvement on the Wolf Motor Function Test
(WMFT) compared with the control group, a 0.43 (95% CI, 05-0.8) point increase on the MAL Amount
of Use and a 0.48 (95% CI, 0.13-0.84) point increase on the Quality of Movement scale. Similarly, both
placebo controlled studies reported significant results in favour of CIMT compared with either placebo
group. The quality of these studies will not be evaluated in this report and is left to the reader for review
and evaluation.
Ontario Health Technology Assessment Series; Vol. 11: No. 6, pp. 1–58, November 2011 22
Table 5: Quality Assessment of RCT Studies
Study N Adequate randomization
methods Baseline
comparable Adequate allocation
concealment
Blinding of outcome
assessors
Sample size calculation
Losses to follow up
Intention to treat analysis
Lin et al, 2010 (3) 13 unclear, no information provided
unclear, no information provided
unclear, no information provided
unclear, no information provided
no losses to follow up
Lin et al, 2009 (10)
60 computerized (block) randomization scheme
opaque numbered envelopes
blinded assessors
unclear, no information provided
no losses to follow up
Myint et al, 2008 (22)
43
“sealed envelopes which were filled at random with indication of which intervention group the patient was allocated to”.
“sealed envelopes”
unclear, no information provided
5/28 in CIMT group; 0/20 in control group
unclear, “ modified intention to treat analysis implemented because not all subjects who were randomized received baseline assessment”
Page et al, 2008 (26)
35
unclear unclear, no information provided
unclear, no information provided about withdrawals
Wu et al, 2007a (9)
13 unclear unclear
unclear, not reported
no missing data
Wu et al, 2007b (27)
47 unclear
unclear, not reported
no missing data
Wu et al, 2007c (28)
26 unclear
unclear, not reported
no missing data
Lin et al, 2007 (21)
32
sealed envelopes
patients and assessors were blinded to study hypotheses
unclear, no information provided.
2/17 losses in control group
No, data from 2 patients lost to follow up not included.
Page et al, 2005 (23)
10
reported MAL AOU and MAL QOM, FM and ARA
unclear unclear, not reported
unclear, no information provided about
yes, results reported for
Ontario Health Technology Assessment Series; Vol. 11: No. 6, pp. 1–58, November 2011 23
Study N Adequate randomization
methods Baseline
comparable Adequate allocation
concealment
Blinding of outcome
assessors
Sample size calculation
Losses to follow up
Intention to treat analysis
scores preintervention was similar with the more affected limb. Statistics not provided
withdrawals all 10 study subjects.
Atteya, 2004 (20) 6 unclear
reported but not statistically compared
unclear unclear, not reported
no losses
Page et al, 2004 (25)
17
demographic and clinical baseline data reported but not compared statistically
Unclear
appears no losses as data reported for all study subjects
yes, as data reported for all study subjects
Page et al, 2002 (24)
14
unclear
demographic and clinical baseline data reported but not compared statistically
unclear unclear, not reported
appears no losses as data reported for all study subjects
yes, as data reported for all study subjects
Page et al, 2001 (7)
6
unclear
subject characteristics reported but not compared statistically
unclear unclear, not reported
appears no losses as data reported for all study subjects
yes, as data reported for all study subjects
Ontario Health Technology Assessment Series; Vol. 11: No. 6, pp. 1–58, November 2011 24
Summary of Existing Evidence
A meta-analysis was completed for the following outcomes:
Arm motor function measured by the ARAT scale
Arm motor impairment measured by the FMA scale
Activities of daily living (ADL) measured by the FIM scale
Perceived arm motor function measured by the MAL amount of use and quality of use subscales
Quality of life measured by the stroke impact scale (SIS).
Primary Outcome
Arm Motor Function
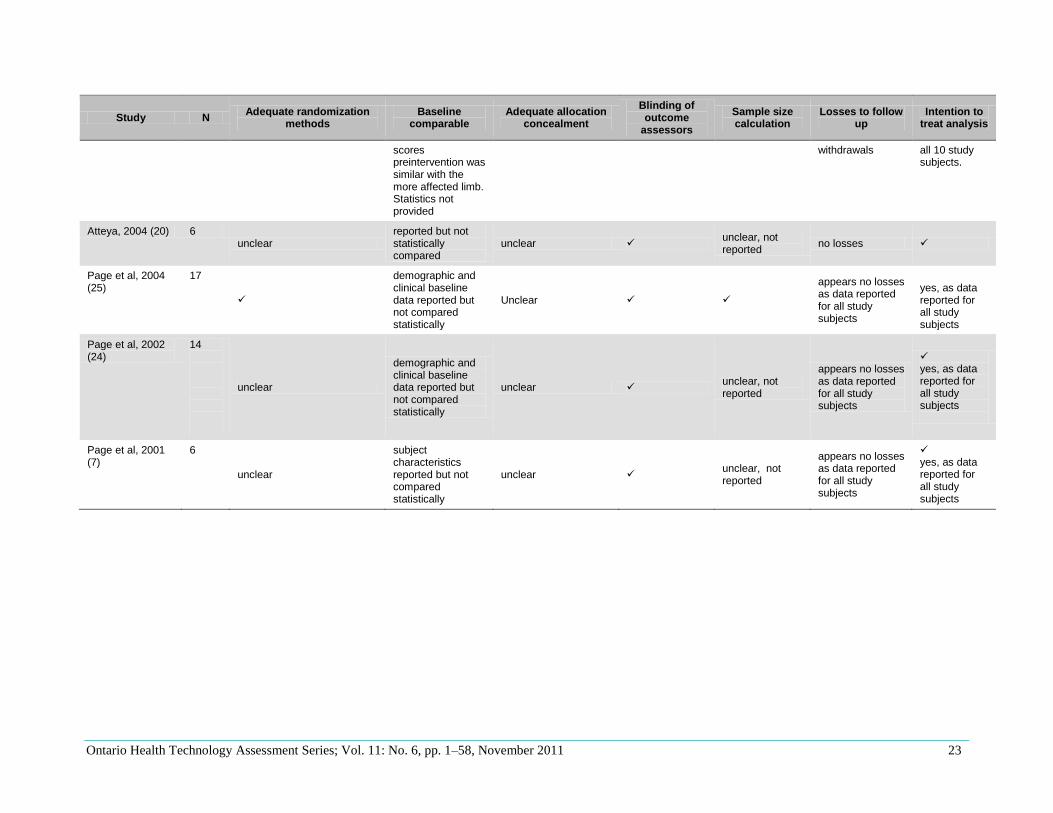
Arm motor function was measured using the ARAT scale. Results of 4 studies were combined to derive a
pooled-effect estimate and the mean difference was used as a summary statistic. (7;20;23;26) The pooled
estimate represents the mean difference in the change scores pre and post treatment in each study group.
There is a significant effect of CIMT on arm motor function compared with usual care (Figure 2). All
studies used a high intensity/low duration CIMT program, and hand and arm restraint positioning. The
mean time after stroke to start of intervention was 1 to12 months. The I2 value is 38%. Subgroup analysis
was not indicated since the I2 was less than 50% and the individual estimates of effects seemed consistent
among studies. The GRADE quality of evidence was assessed as Moderate. Details of the GRADE rating
may be found in Appendix 3.
Figure 2: Arm Motor Function Measured using the ARAT
Secondary Outcomes
Arm Motor Impairment
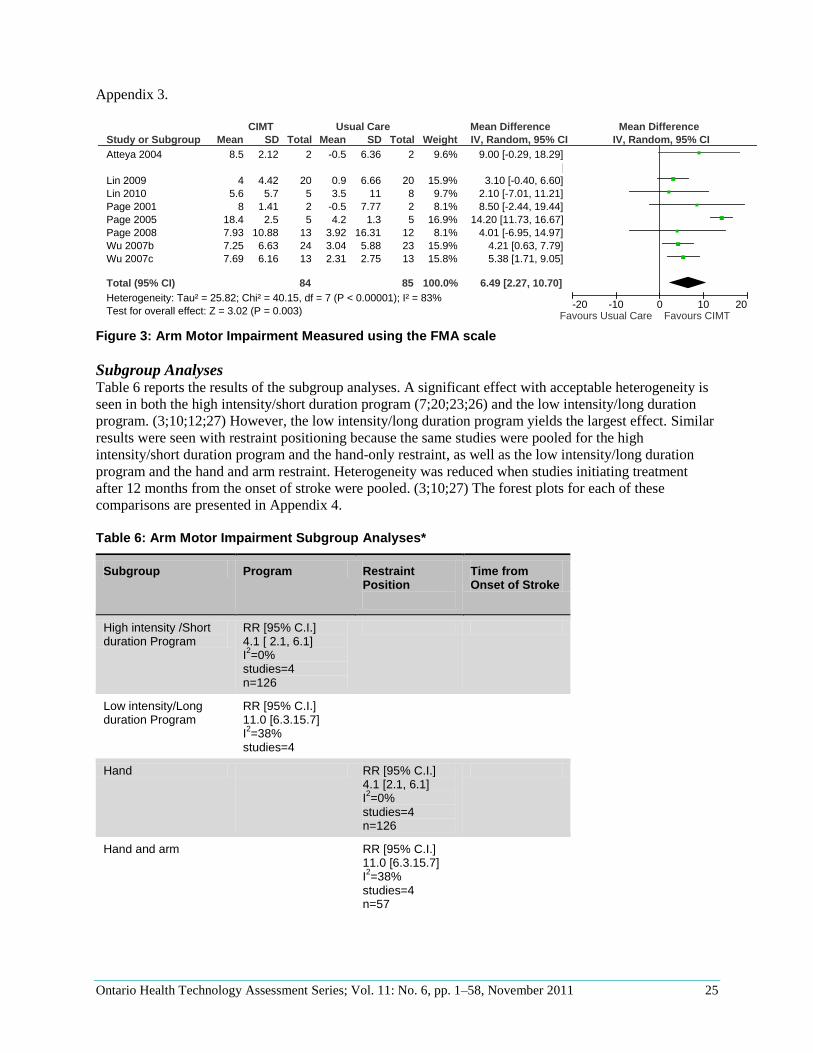
Results of 8 studies were combined to derive a pooled-effect estimate of arm motor impairment and the
mean difference was used as the summary statistic. (3;7;10;12;20;23;26;27) All studies measured arm
motor impairment with the FMA scale. The pooled estimate represents the mean difference in the change
scores pre and post treatment in each group. There is a significant effect of CIMT on arm motor
impairment compared with usual care (Figure 3). Heterogeneity is high among the studies as indicated by
an I2 of 83%. Subgroup analyses of these data were completed in order to reduce heterogeneity. The
GRADE quality of evidence was assessed as Low. Details of the GRADE rating may be found in
Study or Subgroup
Atteya 2004
Dahl 2008
Dromerick 2000
Dromerick 2009
Myint 2008a
Page 2001
Page 2005
Page 2008
Sawaki 2008
Wittenberg 2003
Wolf 2006
Total (95% CI)
Heterogeneity: Tau² = 10.10; Chi² = 4.85, df = 3 (P = 0.18); I² = 38%
Test for overall effect: Z = 5.42 (P < 0.00001)
Mean
15.5
0.34
25.5
24.18
20.1
14.5
21.4
10.78
0
0.85
0.29
SD
6.36
0.72
20.75
4
9.3
4.94
2.79
10.94
0
0.75
0.25
Total
2
18
11
19
23
2
5
13
0
9
96
22
Mean
0
0.16
16.4
25.69
9.6
5
4.6
2.67
0
0.34
0.12
SD
9.89
0.78
23.48
4
12.4
4.24
0.89
13.64
0
0.9
0.27
Total
2
12
9
17
20
2
5
12
0
7
103
21
Weight
8.0%
0.0%
0.0%
0.0%
0.0%
20.2%
53.6%
18.2%
0.0%
0.0%
100.0%
IV, Random, 95% CI
15.50 [-0.80, 31.80]
0.18 [-0.37, 0.73]
9.10 [-10.54, 28.74]
-1.51 [-4.13, 1.11]
10.50 [3.87, 17.13]
9.50 [0.48, 18.52]
16.80 [14.23, 19.37]
8.11 [-1.63, 17.85]
Not estimable
0.51 [-0.32, 1.34]
0.17 [0.10, 0.24]
13.64 [8.71, 18.57]
CIMT Usual Care Mean Difference Mean Difference
IV, Random, 95% CI
-20 -10 0 10 20Favours usual care Favours CIMT
Ontario Health Technology Assessment Series; Vol. 11: No. 6, pp. 1–58, November 2011 25
Appendix 3.
Figure 3: Arm Motor Impairment Measured using the FMA scale
Subgroup Analyses Table 6 reports the results of the subgroup analyses. A significant effect with acceptable heterogeneity is
seen in both the high intensity/short duration program (7;20;23;26) and the low intensity/long duration
program. (3;10;12;27) However, the low intensity/long duration program yields the largest effect. Similar
results were seen with restraint positioning because the same studies were pooled for the high
intensity/short duration program and the hand-only restraint, as well as the low intensity/long duration
program and the hand and arm restraint. Heterogeneity was reduced when studies initiating treatment
after 12 months from the onset of stroke were pooled. (3;10;27) The forest plots for each of these
comparisons are presented in Appendix 4.
Table 6: Arm Motor Impairment Subgroup Analyses*
Subgroup Program Restraint Position
Time from Onset of Stroke
High intensity /Short duration Program
RR [95% C.I.] 4.1 [ 2.1, 6.1] I2=0%
studies=4 n=126
Low intensity/Long duration Program
RR [95% C.I.] 11.0 [6.3.15.7] I2=38%
studies=4
Hand RR [95% C.I.] 4.1 [2.1, 6.1] I2=0%
studies=4 n=126
Hand and arm RR [95% C.I.] 11.0 [6.3.15.7] I2=38%
studies=4 n=57
Study or Subgroup
Atteya 2004
Boake 2007
Lin 2009
Lin 2010
Page 2001
Page 2005
Page 2008
Wu 2007b
Wu 2007c
Total (95% CI)
Heterogeneity: Tau² = 25.82; Chi² = 40.15, df = 7 (P < 0.00001); I² = 83%
Test for overall effect: Z = 3.02 (P = 0.003)
Mean
8.5
18.2
4
5.6
8
18.4
7.93
7.25
7.69
SD
2.12
14.18
4.42
5.7
1.41
2.5
10.88
6.63
6.16
Total
2
10
20
5
2
5
13
24
13
84
Mean
-0.5
14.1
0.9
3.5
-0.5
4.2
3.92
3.04
2.31
SD
6.36
23.09
6.66
11
7.77
1.3
16.31
5.88
2.75
Total
2
12
20
8
2
5
12
23
13
85
Weight
9.6%
0.0%
15.9%
9.7%
8.1%
16.9%
8.1%
15.9%
15.8%
100.0%
IV, Random, 95% CI
9.00 [-0.29, 18.29]
4.10 [-11.65, 19.85]
3.10 [-0.40, 6.60]
2.10 [-7.01, 11.21]
8.50 [-2.44, 19.44]
14.20 [11.73, 16.67]
4.01 [-6.95, 14.97]
4.21 [0.63, 7.79]
5.38 [1.71, 9.05]
6.49 [2.27, 10.70]
CIMT Usual Care Mean Difference Mean Difference
IV, Random, 95% CI
-20 -10 0 10 20Favours Usual Care Favours CIMT
Ontario Health Technology Assessment Series; Vol. 11: No. 6, pp. 1–58, November 2011 26
Subgroup Program Restraint Position
Time from Onset of Stroke
1-12 months RR [95% C.I.] 9.5 [3.6, 15.4] I2=81%
studies=4 n=44
>12 months
RR [95% C.I.] 3.5 [1.1, 6.0] I2=0%
studies=3 n=100
*RR, Relative Risk; C.I., Confidence Interval; n, Sample Size
Activities of Daily Living
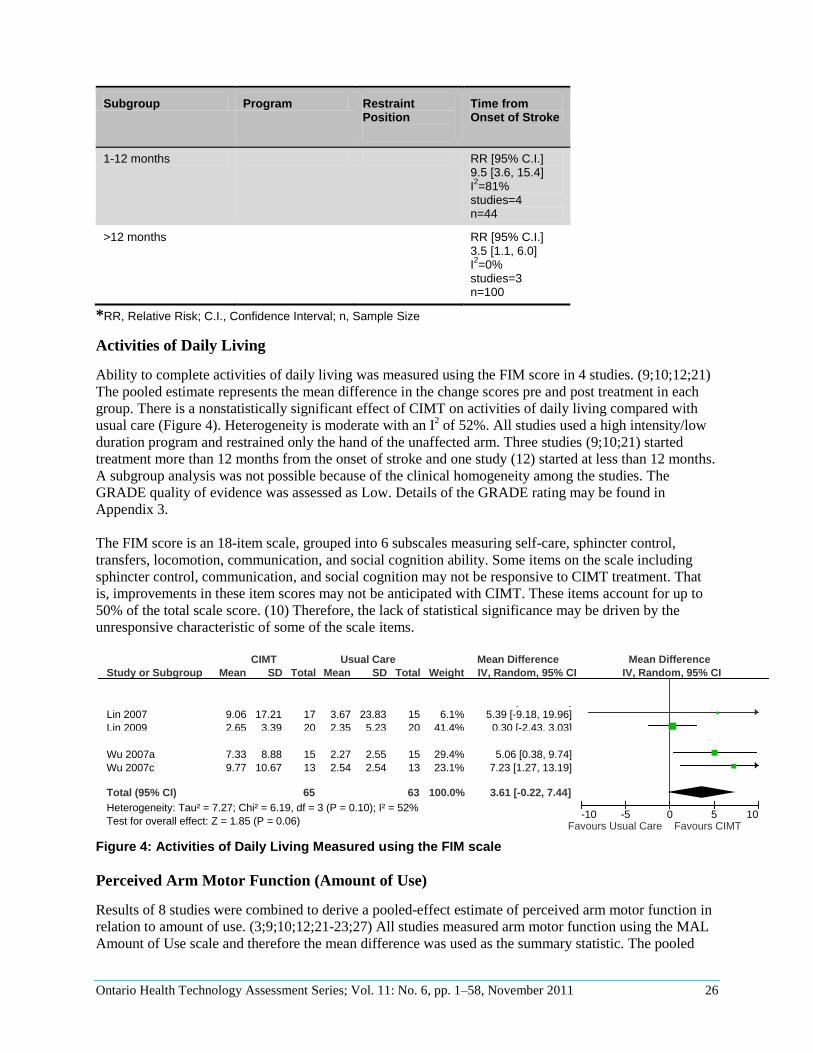
Ability to complete activities of daily living was measured using the FIM score in 4 studies. (9;10;12;21)
The pooled estimate represents the mean difference in the change scores pre and post treatment in each
group. There is a nonstatistically significant effect of CIMT on activities of daily living compared with
usual care (Figure 4). Heterogeneity is moderate with an I2 of 52%. All studies used a high intensity/low
duration program and restrained only the hand of the unaffected arm. Three studies (9;10;21) started
treatment more than 12 months from the onset of stroke and one study (12) started at less than 12 months.
A subgroup analysis was not possible because of the clinical homogeneity among the studies. The
GRADE quality of evidence was assessed as Low. Details of the GRADE rating may be found in
Appendix 3.
The FIM score is an 18-item scale, grouped into 6 subscales measuring self-care, sphincter control,
transfers, locomotion, communication, and social cognition ability. Some items on the scale including
sphincter control, communication, and social cognition may not be responsive to CIMT treatment. That
is, improvements in these item scores may not be anticipated with CIMT. These items account for up to
50% of the total scale score. (10) Therefore, the lack of statistical significance may be driven by the
unresponsive characteristic of some of the scale items.
Figure 4: Activities of Daily Living Measured using the FIM scale
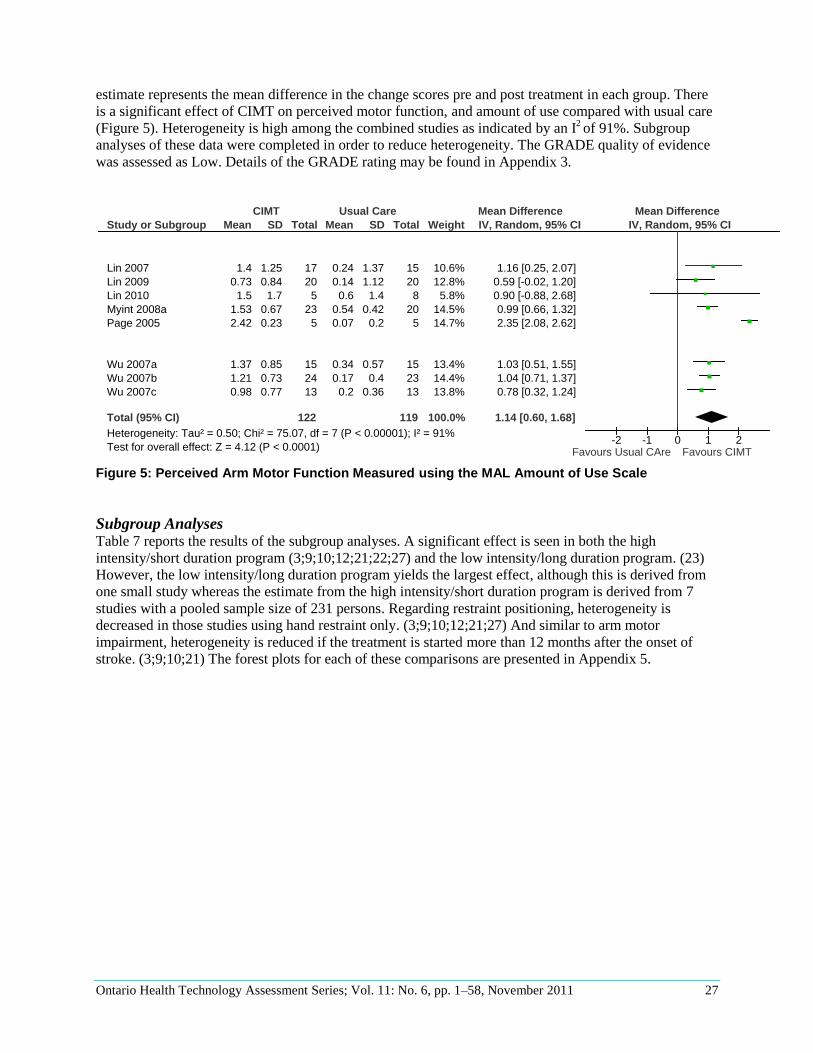
Perceived Arm Motor Function (Amount of Use)
Results of 8 studies were combined to derive a pooled-effect estimate of perceived arm motor function in
relation to amount of use. (3;9;10;12;21-23;27) All studies measured arm motor function using the MAL
Amount of Use scale and therefore the mean difference was used as the summary statistic. The pooled
Study or Subgroup
Dahl 2008
Dromerick 2009
Lin 2007
Lin 2009
Myint 2008a
Wu 2007a
Wu 2007c
Total (95% CI)
Heterogeneity: Tau² = 7.27; Chi² = 6.19, df = 3 (P = 0.10); I² = 52%
Test for overall effect: Z = 1.85 (P = 0.06)
Mean
1.16
5.39
9.06
2.65
5.9
7.33
9.77
SD
12.26
5.54
17.21
3.39
5.7
8.88
10.67
Total
18
35
17
20
23
15
13
65
Mean
0.75
7.35
3.67
2.35
5.8
2.27
2.54
SD
8.73
4.84
23.83
5.23
7.3
2.55
2.54
Total
12
17
15
20
20
15
13
63
Weight
0.0%
0.0%
6.1%
41.4%
0.0%
29.4%
23.1%
100.0%
IV, Random, 95% CI
0.41 [-7.10, 7.92]
-1.96 [-4.90, 0.98]
5.39 [-9.18, 19.96]
0.30 [-2.43, 3.03]
0.10 [-3.86, 4.06]
5.06 [0.38, 9.74]
7.23 [1.27, 13.19]
3.61 [-0.22, 7.44]
CIMT Usual Care Mean Difference Mean Difference
IV, Random, 95% CI
-10 -5 0 5 10Favours Usual Care Favours CIMT
Ontario Health Technology Assessment Series; Vol. 11: No. 6, pp. 1–58, November 2011 27
estimate represents the mean difference in the change scores pre and post treatment in each group. There
is a significant effect of CIMT on perceived motor function, and amount of use compared with usual care
(Figure 5). Heterogeneity is high among the combined studies as indicated by an I2 of 91%. Subgroup
analyses of these data were completed in order to reduce heterogeneity. The GRADE quality of evidence
was assessed as Low. Details of the GRADE rating may be found in Appendix 3.
Figure 5: Perceived Arm Motor Function Measured using the MAL Amount of Use Scale
Subgroup Analyses Table 7 reports the results of the subgroup analyses. A significant effect is seen in both the high
intensity/short duration program (3;9;10;12;21;22;27) and the low intensity/long duration program. (23)
However, the low intensity/long duration program yields the largest effect, although this is derived from
one small study whereas the estimate from the high intensity/short duration program is derived from 7
studies with a pooled sample size of 231 persons. Regarding restraint positioning, heterogeneity is
decreased in those studies using hand restraint only. (3;9;10;12;21;27) And similar to arm motor
impairment, heterogeneity is reduced if the treatment is started more than 12 months after the onset of
stroke. (3;9;10;21) The forest plots for each of these comparisons are presented in Appendix 5.
Study or Subgroup
Boake 2007
Dahl 2008
Lin 2007
Lin 2009
Lin 2010
Myint 2008a
Page 2005
Wittenberg 2003
Wolf 2006
Wu 2007a
Wu 2007b
Wu 2007c
Total (95% CI)
Heterogeneity: Tau² = 0.50; Chi² = 75.07, df = 7 (P < 0.00001); I² = 91%
Test for overall effect: Z = 4.12 (P < 0.0001)
Mean
1.73
0.56
1.4
0.73
1.5
1.53
2.42
1.08
1.15
1.37
1.21
0.98
SD
1.47
1.68
1.25
0.84
1.7
0.67
0.23
0.42
0.65
0.85
0.73
0.77
Total
9
18
17
20
5
23
5
9
98
15
24
13
122
Mean
1.25
0.78
0.24
0.14
0.6
0.54
0.07
-0.01
0.29
0.34
0.17
0.2
SD
1.67
1.66
1.37
1.12
1.4
0.42
0.2
0.48
0.56
0.57
0.4
0.36
Total
13
12
15
20
8
20
5
7
103
15
23
13
119
Weight
0.0%
0.0%
10.6%
12.8%
5.8%
14.5%
14.7%
0.0%
0.0%
13.4%
14.4%
13.8%
100.0%
IV, Random, 95% CI
0.48 [-0.84, 1.80]
-0.22 [-1.44, 1.00]
1.16 [0.25, 2.07]
0.59 [-0.02, 1.20]
0.90 [-0.88, 2.68]
0.99 [0.66, 1.32]
2.35 [2.08, 2.62]
1.09 [0.64, 1.54]
0.86 [0.69, 1.03]
1.03 [0.51, 1.55]
1.04 [0.71, 1.37]
0.78 [0.32, 1.24]
1.14 [0.60, 1.68]
CIMT Usual Care Mean Difference Mean Difference
IV, Random, 95% CI
-2 -1 0 1 2Favours Usual CAre Favours CIMT
Ontario Health Technology Assessment Series; Vol. 11: No. 6, pp. 1–58, November 2011 28
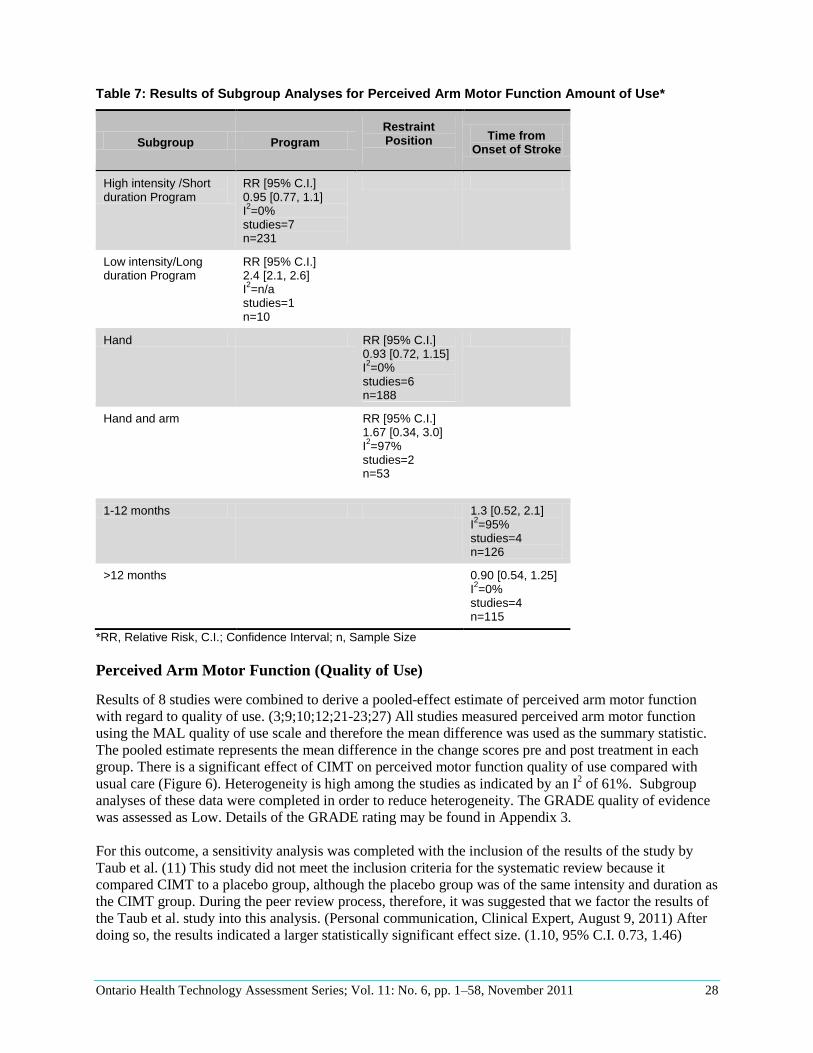
Table 7: Results of Subgroup Analyses for Perceived Arm Motor Function Amount of Use*
Subgroup Program
Restraint Position
Time from Onset of Stroke
High intensity /Short duration Program
RR [95% C.I.] 0.95 [0.77, 1.1] I2=0%
studies=7 n=231
Low intensity/Long duration Program
RR [95% C.I.] 2.4 [2.1, 2.6] I2=n/a
studies=1 n=10
Hand RR [95% C.I.] 0.93 [0.72, 1.15] I2=0%
studies=6 n=188
Hand and arm RR [95% C.I.] 1.67 [0.34, 3.0] I2=97%
studies=2 n=53
1-12 months 1.3 [0.52, 2.1] I2=95%
studies=4 n=126
>12 months
0.90 [0.54, 1.25] I2=0%
studies=4 n=115
*RR, Relative Risk, C.I.; Confidence Interval; n, Sample Size
Perceived Arm Motor Function (Quality of Use)
Results of 8 studies were combined to derive a pooled-effect estimate of perceived arm motor function
with regard to quality of use. (3;9;10;12;21-23;27) All studies measured perceived arm motor function
using the MAL quality of use scale and therefore the mean difference was used as the summary statistic.
The pooled estimate represents the mean difference in the change scores pre and post treatment in each
group. There is a significant effect of CIMT on perceived motor function quality of use compared with
usual care (Figure 6). Heterogeneity is high among the studies as indicated by an I2 of 61%. Subgroup
analyses of these data were completed in order to reduce heterogeneity. The GRADE quality of evidence
was assessed as Low. Details of the GRADE rating may be found in Appendix 3.
For this outcome, a sensitivity analysis was completed with the inclusion of the results of the study by
Taub et al. (11) This study did not meet the inclusion criteria for the systematic review because it
compared CIMT to a placebo group, although the placebo group was of the same intensity and duration as
the CIMT group. During the peer review process, therefore, it was suggested that we factor the results of
the Taub et al. study into this analysis. (Personal communication, Clinical Expert, August 9, 2011) After
doing so, the results indicated a larger statistically significant effect size. (1.10, 95% C.I. 0.73, 1.46)
Ontario Health Technology Assessment Series; Vol. 11: No. 6, pp. 1–58, November 2011 29
Figure 6: Perceived Arm Motor Function Measured using the MAL Quality of Use Subscale
Subgroup Analyses
Table 8 reports the results of the subgroup analyses. As previously reported for the amount of use scale, a
significant effect in quality of use is seen in both the high intensity/short duration program
(3;9;10;12;21;22;27) and the low intensity/long duration program. (23) However, while the low
intensity/long duration program yields the largest effect, this is derived from one small study, whereas the
estimate from the high intensity/short duration program is derived from 7 studies with a pooled sample
size of 231 persons. Similar to the amount of use scale, heterogeneity is decreased in those studies using
hand restraint only. (3;9;10;12;21;27) And similar to arm motor impairment and perceived arm motor
function amount of use subscales, heterogeneity is reduced if the treatment is started more than 12 months
after the onset of stroke. (3;9;10;21) The forest plots for each of these comparisons are presented in
Appendix 6.
Table 8: Results of Subgroup Analyses for Perceived Arm Motor Function Quality of Use*
Subgroup Program
Restraint Position
Time from Onset of Stroke
High intensity /Short duration Program
RR [95% C.I.] 0.84 [ 0.64, 1.1] I2=1%
studies=7 n=231
Low intensity/Long duration Program
RR [95% C.I.] 1.5 [1.1, 1.9] I2=n/a
studies=1 n=10
Hand RR [95% C.I.] 0.96 [ 0.73, 1.2] I2=0%
studies=6 n=188
Study or Subgroup
Boake 2007
Dahl 2008
Lin 2007
Lin 2009
Lin 2010
Myint 2008a
Page 2005
Wolf 2006
Wu 2007a
Wu 2007b
Wu 2007c
Total (95% CI)
Heterogeneity: Tau² = 0.08; Chi² = 15.25, df = 7 (P = 0.03); I² = 54%
Test for overall effect: Z = 6.59 (P < 0.00001)
Mean
1.59
0.51
1.55
0.94
1.7
1.33
1.85
1.04
1.11
1.13
1.2
SD
1.29
0.95
1.39
0.8
1.5
0.56
0.41
0.6
0.83
0.72
0.85
Total
9
18
17
20
5
23
5
98
15
24
13
122
Mean
1.05
0.24
0.21
0.26
0.5
0.89
0.34
0.31
0.3
0.14
0.14
SD
1.49
1.41
1.48
1.24
1.4
0.84
0.14
0.52
0.78
0.52
0.37
Total
13
12
15
20
8
20
5
103
15
23
13
119
Weight
0.0%
0.0%
6.3%
11.2%
2.8%
16.3%
17.8%
0.0%
12.7%
18.4%
14.4%
100.0%
IV, Random, 95% CI
0.54 [-0.63, 1.71]
0.27 [-0.64, 1.18]
1.34 [0.34, 2.34]
0.68 [0.03, 1.33]
1.20 [-0.43, 2.83]
0.44 [0.01, 0.87]
1.51 [1.13, 1.89]
0.73 [0.57, 0.89]
0.81 [0.23, 1.39]
0.99 [0.63, 1.35]
1.06 [0.56, 1.56]
0.97 [0.68, 1.26]
CIMT Usual Care Mean Difference Mean Difference
IV, Random, 95% CI
-4 -2 0 2 4Favours Usual Care Favours CIMT
Ontario Health Technology Assessment Series; Vol. 11: No. 6, pp. 1–58, November 2011 30
Subgroup Program
Restraint Position
Time from Onset of Stroke
Hand and arm RR [95% C.I.] .98[-.07, 2.0] I2=92%
studies=2 n=53
1-12 months RR [95% C.I.] 1.0 [0.6, 1.4] I2=77%
studies=4 n=126
>12 months
RR [95% C.I.] 0.86 [0.48, 1.3] I2=0%
studies=4 n=115
*RR, Relative Risk; C.I., Confidence Interval; n, Sample Size
Quality of Life
Two studies measured quality of life but with different versions of the SIS. (10;12) Data were not
available to analyze the change scores. Figure 1 reports the mean difference in the final values (post
treatment values) in each study for each treatment group. The study by Wu et al. (12) included persons
with a mean age of 72 years and a mean time after stroke of 8 months, whereas the study by Lin et al. (10)
included persons with a mean age of 53 years who were 21 months poststroke. Both studies were
completed in Taiwan. There is a nonstatistically significant difference in quality of life reported in the Wu
et al. (12) study and a statistically significant difference reported in the Lin et al. (10) study (Figure 7).
The GRADE quality of evidence was assessed as very low. Details of the GRADE rating may be found in
Appendix 3.
Figure 7: Quality of Life Measured Using the SIS
Study or Subgroup
1.6.1 SIS Version 2
Wu 2007cSubtotal (95% CI)
Heterogeneity: Not applicable
Test for overall effect: Z = 0.29 (P = 0.77)
1.6.2 SIS version 3
Lin 2009Subtotal (95% CI)
Heterogeneity: Not applicable
Test for overall effect: Z = 2.21 (P = 0.03)
Total (95% CI)
Heterogeneity: Tau² = 28.96; Chi² = 2.53, df = 1 (P = 0.11); I² = 60%
Test for overall effect: Z = 0.81 (P = 0.42)
Mean
62.22
73.29
SD
8.71
10.78
Total
1313
2020
33
Mean
63.64
64.92
SD
15.18
13.08
Total
1313
2020
33
Weight
45.2%45.2%
54.8%54.8%
100.0%
IV, Random, 95% CI
-1.42 [-10.93, 8.09]-1.42 [-10.93, 8.09]
8.37 [0.94, 15.80]8.37 [0.94, 15.80]
3.94 [-5.61, 13.49]
Experimental Control Mean Difference Mean Difference
IV, Random, 95% CI
-50 -25 0 25 50Favours usual care Favours CIMT
Ontario Health Technology Assessment Series; Vol. 11: No. 6, pp. 1–58, November 2011 31
Summary of Findings
A significant difference with moderate quality evidence was found in our primary outcome of arm motor
function in favour of CIMT compared with usual care delivered with the same intensity and duration.
Significant differences were also found in 3 of the 5 secondary outcome measures (Table 9). The
nonsignificant results may be a factor of a nonresponsive outcome measure (FIM scale) and/or a type II
statistical error from an inadequate sample size.
Subgroup analyses identified that starting treatment more than 12 months poststroke may be more
effective than starting earlier. However, the effect of the primary outcome was demonstrated in persons
starting treatment 1 to 12 months after stroke. Therefore, these data cannot be used to determine whether
CIMT is more effective if initiated at a particular time period. A superior effect of a low intensity/long
duration program was not demonstrated in subgroup analysis over a high intensity/short duration
program. The superiority of one restraining position over another was also not demonstrated.
Table 9: Summary of Meta-analysis Results*
Outcome Outcome Measure
Number of
Studies
(n)
Mean Difference in Change
Scores
CIMT vs. Usual Care
[95% C.I.]
Results Grade
Quality of Evidence
Arm Motor Function ARAT 4
(43)
13.6
[8.7, 18.6]
Significant Moderate
Arm Motor Impairment FMA 8 (169)
6.5 [2.3, 10.7]
Significant Low
Activities of Daily Living FIM 4 (128)
3.6 [-0.22, 7.4]
Nonsignificant Low
Self-Reported Amount of Arm Use
Perceived Arm Motor Function Amount of Use Scale
8 (241)
1.1 [0.60, 1.7]
Significant Low
Self-Reported Quality of Arm Use
Perceived Arm Motor Function (Quality of Use) Scale
8 (241)
0.97 [0.7, 1.3]
Significant Low
Quality of Life SIS 2 (66)
3.9 [-5.6, 13.5]
Nonsignificant Very Low
*C.I., Confidence Interval; n, Sample Size
Ontario Health Technology Assessment Series; Vol. 11: No. 6, pp. 1–58, November 2011 32
Existing Guidelines for CIMT
Canadian Best Practice Recommendations for Stroke Care
Update 2010
Intensive Constraint-Induced Movement Therapy (CIMT) should not be used for persons in the first
month poststroke until further research is completed.
Consider the use of intensive CIMT for a select group of patients who demonstrate at least 20 degrees of
wrist extension and 10 degrees of finger extension, with minimal sensory or cognitive deficits. Intensive
training should involve restraint of the unaffected arm for at least 90% of waking hours and at least 6
hours a day of intense upper extremity training of the affected arm for 2 weeks.
Consider the use of modified CIMT for a select group of patients who demonstrate at least 20 degrees of
wrist extension and 10 degrees of finger extension, with minimal sensory or cognitive deficits. Modified
CIMT consists of constraint of the unaffected arm with a padded mitt or arm sling for a minimum of 6
hours a day with 2 hours of therapy for 14 days.
Ontario Health Technology Assessment Series; Vol. 11: No. 6, pp. 1–58, November 2011 33
Economic Analysis
Study Question
The objective of this economic analysis is to report costs associated with Constraint-Induced Movement
Therapy (CIMT) for rehabilitation of arm dysfunction after stroke in adults in Ontario.
Economic Literature Review
A literature search was performed on February 14, 2011 using OVID MEDLINE, MEDLINE In-Process
and Other Non-Indexed Citations, OVID EMBASE, Wiley Cochrane, CINAHL, and Centre for Reviews
and Dissemination for studies published from 1948 to February week 1, 2011 for MEDLINE; and from
1980 to week 06, 2011 for EMBASE (Appendix 1). Included were studies with full economic evaluations
describing both costs and consequences of CIMT and brain or spine injury, or stroke or cerebrovascular
accident. The set of search keywords used was the same as that for the clinical systematic review
comprising the first part of this evidence-based analysis. According to the clinical systematic review, one
health economic evaluation was found comparing the relative cost-effectiveness of CIMT for
rehabilitation of arm dysfunction in adult stroke patients.
The study by French et al. (18) in 2008 found that “repetitive functional task practice” which included
repetitive task training, treadmill training, and constraint-induced movement therapy, was cost-effective
in the United Kingdom at an incremental cost-effectiveness ratio (ICER) of 10,870 GBP per quality-
adjusted life year (QALY), provided the net cost per patient was less than 1,963 GBP per QALY. (15)
The cost-effectiveness of arm function specifically was calculated as being 15,185 GBP per QALY,
which is also considered cost-effective at a willingness-to-pay threshold of 20,000 GBP. The study
compared the additional costs of RFTP together with standard care versus standard care alone. However,
the study had several limitations. These included the fact that it was based on stroke patient registries
from only 2 hospitals in the United Kingdom in 1996 (i.e., limited generalizability); it used the Barthel
Index (BI) to estimate overall QALY gains for stroke patients i.e., outcome not specific to arm
dysfunction and based on one study linking BI with EQ-5D (a self-reported generic preference-based
measure of health, developed by the EuroQol Group in the Netherlands)¸ (28); and it only calculated
differences in costs and effects over 3 years (i.e., long-term costs were not considered). Note that in the
current analysis, only the incremental costs associated with providing CIMT in addition to “standard” arm
dysfunction stroke rehabilitation care in Ontario are examined below.
Ontario-Based Cost Impact Analysis
The 2010 Stroke Evaluation Report by the Institute for Clinical Evaluative Sciences found that
approximately 30% of strokes or transient ischemic attacks (TIAs) were treated with stroke rehabilitation
care in an inpatient setting, although some experts predicted this proportion should be closer to 40%. (4)
The remaining 60%-70% of stroke patients may have received rehabilitation care in an outpatient setting,
but the report is unclear about the actual care received by these patients. Note that as a result, the current
cost impact analysis was based only on inpatient stroke cases and the care received is specifically for arm
dysfunction rehabilitation.
The annual number of stroke or TIA inpatients in Ontario in fiscal year (FY) 2011 was estimated from the
2010 ICES Report as being 15,514. This volume of patients was based on stable annual numbers of
strokes or TIA inpatients found in Ontario from FY2004 to FY2007. (4) Clinical experts estimated that
approximately 40% of stroke inpatients would require rehabilitation for arm dysfunction and about
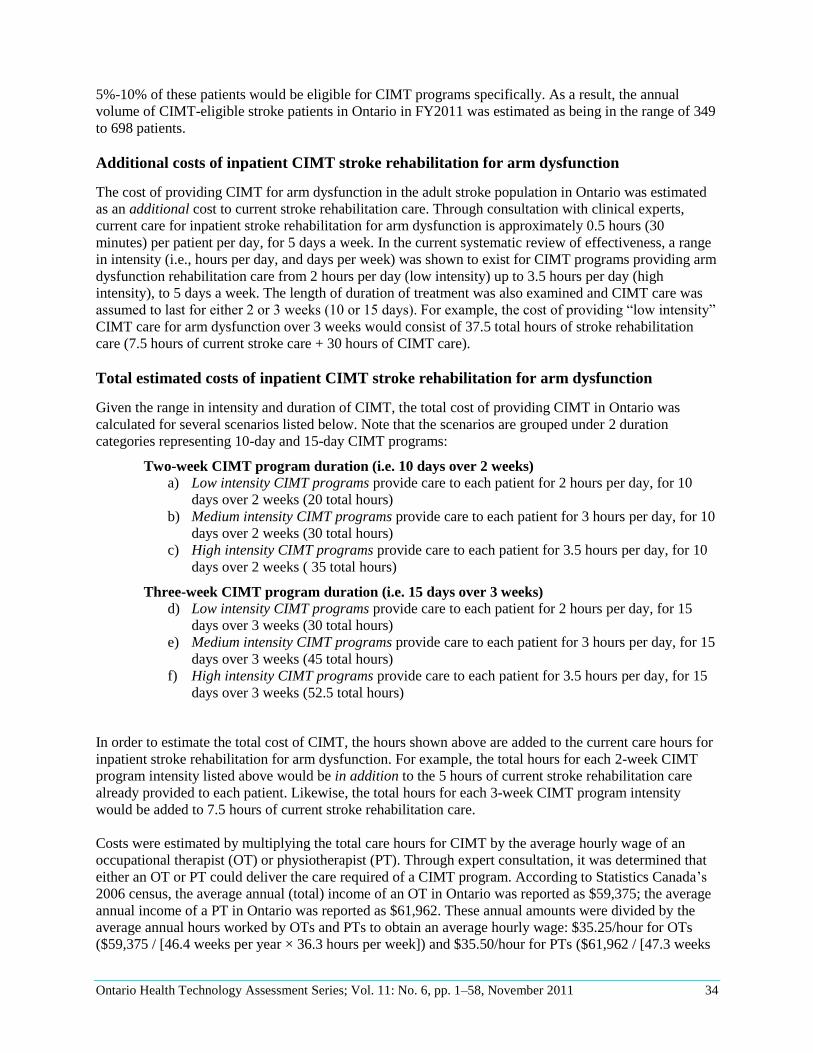
Ontario Health Technology Assessment Series; Vol. 11: No. 6, pp. 1–58, November 2011 34
5%-10% of these patients would be eligible for CIMT programs specifically. As a result, the annual
volume of CIMT-eligible stroke patients in Ontario in FY2011 was estimated as being in the range of 349
to 698 patients.
Additional costs of inpatient CIMT stroke rehabilitation for arm dysfunction
The cost of providing CIMT for arm dysfunction in the adult stroke population in Ontario was estimated
as an additional cost to current stroke rehabilitation care. Through consultation with clinical experts,
current care for inpatient stroke rehabilitation for arm dysfunction is approximately 0.5 hours (30
minutes) per patient per day, for 5 days a week. In the current systematic review of effectiveness, a range
in intensity (i.e., hours per day, and days per week) was shown to exist for CIMT programs providing arm
dysfunction rehabilitation care from 2 hours per day (low intensity) up to 3.5 hours per day (high
intensity), to 5 days a week. The length of duration of treatment was also examined and CIMT care was
assumed to last for either 2 or 3 weeks (10 or 15 days). For example, the cost of providing “low intensity”
CIMT care for arm dysfunction over 3 weeks would consist of 37.5 total hours of stroke rehabilitation
care (7.5 hours of current stroke care + 30 hours of CIMT care).
Total estimated costs of inpatient CIMT stroke rehabilitation for arm dysfunction
Given the range in intensity and duration of CIMT, the total cost of providing CIMT in Ontario was
calculated for several scenarios listed below. Note that the scenarios are grouped under 2 duration
categories representing 10-day and 15-day CIMT programs:
Two-week CIMT program duration (i.e. 10 days over 2 weeks)
a) Low intensity CIMT programs provide care to each patient for 2 hours per day, for 10
days over 2 weeks (20 total hours)
b) Medium intensity CIMT programs provide care to each patient for 3 hours per day, for 10
days over 2 weeks (30 total hours)
c) High intensity CIMT programs provide care to each patient for 3.5 hours per day, for 10
days over 2 weeks ( 35 total hours)
Three-week CIMT program duration (i.e. 15 days over 3 weeks)
d) Low intensity CIMT programs provide care to each patient for 2 hours per day, for 15
days over 3 weeks (30 total hours)
e) Medium intensity CIMT programs provide care to each patient for 3 hours per day, for 15
days over 3 weeks (45 total hours)
f) High intensity CIMT programs provide care to each patient for 3.5 hours per day, for 15
days over 3 weeks (52.5 total hours)
In order to estimate the total cost of CIMT, the hours shown above are added to the current care hours for
inpatient stroke rehabilitation for arm dysfunction. For example, the total hours for each 2-week CIMT
program intensity listed above would be in addition to the 5 hours of current stroke rehabilitation care
already provided to each patient. Likewise, the total hours for each 3-week CIMT program intensity
would be added to 7.5 hours of current stroke rehabilitation care.
Costs were estimated by multiplying the total care hours for CIMT by the average hourly wage of an
occupational therapist (OT) or physiotherapist (PT). Through expert consultation, it was determined that
either an OT or PT could deliver the care required of a CIMT program. According to Statistics Canada’s
2006 census, the average annual (total) income of an OT in Ontario was reported as $59,375; the average
annual income of a PT in Ontario was reported as $61,962. These annual amounts were divided by the
average annual hours worked by OTs and PTs to obtain an average hourly wage: $35.25/hour for OTs
($59,375 / [46.4 weeks per year × 36.3 hours per week]) and $35.50/hour for PTs ($61,962 / [47.3 weeks
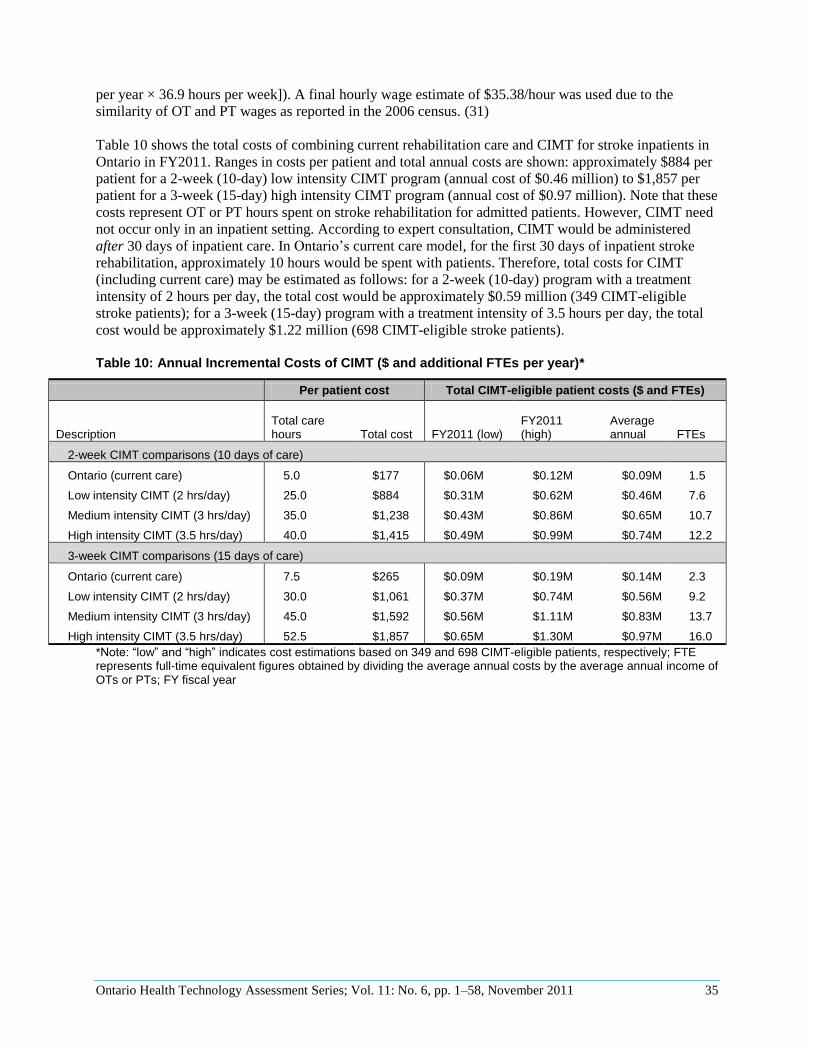
Ontario Health Technology Assessment Series; Vol. 11: No. 6, pp. 1–58, November 2011 35
per year × 36.9 hours per week]). A final hourly wage estimate of $35.38/hour was used due to the
similarity of OT and PT wages as reported in the 2006 census. (31)
Table 10 shows the total costs of combining current rehabilitation care and CIMT for stroke inpatients in
Ontario in FY2011. Ranges in costs per patient and total annual costs are shown: approximately $884 per
patient for a 2-week (10-day) low intensity CIMT program (annual cost of $0.46 million) to $1,857 per
patient for a 3-week (15-day) high intensity CIMT program (annual cost of $0.97 million). Note that these
costs represent OT or PT hours spent on stroke rehabilitation for admitted patients. However, CIMT need
not occur only in an inpatient setting. According to expert consultation, CIMT would be administered
after 30 days of inpatient care. In Ontario’s current care model, for the first 30 days of inpatient stroke
rehabilitation, approximately 10 hours would be spent with patients. Therefore, total costs for CIMT
(including current care) may be estimated as follows: for a 2-week (10-day) program with a treatment
intensity of 2 hours per day, the total cost would be approximately $0.59 million (349 CIMT-eligible
stroke patients); for a 3-week (15-day) program with a treatment intensity of 3.5 hours per day, the total
cost would be approximately $1.22 million (698 CIMT-eligible stroke patients).
Table 10: Annual Incremental Costs of CIMT ($ and additional FTEs per year)*
Per patient cost Total CIMT-eligible patient costs ($ and FTEs)
Description Total care hours Total cost FY2011 (low)
FY2011 (high)
Average annual FTEs
2-week CIMT comparisons (10 days of care)
Ontario (current care) 5.0 $177 $0.06M $0.12M $0.09M 1.5
Low intensity CIMT (2 hrs/day) 25.0 $884 $0.31M $0.62M $0.46M 7.6
Medium intensity CIMT (3 hrs/day) 35.0 $1,238 $0.43M $0.86M $0.65M 10.7
High intensity CIMT (3.5 hrs/day) 40.0 $1,415 $0.49M $0.99M $0.74M 12.2
3-week CIMT comparisons (15 days of care)
Ontario (current care) 7.5 $265 $0.09M $0.19M $0.14M 2.3
Low intensity CIMT (2 hrs/day) 30.0 $1,061 $0.37M $0.74M $0.56M 9.2
Medium intensity CIMT (3 hrs/day) 45.0 $1,592 $0.56M $1.11M $0.83M 13.7
High intensity CIMT (3.5 hrs/day) 52.5 $1,857 $0.65M $1.30M $0.97M 16.0
*Note: “low” and “high” indicates cost estimations based on 349 and 698 CIMT-eligible patients, respectively; FTE represents full-time equivalent figures obtained by dividing the average annual costs by the average annual income of OTs or PTs; FY fiscal year
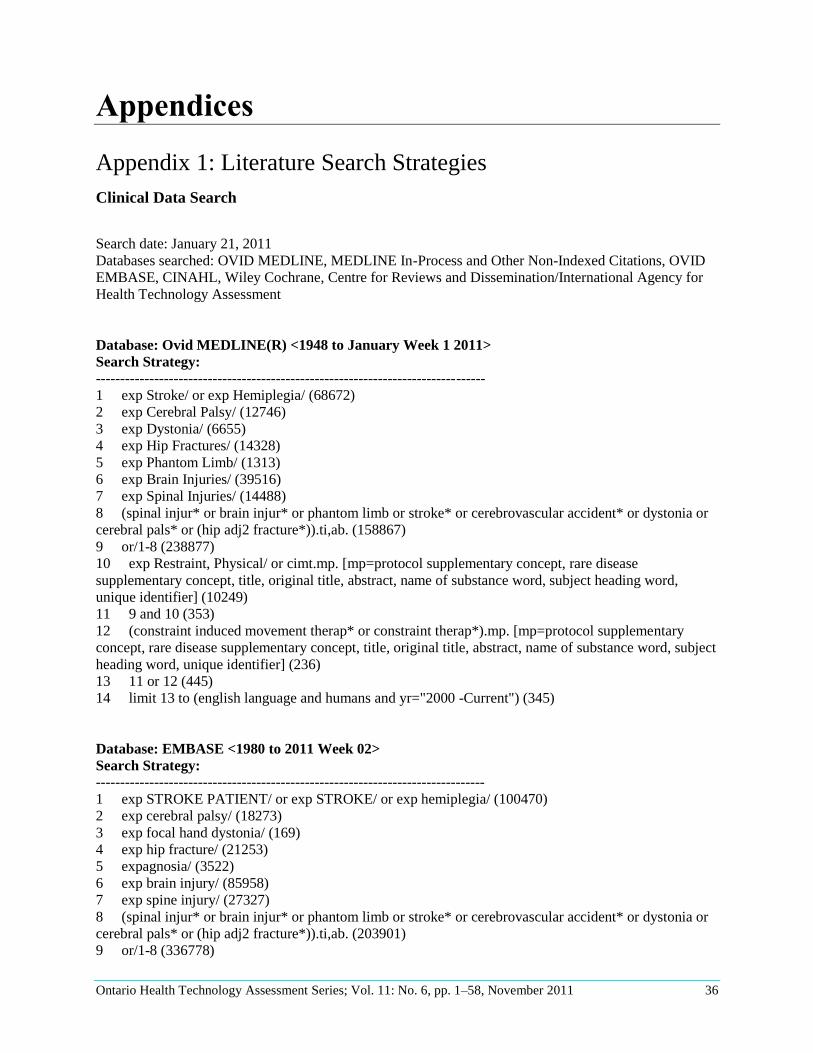
Ontario Health Technology Assessment Series; Vol. 11: No. 6, pp. 1–58, November 2011 36
Appendices
Appendix 1: Literature Search Strategies
Clinical Data Search
Search date: January 21, 2011
Databases searched: OVID MEDLINE, MEDLINE In-Process and Other Non-Indexed Citations, OVID
EMBASE, CINAHL, Wiley Cochrane, Centre for Reviews and Dissemination/International Agency for
Health Technology Assessment
Database: Ovid MEDLINE(R) <1948 to January Week 1 2011>
Search Strategy:
--------------------------------------------------------------------------------
1 exp Stroke/ or exp Hemiplegia/ (68672)
2 exp Cerebral Palsy/ (12746)
3 exp Dystonia/ (6655)
4 exp Hip Fractures/ (14328)
5 exp Phantom Limb/ (1313)
6 exp Brain Injuries/ (39516)
7 exp Spinal Injuries/ (14488)
8 (spinal injur* or brain injur* or phantom limb or stroke* or cerebrovascular accident* or dystonia or
cerebral pals* or (hip adj2 fracture*)).ti,ab. (158867)
9 or/1-8 (238877)
10 exp Restraint, Physical/ or cimt.mp. [mp=protocol supplementary concept, rare disease
supplementary concept, title, original title, abstract, name of substance word, subject heading word,
unique identifier] (10249)
11 9 and 10 (353)
12 (constraint induced movement therap* or constraint therap*).mp. [mp=protocol supplementary
concept, rare disease supplementary concept, title, original title, abstract, name of substance word, subject
heading word, unique identifier] (236)
13 11 or 12 (445)
14 limit 13 to (english language and humans and yr="2000 -Current") (345)
Database: EMBASE <1980 to 2011 Week 02>
Search Strategy:
--------------------------------------------------------------------------------
1 exp STROKE PATIENT/ or exp STROKE/ or exp hemiplegia/ (100470)
2 exp cerebral palsy/ (18273)
3 exp focal hand dystonia/ (169)
4 exp hip fracture/ (21253)
5 expagnosia/ (3522)
6 exp brain injury/ (85958)
7 exp spine injury/ (27327)
8 (spinal injur* or brain injur* or phantom limb or stroke* or cerebrovascular accident* or dystonia or
cerebral pals* or (hip adj2 fracture*)).ti,ab. (203901)
9 or/1-8 (336778)
Ontario Health Technology Assessment Series; Vol. 11: No. 6, pp. 1–58, November 2011 37
10 exp movement therapy/ or cimt.mp. [mp=title, abstract, subject headings, heading word, drug trade
name, original title, device manufacturer, drug manufacturer] (1691)
11 9 and 10 (491)
12 exp constraint induced therapy/ (220)
13 (constraint induced movement therap* or constraint therap*).mp. [mp=title, abstract, subject
headings, heading word, drug trade name, original title, device manufacturer, drug manufacturer] (348)
14 11 or 12 or 13 (694)
15 limit 14 to (human and english language and yr="2000 -Current") (523)
CINAHL
Top of Form
# Query Results
S18 S15 OR S16
Limiters- Published Date from: 20000101-20111231; English Language 276
S17 S15 or S16 310
S16 constraint induced movement therap* or constraint therap* 222
S15 S11 and S14 189
S14 S12 or S13 2668
S13 Cimt 165
S12 (MH "Restraint, Physical") 2507
S11 S1 or S2 or S3 or S4 or S5 or S6 or S7 or S8 or S9 or S10 66181
S10 (spinal injur* or brain injur* or phantom limb or stroke* or cerebrovascular accident* or
dystonia or cerebral pals* or (hip NEAR fracture*)) 61071
S9 (MH "Spinal Injuries+") 3074
S8 (MH "Brain Injuries+") 10361
S7 (MH "Phantom Pain") 209
S6 (MH "Phantom Limb") 196
S5 (MH "Hip Fractures") 2890
S4 (MH "Focal Hand Dystonia") 177
S3 (MH "Cerebral Palsy") 4296
S2 (MH "Hemiplegia") 2355
S1 (MH "Stroke") OR (MH "Stroke Patients") 22887
Ontario Health Technology Assessment Series; Vol. 11: No. 6, pp. 1–58, November 2011 38
Economics Data Search
Search date: February 14, 2011
Databases searched: OVID MEDLINE, MEDLINE In-Process and Other Non-Indexed Citations, OVID
EMBASE, CINAHL, Wiley Cochrane, Centre for Reviews and Dissemination/International Agency for
Health Technology Assessment
Database: Ovid MEDLINE(R) <1948 to February week 1 2011>
Search Strategy:
-------------------------------------------------------------------------------- 1 exp Stroke/ or exp Hemiplegia/ (69176) 2 exp Cerebral Palsy/ (12817) 3 exp Dystonia/ (6676) 4 exp Hip Fractures/ (14399) 5 exp Phantom Limb/ (1320) 6 exp Brain Injuries/ (39685) 7 exp Spinal Injuries/ (14580) 8 (spinal injur* or brain injur* or phantom limb or stroke* or cerebrovascular accident* or dystonia or cerebral pals* or (hip adj2 fracture*)).ti,ab. (159918) 9 or/1-8 (240214) 10 exp Restraint, Physical/ or cimt.mp. [mp=protocol supplementary concept, rare disease supplementary concept, title, original title, abstract, name of substance word, subject heading word, unique identifier] (10299) 11 9 and 10 (356) 12 (constraint induced movement therap* or constraint therap*).mp. [mp=protocol supplementary concept, rare disease supplementary concept, title, original title, abstract, name of substance word, subject heading word, unique identifier] (239) 13 11 or 12 (448) 14 limit 13 to (english language and humans and yr="2000 -Current") (348) 15 exp Economics/ (426503) 16 exp Models, Economic/ (7555) 17 exp Resource Allocation/ (13390) 18 exp "Value of Life"/ or exp "Quality of Life"/ (90377) 19 (econom$ or cost$ or budget$ or pharmacoeconomic$ or pharmaco-economic$ or valu$).ti. (190156) 20 ec.fs. (275839) 21 ((cost$ adj benefit$) or costbenefit$ or (cost adj effective$) or costeffective$ or econometric$ or life value or quality-adjusted life year$ or quality adjusted life year$ or quality-adjusted life expectanc$ or quality adjusted life expectanc$ or sensitivity analys$ or "value of life" or "willingness to pay").ti,ab. (65657) 22 or/15-21 (731258) 23 13 and 22 (24) 24 limit 23 to (english language and yr="2000 -Current") (19)
Ontario Health Technology Assessment Series; Vol. 11: No. 6, pp. 1–58, November 2011 39
Database: EMBASE <1980 to 2011 Week 06> Search Strategy:
-------------------------------------------------------------------------------- 1 exp STROKE PATIENT/ or exp STROKE/ or exp hemiplegia/ (104145) 2 exp cerebral palsy/ (18498) 3 exp focal hand dystonia/ (175) 4 exp hip fracture/ (21437) 5 expagnosia/ (3545) 6 exp brain injury/ (86524) 7 exp spine injury/ (27511) 8 (spinal injur* or brain injur* or phantom limb or stroke* or cerebrovascular accident* or dystonia or cerebral pals* or (hip adj2 fracture*)).ti,ab. (207811) 9 or/1-8 (341967) 10 exp movement therapy/ or cimt.mp. [mp=title, abstract, subject headings, heading word, drug trade name, original title, device manufacturer, drug manufacturer] (1734) 11 9 and 10 (512) 12 exp constraint induced therapy/ (226) 13 (constraint induced movement therap* or constraint therap*).mp. [mp=title, abstract, subject headings, heading word, drug trade name, original title, device manufacturer, drug manufacturer] (365) 14 11 or 12 or 13 (721) 15 limit 14 to (human and english language and yr="2000 -Current") (529) 16 exp "Health Care Cost"/ (157193) 17 exp Health Economics/ (487916) 18 exp Resource Management/ (22761) 19 exp Economic Aspect/ or exp Economics/ or exp Quality Adjusted Life Year/ or exp Socioeconomics/ or exp Statistical Model/ or exp "Quality of Life"/ (1079733) 20 (econom$ or cost$ or budget$ or pharmacoeconomic$ or pharmaco-economic$ or valu$).ti. (223220) 21 ((cost$ adj benefit$) or costbenefit$ or (cost adj effective$) or costeffective$ or econometric$ or life value or quality-adjusted life year$ or quality adjusted life year$ or quality-adjusted life expectanc$ or quality adjusted life expectanc$ or sensitivity analys$ or "value of life" or "willingness to pay").ti,ab. (86283) 22 or/16-21 (1231577) 23 14 and 22 (80) 24 limit 23 to (english language and yr="2000 -Current") (77) CINAHL
# Query Results
S20 S18 and S19 116
S19
(MH "Economics+") or (MH "Resource Allocation+") or MW ec or (MH "Quality of
Life+") or (econom* or cost* or budget* or pharmacoeconomic* or pharmaco-economic*
or valu*) or ((cost* N1 benefit*) or costbenefit* or (cost N1 effective*) or costeffective* or
econometric* or life value or quality-adjusted life year* or quality adjusted life year* or
quality-adjusted life expectanc* or quality adjusted life expectanc* or sensitivity analys* or
"value of life" or "willingness to pay")
510393
S18 S15 OR S16
Limiters - Published Date from: 20000101-20111231; English Language 279
Ontario Health Technology Assessment Series; Vol. 11: No. 6, pp. 1–58, November 2011 40
S17 S15 or S16 313
S16 constraint induced movement therap* or constraint therap* 224
S15 S11 and S14 192
S14 S12 or S13 2691
S13 Cimt 169
S12 (MH "Restraint, Physical") 2526
S11 S1 or S2 or S3 or S4 or S5 or S6 or S7 or S8 or S9 or S10 66922
S10 (spinal injur* or brain injur* or phantom limb or stroke* or cerebrovascular accident* or
dystonia or cerebral pals* or (hip NEAR fracture*)) 61734
S9 (MH "Spinal Injuries+") 3113
S8 (MH "Brain Injuries+") 10515
S7 (MH "Phantom Pain") 213
S6 (MH "Phantom Limb") 203
S5 (MH "Hip Fractures") 2928
S4 (MH "Focal Hand Dystonia") 177
S3 (MH "Cerebral Palsy") 4354
S2 (MH "Hemiplegia") 2386
S1 (MH "Stroke") OR (MH "Stroke Patients") 23218
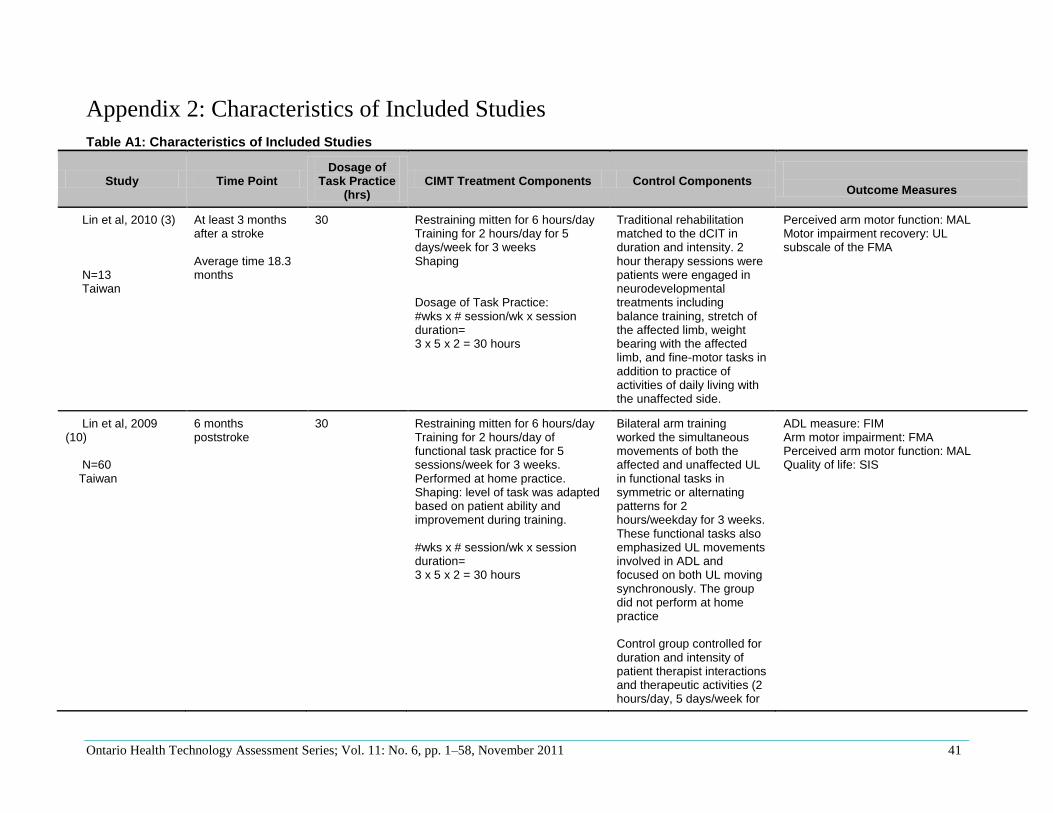
Ontario Health Technology Assessment Series; Vol. 11: No. 6, pp. 1–58, November 2011 41
Appendix 2: Characteristics of Included Studies
Table A1: Characteristics of Included Studies
Study Time Point Dosage of
Task Practice (hrs)
CIMT Treatment Components Control Components
Outcome Measures
Lin et al, 2010 (3) N=13 Taiwan
At least 3 months after a stroke Average time 18.3 months
30 Restraining mitten for 6 hours/day Training for 2 hours/day for 5 days/week for 3 weeks Shaping Dosage of Task Practice: #wks x # session/wk x session duration= 3 x 5 x 2 = 30 hours
Traditional rehabilitation matched to the dCIT in duration and intensity. 2 hour therapy sessions were patients were engaged in neurodevelopmental treatments including balance training, stretch of the affected limb, weight bearing with the affected limb, and fine-motor tasks in addition to practice of activities of daily living with the unaffected side.
Perceived arm motor function: MAL Motor impairment recovery: UL subscale of the FMA
Lin et al, 2009 (10) N=60 Taiwan
6 months poststroke
30 Restraining mitten for 6 hours/day Training for 2 hours/day of functional task practice for 5 sessions/week for 3 weeks. Performed at home practice. Shaping: level of task was adapted based on patient ability and improvement during training. #wks x # session/wk x session duration= 3 x 5 x 2 = 30 hours
Bilateral arm training worked the simultaneous movements of both the affected and unaffected UL in functional tasks in symmetric or alternating patterns for 2 hours/weekday for 3 weeks. These functional tasks also emphasized UL movements involved in ADL and focused on both UL moving synchronously. The group did not perform at home practice Control group controlled for duration and intensity of patient therapist interactions and therapeutic activities (2 hours/day, 5 days/week for
ADL measure: FIM Arm motor impairment: FMA Perceived arm motor function: MAL Quality of life: SIS
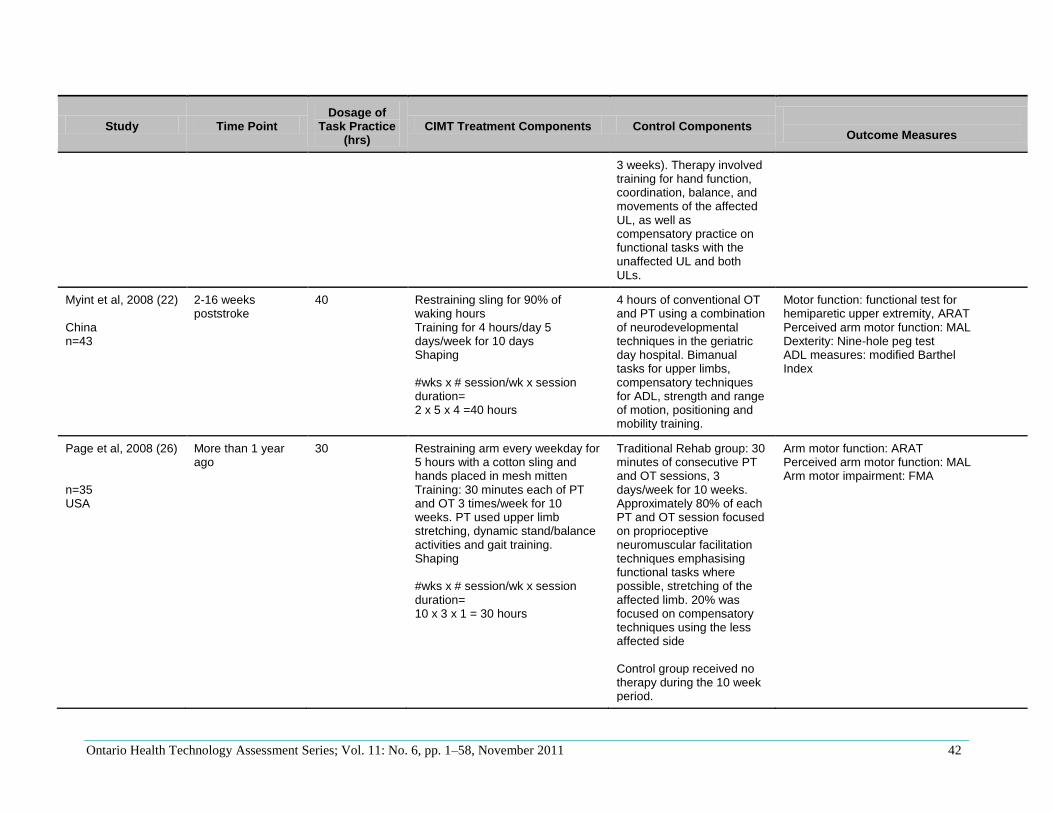
Ontario Health Technology Assessment Series; Vol. 11: No. 6, pp. 1–58, November 2011 42
Study Time Point Dosage of
Task Practice (hrs)
CIMT Treatment Components Control Components
Outcome Measures
3 weeks). Therapy involved training for hand function, coordination, balance, and movements of the affected UL, as well as compensatory practice on functional tasks with the unaffected UL and both ULs.
Myint et al, 2008 (22) China n=43
2-16 weeks poststroke
40 Restraining sling for 90% of waking hours Training for 4 hours/day 5 days/week for 10 days Shaping #wks x # session/wk x session duration= 2 x 5 x 4 =40 hours
4 hours of conventional OT and PT using a combination of neurodevelopmental techniques in the geriatric day hospital. Bimanual tasks for upper limbs, compensatory techniques for ADL, strength and range of motion, positioning and mobility training.
Motor function: functional test for hemiparetic upper extremity, ARAT Perceived arm motor function: MAL Dexterity: Nine-hole peg test ADL measures: modified Barthel Index
Page et al, 2008 (26) n=35 USA
More than 1 year ago
30 Restraining arm every weekday for 5 hours with a cotton sling and hands placed in mesh mitten Training: 30 minutes each of PT and OT 3 times/week for 10 weeks. PT used upper limb stretching, dynamic stand/balance activities and gait training. Shaping #wks x # session/wk x session duration= 10 x 3 x 1 = 30 hours
Traditional Rehab group: 30 minutes of consecutive PT and OT sessions, 3 days/week for 10 weeks. Approximately 80% of each PT and OT session focused on proprioceptive neuromuscular facilitation techniques emphasising functional tasks where possible, stretching of the affected limb. 20% was focused on compensatory techniques using the less affected side Control group received no therapy during the 10 week period.
Arm motor function: ARAT Perceived arm motor function: MAL Arm motor impairment: FMA
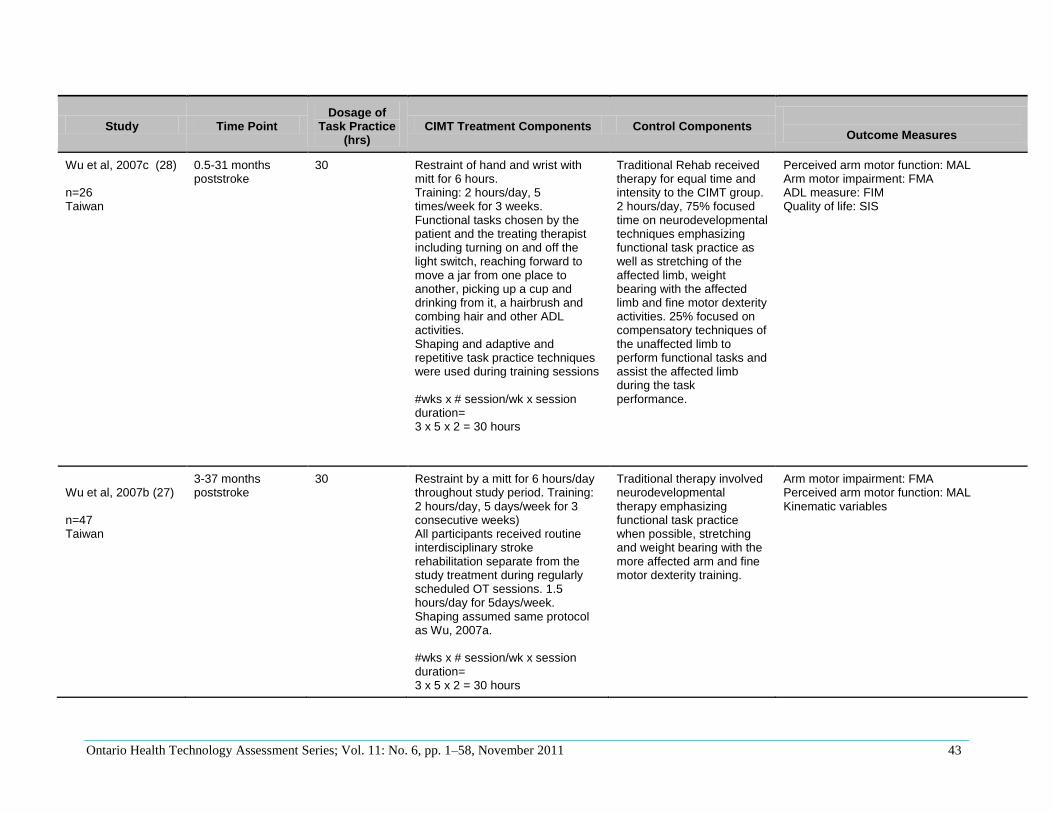
Ontario Health Technology Assessment Series; Vol. 11: No. 6, pp. 1–58, November 2011 43
Study Time Point Dosage of
Task Practice (hrs)
CIMT Treatment Components Control Components
Outcome Measures
Wu et al, 2007c (28) n=26 Taiwan
0.5-31 months poststroke
30 Restraint of hand and wrist with mitt for 6 hours. Training: 2 hours/day, 5 times/week for 3 weeks. Functional tasks chosen by the patient and the treating therapist including turning on and off the light switch, reaching forward to move a jar from one place to another, picking up a cup and drinking from it, a hairbrush and combing hair and other ADL activities. Shaping and adaptive and repetitive task practice techniques were used during training sessions #wks x # session/wk x session duration= 3 x 5 x 2 = 30 hours
Traditional Rehab received therapy for equal time and intensity to the CIMT group. 2 hours/day, 75% focused time on neurodevelopmental techniques emphasizing functional task practice as well as stretching of the affected limb, weight bearing with the affected limb and fine motor dexterity activities. 25% focused on compensatory techniques of the unaffected limb to perform functional tasks and assist the affected limb during the task performance.
Perceived arm motor function: MAL Arm motor impairment: FMA ADL measure: FIM Quality of life: SIS
Wu et al, 2007b (27) n=47 Taiwan
3-37 months poststroke
30 Restraint by a mitt for 6 hours/day throughout study period. Training: 2 hours/day, 5 days/week for 3 consecutive weeks) All participants received routine interdisciplinary stroke rehabilitation separate from the study treatment during regularly scheduled OT sessions. 1.5 hours/day for 5days/week. Shaping assumed same protocol as Wu, 2007a. #wks x # session/wk x session duration= 3 x 5 x 2 = 30 hours
Traditional therapy involved neurodevelopmental therapy emphasizing functional task practice when possible, stretching and weight bearing with the more affected arm and fine motor dexterity training.
Arm motor impairment: FMA Perceived arm motor function: MAL Kinematic variables
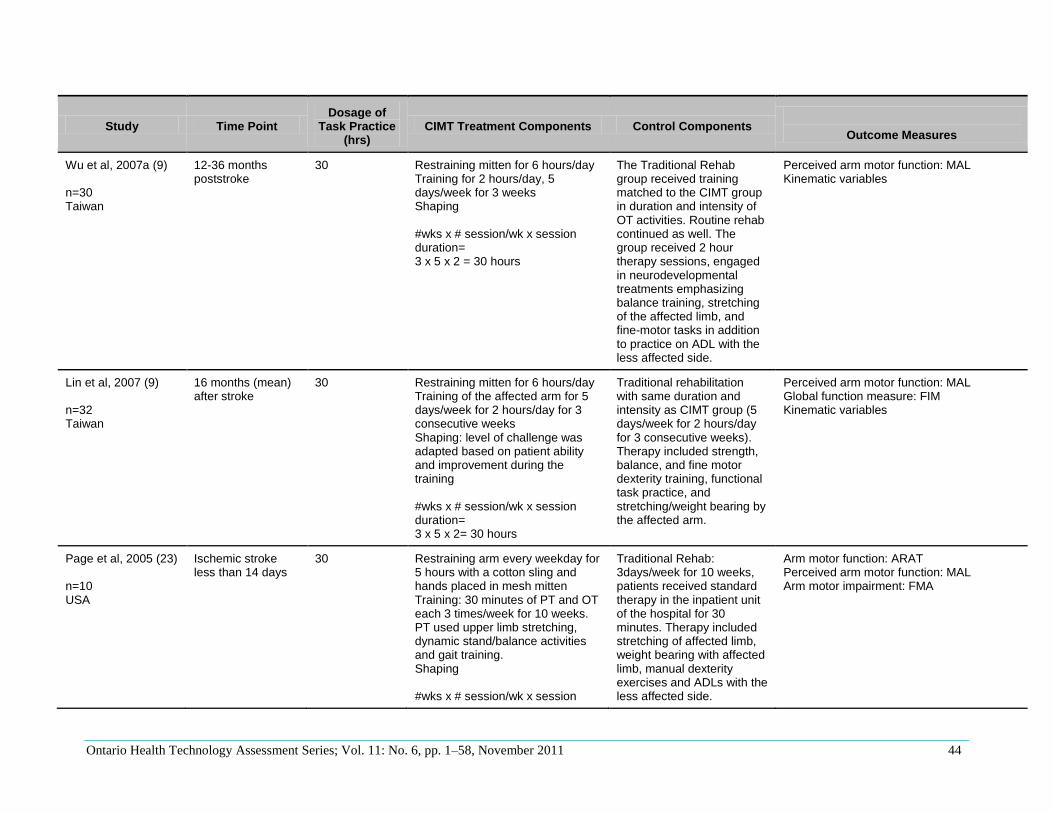
Ontario Health Technology Assessment Series; Vol. 11: No. 6, pp. 1–58, November 2011 44
Study Time Point Dosage of
Task Practice (hrs)
CIMT Treatment Components Control Components
Outcome Measures
Wu et al, 2007a (9) n=30 Taiwan
12-36 months poststroke
30 Restraining mitten for 6 hours/day Training for 2 hours/day, 5 days/week for 3 weeks Shaping #wks x # session/wk x session duration= 3 x 5 x 2 = 30 hours
The Traditional Rehab group received training matched to the CIMT group in duration and intensity of OT activities. Routine rehab continued as well. The group received 2 hour therapy sessions, engaged in neurodevelopmental treatments emphasizing balance training, stretching of the affected limb, and fine-motor tasks in addition to practice on ADL with the less affected side.
Perceived arm motor function: MAL Kinematic variables
Lin et al, 2007 (9) n=32 Taiwan
16 months (mean) after stroke
30 Restraining mitten for 6 hours/day Training of the affected arm for 5 days/week for 2 hours/day for 3 consecutive weeks Shaping: level of challenge was adapted based on patient ability and improvement during the training #wks x # session/wk x session duration= 3 x 5 x 2= 30 hours
Traditional rehabilitation with same duration and intensity as CIMT group (5 days/week for 2 hours/day for 3 consecutive weeks). Therapy included strength, balance, and fine motor dexterity training, functional task practice, and stretching/weight bearing by the affected arm.
Perceived arm motor function: MAL Global function measure: FIM Kinematic variables
Page et al, 2005 (23) n=10 USA
Ischemic stroke less than 14 days
30 Restraining arm every weekday for 5 hours with a cotton sling and hands placed in mesh mitten Training: 30 minutes of PT and OT each 3 times/week for 10 weeks. PT used upper limb stretching, dynamic stand/balance activities and gait training. Shaping #wks x # session/wk x session
Traditional Rehab: 3days/week for 10 weeks, patients received standard therapy in the inpatient unit of the hospital for 30 minutes. Therapy included stretching of affected limb, weight bearing with affected limb, manual dexterity exercises and ADLs with the less affected side.
Arm motor function: ARAT Perceived arm motor function: MAL Arm motor impairment: FMA
Ontario Health Technology Assessment Series; Vol. 11: No. 6, pp. 1–58, November 2011 45
Study Time Point Dosage of
Task Practice (hrs)
CIMT Treatment Components Control Components
Outcome Measures
duration= 10 x 3 x 1 = 30 hours
Atteya, 2004 (20) n=4 Saudi
4-6 months poststroke
30 Restraining arm using a cotton Bobath sling. Training: half hour of each of OT and PT 3 times/week for 10 weeks Shaping #wks x # session/wk x session duration= 10 x 3 x 1 = 30 hours
Traditional therapy received half hour each of OT and PT
ADL: FUGL Arm Motor function: ARA Motor Function: WMFT Perceived arm motor function: MAL
Page et al, 2004 (25) n=17 USA
More than 1 year 30 Restraining arm every weekday for 5 hours with a cotton sling and hands placed in mesh mitten Training: 30 minutes of PT and OT each 3 times/week for 10 weeks. PT used upper limb stretching, dynamic stand/balance activities and gait training. Shaping #wks x # session/wk x session duration= 10 x 3 x 1 = 30 hours
Traditional Rehab group: 30 minutes of consecutive PT and OT sessions, 3 days/week for 10 weeks. Approximately 80% of each PT and OT session focused on proprioceptive neuromuscular facilitation techniques emphasising functional tasks where possible, stretching of the affected limb. 20% was focused on compensatory techniques using the less affected side Control group received no therapy during the 10 week period.
Arm motor function: ARAT Perceived arm motor function: MAL Arm motor impairment: FMA
Page et al, 2002 (24) n=14 USA
4 weeks to 6 months poststroke
30 Restraining every weekday for 5 hours with a cotton sling for arm and hands placed in mesh mitten. Training: 30 minutes of PT and OT
Regular therapy group received 30 minutes of OT and PT sessions 3 times /week for 10 weeks. Given
Motor function: ARAT Perceived arm motor function: MAL Arm motor impairment: FMA
Ontario Health Technology Assessment Series; Vol. 11: No. 6, pp. 1–58, November 2011 46
Study Time Point Dosage of
Task Practice (hrs)
CIMT Treatment Components Control Components
Outcome Measures
each 3 times/week for 10 weeks. OT used functional tasks for the affected upper limb. PT used upper limb stretching, dynamic stand/balance activities and gait training. Shaping #wks x # session/wk x session duration= 10 x 3 x 1 = 30 hours
neuromuscular facilitation principles during the PT and OT sessions, some compensatory techniques were taught. No therapy group did not receive any interventions, therapy programs, or exercise programs for 10 weeks.
Page et al, 2001 (7) n=6 USA
4 weeks to 6 months poststroke
30 Restraining with a cotton Bobath sling of lower arm and hands every weekday for 5 hours Training: 30 minutes of OT and PT each 3 times/week for 10 weeks 80% of the time was dedicated to neuromuscular facilitation techniques with emphasis on ADL tasks and 20% on compensatory techniques using the unaffected side Shaping #wks x # session/wk x session duration= 10 x 3 x 1 = 30 hours
Usual care group received 30 minutes of OT and PT each 3 times/week for 10 weeks. 80% of the time was dedicated to neuromuscular facilitation techniques with emphasis on ADL tasks and 20% on compensatory techniques using the unaffected side No therapy group during the same 10-week period
Arm motor function: ARAT, WMFT2 Perceived arm motor function: MAL ARM motor impairment: FMA
Ontario Health Technology Assessment Series; Vol. 11: No. 6, pp. 1–58, November 2011 47
Appendix 3: GRADE Profile
Table A1: GRADE Profile
Quality assessment Summary of findings
No. of patients
Quality No of studies
Design Limitations Inconsistency Indirectness Imprecision Other considerations CIMT Usual Care
Arm Motor Function (Better indicated by higher values)
4 randomized trials
serious1 no serious
inconsistency no serious indirectness
serious2 strong association
3
22 21
MODERATE
Arm Motor Impairment (Better indicated by higher values)
8 randomized trials
serious4 no serious
inconsistency no serious indirectness
serious5 none
84 85
LOW
FIM Score (Better indicated by higher values)
4 randomized trials
serious6 no serious
inconsistency very serious
7 no serious
imprecision Confounding did not reduce effect
8
65 63
LOW
Perceived Motor Function (AOU) (Better indicated by higher values)
8 randomized trials
very serious
9
no serious inconsistency
no serious indirectness
no serious imprecision
none 122 119
LOW
Perceived Motor Use (QOU) (Better indicated by higher values)
8 randomized trials
very serious
9
no serious inconsistency
no serious indirectness
no serious imprecision
none 122 119
LOW
Quality of Life (Better indicated by higher values)
2 randomized trials
serious10
serious11
no serious indirectness
serious12
none 33 33
VERY LOW
1 Allocation concealment is unclear, Atteya, 2004 (20), Page, 2005 (23), 2001 (7), Page, 2008 (26). Unclear randomization in Page, 2001 (7), and Atteya, 2004 (20).
2 Wide confidence intervals, small sample sizes.
3 No explanation was provided.
4 Unclear randomization methods, Page, 2001 (7), Atteya, 2004 (20) Lin 2010 (3); unclear allocation concealment, Atteya,2004 (20), Lin, 2010 (3), Page, 2001 (7),
2005 (23), 2008 (26), Wu, 2007b (27), and 2007c. (28) 5 Heterogeneity, I-squared is 81%, 5 of the 8 studies have estimates consistent with important harms and important benefits.
6 Allocation concealment unclear, Wu, 2007a (9) and 2007c (28); adequate randomization unclear Wu, 2007a (9)
7Some items on the FIM score may not respond to CIMT including sphincter control, communication, social cognition. These items make up almost 50% of total score.
8 50% of FIM score may be unresponsive to effects of CIMT, however, there is a strong trend in favour of CIMT with this outcome despite this confounding.
9 Unclear allocation concealment in 2 studies including Lin, 2010 (3), Wu, 2007a (9); unclear randomization methods in Lin, 2010 (3), Wu, 2007a (9), 2007b (27), 2007
c (28); self-reported measure which may be a bias since the patient could not be blinded to treatment group. 10
Self- reported measure, patients were not blinded to treatment. 11
Inconsistency in statistical effect between studies. 12
Both studies have a small sample size.
Ontario Health Technology Assessment Series; Vol. 11: No. 6, pp. 1–58, November 2011 48
Appendix 4: Arm Motor Impairment Subgroup Analyses
Figure 1: Arm Motor Impairment in Studies Using a High Intensity/Short Duration Program
Figure 2: Arm Motor Impairment in Studies Using a Low Intensity/Long Duration Program
Figure 3: Arm Motor Impairment in Studies Using Hand Restraint Only
Study or Subgroup
Atteya 2004
Boake 2007
Lin 2009
Lin 2010
Page 2001
Page 2005
Page 2008
Wu 2007b
Wu 2007c
Total (95% CI)
Heterogeneity: Tau² = 0.00; Chi² = 0.97, df = 3 (P = 0.81); I² = 0%
Test for overall effect: Z = 3.98 (P < 0.0001)
Mean
8.5
18.2
4
5.6
8
18.4
7.93
7.25
7.69
SD
2.12
14.18
4.42
5.7
1.41
2.5
10.88
6.63
6.16
Total
2
10
20
5
2
5
13
24
13
62
Mean
-0.5
14.1
0.9
3.5
-0.5
4.2
3.92
3.04
2.31
SD
6.36
23.09
6.66
11
7.77
1.3
16.31
5.88
2.75
Total
2
12
20
8
2
5
12
23
13
64
Weight
0.0%
0.0%
33.1%
4.9%
0.0%
0.0%
0.0%
31.7%
30.2%
100.0%
IV, Random, 95% CI
9.00 [-0.29, 18.29]
4.10 [-11.65, 19.85]
3.10 [-0.40, 6.60]
2.10 [-7.01, 11.21]
8.50 [-2.44, 19.44]
14.20 [11.73, 16.67]
4.01 [-6.95, 14.97]
4.21 [0.63, 7.79]
5.38 [1.71, 9.05]
4.09 [2.08, 6.11]
CIMT Usual Care Mean Difference Mean Difference
IV, Random, 95% CI
-20 -10 0 10 20Favours Usual Care Favours CIMT
Study or Subgroup
Atteya 2004
Boake 2007
Lin 2009
Lin 2010
Page 2001
Page 2005
Page 2008
Wu 2007b
Wu 2007c
Total (95% CI)
Heterogeneity: Tau² = 9.32; Chi² = 4.82, df = 3 (P = 0.19); I² = 38%
Test for overall effect: Z = 4.56 (P < 0.00001)
Mean
8.5
18.2
4
5.6
8
18.4
7.93
7.25
7.69
SD
2.12
14.18
4.42
5.7
1.41
2.5
10.88
6.63
6.16
Total
2
10
20
5
2
5
13
24
13
22
Mean
-0.5
14.1
0.9
3.5
-0.5
4.2
3.92
3.04
2.31
SD
6.36
23.09
6.66
11
7.77
1.3
16.31
5.88
2.75
Total
2
12
20
8
2
5
12
23
13
21
Weight
18.2%
0.0%
0.0%
0.0%
14.3%
53.2%
14.3%
0.0%
0.0%
100.0%
IV, Random, 95% CI
9.00 [-0.29, 18.29]
4.10 [-11.65, 19.85]
3.10 [-0.40, 6.60]
2.10 [-7.01, 11.21]
8.50 [-2.44, 19.44]
14.20 [11.73, 16.67]
4.01 [-6.95, 14.97]
4.21 [0.63, 7.79]
5.38 [1.71, 9.05]
10.98 [6.26, 15.70]
CIMT Usual Care Mean Difference Mean Difference
IV, Random, 95% CI
-20 -10 0 10 20Favours Usual Care Favours CIMT
Study or Subgroup
Atteya 2004
Boake 2007
Lin 2009
Lin 2010
Page 2001
Page 2005
Page 2008
Wu 2007b
Wu 2007c
Total (95% CI)
Heterogeneity: Tau² = 0.00; Chi² = 0.97, df = 3 (P = 0.81); I² = 0%
Test for overall effect: Z = 3.98 (P < 0.0001)
Mean
8.5
18.2
4
5.6
8
18.4
7.93
7.25
7.69
SD
2.12
14.18
4.42
5.7
1.41
2.5
10.88
6.63
6.16
Total
2
10
20
5
2
5
13
24
13
62
Mean
-0.5
14.1
0.9
3.5
-0.5
4.2
3.92
3.04
2.31
SD
6.36
23.09
6.66
11
7.77
1.3
16.31
5.88
2.75
Total
2
12
20
8
2
5
12
23
13
64
Weight
0.0%
0.0%
33.1%
4.9%
0.0%
0.0%
0.0%
31.7%
30.2%
100.0%
IV, Random, 95% CI
9.00 [-0.29, 18.29]
4.10 [-11.65, 19.85]
3.10 [-0.40, 6.60]
2.10 [-7.01, 11.21]
8.50 [-2.44, 19.44]
14.20 [11.73, 16.67]
4.01 [-6.95, 14.97]
4.21 [0.63, 7.79]
5.38 [1.71, 9.05]
4.09 [2.08, 6.11]
CIMT Usual Care Mean Difference Mean Difference
IV, Random, 95% CI
-20 -10 0 10 20Favours Usual Care Favours CIMT
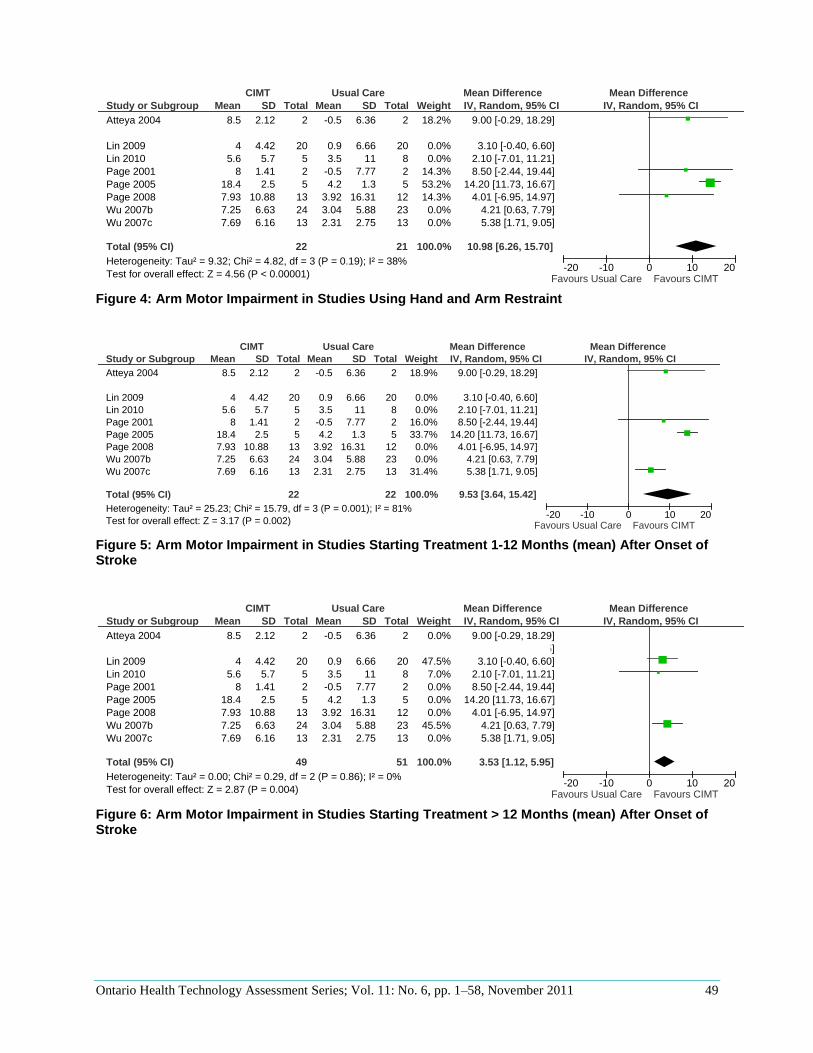
Ontario Health Technology Assessment Series; Vol. 11: No. 6, pp. 1–58, November 2011 49
Figure 4: Arm Motor Impairment in Studies Using Hand and Arm Restraint
Figure 5: Arm Motor Impairment in Studies Starting Treatment 1-12 Months (mean) After Onset of Stroke
Figure 6: Arm Motor Impairment in Studies Starting Treatment > 12 Months (mean) After Onset of Stroke
Study or Subgroup
Atteya 2004
Boake 2007
Lin 2009
Lin 2010
Page 2001
Page 2005
Page 2008
Wu 2007b
Wu 2007c
Total (95% CI)
Heterogeneity: Tau² = 9.32; Chi² = 4.82, df = 3 (P = 0.19); I² = 38%
Test for overall effect: Z = 4.56 (P < 0.00001)
Mean
8.5
18.2
4
5.6
8
18.4
7.93
7.25
7.69
SD
2.12
14.18
4.42
5.7
1.41
2.5
10.88
6.63
6.16
Total
2
10
20
5
2
5
13
24
13
22
Mean
-0.5
14.1
0.9
3.5
-0.5
4.2
3.92
3.04
2.31
SD
6.36
23.09
6.66
11
7.77
1.3
16.31
5.88
2.75
Total
2
12
20
8
2
5
12
23
13
21
Weight
18.2%
0.0%
0.0%
0.0%
14.3%
53.2%
14.3%
0.0%
0.0%
100.0%
IV, Random, 95% CI
9.00 [-0.29, 18.29]
4.10 [-11.65, 19.85]
3.10 [-0.40, 6.60]
2.10 [-7.01, 11.21]
8.50 [-2.44, 19.44]
14.20 [11.73, 16.67]
4.01 [-6.95, 14.97]
4.21 [0.63, 7.79]
5.38 [1.71, 9.05]
10.98 [6.26, 15.70]
CIMT Usual Care Mean Difference Mean Difference
IV, Random, 95% CI
-20 -10 0 10 20Favours Usual Care Favours CIMT
Study or Subgroup
Atteya 2004
Boake 2007
Lin 2009
Lin 2010
Page 2001
Page 2005
Page 2008
Wu 2007b
Wu 2007c
Total (95% CI)
Heterogeneity: Tau² = 25.23; Chi² = 15.79, df = 3 (P = 0.001); I² = 81%
Test for overall effect: Z = 3.17 (P = 0.002)
Mean
8.5
18.2
4
5.6
8
18.4
7.93
7.25
7.69
SD
2.12
14.18
4.42
5.7
1.41
2.5
10.88
6.63
6.16
Total
2
10
20
5
2
5
13
24
13
22
Mean
-0.5
14.1
0.9
3.5
-0.5
4.2
3.92
3.04
2.31
SD
6.36
23.09
6.66
11
7.77
1.3
16.31
5.88
2.75
Total
2
12
20
8
2
5
12
23
13
22
Weight
18.9%
0.0%
0.0%
0.0%
16.0%
33.7%
0.0%
0.0%
31.4%
100.0%
IV, Random, 95% CI
9.00 [-0.29, 18.29]
4.10 [-11.65, 19.85]
3.10 [-0.40, 6.60]
2.10 [-7.01, 11.21]
8.50 [-2.44, 19.44]
14.20 [11.73, 16.67]
4.01 [-6.95, 14.97]
4.21 [0.63, 7.79]
5.38 [1.71, 9.05]
9.53 [3.64, 15.42]
CIMT Usual Care Mean Difference Mean Difference
IV, Random, 95% CI
-20 -10 0 10 20Favours Usual Care Favours CIMT
Study or Subgroup
Atteya 2004
Boake 2007
Lin 2009
Lin 2010
Page 2001
Page 2005
Page 2008
Wu 2007b
Wu 2007c
Total (95% CI)
Heterogeneity: Tau² = 0.00; Chi² = 0.29, df = 2 (P = 0.86); I² = 0%
Test for overall effect: Z = 2.87 (P = 0.004)
Mean
8.5
18.2
4
5.6
8
18.4
7.93
7.25
7.69
SD
2.12
14.18
4.42
5.7
1.41
2.5
10.88
6.63
6.16
Total
2
10
20
5
2
5
13
24
13
49
Mean
-0.5
14.1
0.9
3.5
-0.5
4.2
3.92
3.04
2.31
SD
6.36
23.09
6.66
11
7.77
1.3
16.31
5.88
2.75
Total
2
12
20
8
2
5
12
23
13
51
Weight
0.0%
0.0%
47.5%
7.0%
0.0%
0.0%
0.0%
45.5%
0.0%
100.0%
IV, Random, 95% CI
9.00 [-0.29, 18.29]
4.10 [-11.65, 19.85]
3.10 [-0.40, 6.60]
2.10 [-7.01, 11.21]
8.50 [-2.44, 19.44]
14.20 [11.73, 16.67]
4.01 [-6.95, 14.97]
4.21 [0.63, 7.79]
5.38 [1.71, 9.05]
3.53 [1.12, 5.95]
CIMT Usual Care Mean Difference Mean Difference
IV, Random, 95% CI
-20 -10 0 10 20Favours Usual Care Favours CIMT
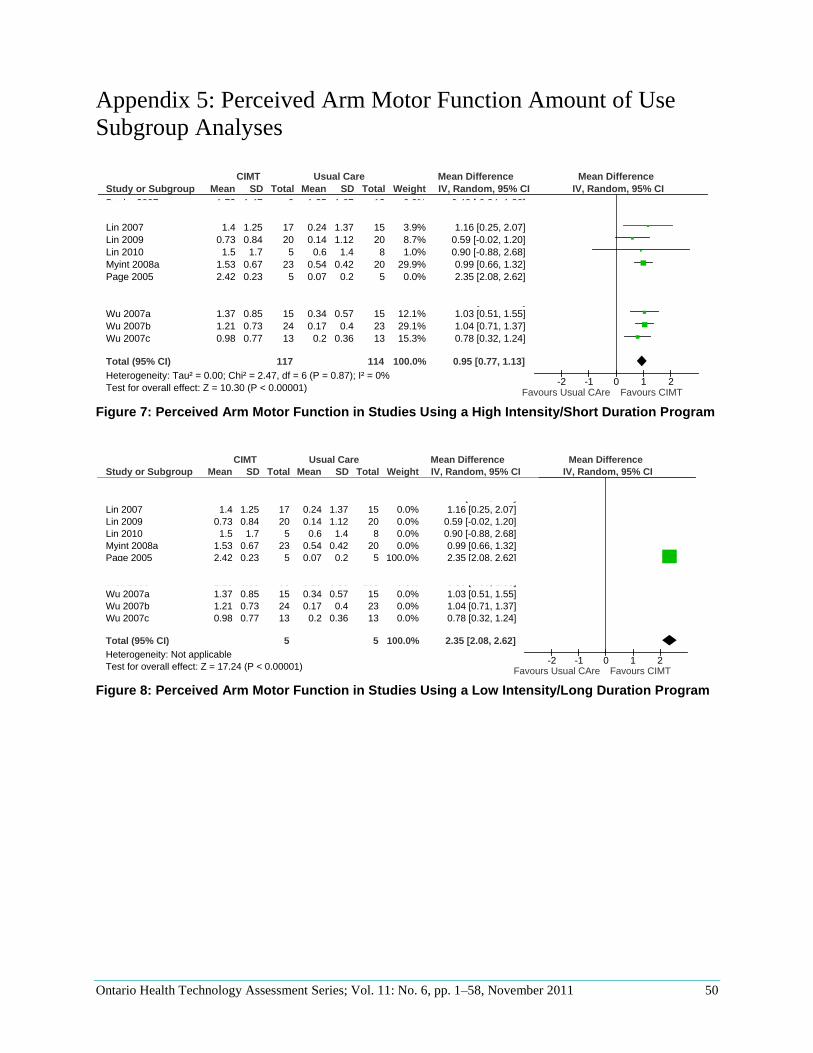
Ontario Health Technology Assessment Series; Vol. 11: No. 6, pp. 1–58, November 2011 50
Appendix 5: Perceived Arm Motor Function Amount of Use
Subgroup Analyses
Figure 7: Perceived Arm Motor Function in Studies Using a High Intensity/Short Duration Program
Figure 8: Perceived Arm Motor Function in Studies Using a Low Intensity/Long Duration Program
Study or Subgroup
Boake 2007
Dahl 2008
Lin 2007
Lin 2009
Lin 2010
Myint 2008a
Page 2005
Wittenberg 2003
Wolf 2006
Wu 2007a
Wu 2007b
Wu 2007c
Total (95% CI)
Heterogeneity: Tau² = 0.00; Chi² = 2.47, df = 6 (P = 0.87); I² = 0%
Test for overall effect: Z = 10.30 (P < 0.00001)
Mean
1.73
0.56
1.4
0.73
1.5
1.53
2.42
1.08
1.15
1.37
1.21
0.98
SD
1.47
1.68
1.25
0.84
1.7
0.67
0.23
0.42
0.65
0.85
0.73
0.77
Total
9
18
17
20
5
23
5
9
98
15
24
13
117
Mean
1.25
0.78
0.24
0.14
0.6
0.54
0.07
-0.01
0.29
0.34
0.17
0.2
SD
1.67
1.66
1.37
1.12
1.4
0.42
0.2
0.48
0.56
0.57
0.4
0.36
Total
13
12
15
20
8
20
5
7
103
15
23
13
114
Weight
0.0%
0.0%
3.9%
8.7%
1.0%
29.9%
0.0%
0.0%
0.0%
12.1%
29.1%
15.3%
100.0%
IV, Random, 95% CI
0.48 [-0.84, 1.80]
-0.22 [-1.44, 1.00]
1.16 [0.25, 2.07]
0.59 [-0.02, 1.20]
0.90 [-0.88, 2.68]
0.99 [0.66, 1.32]
2.35 [2.08, 2.62]
1.09 [0.64, 1.54]
0.86 [0.69, 1.03]
1.03 [0.51, 1.55]
1.04 [0.71, 1.37]
0.78 [0.32, 1.24]
0.95 [0.77, 1.13]
CIMT Usual Care Mean Difference Mean Difference
IV, Random, 95% CI
-2 -1 0 1 2Favours Usual CAre Favours CIMT
Study or Subgroup
Boake 2007
Dahl 2008
Lin 2007
Lin 2009
Lin 2010
Myint 2008a
Page 2005
Wittenberg 2003
Wolf 2006
Wu 2007a
Wu 2007b
Wu 2007c
Total (95% CI)
Heterogeneity: Not applicable
Test for overall effect: Z = 17.24 (P < 0.00001)
Mean
1.73
0.56
1.4
0.73
1.5
1.53
2.42
1.08
1.15
1.37
1.21
0.98
SD
1.47
1.68
1.25
0.84
1.7
0.67
0.23
0.42
0.65
0.85
0.73
0.77
Total
9
18
17
20
5
23
5
9
98
15
24
13
5
Mean
1.25
0.78
0.24
0.14
0.6
0.54
0.07
-0.01
0.29
0.34
0.17
0.2
SD
1.67
1.66
1.37
1.12
1.4
0.42
0.2
0.48
0.56
0.57
0.4
0.36
Total
13
12
15
20
8
20
5
7
103
15
23
13
5
Weight
0.0%
0.0%
0.0%
0.0%
0.0%
0.0%
100.0%
0.0%
0.0%
0.0%
0.0%
0.0%
100.0%
IV, Random, 95% CI
0.48 [-0.84, 1.80]
-0.22 [-1.44, 1.00]
1.16 [0.25, 2.07]
0.59 [-0.02, 1.20]
0.90 [-0.88, 2.68]
0.99 [0.66, 1.32]
2.35 [2.08, 2.62]
1.09 [0.64, 1.54]
0.86 [0.69, 1.03]
1.03 [0.51, 1.55]
1.04 [0.71, 1.37]
0.78 [0.32, 1.24]
2.35 [2.08, 2.62]
CIMT Usual Care Mean Difference Mean Difference
IV, Random, 95% CI
-2 -1 0 1 2Favours Usual CAre Favours CIMT
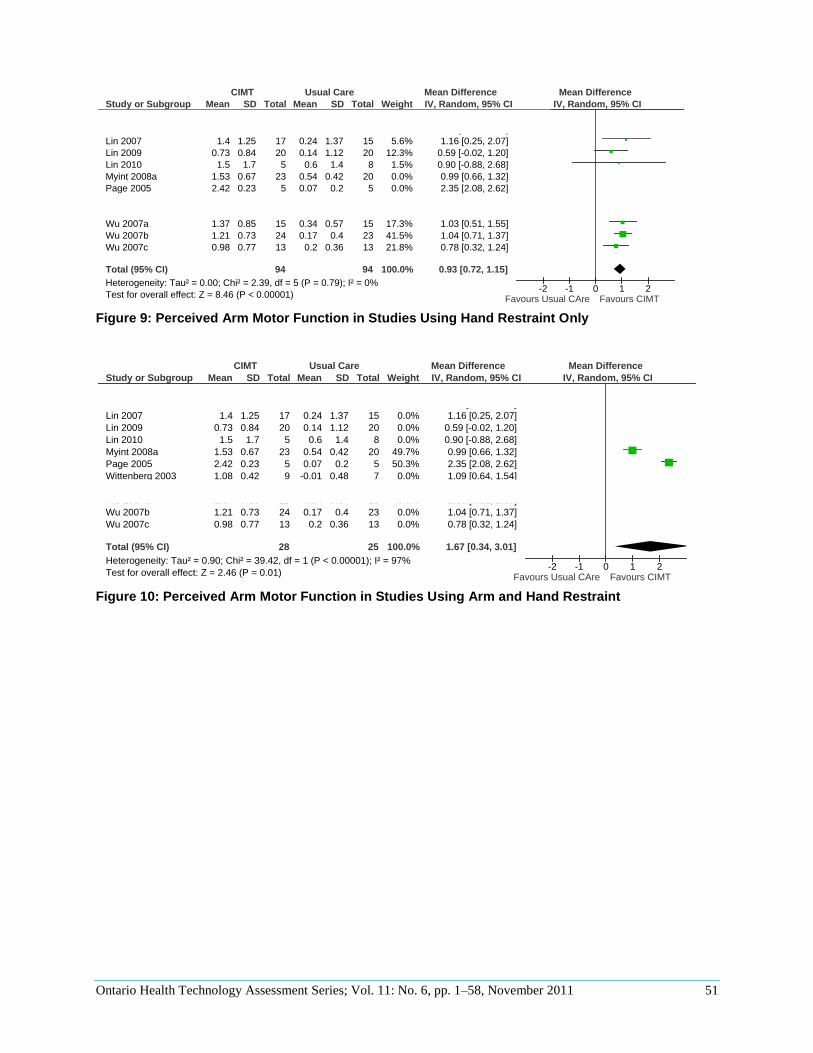
Ontario Health Technology Assessment Series; Vol. 11: No. 6, pp. 1–58, November 2011 51
Figure 9: Perceived Arm Motor Function in Studies Using Hand Restraint Only
Figure 10: Perceived Arm Motor Function in Studies Using Arm and Hand Restraint
Study or Subgroup
Boake 2007
Dahl 2008
Lin 2007
Lin 2009
Lin 2010
Myint 2008a
Page 2005
Wittenberg 2003
Wolf 2006
Wu 2007a
Wu 2007b
Wu 2007c
Total (95% CI)
Heterogeneity: Tau² = 0.00; Chi² = 2.39, df = 5 (P = 0.79); I² = 0%
Test for overall effect: Z = 8.46 (P < 0.00001)
Mean
1.73
0.56
1.4
0.73
1.5
1.53
2.42
1.08
1.15
1.37
1.21
0.98
SD
1.47
1.68
1.25
0.84
1.7
0.67
0.23
0.42
0.65
0.85
0.73
0.77
Total
9
18
17
20
5
23
5
9
98
15
24
13
94
Mean
1.25
0.78
0.24
0.14
0.6
0.54
0.07
-0.01
0.29
0.34
0.17
0.2
SD
1.67
1.66
1.37
1.12
1.4
0.42
0.2
0.48
0.56
0.57
0.4
0.36
Total
13
12
15
20
8
20
5
7
103
15
23
13
94
Weight
0.0%
0.0%
5.6%
12.3%
1.5%
0.0%
0.0%
0.0%
0.0%
17.3%
41.5%
21.8%
100.0%
IV, Random, 95% CI
0.48 [-0.84, 1.80]
-0.22 [-1.44, 1.00]
1.16 [0.25, 2.07]
0.59 [-0.02, 1.20]
0.90 [-0.88, 2.68]
0.99 [0.66, 1.32]
2.35 [2.08, 2.62]
1.09 [0.64, 1.54]
0.86 [0.69, 1.03]
1.03 [0.51, 1.55]
1.04 [0.71, 1.37]
0.78 [0.32, 1.24]
0.93 [0.72, 1.15]
CIMT Usual Care Mean Difference Mean Difference
IV, Random, 95% CI
-2 -1 0 1 2Favours Usual CAre Favours CIMT
Study or Subgroup
Boake 2007
Dahl 2008
Lin 2007
Lin 2009
Lin 2010
Myint 2008a
Page 2005
Wittenberg 2003
Wolf 2006
Wu 2007a
Wu 2007b
Wu 2007c
Total (95% CI)
Heterogeneity: Tau² = 0.90; Chi² = 39.42, df = 1 (P < 0.00001); I² = 97%
Test for overall effect: Z = 2.46 (P = 0.01)
Mean
1.73
0.56
1.4
0.73
1.5
1.53
2.42
1.08
1.15
1.37
1.21
0.98
SD
1.47
1.68
1.25
0.84
1.7
0.67
0.23
0.42
0.65
0.85
0.73
0.77
Total
9
18
17
20
5
23
5
9
98
15
24
13
28
Mean
1.25
0.78
0.24
0.14
0.6
0.54
0.07
-0.01
0.29
0.34
0.17
0.2
SD
1.67
1.66
1.37
1.12
1.4
0.42
0.2
0.48
0.56
0.57
0.4
0.36
Total
13
12
15
20
8
20
5
7
103
15
23
13
25
Weight
0.0%
0.0%
0.0%
0.0%
0.0%
49.7%
50.3%
0.0%
0.0%
0.0%
0.0%
0.0%
100.0%
IV, Random, 95% CI
0.48 [-0.84, 1.80]
-0.22 [-1.44, 1.00]
1.16 [0.25, 2.07]
0.59 [-0.02, 1.20]
0.90 [-0.88, 2.68]
0.99 [0.66, 1.32]
2.35 [2.08, 2.62]
1.09 [0.64, 1.54]
0.86 [0.69, 1.03]
1.03 [0.51, 1.55]
1.04 [0.71, 1.37]
0.78 [0.32, 1.24]
1.67 [0.34, 3.01]
CIMT Usual Care Mean Difference Mean Difference
IV, Random, 95% CI
-2 -1 0 1 2Favours Usual CAre Favours CIMT
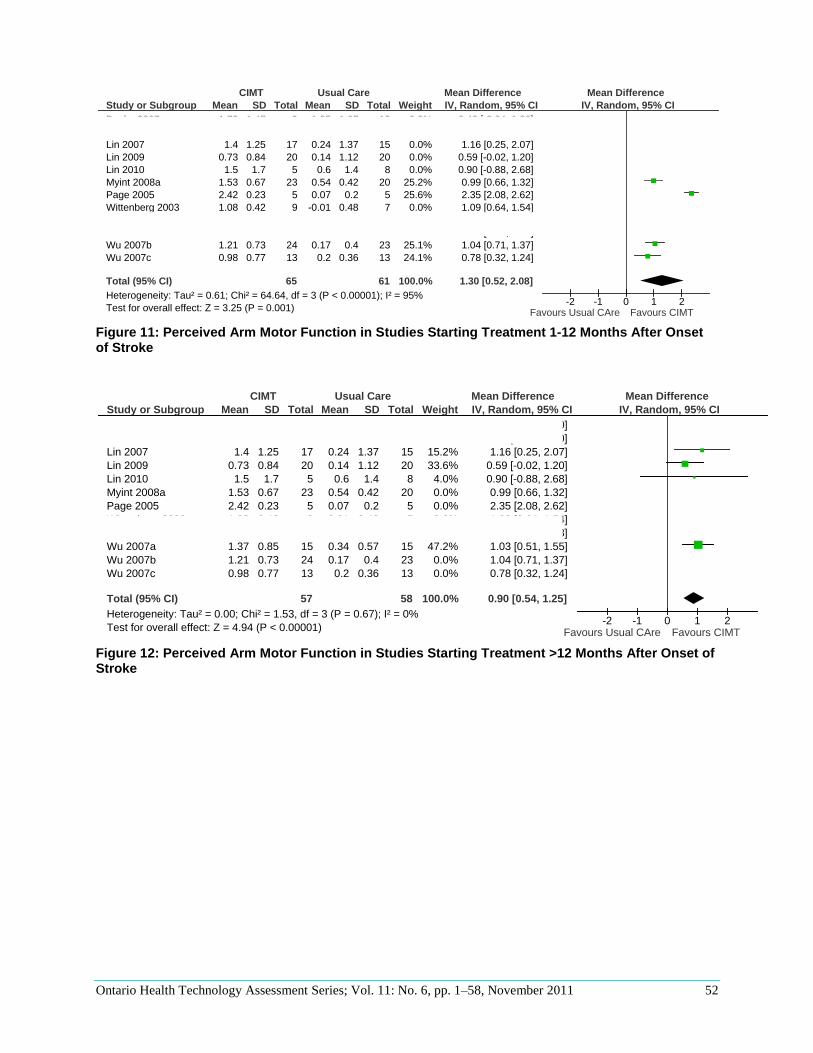
Ontario Health Technology Assessment Series; Vol. 11: No. 6, pp. 1–58, November 2011 52
Figure 11: Perceived Arm Motor Function in Studies Starting Treatment 1-12 Months After Onset of Stroke
Figure 12: Perceived Arm Motor Function in Studies Starting Treatment >12 Months After Onset of Stroke
Study or Subgroup
Boake 2007
Dahl 2008
Lin 2007
Lin 2009
Lin 2010
Myint 2008a
Page 2005
Wittenberg 2003
Wolf 2006
Wu 2007a
Wu 2007b
Wu 2007c
Total (95% CI)
Heterogeneity: Tau² = 0.61; Chi² = 64.64, df = 3 (P < 0.00001); I² = 95%
Test for overall effect: Z = 3.25 (P = 0.001)
Mean
1.73
0.56
1.4
0.73
1.5
1.53
2.42
1.08
1.15
1.37
1.21
0.98
SD
1.47
1.68
1.25
0.84
1.7
0.67
0.23
0.42
0.65
0.85
0.73
0.77
Total
9
18
17
20
5
23
5
9
98
15
24
13
65
Mean
1.25
0.78
0.24
0.14
0.6
0.54
0.07
-0.01
0.29
0.34
0.17
0.2
SD
1.67
1.66
1.37
1.12
1.4
0.42
0.2
0.48
0.56
0.57
0.4
0.36
Total
13
12
15
20
8
20
5
7
103
15
23
13
61
Weight
0.0%
0.0%
0.0%
0.0%
0.0%
25.2%
25.6%
0.0%
0.0%
0.0%
25.1%
24.1%
100.0%
IV, Random, 95% CI
0.48 [-0.84, 1.80]
-0.22 [-1.44, 1.00]
1.16 [0.25, 2.07]
0.59 [-0.02, 1.20]
0.90 [-0.88, 2.68]
0.99 [0.66, 1.32]
2.35 [2.08, 2.62]
1.09 [0.64, 1.54]
0.86 [0.69, 1.03]
1.03 [0.51, 1.55]
1.04 [0.71, 1.37]
0.78 [0.32, 1.24]
1.30 [0.52, 2.08]
CIMT Usual Care Mean Difference Mean Difference
IV, Random, 95% CI
-2 -1 0 1 2Favours Usual CAre Favours CIMT
Study or Subgroup
Boake 2007
Dahl 2008
Lin 2007
Lin 2009
Lin 2010
Myint 2008a
Page 2005
Wittenberg 2003
Wolf 2006
Wu 2007a
Wu 2007b
Wu 2007c
Total (95% CI)
Heterogeneity: Tau² = 0.00; Chi² = 1.53, df = 3 (P = 0.67); I² = 0%
Test for overall effect: Z = 4.94 (P < 0.00001)
Mean
1.73
0.56
1.4
0.73
1.5
1.53
2.42
1.08
1.15
1.37
1.21
0.98
SD
1.47
1.68
1.25
0.84
1.7
0.67
0.23
0.42
0.65
0.85
0.73
0.77
Total
9
18
17
20
5
23
5
9
98
15
24
13
57
Mean
1.25
0.78
0.24
0.14
0.6
0.54
0.07
-0.01
0.29
0.34
0.17
0.2
SD
1.67
1.66
1.37
1.12
1.4
0.42
0.2
0.48
0.56
0.57
0.4
0.36
Total
13
12
15
20
8
20
5
7
103
15
23
13
58
Weight
0.0%
0.0%
15.2%
33.6%
4.0%
0.0%
0.0%
0.0%
0.0%
47.2%
0.0%
0.0%
100.0%
IV, Random, 95% CI
0.48 [-0.84, 1.80]
-0.22 [-1.44, 1.00]
1.16 [0.25, 2.07]
0.59 [-0.02, 1.20]
0.90 [-0.88, 2.68]
0.99 [0.66, 1.32]
2.35 [2.08, 2.62]
1.09 [0.64, 1.54]
0.86 [0.69, 1.03]
1.03 [0.51, 1.55]
1.04 [0.71, 1.37]
0.78 [0.32, 1.24]
0.90 [0.54, 1.25]
CIMT Usual Care Mean Difference Mean Difference
IV, Random, 95% CI
-2 -1 0 1 2Favours Usual CAre Favours CIMT
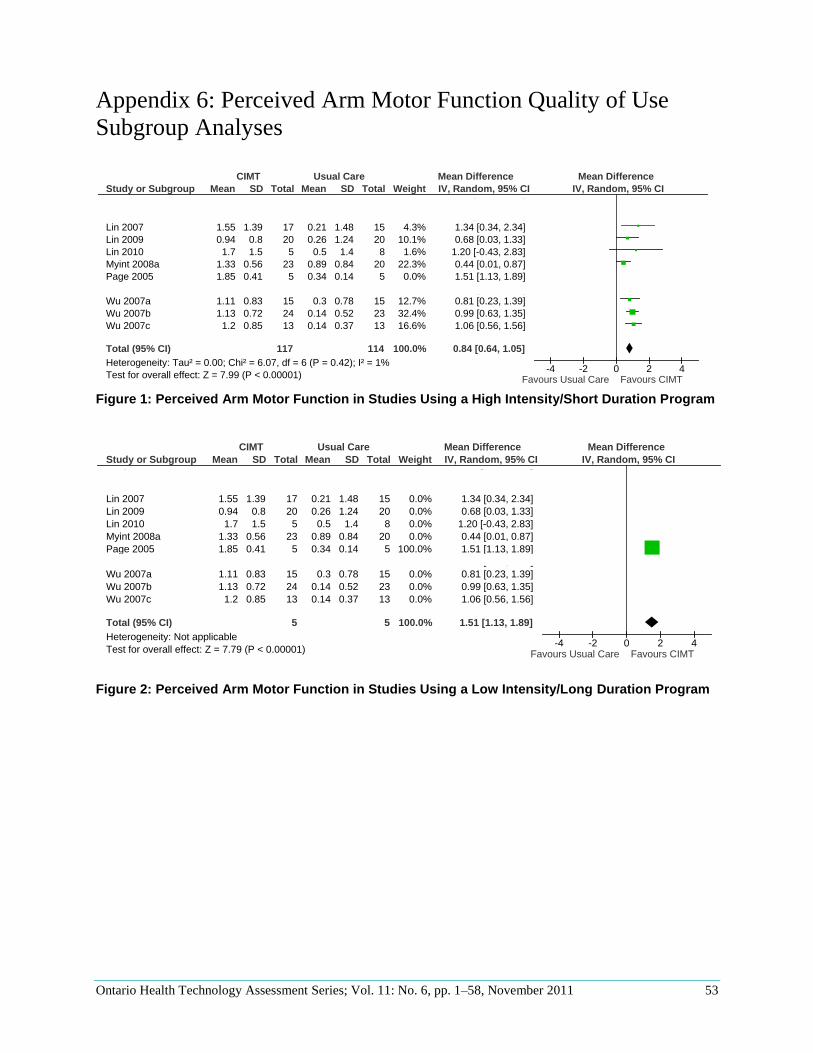
Ontario Health Technology Assessment Series; Vol. 11: No. 6, pp. 1–58, November 2011 53
Appendix 6: Perceived Arm Motor Function Quality of Use
Subgroup Analyses
Figure 1: Perceived Arm Motor Function in Studies Using a High Intensity/Short Duration Program
Figure 2: Perceived Arm Motor Function in Studies Using a Low Intensity/Long Duration Program
Study or Subgroup
Boake 2007
Dahl 2008
Lin 2007
Lin 2009
Lin 2010
Myint 2008a
Page 2005
Wolf 2006
Wu 2007a
Wu 2007b
Wu 2007c
Total (95% CI)
Heterogeneity: Tau² = 0.00; Chi² = 6.07, df = 6 (P = 0.42); I² = 1%
Test for overall effect: Z = 7.99 (P < 0.00001)
Mean
1.59
0.51
1.55
0.94
1.7
1.33
1.85
1.04
1.11
1.13
1.2
SD
1.29
0.95
1.39
0.8
1.5
0.56
0.41
0.6
0.83
0.72
0.85
Total
9
18
17
20
5
23
5
98
15
24
13
117
Mean
1.05
0.24
0.21
0.26
0.5
0.89
0.34
0.31
0.3
0.14
0.14
SD
1.49
1.41
1.48
1.24
1.4
0.84
0.14
0.52
0.78
0.52
0.37
Total
13
12
15
20
8
20
5
103
15
23
13
114
Weight
0.0%
0.0%
4.3%
10.1%
1.6%
22.3%
0.0%
0.0%
12.7%
32.4%
16.6%
100.0%
IV, Random, 95% CI
0.54 [-0.63, 1.71]
0.27 [-0.64, 1.18]
1.34 [0.34, 2.34]
0.68 [0.03, 1.33]
1.20 [-0.43, 2.83]
0.44 [0.01, 0.87]
1.51 [1.13, 1.89]
0.73 [0.57, 0.89]
0.81 [0.23, 1.39]
0.99 [0.63, 1.35]
1.06 [0.56, 1.56]
0.84 [0.64, 1.05]
CIMT Usual Care Mean Difference Mean Difference
IV, Random, 95% CI
-4 -2 0 2 4Favours Usual Care Favours CIMT
Study or Subgroup
Boake 2007
Dahl 2008
Lin 2007
Lin 2009
Lin 2010
Myint 2008a
Page 2005
Wolf 2006
Wu 2007a
Wu 2007b
Wu 2007c
Total (95% CI)
Heterogeneity: Not applicable
Test for overall effect: Z = 7.79 (P < 0.00001)
Mean
1.59
0.51
1.55
0.94
1.7
1.33
1.85
1.04
1.11
1.13
1.2
SD
1.29
0.95
1.39
0.8
1.5
0.56
0.41
0.6
0.83
0.72
0.85
Total
9
18
17
20
5
23
5
98
15
24
13
5
Mean
1.05
0.24
0.21
0.26
0.5
0.89
0.34
0.31
0.3
0.14
0.14
SD
1.49
1.41
1.48
1.24
1.4
0.84
0.14
0.52
0.78
0.52
0.37
Total
13
12
15
20
8
20
5
103
15
23
13
5
Weight
0.0%
0.0%
0.0%
0.0%
0.0%
0.0%
100.0%
0.0%
0.0%
0.0%
0.0%
100.0%
IV, Random, 95% CI
0.54 [-0.63, 1.71]
0.27 [-0.64, 1.18]
1.34 [0.34, 2.34]
0.68 [0.03, 1.33]
1.20 [-0.43, 2.83]
0.44 [0.01, 0.87]
1.51 [1.13, 1.89]
0.73 [0.57, 0.89]
0.81 [0.23, 1.39]
0.99 [0.63, 1.35]
1.06 [0.56, 1.56]
1.51 [1.13, 1.89]
CIMT Usual Care Mean Difference Mean Difference
IV, Random, 95% CI
-4 -2 0 2 4Favours Usual Care Favours CIMT
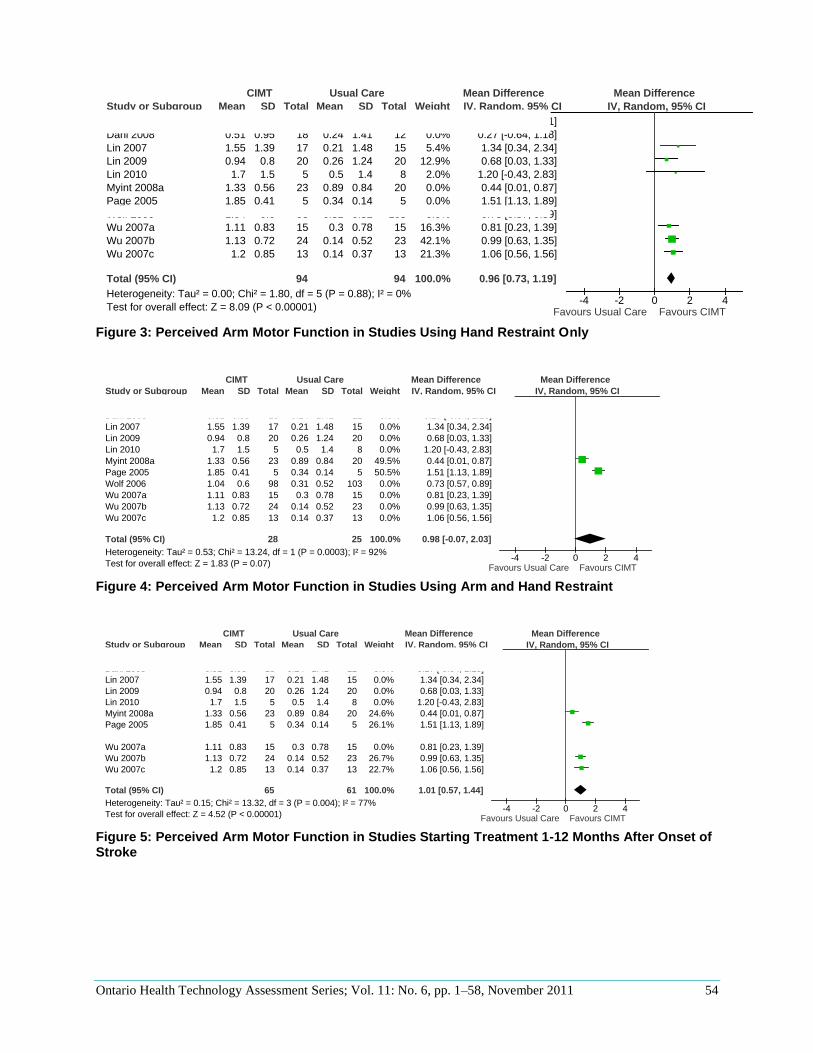
Ontario Health Technology Assessment Series; Vol. 11: No. 6, pp. 1–58, November 2011 54
Figure 3: Perceived Arm Motor Function in Studies Using Hand Restraint Only
Figure 4: Perceived Arm Motor Function in Studies Using Arm and Hand Restraint
Figure 5: Perceived Arm Motor Function in Studies Starting Treatment 1-12 Months After Onset of Stroke
Study or Subgroup
Boake 2007
Dahl 2008
Lin 2007
Lin 2009
Lin 2010
Myint 2008a
Page 2005
Wolf 2006
Wu 2007a
Wu 2007b
Wu 2007c
Total (95% CI)
Heterogeneity: Tau² = 0.00; Chi² = 1.80, df = 5 (P = 0.88); I² = 0%
Test for overall effect: Z = 8.09 (P < 0.00001)
Mean
1.59
0.51
1.55
0.94
1.7
1.33
1.85
1.04
1.11
1.13
1.2
SD
1.29
0.95
1.39
0.8
1.5
0.56
0.41
0.6
0.83
0.72
0.85
Total
9
18
17
20
5
23
5
98
15
24
13
94
Mean
1.05
0.24
0.21
0.26
0.5
0.89
0.34
0.31
0.3
0.14
0.14
SD
1.49
1.41
1.48
1.24
1.4
0.84
0.14
0.52
0.78
0.52
0.37
Total
13
12
15
20
8
20
5
103
15
23
13
94
Weight
0.0%
0.0%
5.4%
12.9%
2.0%
0.0%
0.0%
0.0%
16.3%
42.1%
21.3%
100.0%
IV, Random, 95% CI
0.54 [-0.63, 1.71]
0.27 [-0.64, 1.18]
1.34 [0.34, 2.34]
0.68 [0.03, 1.33]
1.20 [-0.43, 2.83]
0.44 [0.01, 0.87]
1.51 [1.13, 1.89]
0.73 [0.57, 0.89]
0.81 [0.23, 1.39]
0.99 [0.63, 1.35]
1.06 [0.56, 1.56]
0.96 [0.73, 1.19]
CIMT Usual Care Mean Difference Mean Difference
IV, Random, 95% CI
-4 -2 0 2 4Favours Usual Care Favours CIMT
Study or Subgroup
Boake 2007
Dahl 2008
Lin 2007
Lin 2009
Lin 2010
Myint 2008a
Page 2005
Wolf 2006
Wu 2007a
Wu 2007b
Wu 2007c
Total (95% CI)
Heterogeneity: Tau² = 0.53; Chi² = 13.24, df = 1 (P = 0.0003); I² = 92%
Test for overall effect: Z = 1.83 (P = 0.07)
Mean
1.59
0.51
1.55
0.94
1.7
1.33
1.85
1.04
1.11
1.13
1.2
SD
1.29
0.95
1.39
0.8
1.5
0.56
0.41
0.6
0.83
0.72
0.85
Total
9
18
17
20
5
23
5
98
15
24
13
28
Mean
1.05
0.24
0.21
0.26
0.5
0.89
0.34
0.31
0.3
0.14
0.14
SD
1.49
1.41
1.48
1.24
1.4
0.84
0.14
0.52
0.78
0.52
0.37
Total
13
12
15
20
8
20
5
103
15
23
13
25
Weight
0.0%
0.0%
0.0%
0.0%
0.0%
49.5%
50.5%
0.0%
0.0%
0.0%
0.0%
100.0%
IV, Random, 95% CI
0.54 [-0.63, 1.71]
0.27 [-0.64, 1.18]
1.34 [0.34, 2.34]
0.68 [0.03, 1.33]
1.20 [-0.43, 2.83]
0.44 [0.01, 0.87]
1.51 [1.13, 1.89]
0.73 [0.57, 0.89]
0.81 [0.23, 1.39]
0.99 [0.63, 1.35]
1.06 [0.56, 1.56]
0.98 [-0.07, 2.03]
CIMT Usual Care Mean Difference Mean Difference
IV, Random, 95% CI
-4 -2 0 2 4Favours Usual Care Favours CIMT
Study or Subgroup
Boake 2007
Dahl 2008
Lin 2007
Lin 2009
Lin 2010
Myint 2008a
Page 2005
Wolf 2006
Wu 2007a
Wu 2007b
Wu 2007c
Total (95% CI)
Heterogeneity: Tau² = 0.15; Chi² = 13.32, df = 3 (P = 0.004); I² = 77%
Test for overall effect: Z = 4.52 (P < 0.00001)
Mean
1.59
0.51
1.55
0.94
1.7
1.33
1.85
1.04
1.11
1.13
1.2
SD
1.29
0.95
1.39
0.8
1.5
0.56
0.41
0.6
0.83
0.72
0.85
Total
9
18
17
20
5
23
5
98
15
24
13
65
Mean
1.05
0.24
0.21
0.26
0.5
0.89
0.34
0.31
0.3
0.14
0.14
SD
1.49
1.41
1.48
1.24
1.4
0.84
0.14
0.52
0.78
0.52
0.37
Total
13
12
15
20
8
20
5
103
15
23
13
61
Weight
0.0%
0.0%
0.0%
0.0%
0.0%
24.6%
26.1%
0.0%
0.0%
26.7%
22.7%
100.0%
IV, Random, 95% CI
0.54 [-0.63, 1.71]
0.27 [-0.64, 1.18]
1.34 [0.34, 2.34]
0.68 [0.03, 1.33]
1.20 [-0.43, 2.83]
0.44 [0.01, 0.87]
1.51 [1.13, 1.89]
0.73 [0.57, 0.89]
0.81 [0.23, 1.39]
0.99 [0.63, 1.35]
1.06 [0.56, 1.56]
1.01 [0.57, 1.44]
CIMT Usual Care Mean Difference Mean Difference
IV, Random, 95% CI
-4 -2 0 2 4Favours Usual Care Favours CIMT
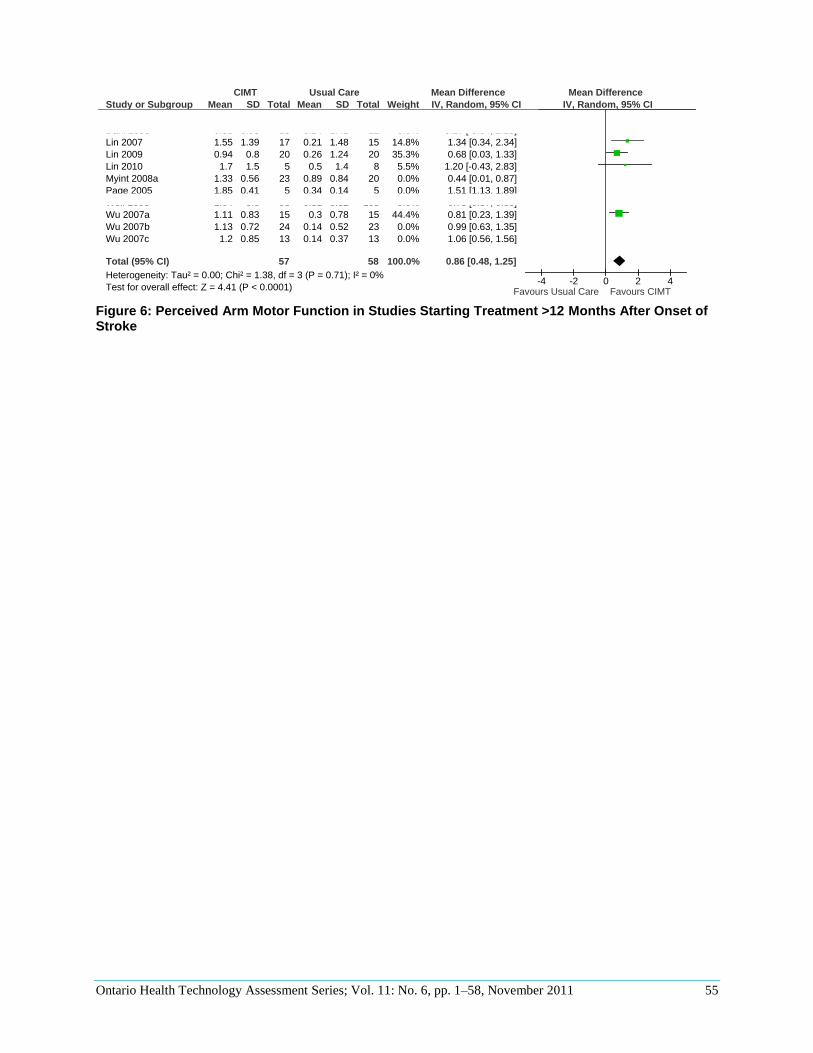
Ontario Health Technology Assessment Series; Vol. 11: No. 6, pp. 1–58, November 2011 55
Figure 6: Perceived Arm Motor Function in Studies Starting Treatment >12 Months After Onset of Stroke
Study or Subgroup
Boake 2007
Dahl 2008
Lin 2007
Lin 2009
Lin 2010
Myint 2008a
Page 2005
Wolf 2006
Wu 2007a
Wu 2007b
Wu 2007c
Total (95% CI)
Heterogeneity: Tau² = 0.00; Chi² = 1.38, df = 3 (P = 0.71); I² = 0%
Test for overall effect: Z = 4.41 (P < 0.0001)
Mean
1.59
0.51
1.55
0.94
1.7
1.33
1.85
1.04
1.11
1.13
1.2
SD
1.29
0.95
1.39
0.8
1.5
0.56
0.41
0.6
0.83
0.72
0.85
Total
9
18
17
20
5
23
5
98
15
24
13
57
Mean
1.05
0.24
0.21
0.26
0.5
0.89
0.34
0.31
0.3
0.14
0.14
SD
1.49
1.41
1.48
1.24
1.4
0.84
0.14
0.52
0.78
0.52
0.37
Total
13
12
15
20
8
20
5
103
15
23
13
58
Weight
0.0%
0.0%
14.8%
35.3%
5.5%
0.0%
0.0%
0.0%
44.4%
0.0%
0.0%
100.0%
IV, Random, 95% CI
0.54 [-0.63, 1.71]
0.27 [-0.64, 1.18]
1.34 [0.34, 2.34]
0.68 [0.03, 1.33]
1.20 [-0.43, 2.83]
0.44 [0.01, 0.87]
1.51 [1.13, 1.89]
0.73 [0.57, 0.89]
0.81 [0.23, 1.39]
0.99 [0.63, 1.35]
1.06 [0.56, 1.56]
0.86 [0.48, 1.25]
CIMT Usual Care Mean Difference Mean Difference
IV, Random, 95% CI
-4 -2 0 2 4Favours Usual Care Favours CIMT
Ontario Health Technology Assessment Series; Vol. 11: No. 6, pp. 1–58, November 2011 56
References
(1) Heart and Stroke Foundation of Canada. What is a Stroke? [Internet]. [updated 2008 Jan 8;
cited 2011 Sep 21]. Available from:
http://www.heartandstroke.on.ca/site/c.pvI3IeNWJwE/b.3581687/k.744C/Stroke__What_is_Str
oke.htm
(2) Teasell R, Meyer MJ, Foley N, Salter K, Willems D. Stroke rehabilitation in Canada: a work in
progress. Top Stroke Rehabil 2009; 16(1):11-9.
(3) Lin K, Chung H, Wu C, Liu H, Hsieh Y, Chen I et al. Constraint-induced therapy versus
control intervention in patients with stroke: a functional magnetic resonance imaging study. Am
J Phys Med Rehabil 2010; 89(3):177-85.
(4) Hall R, O'Callaghan C, Bayley M, Meyer S, Khan F, Liu Y, Linkewich B, Lumsden J, and
Willems D. Improving system efficiency by implementing stroke best practices. Ontario stroke
evaluation report 2010 [Internet]. Toronto: Institute for Clinical Evaluative Sciences (ICES).
2010 April [cited: 2011 Sep 21]. 116 p. Available from:
http://www.ices.on.ca/file/Final%20to%20post_dwnld_Jun20_11.pdf
(5) Uswatte G, Taub E, Morris D, Barman J, Crago J. Contribution of the shaping and restraint
components of constraint-induced movement therapy to treatment outcome. Neurorehabilitation
2006; 21(2):147-56.
(6) Liepert J. Evidence-based therapies for upper extremity dysfunction. Curr Opin Neurol 2010;
23(6):678-82.
(7) Page SJ, Sisto S, Levine P, Johnston MV, Hughes M. Modified constraint induced therapy: a
randomized feasibility and efficacy study. J Rehabil Res Dev 2001; 38(5):583-90.
(8) Baker K, Cano SJ., Playford ED. Outcome measurement in stroke: a scale selection strategy.
Stroke 2011; 42(6):1787-94.
(9) Wu C-Y, Lin K-C, Chen H-C, Chen I-H, Hong W-H. Effects of modified constraint-induced
movement therapy on movement kinematics and daily function in patients with stroke: A
kinematic study of motor control mechanisms. Neurorehabil Neural Repair 2007; 21(5):460-6.
(10) Lin KC, Chang YF, Wu CY, Chen YA. Effects of constraint-induced therapy versus bilateral
arm training on motor performance, daily functions, and quality of life in stroke survivors.
Neurorehabil Neural Repair 2009; 23(5):441-8.
(11) Taub E, Uswatte G, King DK, Morris D, Crago JE, Chatterjee A. A placebo-controlled trial of
constraint-induced movement therapy for upper extremity after stroke. Stroke 2006;
37(4):1045-9.
(12) Wu C, Chen C, Tsai W, Lin K, Chou S. A Randomized Controlled Trial of Modified
Constraint-Induced Movement Therapy for Elderly Stroke Survivors: Changes in Motor
Impairment, Daily Functioning, and Quality of Life. Arch Phys Med Rehabil 2007; 88(3):273-
8.
(13) Higgins JPT, Green S (editors). Cochrane handbook for systematic reviews of interventions
Ontario Health Technology Assessment Series; Vol. 11: No. 6, pp. 1–58, November 2011 57
Version 5.1.0 [updated March 2011]. The Cochrane Collaboration, 2011. Available from
www.cochrane-handbook.org.
(14) Sirtori V, Corbetta D, Moja L, Gatti R. Constraint-induced movement therapy for upper
extremities in stroke patients. Cochrane Database of Systematic Reviews 2009, Issue 4. Art.
No.: CD004433. DOI: 10.1002/14651858.CD004433.pub2.
(15) Atkins D, Best D , riss PA, ccles M, lottorp S et al. Grading quality of evidence and strength of
recommendations. BMJ 2004; 328(7454):1490-8.
(16) Goodman C. Literature searching and evidence interpretation for assessing health care
practices. Stockholm, Sweden: Swedish Council on Technology Assessment in Health Care.
1996 81 p. SBU Report No. 119E.
(17) Corbetta D, Sirtori V, Moja L, Gatti R. Constraint-induced movement therapy in stroke
patients: systematic review and meta-analysis. Eur J Phys Rehabil Med 2010; 46(4):537-44.
(18) French B, Leathley M, Sutton C, McAdam J, Thomas L, Forster A et al. A systematic review of
repetitive functional task practice with modelling of resource use, costs and effectiveness.
Health Technol Assess 2008; 12(30).
(19) Sirtori V, Corbetta D, Moja L, Gatti R. Constraint-induced movement therapy for upper
extremities in patients with stroke. Stroke 2010; 41(1):e57-e58.
(20) Atteya A-A. Effects of modified constraint induced therapy on upper limb function in subacute
stroke patients. Neurosciences 2004; 9(1):24-9.
(21) Lin KC, Wu CY, Wei TH, Lee CY, Liu JS. Effects of modified constraint-induced movement
therapy on reach-to-grasp movements and functional performance after chronic stroke: a
randomized controlled study. Clin Rehabil 2007; 21(12):1075-86.
(22) Myint JM, Yuen GF, Yu TK, Kng CP, Wong AM, Chow KK et al. A study of constraint-
induced movement therapy in subacute stroke patients in Hong Kong. Clin Rehabil 2008;
22(2):112-24.
(23) Page SJ, Levine P, Leonard AC. Modified constraint-induced therapy in acute stroke: a
randomized controlled pilot study. Neurorehabil Neural Repair 2005; 19(1):27-32.
(24) Page SJ, Sisto S, Johnston MV, Levine P. Modified constraint-induced therapy after subacute
stroke: a preliminary study. Neurorehabil Neural Repair 2002; 16(3):290-5.
(25) Page SJ, Sisto S, Levine P, McGrath RE. Efficacy of modified constraint-induced movement
therapy in chronic stroke: a single-blinded randomized controlled trial. Arch Phys Med Rehabil
2004; 85(1):14-8.
(26) Page SJ, Levine P, Leonard A, Szaflarski JP, Kissela BM. Modified constraint-induced therapy
in chronic stroke: results of a single-blinded randomized controlled trial. Phys Ther 2008;
88(3):333-40.
(27) Wu CY, Chen CL, Tang SF, Lin KC, Huang YY. Kinematic and clinical analyses of upper-
extremity movements after constraint-induced movement therapy in patients with stroke: a
randomized controlled trial. Arch Phys Med Rehabil 2007; 88(8):964-70.
Ontario Health Technology Assessment Series; Vol. 11: No. 6, pp. 1–58, November 2011 58
(28) Wu CY, Chen CL, Tsai WC, Lin KC, Chou SH. A randomized controlled trial of modified
constraint-induced movement therapy for elderly stroke survivors: changes in motor
impairment, daily functioning, and quality of life. Arch Phys Med Rehabil 2007; 88:273-8.
(29) Taub E, Miller N.E., Novack TA, Cook EW, Fleming W.C., Nepomuceno C.S. et al. Technique
to improve chronic motor deficit after stroke. Arch Phys Med Rehabil 1993; 74(4):347-54.
(30) Wolf SL, Winstein CJ, Miller JP, Taub E, Uswatte G, Morris D et al. Effect of constraint-
induced movement therapy on upper extremity function 3 to 9 months after stroke: the EXCITE
randomized clinical trial. JAMA 2006; 296(17):2095-104.
(31) Statistics Canada. Special Interest Profiles. Selected demographic, cultural, labour force,
educational and income characteristics. 2006 Census [Internet]. [updated 2006; cited 2011 May
16]. Available from:
http://www12.statcan.gc.ca/english/census06/shared/redirectproduct.cfm?ips=97-564-
XWE2006005