construct validation of bachman and palmer’s (1996...
TRANSCRIPT

Language Testing 2008 25 (2) 237–272
© 2008 SAGE Publications (Los Angeles, London, New Delhi and Singapore) DOI:10.1177/0265532207086783
Construct validation of Bachman andPalmer’s (1996) strategic competencemodel over time in EFL reading testsAek Phakiti University of Sydney, Australia
This article reports on a large-scale study that aims to validate the theory ofstrategic competence proposed by Bachman and Palmer (1996) through theuse of structural equation modeling (SEM). The present study examines therelationship of test-takers’ long-term strategic knowledge (i.e., trait strate-gies) and actual strategy use (i.e., state strategies) to second language (L2)reading test performance over time. The data were gathered on two occasions(during the mid-term and final examination periods). Five hundred and sixty-one Thai university test-takers answered a trait strategy use questionnaireprior to the mid-term and final reading achievement tests and, immediatelyafter completing each test, they answered a state strategy use questionnaire.It was found that (1) trait metacognitive strategy use (MSU) directly andstrongly affects trait cognitive strategy use (CSU); (2) trait CSU does notgreatly affect state CSU; (3) trait MSU directly affects state MSU in a spe-cific context, which in turn directly affects state CSU; and (4) state CSUdirectly affects a specific language test performance to a varying degree.
Key words: second language reading performance, state and trait strategyuse, strategic competence, structural equation modeling
I Introduction
McNamara (1996) pointed out three basic dimensions in which thenature of second language (L2) communicative ability has beenconceptualized: (1) factors constituting knowledge of a language;(2) other non-linguistic factors that are not specific to language suchas strategic competence and affect; and (3) the way actual real-timeinstances of language use are seen in the light of the precedingdimensions. Inferences about the first and second dimensions,according to McNamara, rest on an understanding of how language
Address for correspondence: Aek Phakiti, TESOL Program, Faculty of Education and Social Work,University of Sydney, NSW 2006, Australia; email: [email protected]
086783_LTJ_237-272.qxd 26/2/08 4:28 PM Page 237

238 Construct validation of a strategic competence model
knowledge interacts with the other non-linguistic factors constitutingability for use (Hymes, 1972). Bachman and Palmer’s (1996) workis evidence of an attempt to develop a model of what is involved insuch dimensions. In Bachman and Palmer’s (1996) model, commu-nicative language ability (CLA) is hypothesized to be the majorcontributor to language performance (other contributors include test-method facets, individual characteristics and random factors). Intheir model, Bachman and Palmer (1996) separate strategic compe-tence (as a non-linguistic factor) from language competence which,according to McNamara (1996), is an important step in discussing L2communicative ability. Strategic competence is a general abilitythat enables an individual to use available resources by regulatingonline cognitive processes in accomplishing a communicative goal(e.g., assessing the situation, setting goals and planning what to do).
Despite a decade of research into Bachman and Palmer’s power-ful theoretical model, much remains unclear in regard to the exactnature of strategic competence. McNamara (1996) pointed out thatdiscussion of strategic competence in this model is extremely pre-liminary and recommended that a full discussion of the model wouldbe helpful if cross-referenced to the literature in the areas of psy-chology, social psychology and pragmatics. In addition, Purpura(1999) pointed out that the depiction of strategic competence inBachman and Palmer’s (1996) model is not based on empiricalresearch. Therefore, Bachman and Palmer’s (1996) strategic com-petence model needs validation with empirical data. To date, no onehas attempted to validate Bachman and Palmer’s (1996) strategiccompetence model comprehensively with empirical longitudinaldata from high-stakes test contexts.
II Review of the literature
1 Validation research on the strategic competence model
There is consensus that strategic processing has a component ofawareness and occurs within the working memory realm (stipulatedwithin the focal attention or at least within peripheral attention;Cohen, 2007; Schmidt, 2001). What may distinguish strategies fromskills and other processes is the level of awareness and deliberation onthe processes, rather than the nature of processes per se (Alexanderet al., 1998). In L2 reading, for example, some individuals may para-phrase, underline, highlight or summarize the text without realizingthey do, whereas others may be conscious and purposeful in using
086783_LTJ_237-272.qxd 26/2/08 4:28 PM Page 238

Aek Phakiti 239
such processes. Despite the fact that strategy research ranks among themore popular topics in applied linguistic research, drawing conclu-sions about the nature of strategic processing from language learningstrategy research (see Anderson, 2005) in light of Bachman andPalmer’s (1996) strategic competence model is not always straightfor-ward. First, there are many schools of thought on strategic processingwhich may not attempt to produce or fine-tune the theoretical conceptof strategic competence in L2 communicative ability (e.g., O’Malley &Chamot, 1990; Oxford, 1990). A review of language learning strategyresearch shows that little effort has been made to distinguish observ-able strategic behaviors (e.g., cognitive and metacognitive strategyuse) from the unobservable strategic competence construct that formspart of L2 communicative ability. Furthermore, test-taking strategyresearch (see Cohen, 1998, 2007) that investigates special techniquestest-takers employ to optimize their language test performance hasbeen oriented towards test development, rather than used to validatestrategic competence theory. Cohen (2007) further points out thatstrategy data, particularly in validation research, are not usuallycollected in actual high-stakes testing situations. It may be that strat-egies actually used in responding to tests in high-stakes situationsdiffer from those identified under research conditions (Cohen, 2007),because there is no consequence for not answering test items.
In the language testing (LT) literature, there are only a few pub-lished studies that aim to validate Bachman and Palmer’s (1996)strategic model. Grounding his study in human-information process-ing theory (Gagné, Yekovich & Yekovich, 1993) which facilitatesgeneralizations about strategic processing in L2 use, Purpura (1999)examined the relationship between perceived cognitive andmetacognitive strategy use and language test performance (UCLES’sFirst Certificate in English (FCE) Anchor Test). He explored thisrelationship through the application of the structural equation mod-eling (SEM) approach with 1382 learners who answered a context-free strategy use questionnaire prior to test-taking. It was found thatcognitive processing was a multidimensional construct consisting ofa set of comprehending, memory and retrieval strategies. These com-plex cognitive strategies worked with one another to affect languageperformance. The SEM model of metacognitive strategy use wasfound to be a unidimensional construct consisting of a single set ofassessment processes (e.g., goal setting, planning, monitoring, self-evaluating and self-testing). Purpura found that metacognitive pro-cessing had significant, direct and positive effects on all the threecomponents of cognitive processing (values between 0.59 and 0.86)
086783_LTJ_237-272.qxd 26/2/08 4:28 PM Page 239

240 Construct validation of a strategic competence model
which directly affected language test performance. This finding sug-gests that the effect of cognitive strategies on test performance ismediated by metacognitive strategies. Purpura (1999) also found thatthe high-ability test-takers were likely to use metacognitive strat-egies more automatically than the low-ability ones. These differentpatterns in turn had a significant impact on their language perform-ance. In his conclusion, Purpura (1999) pointed out that Bachmanand Palmer’s (1996) strategic competence notion must be extendedbeyond a set of metacognitive strategies because individuals invokecognitive, affective and social strategies as well as metacognitivestrategies when they use the target language.
Following the work of Purpura (1999), Phakiti (2003b), throughthe use of a cognitive and metacognitive questionnaire drawn fromthe existing literature, retrospective interviews and an English-as-a-foreign-language (EFL) achievement test, investigated the relation-ship between 384 Thai learners’ cognitive and metacognitivestrategy use and their reading test performance. His study differedfrom Purpura’s in that test-takers answered the questionnaire regard-ing the degree of their strategy use during the test-taking immedi-ately after test completion. Using the factor structures from exploratoryfactor analyses (EFAs) to form composites of cognitive andmetacognitive strategies for further quantitative analyses, Phakitifound that metacognitive strategies were statistically positively relatedto cognitive strategies (at a correction-for-attenuation correlationof 0.76). With regard to the relationships between strategies and testperformance, cognitive and metacognitive strategy use was posi-tively correlated with the reading test performance, explaining about15–22% of the test score variance. Phakiti also found statisticaldifferences in the reported use of cognitive and metacognitivestrategies between highly successful, moderately successful andunsuccessful test-takers.
Other studies that examine the extent to which cognitive andmetacognitive strategy use is related to L2 test performance includethose of Song (2004 and 2005). Song (2004), by means of a revisedstrategy questionnaire mainly based on Purpura (1999), investigatedthe extent to which cognitive and metacognitive strategy useaccounted for Chinese test-takers’ performance in the College EnglishTest Band 4 through regression analyses. Song found that cognitiveand metacognitive strategies accounted for 8.6% of the test score. Inthe context of the Michigan English Language Assessment Battery(MELAB), Song (2005), after examining the strategy structures bymeans of EFAs and through regression analyses, found that the effects
086783_LTJ_237-272.qxd 26/2/08 4:28 PM Page 240

of strategy use on language performance were weak to moderate(explaining about 12.5–21.4% of the score variance).
2 Implications from the current research
Findings and insights from previous LT research have at least fourmajor implications for the design of the present study. The firstimplication is that previous research may have examined differentfacets of strategic competence. Purpura (1999) and Song (2005)examined test-takers’ perceptions regarding their normal use of a setof cognitive and metacognitive strategies without reference to a spe-cific context, while Phakiti (2003b) examined test takers’ reportedcognitive and metacognitive strategy use in a specific test context.The strategy use questionnaire items in Purpura, on the one hand, arewritten using the Simple Present tense, which reflects individuals’habitual strategy use, for example, ‘I double-check my understandingwhen I read.’ Each strategy use item in Phakiti, on the other hand, iswritten using the Simple Past tense, which suggests that the use of thestrategy relates specifically and exclusively to a particular contextand occasion, for example, ‘I double-checked my understanding dur-ing this reading test.’Accordingly, there may be underlying assump-tions about the nature of strategic competence that need clarificationprior to empirical data gathering.
Although Bachman and Palmer (1996) do not refer to strategiccompetence as metacognition, it can be argued that the nature ofthe two constructs is similar, given that both concern self-regulationand hence, as McNamara (1996) pointed out, the strategic com-petence model should be cross-referenced with the literature inthe areas of metacognition. According to metacognitive research(Baker & Brown, 1984; Flavell, 1985), metacognition has dual com-ponents: knowledge about cognition, which is general infor-mation that a person possesses concerning his or her awarenessabout strategy use when engaged in activities in general, and regula-tion of cognition, which refers to the effectiveness with whichthe person keeps track of ongoing cognitive processes and his orher use of strategies in order to solve problems or achieve desiredgoals. There is consensus in metacognitive research that these twocomponents are separate phenomena. That is, knowledge about cog-nition is relatively stable and stored in long-term memory (LTM),whereas regulation of cognition, such as checking comprehensionand evaluating performance, is rather unstable due to the nature ofspecific tasks and contexts at hand and occurs within working
Aek Phakiti 241
086783_LTJ_237-272.qxd 26/2/08 4:28 PM Page 241

242 Construct validation of a strategic competence model
memory (WM) space. Baker and Brown (1984) pointed out that theformer does not essentially equate to or fully guarantee the latter. Itmay be argued that both individuals’ knowledge about cognition andtheir capacity for regulation of cognition are what constitute strategiccompetence.
According to anxiety research (Spielberger, 1972), state and traitnotions may be applied in the assessment of the two metacognitiveconstructs (knowledge of cognition and regulation of cognition). Inpsychology, states and traits refer to two different classes of individ-uals’ psychological attributes which include (1) a relatively stable trait and (2) a transitory state. A trait facet of a construct is a relativelystable attribute of an individual across occasions (despite consider-able variation in the range of settings and circumstances), whereas astate facet is transitory, fluctuating and unstable in a given context.Hence, knowledge about cognition represents trait metacognition,whereas regulation of cognition represents state metacognition. In L2strategy research, general perceived strategy use free of contexts istrait-like knowledge of cognition, whereas actual perceived strategyuse in a specific context is state-like regulation of cognition. Thoughnot qualifying as traits and states in the original sense of the terms inanxiety research (Spielberger, 1972), the use of state and trait notionsto classify the two aspects of strategy use in strategic competenceresearch is a way forward. As Phakiti (2003a) has proposed, anempirical research into the relationship between perceived strategyuse across contexts and actual strategy use in a particular context hasthe potential to offer greater insights into an individual’s psychology.
For the purpose of this study, cognitive strategies are defined asactual conscious behaviors that individuals use to process languageto understand, learn or use in some context. Following the classifica-tions of cognitive and metacognitive strategy use1 by Purpura (1999),which are based on the theory of human-information processing(Gagné, Yekovich & Yekovich, 1993), cognitive strategies arecomposed of comprehending (for understanding, such as identifyingmain ideas, author’s attitudes, translation, predicting, inferencing),
1It should be noted that Bachman and Palmer (1996) do not discuss cognitive strategies in theirmodel. Rather, they discuss strategic competence as metacognitive strategies which have executivefunctions in language use. However, as Purpura (1999) pointed out, in order to better understandstrategic competence, cognitive and metacognitive strategy use should be included. The presentstudy, thus, does not validate Bachman and Palmer’s (1996) original strategic competence model,but rather it validates the more finely tuned conceptualization of their original theory that hasevolved over the past decade.
086783_LTJ_237-272.qxd 26/2/08 4:28 PM Page 242

memory (for storing information in memory, such as rereading orrepeating, note taking or underlining, paraphrasing) and retrieval (forrecalling information, such as using prior knowledge/experience,applying grammatical rules/knowledge) strategies. Metacognitivestrategies are conscious processes that regulate cognitive strategies and other processing. They are composed of planning (for futureactions and goal attainment, such as goal-setting, overseeing tasks,planning actions beforehand), monitoring (for checking ongoing com-prehension or performance, such as noticing comprehension failure orerrors, double-checking comprehension) and evaluating (for evalu-ation of past and current actions or performance, such as assessinglevel of difficulty, self-questioning, evaluating performance/productaccuracy) strategies. Hence, trait cognitive and metacognitive strategyuse is a general tendency of an individual to use cognitive andmetacognitive strategies over a variety of contexts, whereas state cog-nitive and metacognitive strategy use is a specific intensity of cogni-tive and metacognitive strategy use in an actual language use situation.
The second implication is that previous research was cross-sectional and might have limited generalizability, if we accept thatcognitive processing unfolds over time and depends greatly on thecontext in which it occurs. Since cross-sectional designs allow onlyfor the assessment of relationships among variables at one point intime, they do not allow for autoregressive effects or time lags(MacCallum & Austin, 2000), thereby limiting inferences on causal-ity or directional strategy influence on language learning or use.Furthermore, L2 test performance has been acknowledged as highlycomplex, multidimensional and variable according to a variety ofsocial and contextual factors (McNamara, 1996). This complexitycannot be captured in a single performance (Spolsky, 1995). Hence,there is a need to sample it across a range of contexts in order todemonstrate both behavioral consistency and factors involved at agiven time. Observation of language performance and strategy useconsistency is fundamental to the study of L2 test performance(Chapelle, 1998). Chapelle (1998) argued that operational settingschange according to changes in test method facets which in turninfluence individuals’ construction of context and their use ofmetacognitive strategies. A well-known research tool to investigatethe effect of context change is the multitrait-multimethod (MTMM)approach (Campbell & Fiske, 1959) which is adopted in the presentstudy. In this study, however, only two data points are obtained dueto the fact that there were only two high-stakes tests (mid-term andfinal tests) in this context (which is a limitation of the present study).
Aek Phakiti 243
086783_LTJ_237-272.qxd 26/2/08 4:28 PM Page 243

The third implication is that some previous research employedstandard statistical approaches (e.g., correlational and regressionanalyses) which are subject to certain analytical limitations sincethey do not directly explore and evaluate error of measurementeffects which limit generalization. Hence, following the work byPurpura (1999), the SEM approach – a robust statistical analysisfor testing substantive theories – will be employed because itdirectly considers score reliability (i.e., [1 – measurement error vari-ance] / total score variance) as part of model fitting. Since all meas-ures (tests and questionnaires) contain non-random error, it isimportant to allow this error to be incorporated in the models in sucha way that will not directly affect parameter estimates (Purpura,1999). The SEM approach is powerful in that it analyzes the struc-ture and effect of unobservable latent variables through the analysisof individual differences data, by statistically relating co-variationbetween observed variables to latent variables. The underlying prin-ciple of this analysis is that the statistical fit of such a model can beadduced as evidence supporting the hypothesis.
The fourth implication is that because various aspects of languageare processed and stored differently in the brain for different languageskills (VanPatten, 1994), different domains of language need to be speci-fically researched (Schmidt, 1995). Hence, EFL reading comprehensiontests are chosen. Another reason for excluding other language skills isdue to the depth and maturity of L2 reading research which allows theresearcher to go beyond exploratory, baseline investigations. A numberof studies in L2 reading strategies have provided insights into howstrategic reading affects success in L2 comprehension and how goodreaders differ from poor readers due to the strategic ability variable (seeAlderson, 2000; Anderson, 1999; Carrell et al., 1998; Hudson, 2007).
3 Research questions and hypotheses
The literature above has suggested that first, metacognitive strategyuse (MSU) is directly and highly related to cognitive strategy use(CSU). MSU such as planning, monitoring and evaluating regulatesthe extent to which cognitive strategies are to tackle specific needs inlanguage use. Second, cognitive strategies may have a direct relation-ship to a particular language performance since they are more closelyrelated to the target language than metacognitive strategies. The SEMmodels tested by Purpura are extended to include both state and traitstrategy use in this study and to accommodate over time data collec-tions (two months apart) for observation of consistency in findings.
244 Construct validation of a strategic competence model
086783_LTJ_237-272.qxd 26/2/08 4:28 PM Page 244

State CSU is hypothesized to directly influence a specific test perform-ance. With regard to language test performance, lexico-grammaticalability as assessed through gap-filling reading tests is hypothesized toinfluence reading comprehension ability (e.g., text comprehension),since success in L2 reading largely depends on decoding and the acti-vation of lexico-grammatical knowledge (Nation, 2001) and learnersat upper-beginners and intermediate levels need to decode texts at thelexico-grammatical levels when they read (Purpura, 1999). Figure 1presents the hypothesized model. The model in Figure 1 is derivedfrom a combination of two separate SEM analyses (i.e., Time 1 andTime 2; to be discussed in the Methods section).2 The longitudinalSEM modeling (as in Figure 1) has at least three main advantages forthis validation research: it allows us (1) to examine the co-variation ofvariables over time, (2) to test models that include data collected atmultiple time points, thereby making it possible to test bi-directionalityof cause and effect, and (3) to examine the consistency of variables’effects on others over time. The hypothesized model will answer thefollowing research questions:
• To what extent does trait MSU at Time 1 relate to trait MSU atTime 2?
• To what extent does trait MSU affect trait CSU?• To what extent does trait CSU affect state CSU?• To what extent does trait MSU affect state MSU in a specific
context?• To what extent does state MSU affect state CSU?• To what extent does state CSU affect a specific language test per-
formance?
III Methods
1 Setting and participants
The study was conducted at a Thai government university in thenorth of Thailand. Bachelor’s degree students enrolled in an English
Aek Phakiti 245
2During model modification, the Lagrange Multiplier (LM) Test (to test the hypothesis on statisti-cal necessity of restrictions existing in the hypothesized model, i.e., for adding parameters) sug-gested a missing path between trait MSU at Time 1 and trait MSU at Time 2. Given that trait MSUshould be related, a correlation path was added in the model. Furthermore, the direct influence oftrait MSU and trait CSU on language test performance was tested prior to the model in Figure 1.However, the model did not hold statistically; the Wald (W) test for dropping parameters suggestedthat the parameters were non-significant to the model; and hence the model was rejected.
086783_LTJ_237-272.qxd 26/2/08 4:28 PM Page 245

246 Construct validation of a strategic competence model
subject (Fundamental English I) were asked to voluntarily partici-pate in the study. The data were gathered during their mid-term(accounting for 35% of the total grade) and final (40%) test periods.Data from 561 Thai university students were used in this study. Theywere made up of 201 males (37%) and 360 females (63%). Theywere between the ages of 18 and 24 (mean age � 18.53, SD � 0.70).All of these test-takers had been studying English in Thailand forapproximately eight years. Based on their English entrance exam-ination results, their English proficiency levels ranged fromadvanced beginners to intermediate.
2 Measurement instruments
There were two major sets of research instruments in this study:(1) two different English reading tests (mid-term and final tests); and(2) four 6-point Likert-scale, strategy use questionnaires (2 states, 2traits) in Thai.
TMSU1 TCSU1
SMSU1 SCSU1
EFL Lex-GR1EFL RCom2
SCSU2 SMSU2
TCSU2 TMSU2
EFL RCom1EFL Lex-GR2
T = Trait, S = State, 1 = Time 1, 2 = Time 2,MSU = Metacognitive Strategy Use, CSU = Cognitive Strategy Use
Figure 1 Hypothesized relationships between state and trait cognitive and metacog-nitive strategy use and L2 reading test performance over time
086783_LTJ_237-272.qxd 26/2/08 4:28 PM Page 246

a Mid-term and final reading test: The topics in the tests includefamily, occupation, clothing and fashion, personalities, giving direc-tions, accommodation, food and drink, travel and transportation. Themid-term and final tests were multiple-choice, 80-item tests. Eachtest lasted three hours. The mid-term and final reading tests werecomposed of two major sections with sub-sections in them.
• Section 1: Gap-filling (like rational cloze): This section (com-posed of three sub-sections) was designed to measure the test-takers’ ability to comprehend texts drawing on their knowledgeof structural and lexical appropriacy, as well as their pragmaticand discourse competence (see Read, 2000). Items tested wereselected based on the structural, lexical, pragmatic and discourseskills taught in the class. In the mid-term test, there were 46 testitems (21 to measure reading/vocabulary; 25 to measure reading/grammar). In the final test, there were 43 test items (20 to measurereading/vocabulary; 23 to measure reading/grammar). For the pur-pose of this study, performance on this section was labelled aslexico-grammatical reading ability (LEX-GR).
• Section 2: Reading comprehension: This section (composed of 2sub-sections) consisted of various passages, ranging from 100words to 700 words. It aimed to measure the test-takers’ abilityto read English texts for main ideas, details and inferences. Thefirst sub-section aimed to measure scanning and skimming forinformation abilities. The second sub-section aimed to measurethe ability to identify main topics/ideas, titles, writer’s purposes,reference words, implied statements, vocabulary in context, true/false statements and specific details. In the mid-term test, therewere 34 items for Section 2 and in the final test, there were 37 items.For the purpose of this study, performance on this section waslabelled as text comprehension (TxtCOM).
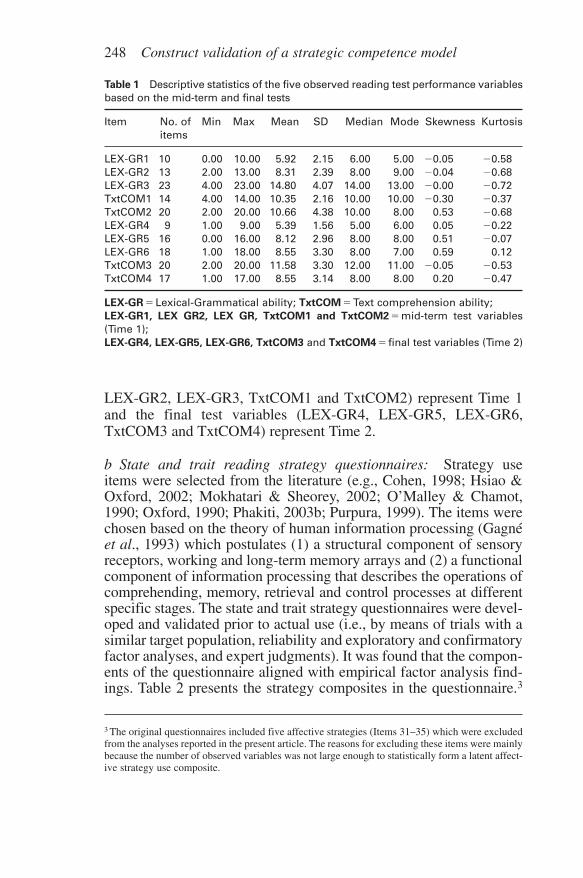
Approximate person-separation estimates (like KR-20; based on theRasch IRT analyses by the Quest Program; Adams and Khoo, 1996)were 0.91 for the mid-term test (0.86 and 0.83 for Sections 1 and 2,respectively) and 0.89 for the final test (0.82 and 0.79 for Sections1 and 2, respectively). Based on misfit statistics derived from the IRT analyses, misfitting test-takers in both the mid-term and finaltests were eliminated from the data set. Table 1 presents descriptivestatistics of the 10 observed reading test performance variables to beused in the SEM models. All variable skewness and kurtosis statisticswere within the acceptable limits, which was suggestive of univari-ately normal distributions. The mid-term test variables (LEX-GR1,
Aek Phakiti 247
086783_LTJ_237-272.qxd 26/2/08 4:28 PM Page 247
248 Construct validation of a strategic competence model
LEX-GR2, LEX-GR3, TxtCOM1 and TxtCOM2) represent Time 1and the final test variables (LEX-GR4, LEX-GR5, LEX-GR6,TxtCOM3 and TxtCOM4) represent Time 2.
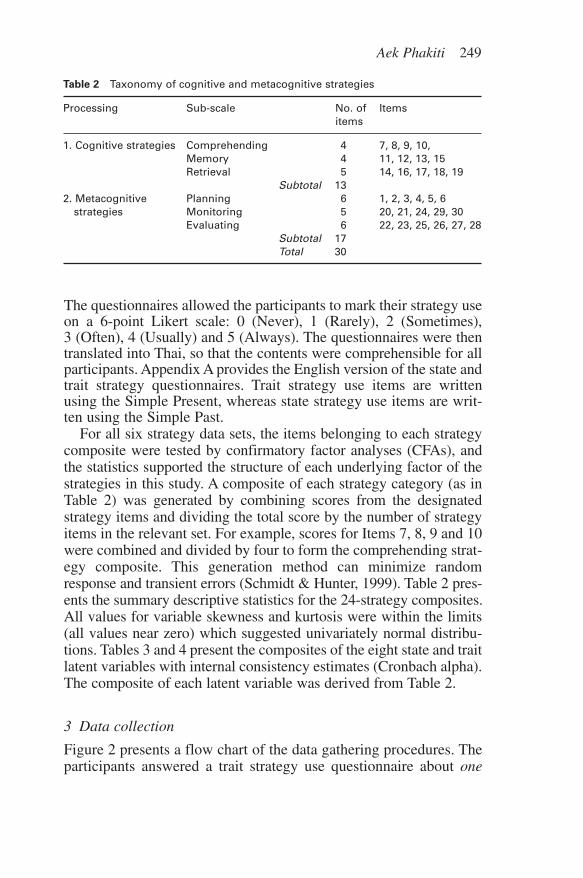
b State and trait reading strategy questionnaires: Strategy useitems were selected from the literature (e.g., Cohen, 1998; Hsiao &Oxford, 2002; Mokhatari & Sheorey, 2002; O’Malley & Chamot,1990; Oxford, 1990; Phakiti, 2003b; Purpura, 1999). The items werechosen based on the theory of human information processing (Gagnéet al., 1993) which postulates (1) a structural component of sensoryreceptors, working and long-term memory arrays and (2) a functionalcomponent of information processing that describes the operations ofcomprehending, memory, retrieval and control processes at differentspecific stages. The state and trait strategy questionnaires were devel-oped and validated prior to actual use (i.e., by means of trials with asimilar target population, reliability and exploratory and confirmatoryfactor analyses, and expert judgments). It was found that the compon-ents of the questionnaire aligned with empirical factor analysis find-ings. Table 2 presents the strategy composites in the questionnaire.3
3 The original questionnaires included five affective strategies (Items 31–35) which were excludedfrom the analyses reported in the present article. The reasons for excluding these items were mainlybecause the number of observed variables was not large enough to statistically form a latent affect-ive strategy use composite.
Table 1 Descriptive statistics of the five observed reading test performance variablesbased on the mid-term and final tests
Item No. of Min Max Mean SD Median Mode Skewness Kurtosisitems
LEX-GR1 10 0.00 10.00 5.92 2.15 6.00 5.00 �0.05 �0.58LEX-GR2 13 2.00 13.00 8.31 2.39 8.00 9.00 �0.04 �0.68LEX-GR3 23 4.00 23.00 14.80 4.07 14.00 13.00 �0.00 �0.72TxtCOM1 14 4.00 14.00 10.35 2.16 10.00 10.00 �0.30 �0.37TxtCOM2 20 2.00 20.00 10.66 4.38 10.00 8.00 0.53 �0.68LEX-GR4 9 1.00 9.00 5.39 1.56 5.00 6.00 0.05 �0.22LEX-GR5 16 0.00 16.00 8.12 2.96 8.00 8.00 0.51 �0.07LEX-GR6 18 1.00 18.00 8.55 3.30 8.00 7.00 0.59 0.12TxtCOM3 20 2.00 20.00 11.58 3.30 12.00 11.00 �0.05 �0.53TxtCOM4 17 1.00 17.00 8.55 3.14 8.00 8.00 0.20 �0.47
LEX-GR � Lexical-Grammatical ability; TxtCOM � Text comprehension ability;LEX-GR1, LEX GR2, LEX GR, TxtCOM1 and TxtCOM2 � mid-term test variables(Time 1);LEX-GR4, LEX-GR5, LEX-GR6, TxtCOM3 and TxtCOM4 � final test variables (Time 2)
086783_LTJ_237-272.qxd 26/2/08 4:28 PM Page 248
The questionnaires allowed the participants to mark their strategy useon a 6-point Likert scale: 0 (Never), 1 (Rarely), 2 (Sometimes),3 (Often), 4 (Usually) and 5 (Always). The questionnaires were thentranslated into Thai, so that the contents were comprehensible for allparticipants. Appendix A provides the English version of the state andtrait strategy questionnaires. Trait strategy use items are writtenusing the Simple Present, whereas state strategy use items are writ-ten using the Simple Past.
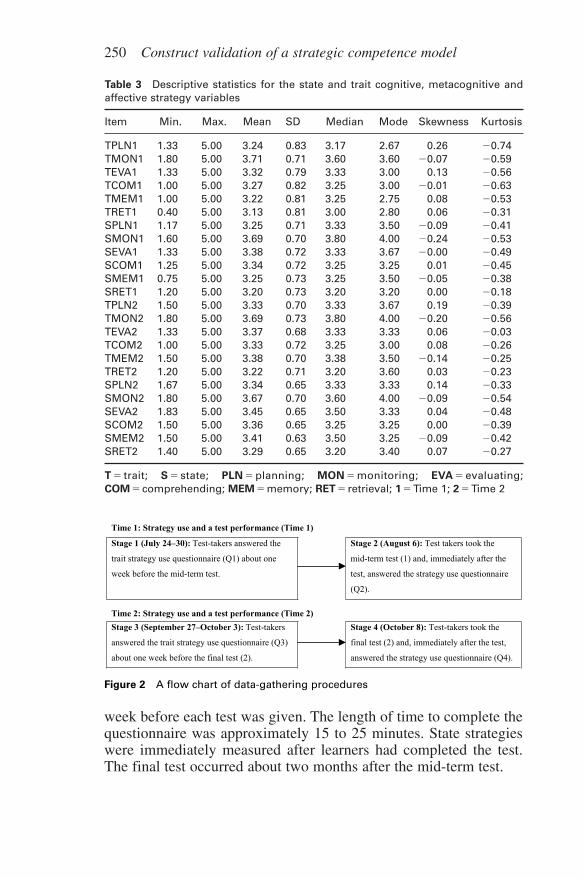
For all six strategy data sets, the items belonging to each strategycomposite were tested by confirmatory factor analyses (CFAs), andthe statistics supported the structure of each underlying factor of thestrategies in this study. A composite of each strategy category (as inTable 2) was generated by combining scores from the designatedstrategy items and dividing the total score by the number of strategyitems in the relevant set. For example, scores for Items 7, 8, 9 and 10were combined and divided by four to form the comprehending strat-egy composite. This generation method can minimize randomresponse and transient errors (Schmidt & Hunter, 1999). Table 2 pres-ents the summary descriptive statistics for the 24-strategy composites.All values for variable skewness and kurtosis were within the limits(all values near zero) which suggested univariately normal distribu-tions. Tables 3 and 4 present the composites of the eight state and traitlatent variables with internal consistency estimates (Cronbach alpha).The composite of each latent variable was derived from Table 2.
3 Data collection
Figure 2 presents a flow chart of the data gathering procedures. Theparticipants answered a trait strategy use questionnaire about one
Aek Phakiti 249
Table 2 Taxonomy of cognitive and metacognitive strategies
Processing Sub-scale No. of Itemsitems
1. Cognitive strategies Comprehending 4 7, 8, 9, 10,Memory 4 11, 12, 13, 15Retrieval 5 14, 16, 17, 18, 19
Subtotal 132. Metacognitive Planning 6 1, 2, 3, 4, 5, 6
strategies Monitoring 5 20, 21, 24, 29, 30Evaluating 6 22, 23, 25, 26, 27, 28
Subtotal 17Total 30
086783_LTJ_237-272.qxd 26/2/08 4:28 PM Page 249
250 Construct validation of a strategic competence model
week before each test was given. The length of time to complete thequestionnaire was approximately 15 to 25 minutes. State strategieswere immediately measured after learners had completed the test.The final test occurred about two months after the mid-term test.
Table 3 Descriptive statistics for the state and trait cognitive, metacognitive andaffective strategy variables
Item Min. Max. Mean SD Median Mode Skewness Kurtosis
TPLN1 1.33 5.00 3.24 0.83 3.17 2.67 0.26 �0.74TMON1 1.80 5.00 3.71 0.71 3.60 3.60 �0.07 �0.59TEVA1 1.33 5.00 3.32 0.79 3.33 3.00 0.13 �0.56TCOM1 1.00 5.00 3.27 0.82 3.25 3.00 �0.01 �0.63TMEM1 1.00 5.00 3.22 0.81 3.25 2.75 0.08 �0.53TRET1 0.40 5.00 3.13 0.81 3.00 2.80 0.06 �0.31SPLN1 1.17 5.00 3.25 0.71 3.33 3.50 �0.09 �0.41SMON1 1.60 5.00 3.69 0.70 3.80 4.00 �0.24 �0.53SEVA1 1.33 5.00 3.38 0.72 3.33 3.67 �0.00 �0.49SCOM1 1.25 5.00 3.34 0.72 3.25 3.25 0.01 �0.45SMEM1 0.75 5.00 3.25 0.73 3.25 3.50 �0.05 �0.38SRET1 1.20 5.00 3.20 0.73 3.20 3.20 0.00 �0.18TPLN2 1.50 5.00 3.33 0.70 3.33 3.67 0.19 �0.39TMON2 1.80 5.00 3.69 0.73 3.80 4.00 �0.20 �0.56TEVA2 1.33 5.00 3.37 0.68 3.33 3.33 0.06 �0.03TCOM2 1.00 5.00 3.33 0.72 3.25 3.00 0.08 �0.26TMEM2 1.50 5.00 3.38 0.70 3.38 3.50 �0.14 �0.25TRET2 1.20 5.00 3.22 0.71 3.20 3.60 0.03 �0.23SPLN2 1.67 5.00 3.34 0.65 3.33 3.33 0.14 �0.33SMON2 1.80 5.00 3.67 0.70 3.60 4.00 �0.09 �0.54SEVA2 1.83 5.00 3.45 0.65 3.50 3.33 0.04 �0.48SCOM2 1.50 5.00 3.36 0.65 3.25 3.25 0.00 �0.39SMEM2 1.50 5.00 3.41 0.63 3.50 3.25 �0.09 �0.42SRET2 1.40 5.00 3.29 0.65 3.20 3.40 0.07 �0.27
T � trait; S � state; PLN � planning; MON � monitoring; EVA � evaluating;COM � comprehending; MEM � memory; RET � retrieval; 1 � Time 1; 2 � Time 2
Time 1: Strategy use and a test performance (Time 1)
Stage 1 (July 24–30): Test-takers answered the
trait strategy use questionnaire (Q1) about one
week before the mid-term test.
Stage 2 (August 6): Test takers took the
mid-term test (1) and, immediately after the
test, answered the strategy use questionnaire
(Q2).
Time 2: Strategy use and a test performance (Time 2) Stage 3 (September 27–October 3): Test-takers
answered the trait strategy use questionnaire (Q3)
about one week before the final test (2).
Stage 4 (October 8): Test-takers took the
final test (2) and, immediately after the test,
answered the strategy use questionnaire (Q4).
Figure 2 A flow chart of data-gathering procedures
086783_LTJ_237-272.qxd 26/2/08 4:28 PM Page 250

4 SEM analyses
SPSS (Statistical Packages for Social Sciences) program was used asa data file manager prior to using the EQS 6 program for SEM(Bentler, 1985–2006). The EQS 6 program was used to impute data,perform missing and outlier data analyses, confirmatory factoranalyses (CFAs), covariance structure analyses and finally SEM.The maximum likelihood (ML) estimation method was employedin model estimations. ML estimation is typically used to seek par-ameters that best reproduce the estimated population variance-covariance matrix. The evaluation of model adequacy is based on aninspection of the values of standardized residuals, the chi-square (�2)statistics, other fit indices (e.g., Bentler-Bonett normed fit index(NFI) and comparative fit index (CFI) and informed by my know-ledge of the data and theoretical and conceptual aspects of the con-structs under study (see Bentler, 2006; Byrne, 1994, for a discussionof the evaluation of model adequacy). It was found that the changes
Aek Phakiti 251
Table 4 Internal consistency estimates (Cronbach alpha) for observed variables
Composite No. of Items used Internal items consistency
1. Trait metacognitive strategy 3 TPLN1, TMON1, TEVA1 0.86use Time 1
2. Trait cognitive strategy use 3 TCOM1, TMEM1, TRET1 0.89Time 1
3. State metacognitive strategy 3 SPLN1, SMON1, SEVA1 0.83use Time 2
4. State cognitive strategy use 3 SCOM1, SMEM1, SRET1 0.88Time 2
5. Lexical-Grammatical ability 3 LEX-GR1, LEX-GR2, 0.86Time 1 LEX-GR3
6. Reading comprehension 2 TxtCOM1, TxtCOM2 0.83ability Time 1
7. Trait metacognitive strategy 3 TPLN2, TMON2, TEVA2 0.87use Time 2
8. Trait cognitive strategy use 3 TCOM2, TMEM2, TRET2 0.89Time 2
9. State metacognitive strategy 3 SPLN2, SMON2, SEVA2 0.86use Time 2
10. State cognitive strategy use 3 SCOM2, SMEM2, SRET2 0.87Time 2
11. Lexical-Grammatical ability 3 LEX-GR4, LEX-GR5, 0.82Time 2 LEX-GR6
12. Reading comprehension 2 TxtCOM3, TxtCOM4 0.79ability Time 2
Total 34 0.95
086783_LTJ_237-272.qxd 26/2/08 4:28 PM Page 251

252 Construct validation of a strategic competence model
in the factor loadings on both occasions in the full SEM model(Figure 3) in comparison with those in each separate cross-sectionalSEM model (see Appendix B) were statistically non-significant.Based on Purpura (1999), changes in factor loadings and parameterestimates in a full model are to be expected as more information isincluded for analysis.
IV Results and discussion
1 Statistical evaluation of the hypothesized SEM model
It was found that the global fit of the model was adequate for interpre-tation of the relationships between state and trait strategy use and EFLreading test performance over time. For example, the average off-diag-onal absolute standardized residual was 0.063 which was near zero. Theindependence chi-square statistic (�2
(561)) was 15583.483. The Chi-square statistic of the full SEM model (�2
(500)) was 1802.437 (as inFigure 3). The probability value for this chi-square statistic was signifi-cant (p � 0.000).4 In the SEM approach, the large difference betweenthe independence �2 statistic and that of the full model (i.e., 13781.046)suggested a good model fit (Byrne, 1994). The standard fit indices suchas the Bentler-Bonett Normed Fit Index (NFI) which was 0.90, theBentler-Bonett Non-Normed Fit Index (NNFI) which was 0.91, theComparative Fit Index (CFI) which was 0.93 and Root Mean-SquareError of Approximation (RMSEA) which was 0.058 (ideally RMSEAshould be less than 0.05), were acceptable. Generally speaking, fitindices of 0.90 and above are deemed sufficient to accept the testedmodel (Bentler, 2006) as such values indicate that the relative overallfit of the hypothesized model is about 90% better than that of thenull model estimated with the same sample data. The values of the indi-vidual parameters were inspected and it was found that all were withinthe expected ranges (�1 range, � SE for standardized solution) andthere were no anomalies.
2 Parameter estimation
Figure 3 presents the hypothesized SEM model along with theestimates of factor loadings and error/disturbance terms. Estimates
4Unlike other standard statistical analyses, SEM researchers need to obtain a nonsignificant �2
(p � 0.001). Limitations of the �2 statistic as a fit index (e.g., no upper bound, sensitivity to samplesize) are widely discussed in most SEM textbooks (e.g., Byrne, 1994; Kline, 1998).
086783_LTJ_237-272.qxd 26/2/08 4:28 PM Page 252

Aek Phakiti 253
Figure 3 Hypothesized SEM latent model of the relationships between state and traitcognitive and metacognitive strategy use and L2 reading test performance over time
TxtCOM4
0.88*
TMSU1*
0.84*
TPLN10.55E1*
0.74*TMON10.68E2*
TEVA10.47E3*0.87*
TCSU1
0.85*
TCOM1 0.53 E4*
0.85*TMEM1 0.53 E5*
TRET1 0.49 E6*
0.89*
SMSU1
0.81*
SPLN10.58E7*
0.69*SMON10.73E8*
SEVA10.46E9*
0.87*
SCSU1
0.84*
SCOM1 0.55 E10*
0.81* SMEM1 0.59 E11*
SRET1 0.49 E12*
0.95*
D2*
0.32
0.22* D4*
0.37
0.76*D3*
0.64
0.76*
0.83*
SCSU20.83*SCOM20.55E27*
0.81*SMEM20.58E28*
SRET20.56E29*
0.89*
SMSU20.83*
SPLN2 0.56 E24*
0.74*SMON2 0.67 E25*
SEVA20.45
E26*
0.87*
TCSU2
0.88*TCOM20.48E21*
0.82*TMEM20.57E22*
TRET20.49E23*
0.90*
TMSU2*
0.85*TPLN2 0.52 E18*
0.76*TMON2 0.65 E19*
TEVA2 0.44 E20*
0.75*
D10
0.30
0.25*0.79*
D9
0.62
0.96*
D8
0.29
0.56*
0.84*
EFL LEX-GR1 0.73* LEX-GR1 0.68 E13*
0.78*
LEX-GR2 0.62 E14*
LEX-GR3 0.53 E15*
0.86*
EFL RCOM10.72* TxtCOM1 0.69 E16*
TxtCOM2 0.51 E17*
0.77*
EFL RCOM20.79*TxtCOM30.62E33*
TxtCOM40.64E34*
0.79*
EFL LEX-GR2
0.62*LEX-GR40.78E30*
0.76*LEX-GR50.65E31*
LEX-GR60.61E32*
0.99*
D6
0.12
0.55* D5
0.83
0.40*
D11
0.65
0.82*
D12
0.38
0.57*
0.15*
0.88*
0.84*
0.55
0.74*0.68
0.470.87*
0.85*
0.53
0.85*0.53
0.49
0.89*
0.81*
0.58
0.69*0.73
0.46
0.87*
0.84*
0.55
0.81* 0.59
0.49
0.95*
0.32
0.22*
0.37
0.76*
0.64
0.76*
0.83*
0.83*0.55
0.81*0.58
0.56
0.89*
0.83*0.56
0.74*0.67
0.45
0.87*
0.88*0.48
0.82*0.57
0.49
0.90*
0.85*0.52
0.76*0.65
0.44
0.75*
0.30
0.25*0.79*
0.62
0.96*
0.29
0.56*
0.84*
0.73* 0.68
0.78*0.62
0.53
0.86*
0.72* 0.69
0.51
0.77*
0.79*0.62
0.64
0.79*
0.62*
0.78
0.76*0.65
0.61
0.99*
0.12
0.55*
0.83
0.40*
0.65
0.82*
0.38
0.57*
0.15*
Chi-square (χ2(500)) = 1802.437 P = 0.000 CFI = 0.93 RMSEA = 0.06
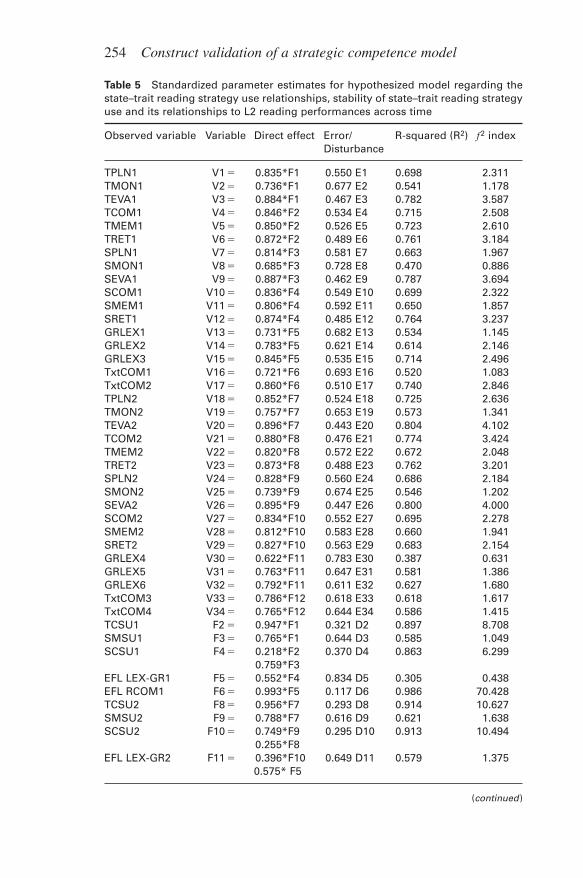
of the factor loadings were relatively large, ranging from 0.62 to 0.89,and statistically significant, and the standard errors were acceptable.Table 5 provides the standardized parameter estimates for the structuralmodel. The squared multiple correlation (R2) and Magnitude-of-Effect
086783_LTJ_237-272.qxd 26/2/08 4:28 PM Page 253
254 Construct validation of a strategic competence model
Table 5 Standardized parameter estimates for hypothesized model regarding thestate–trait reading strategy use relationships, stability of state–trait reading strategyuse and its relationships to L2 reading performances across time
Observed variable Variable Direct effect Error/ R-squared (R2) f2 indexDisturbance
TPLN1 V1 � 0.835*F1 0.550 E1 0.698 2.311TMON1 V2 � 0.736*F1 0.677 E2 0.541 1.178TEVA1 V3 � 0.884*F1 0.467 E3 0.782 3.587TCOM1 V4 � 0.846*F2 0.534 E4 0.715 2.508TMEM1 V5 � 0.850*F2 0.526 E5 0.723 2.610TRET1 V6 � 0.872*F2 0.489 E6 0.761 3.184SPLN1 V7 � 0.814*F3 0.581 E7 0.663 1.967SMON1 V8 � 0.685*F3 0.728 E8 0.470 0.886SEVA1 V9 � 0.887*F3 0.462 E9 0.787 3.694SCOM1 V10 � 0.836*F4 0.549 E10 0.699 2.322SMEM1 V11 � 0.806*F4 0.592 E11 0.650 1.857SRET1 V12 � 0.874*F4 0.485 E12 0.764 3.237GRLEX1 V13 � 0.731*F5 0.682 E13 0.534 1.145GRLEX2 V14 � 0.783*F5 0.621 E14 0.614 2.146GRLEX3 V15 � 0.845*F5 0.535 E15 0.714 2.496TxtCOM1 V16 � 0.721*F6 0.693 E16 0.520 1.083TxtCOM2 V17 � 0.860*F6 0.510 E17 0.740 2.846TPLN2 V18 � 0.852*F7 0.524 E18 0.725 2.636TMON2 V19 � 0.757*F7 0.653 E19 0.573 1.341TEVA2 V20 � 0.896*F7 0.443 E20 0.804 4.102TCOM2 V21 � 0.880*F8 0.476 E21 0.774 3.424TMEM2 V22 � 0.820*F8 0.572 E22 0.672 2.048TRET2 V23 � 0.873*F8 0.488 E23 0.762 3.201SPLN2 V24 � 0.828*F9 0.560 E24 0.686 2.184SMON2 V25 � 0.739*F9 0.674 E25 0.546 1.202SEVA2 V26 � 0.895*F9 0.447 E26 0.800 4.000SCOM2 V27 � 0.834*F10 0.552 E27 0.695 2.278SMEM2 V28 � 0.812*F10 0.583 E28 0.660 1.941SRET2 V29 � 0.827*F10 0.563 E29 0.683 2.154GRLEX4 V30 � 0.622*F11 0.783 E30 0.387 0.631GRLEX5 V31 � 0.763*F11 0.647 E31 0.581 1.386GRLEX6 V32 � 0.792*F11 0.611 E32 0.627 1.680TxtCOM3 V33 � 0.786*F12 0.618 E33 0.618 1.617TxtCOM4 V34 � 0.765*F12 0.644 E34 0.586 1.415TCSU1 F2 � 0.947*F1 0.321 D2 0.897 8.708SMSU1 F3 � 0.765*F1 0.644 D3 0.585 1.049SCSU1 F4 � 0.218*F2 0.370 D4 0.863 6.299
0.759*F3EFL LEX-GR1 F5 � 0.552*F4 0.834 D5 0.305 0.438EFL RCOM1 F6 � 0.993*F5 0.117 D6 0.986 70.428TCSU2 F8 � 0.956*F7 0.293 D8 0.914 10.627SMSU2 F9 � 0.788*F7 0.616 D9 0.621 1.638SCSU2 F10 � 0.749*F9 0.295 D10 0.913 10.494
0.255*F8EFL LEX-GR2 F11 � 0.396*F10 0.649 D11 0.579 1.375
0.575* F5
(continued )
086783_LTJ_237-272.qxd 26/2/08 4:28 PM Page 254
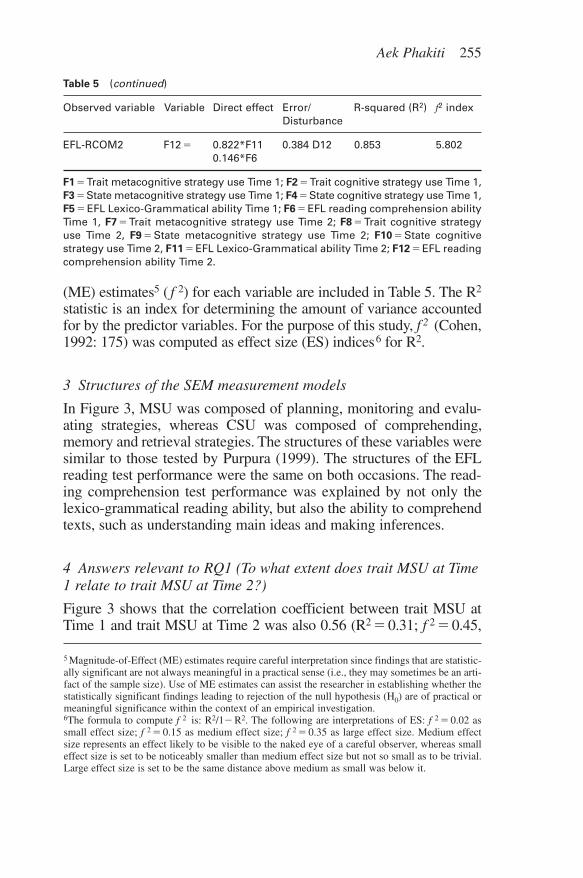
(ME) estimates5 ( f 2) for each variable are included in Table 5. The R2
statistic is an index for determining the amount of variance accountedfor by the predictor variables. For the purpose of this study, f 2 (Cohen,1992: 175) was computed as effect size (ES) indices6 for R2.
3 Structures of the SEM measurement models
In Figure 3, MSU was composed of planning, monitoring and evalu-ating strategies, whereas CSU was composed of comprehending,memory and retrieval strategies. The structures of these variables weresimilar to those tested by Purpura (1999). The structures of the EFLreading test performance were the same on both occasions. The read-ing comprehension test performance was explained by not only thelexico-grammatical reading ability, but also the ability to comprehendtexts, such as understanding main ideas and making inferences.
4 Answers relevant to RQ1 (To what extent does trait MSU at Time1 relate to trait MSU at Time 2?)
Figure 3 shows that the correlation coefficient between trait MSU atTime 1 and trait MSU at Time 2 was also 0.56 (R2 � 0.31; f 2 � 0.45,
Aek Phakiti 255
Table 5 (continued)
Observed variable Variable Direct effect Error/ R-squared (R2) f2 indexDisturbance
EFL-RCOM2 F12 � 0.822*F11 0.384 D12 0.853 5.8020.146*F6
F1 � Trait metacognitive strategy use Time 1; F2 � Trait cognitive strategy use Time 1,F3 � State metacognitive strategy use Time 1; F4 � State cognitive strategy use Time 1,F5 � EFL Lexico-Grammatical ability Time 1; F6 � EFL reading comprehension abilityTime 1, F7 � Trait metacognitive strategy use Time 2; F8 � Trait cognitive strategyuse Time 2, F9 � State metacognitive strategy use Time 2; F10 � State cognitivestrategy use Time 2, F11 � EFL Lexico-Grammatical ability Time 2; F12 � EFL readingcomprehension ability Time 2.
5 Magnitude-of-Effect (ME) estimates require careful interpretation since findings that are statistic-ally significant are not always meaningful in a practical sense (i.e., they may sometimes be an arti-fact of the sample size). Use of ME estimates can assist the researcher in establishing whether thestatistically significant findings leading to rejection of the null hypothesis (H0) are of practical ormeaningful significance within the context of an empirical investigation.6The formula to compute f 2 is: R2/1� R2. The following are interpretations of ES: f 2 � 0.02 assmall effect size; f 2 � 0.15 as medium effect size; f 2 � 0.35 as large effect size. Medium effectsize represents an effect likely to be visible to the naked eye of a careful observer, whereas smalleffect size is set to be noticeably smaller than medium effect size but not so small as to be trivial.Large effect size is set to be the same distance above medium as small was below it.
086783_LTJ_237-272.qxd 26/2/08 4:28 PM Page 255

256 Construct validation of a strategic competence model
large ES). This finding suggests that 31% was shared between traitMSU at Times 1 and 2. A separate SEM analysis of the relationshipbetween trait CSU at Times 1 and 2 was also 0.56 (R2 � 0.31; seeAppendix C). The finding suggests that even a trait construct that isbelieved to be quite stable is changing over time. Perhaps in the contextof L2 learning, a trait construct can be unstable, particularly wherethere is room to improve language proficiency. Future research needsto search for logical explanations as to why the correlation between thesame trait measured over time could be low (apart from measurementlimitations). It may well be that in L2 learning contexts, strategic com-petence develops over time in the way that interlanguage does (Gass &Selinker, 2001). In this study, trait MSU at Time 2 is a more currentversion than trait MSU at Time 1. Furthermore, the low consistency oftrait MSU found in this study might be related to the context of thestudy which was situated within a formal classroom setting whereinstruction would be expected to improve L2 learning. Given the pres-ent evidence, generalizations must be made with caution when employ-ing a trait strategy use measure in a cross-sectional study.
5 Answers relevant to RQ2 (To what extent does trait MSU affecttrait CSU?)
In Figure 3 it can be seen that ßs from trait MSU to trait CSU were0.95 (R2 � 0.90; f 2 � 9.0, large ES) for Time 1 and 0.96 (R2 � 0.92;f 2 � 11.50, large ES) for Time 2. It was found that knowledge abouthow one plans, monitors and evaluates in general exerts an executive(higher-order) influence on knowledge about how one goes aboutprocessing information when using the language (at a lower-orderlevel). These findings are in line with the previous research discussedabove and validate Bachman and Palmer’s (1996) model of strategiccompetence in regard to the metacognitive function of human cogni-tion. The present findings were similar to Purpura’s (1999) who foundthat MSU had a direct, strong effect on CSU. The present study, how-ever, provides two observations of such effects which were highlyconsistent over time.
6 Answers relevant to RQ3 (To what extent does trait CSU affectstate CSU?)
As indicated in Figure 3, it was found that ßs from trait CSU to stateCSU were 0.22 (R2 � 0.04; f 2 � 0.04, small ES) for Time 1 and 0.25(R2 � 0.06; f 2� 0.06, small ES) for Time 2. Trait CSU cannot predictmuch of the degree of state CSU (only about 4–6% in this study).
086783_LTJ_237-272.qxd 26/2/08 4:28 PM Page 256

There are two plausible explanations for this finding. First, it is con-ceivable that trait CSU does not have an ‘executive function’ (as traitMSU does), and thus how state CSU is to be used may largelydepend on trait and state MSU (as discussed further below). It mightalso be that the direct influence of trait MSU on trait CSU (as dis-cussed in answers to RQ1) was responsible for the relationship foundin this model. Perhaps trait CSU is state-like in character, suggestingthat it may be difficult to see cognitive strategy use as trait (i.e., ascontext-free). Second, it may also be the case that the extent to whichone actually uses cognitive strategies depends on the context inwhich the language use occurs (e.g., degrees of complexity of texts,test questions and time constraints; see Robinson, 2001). Thus, somecontexts may require individuals to infer meanings more than tosummarize and identify main ideas.
7 Answers relevant to RQ4 (To what extent does trait MSU affectstate MSU in a specific context?)
As can be seen in Figure 3, ßs from trait MSU to state MSU on bothoccasions suggested a strong and stable relationship between trait MSUand state MSU. The ßs were 0.76 (R2 � 0.58; f 2 � 1.38, large ES) forTime 1 and 0.79 (R2 � 0.62; f 2 � 1.63, large ES) for Time 2. The ßsshow that the relationship between trait and state MSU was positive andstable over time. That is, unlike CSU, what individuals generally per-ceived themselves to be doing metacognitively was statistically highlyrelated to what they actually did in the specific language use situations.Nevertheless, the degree to which trait MSU accounted for state MSUappeared moderate, suggesting that trait MSU and state MSU are dif-ferent in nature. An examination of the values of the R2 suggests thattrait MSU predicted state MSU only up to about 62% (large ES), imply-ing again that ‘context’ may determine the degree of state MSU.
8 Answers relevant to RQ5 (To what extent does state MSU affectstate CSU?)
Inspection of Figure 3 suggests a strong relationship between stateMSU and state CSU. ßs were 0.76 (R2 � 0.58; f 2 � 1.38, large ES)for Time 1 and 0.75 (R2 � 0.56; f 2 � 1.27, large ES) for Time 2. Thisfinding suggests that there was 56–58% of shared variance betweenstate MSU and state CSU. The regression coefficients show that therelationships were strong (large ES) and consistent over time. Thefindings regarding the executive roles of state MSU in relation tostate CSU is consistent with the findings on the executive roles of trait
Aek Phakiti 257
086783_LTJ_237-272.qxd 26/2/08 4:28 PM Page 257
258 Construct validation of a strategic competence model
MSU in relation to trait CSU (as reported for RQ2). The findingsimply that during actual information processing, online metacogni-tive strategies work closely with online cognitive strategies to achievethe learner’s communicative goals. Hence, in line with Purpura(1999), neither cognitive strategies nor metacognitive strategies alonelead to performance success; rather both do. Nevertheless, the ßs inFigure 3 suggest that cognitive strategies (as related to the languageprocesses of understanding, learning or using) are not the sameprocess as metacognitive strategies (as related to the regulation ofsuch processes). During information processing, cognitive strategiesmay be operating independently not only of each other, but also ofany metacognitive strategies (Rumelhart, 1977) and hence their inde-pendent operations would decrease the strength of the relationship notonly among cognitive strategies, but also between cognitive andmetacognitive strategies.
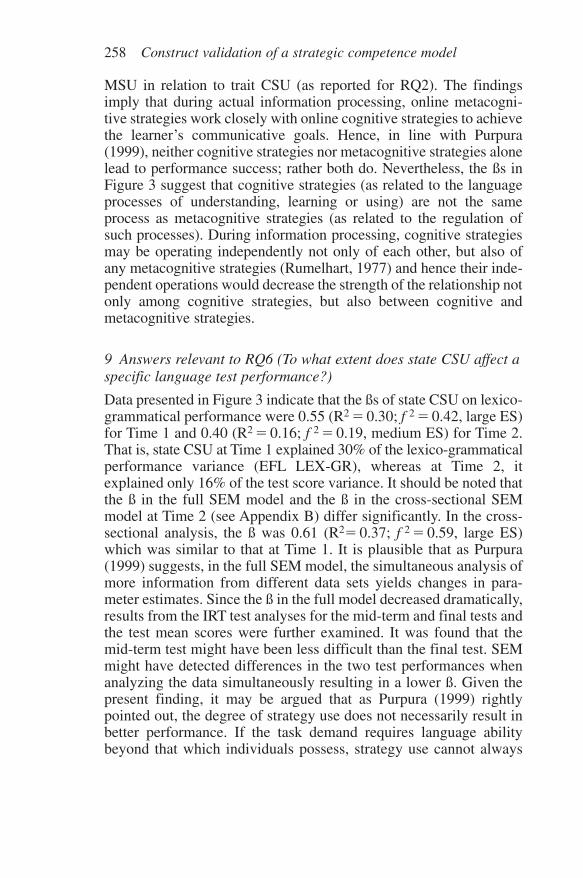
9 Answers relevant to RQ6 (To what extent does state CSU affect aspecific language test performance?)
Data presented in Figure 3 indicate that the ßs of state CSU on lexico-grammatical performance were 0.55 (R2 � 0.30; f 2 � 0.42, large ES)for Time 1 and 0.40 (R2 � 0.16; f 2 � 0.19, medium ES) for Time 2.That is, state CSU at Time 1 explained 30% of the lexico-grammaticalperformance variance (EFL LEX-GR), whereas at Time 2, itexplained only 16% of the test score variance. It should be noted thatthe ß in the full SEM model and the ß in the cross-sectional SEMmodel at Time 2 (see Appendix B) differ significantly. In the cross-sectional analysis, the ß was 0.61 (R2� 0.37; f 2 � 0.59, large ES)which was similar to that at Time 1. It is plausible that as Purpura(1999) suggests, in the full SEM model, the simultaneous analysis ofmore information from different data sets yields changes in para-meter estimates. Since the ß in the full model decreased dramatically,results from the IRT test analyses for the mid-term and final tests andthe test mean scores were further examined. It was found that themid-term test might have been less difficult than the final test. SEMmight have detected differences in the two test performances whenanalyzing the data simultaneously resulting in a lower ß. Given thepresent finding, it may be argued that as Purpura (1999) rightlypointed out, the degree of strategy use does not necessarily result inbetter performance. If the task demand requires language abilitybeyond that which individuals possess, strategy use cannot always
086783_LTJ_237-272.qxd 26/2/08 4:28 PM Page 258
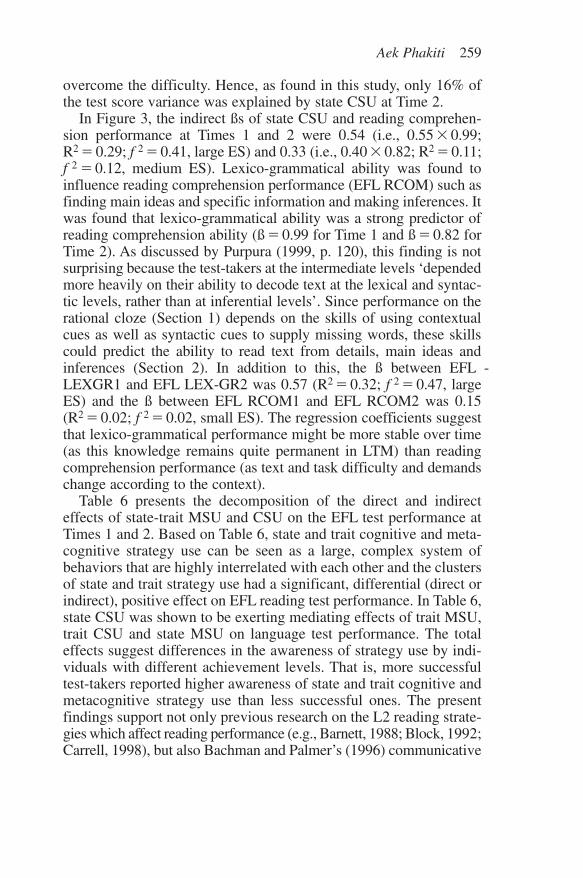
overcome the difficulty. Hence, as found in this study, only 16% ofthe test score variance was explained by state CSU at Time 2.
In Figure 3, the indirect ßs of state CSU and reading comprehen-sion performance at Times 1 and 2 were 0.54 (i.e., 0.55 � 0.99;R2 � 0.29; f 2 � 0.41, large ES) and 0.33 (i.e., 0.40 � 0.82; R2 � 0.11;f 2 � 0.12, medium ES). Lexico-grammatical ability was found toinfluence reading comprehension performance (EFL RCOM) such asfinding main ideas and specific information and making inferences. Itwas found that lexico-grammatical ability was a strong predictor ofreading comprehension ability (ß � 0.99 for Time 1 and ß � 0.82 forTime 2). As discussed by Purpura (1999, p. 120), this finding is notsurprising because the test-takers at the intermediate levels ‘dependedmore heavily on their ability to decode text at the lexical and syntac-tic levels, rather than at inferential levels’. Since performance on therational cloze (Section 1) depends on the skills of using contextualcues as well as syntactic cues to supply missing words, these skillscould predict the ability to read text from details, main ideas andinferences (Section 2). In addition to this, the ß between EFL -LEXGR1 and EFL LEX-GR2 was 0.57 (R2 � 0.32; f 2 � 0.47, largeES) and the ß between EFL RCOM1 and EFL RCOM2 was 0.15(R2 � 0.02; f 2 � 0.02, small ES). The regression coefficients suggestthat lexico-grammatical performance might be more stable over time(as this knowledge remains quite permanent in LTM) than readingcomprehension performance (as text and task difficulty and demandschange according to the context).
Table 6 presents the decomposition of the direct and indirecteffects of state-trait MSU and CSU on the EFL test performance atTimes 1 and 2. Based on Table 6, state and trait cognitive and meta-cognitive strategy use can be seen as a large, complex system ofbehaviors that are highly interrelated with each other and the clustersof state and trait strategy use had a significant, differential (direct orindirect), positive effect on EFL reading test performance. In Table 6,state CSU was shown to be exerting mediating effects of trait MSU,trait CSU and state MSU on language test performance. The totaleffects suggest differences in the awareness of strategy use by indi-viduals with different achievement levels. That is, more successfultest-takers reported higher awareness of state and trait cognitive andmetacognitive strategy use than less successful ones. The presentfindings support not only previous research on the L2 reading strate-gies which affect reading performance (e.g., Barnett, 1988; Block, 1992;Carrell, 1998), but also Bachman and Palmer’s (1996) communicative
Aek Phakiti 259
086783_LTJ_237-272.qxd 26/2/08 4:28 PM Page 259

260 Construct validation of a strategic competence model
ability model which takes non-linguistic factors into account inexplaining language test performance. This study also lends supportto the interactionalist perspective which views language test per-formance as a result of an interaction among traits, contextual fea-tures and strategic competence (Chapelle, 1998).
V Metadiscussion
As evident in this study, strategic competence as a non-linguistic fac-tor in L2 use is highly complex, hierarchical and multi-dimensional.Strategic competence can be understood via an examination of indi-viduals’ knowledge of how they generally perceive using a set ofstrategies over a variety of contexts and their reported actual use ofthe strategies in a specific context. The cognitive strategy constructconsisted of a set of comprehending, memory and retrieval strat-egies, whereas the metacognitive strategy construct is composed ofa set of planning, monitoring and evaluating strategies. In line withPurpura (1999), the present study suggests that state and traitmetacognitive strategies exert an executive function over cognitivestrategy use (see RQs 1–5). State CSU is in turn directly related tothe specific test performance (see RQ 6). The present study con-tributes to the theory of strategic competence formulated byBachman and Palmer (1996) in that two strategic competence facets
Table 6 Decomposition of the total effects of EFL test performances in Times 1 and 2
Variable Direct and indirect effect
EFL LEX-GR1 (F5) 0.435 F1(TMSU1) 0.121 F2 (TCSU1) 0.419 F3 (SMSU1)
0.552 *F4 (SCUS1) 0.039 D2 0.270 D3 0.204 D4 0.834 D5EFL RCOM1 (F6) 0.432 F1 (TMSI1) 0.120 F2 (TCSU1) 0.416 F3 (SMSU1)
0.548 F4 (SCSU1) 0.993 *F5(EFL LEX-GR1) 0.038 D2
0.268 D3 0.203 D4 0.828 D5 0.117 D6EFL LEX-GR2 (F11) 0.250 F1 (TMSU1) 0.069 F2 (TCSU1) 0.241 F3 (SMSU1)
0.317 F4 (SCSU1) 0.575 *F5 (EFL LEX-GR1) 0.330 F7 (TMSU2) 0.101 F8 (TCSU2) 0.296 F9 (SMSU2) 0.396
*F10 (SCSU2) 0.022 D2 0.155 D3 0.117 D4 0.479 D5
0.030 D8 0.183 D9 0.117 D10 0.649 D11EFL RCOM2 (F12) 0.268 F1(TMSU1) 0.074 F2 (TCSU1) 0.259 F3 (SMSU1)
0.341 F4 (SCSU1) 0.617 F5(EFL LEX-GR1) 0.146 *F6 (EFL RCOM1) 0.271 F7 (TMSU2) 0.083 F8 (TCSU2) 0.244 F9 (SMSU2) 0.326 F10 (SCSU2) 0.822 *F11 (EFL LEX-GR2)
0.024 D2 0.167 D3 0.126 D4 0.514 D5 0.017 D6 0.024 D8 0.150 D9 0.096 D10 0.533 D11
Parameter estimates in bold indicate direct effects.
086783_LTJ_237-272.qxd 26/2/08 4:28 PM Page 260
need to be recognized: strategic knowledge (knowledge about what,how and when to use a set of strategies) and strategic regulation(online realization and regulation of cognitive processing, particu-larly when problems or difficulties arise).
1 Strategic competence and language performance
The question of how much strategy use can explain language testperformance variance arises. Previous research and this study repeat-edly found that MSU and CSU are weakly to moderately related tolanguage performance (up to 30%), though in some contexts, ‘strat-egic processing may contribute to a language test performance morethan others’ (Bachman, 1990, p. 105). There are a number of plaus-ible reasons for the limited strength of this relationship. The first rea-son we put forward is that in language use, such as test-taking,factors such as communicative language ability, test-method facets,test-taker characteristics and random factors will simultaneouslyaffect language use performance (Bachman & Palmer, 1996). Sincestrategic competence is only part of communicative language ability,one should not expect it to account for language performance to alarge extent. Furthermore, according to Anderson (2005), success inusing strategies may depend on certain conditions: (1) whether thestrategy relates well to the L2 task at hand; (2) whether the strategyis linked well with other strategies and processes relevant to thegiven task; and (3) whether the strategy coordinates well with thelearner’s learning style. Perhaps strategic competence by L2 learnersis in the process of development and hence incomplete (see RQ1).Phakiti (2005) examined test-takers’ calibration (accurate ability tojudge one’s performance success) and found that test-takers in generalwere overconfident in their test performance. Most relevant to the pres-ent study is that they were found to be overconfident about difficultquestions but underconfident about easy questions. These findings sug-gested that test-takers might have lacked accurate self-assessmentand evaluation, which in turn may have resulted in poor strategy use.
The second possible explanation for the weak to moderate correl-ations between strategy use and test performance is that success in alanguage learning or use depends on a number of cognitive andnoncognitive factors, including language competence (Bachman &Palmer, 1996), the levels of linguistic thresholds in a particular contextof language use (Bernhardt, 2000), individuals’ working memorycapacity (Robinson, 2001), levels of accurate automaticity in languageprocessing (Segalowitz, 2003), motivation to use the language
Aek Phakiti 261
086783_LTJ_237-272.qxd 26/2/08 4:28 PM Page 261

(Dörnyei, 2001), and task difficulty, demands and constraints (Skehan,1998). Given that these factors account for language performance aswell, the amount of variance that remains to be shared between strate-gic competence and test performance is necessarily limited.
The third explanation that can be offered is that much of the over-all information processing during language use involves lower-levelprocessing (e.g., automatic, unreflective and unconscious process-ing, especially in easy, familiar tasks or environment; see Sternberg,1998) and higher-level processing (e.g., conscious awareness ofwhat and how they are using the language). Some apparently meta-cognitive processes that are embedded within the automaticprocesses are not strictly speaking metacognitive although they havea control function (Gagné et al., 1993). Higher-level processingis apparent when individuals experience difficulty or aim to achievea specific, hard-to-achieve goal. Therefore, there is a constant back-and-forth relationship between automatic and strategic pro-cessing, which contributes a varying degree of a relationship to aspecific language performance.
The fourth possible reason is that there remain methodological andanalytical limitations in researching strategic competence. Method-ologically, researchers are faced with how to connect their measureswith the constructs of interest (see Tseng et al., 2006). Strategic com-petence, like many other constructs, does not often lend itself to directobservation and hence to understand it, researchers are dependentupon learners’ potentially fallible accounts of their mental knowledgeand processes. Though structural equation modeling is a powerfulanalytical tool, variance-based modeling is not necessarily a windowto any particular mind because individuals uniquely vary among eachother and human behaviors are dynamic, situational and contextual(Phakiti, 2008). Since human thinking is not open to direct scrutiny,structural models from empirical data only allow us to speculate aboutwhat may be happening inside the mind.
2 Limitations and implications
There are limitations to the present study that are worth mentioningbecause they have implications for further research. First, the findingsmay be in part an artifact of the research instruments (i.e., multiple-choice reading tests and Likert-scale questionnaires), and the settingin which the study was carried out. Moreover, this study is limited toEFL reading test performance and hence generalizations of the find-ings to other language skills are limited (see VanPatten, 1994).
262 Construct validation of a strategic competence model
086783_LTJ_237-272.qxd 26/2/08 4:28 PM Page 262

Multiple-choice tests are also limited in their ability to assess authen-tic language use and hence performance based on this test techniquemay not be the best indicator of an individual’s language proficiency.The strategy questionnaires used for this study may likewise havefailed to document the full array of strategies test-takers used bothhabitually and on the test in question. In addition, the sample for thestudy was limited to Thai EFL university students. Hence, an impli-cation for further research is to examine the relationship betweenstrategic competence and language test performance in other lan-guage skills, using a variety of test formats and more comprehensivestrategy questionnaires in various EFL and ESL (English as a secondlanguage) and languages other than English settings, thereby allow-ing future cross-cultural comparisons.
Second, this study was confined to observations from two testoccasions. An ideal scenario would be to gather a series of data setsdocumenting state and trait cognitive and metacognitive strategy useand high-stakes test performance at various time points from thesame learners. It should be noted, however, that a longitudinal quan-titative study such as the one reported here is quite difficult toexecute. Retaining the same group of learners over a long period oftime can be expensive, time-consuming and impractical in manyreal-world testing contexts.
Third, the SEM model was not applied to determine whether thefactorial structure between each group of, for example, successfuland unsuccessful test-takers, and males and females is invariant andhence claims about group-specific models cannot be made.Therefore, future studies could build on the current findings byemploying multi-group analyses (see Purpura, 1999).
VI Concluding remarks
Previous research and the present study show that all learners/test-takersengage in a range of strategic behaviours; however, they also show thatsuch strategic activities, often prolonged and varied, do not necessarilylead to language success. It may be that optimal strategic behavioursdiffer under different conditions. Future research needs to investigate(1) typical situations that inhibit strategy use and (2) those that are mostconducive to its optimal use in language learning and/or language per-formance. Research on strategic competence is a dynamic area ofstudy where new paths and perspectives are still unfolding. The presentstudy has offered some further insights into our conceptualization of
Aek Phakiti 263
086783_LTJ_237-272.qxd 26/2/08 4:28 PM Page 263

264 Construct validation of a strategic competence model
strategic competence and its role in L2 communicative languageability but there is much work still to be done. As McNamara (1996,p. 88) notes, ‘progress in understanding the nature of second languageperformance testing and conducting the necessary research requires acommitment to rigorous analysis of what is involved in a language testperformance’.
Acknowledgements
I would like to thank the following people who have played metacog-nitive roles during the completion of this research project and earlierdrafts of this paper: Brian Lynch, Tim McNamara, Paul Gruba, JimPurpura, Antony Kunnan, Fred Davidson, Andrew Cohen, CarstenRoever, John Read, Brian Paltridge, Sirikarn Chanruang, MarieStevenson, Lindy Woodrow, David Hirsh, Diana Montgomery, the EQS technical support team, the three anonymous reviewers andthe Editors.
VII References
Adams, R. J. & Khoo, S-K. (1996). Quest (Version 2.1) [Computer software].Victoria, Australia: Australian Council for Educational Research.
Alderson, J. C. (2000). Assessing reading. Cambridge: Cambridge UniversityPress.
Alexander, P. A., Schallert, D. L. & Hare, V. C. (1991). Coming to term: Howresearchers in learning and literacy skills talk about knowledge. Reviewof Educational Psychology, 61, 315–343.
Anderson, J. R. (2000). Learning and memory: An integrated approach (2nded.). New York: John Wiley.
Anderson, N. J. (1999). Exploring second language reading: Issues andstrategies. Boston, MA: Heinle and Heinle.
Anderson, N. J. (2005). L2 learning strategies. In E. Hinkel, editor, Handbookof research in second language teaching and learning (pp. 757–771).Mahwah, NJ: Lawrence Erlbaum.
Bachman, L. F. (1990). Fundamental considerations in language testing.Oxford: Oxford University Press.
Bachman, L. F. (2000). Modern language testing at the turn of the century:assuring that what we count counts. Language Testing, 17, 1–42.
Bachman, L. F. & Palmer, A. S. (1996). Language testing in practice. Oxford:Oxford University Press.
Baker, L. & Brown, A. L. (1984). Metacognitive skills and reading. In P. D.Pearson, editor, Handbook of reading research (pp. 353–394). New York:Longman.
086783_LTJ_237-272.qxd 26/2/08 4:28 PM Page 264
Aek Phakiti 265
Barnett, M. A. (1988). Reading through context: How real and perceived strategyuse affects L2 comprehension. Modern Language Journal, 72, 150–162.
Bentler, P. M. (1985–2006). EQS Version 6 for Windows [Computer software].Encino, CA: Multivariate Software.
Bentler, P. M. (2006). EQS structural equation program manual. Encino, CA:Multivariate Software.
Bernhardt, E. B. (2000). Second language reading as a case study of reading scholarship in the 20th century. In M. Kamil & P. Mosenthal, P. D. Pearson, & R. Barr, editors, Handbook of reading research, Vol. III(pp. 791–811). Hillsdale, NJ: Lawrence Erlbaum.
Block, E. L. (1992). See how they read: Comprehension monitoring of L1 andL2 readers. TESOL Quarterly, 26, 319–343.
Byrne, B. M. (1994). Structural equation modeling with EQS andEQS/Windows: Basic concepts, applications, and programming.Thousand Oaks, CA: Sage Publications.
Campbell, D. T. & Fiske, D. W. (1959). Convergent and discriminant validationby the multitrait-multimethod matrix. Psychological Bulletin, 56, 81–105.
Carrell, P. L. (1998). Can reading strategies be successfully taught? AnnualReview of Applied Linguistics, 21, 1–20.
Carrell, P. L., Gajdusek, L. & Wise, T. (1998). Metacognition and EFL/ESLreading. Instructional Science, 26, 97–112.
Chapelle, C. A. (1998). Construct definition and validity inquiry in SLAresearch. In L. F. Bachman & A. D. Cohen, editors, Interfaces betweensecond language acquisition and language testing research (pp. 32–70).Cambridge: Cambridge University Press.
Cohen, A. D. (1998). Strategies in learning and using a second language.London and New York: Longman.
Cohen, A. D. (2007). The coming of age of research on test-taking strategies. InJ. Fox, M. Weshe, D. Bayliss, L. Cheng, C. Turner, & C. Doe, editors,Language testing reconsidered. Ottawa: Ottawa University Press.
Cohen, J. (1992). A power primer. Psychological Bulletin, 112, 155–159.Dörnyei, Z. (2001). Teaching and researching motivation. Harlow: Longman.Ellis, R. (1994). The study in second language acquisition. Oxford: Oxford
University Press.Flavell, J. H. (1985). Cognitive development. Englewood Cliffs, NJ:
Prentice-Hall.Gagné, E. D., Yekovich, C. W. & Yekovich, F. R. (1993). The cognitive
psychology of schooling learning. New York: HarperCollins.Gass, S. & Selinker, L. (2001). Second language acquisition: An introductory
course (2nd ed.). Mahwah, NJ: Lawrence Erlbaum.Hsiao, T-Y. & Oxford, R. L. (2002). Comparing theories of language learning
strategies: A confirmatory factor analysis. Modern Language Journal,86, 368–383.
Hudson, T. (2007). Teaching second language reading. Oxford: OxfordUniversity Press.
Hymes, D. (1972). On communicative competence. In J. B. Pride & J. Holmes,editors, Sociolinguistics: Selected readings (pp. 269–293). Harmondsworth,Middlesex: Penguin.
086783_LTJ_237-272.qxd 26/2/08 4:28 PM Page 265

266 Construct validation of a strategic competence model
Kline, R. B. (1998). Principles and practice of structural equation modeling.New York: Guilford.
MacCallum, R. C. & Austin, J. T. (2000). Applications of structural equationmodeling in psychological research. Annual Review of Psychology, 51,201–226.
McNamara, T. (1996). Measuring second language performance. London andNew York: Longman.
Maruyama, G. M. (1998). Basics of structural equation modeling. ThousandOaks, CA: Sage Publications.
Mokhtari, K. & Sheorey, R. (2002). Measuring ESL students’ awareness ofreading strategies. Journal of Developmental Education, 25, 2–10.
Nation, I. S. P. (2001). Learning vocabulary in another language. Cambridge:Cambridge University Press.
O’Malley, M. J. & Chamot, A. U. (1990). Learning strategies in secondlanguage acquisition. Cambridge: Cambridge University Press.
Oxford, R. (1990). Language learning strategies: What every teacher shouldknow. Boston, MA: Heinle and Heinle.
Phakiti, A. (2003a). A closer look at gender differences in strategy use in L2reading. Language Learning, 53, 649–702.
Phakiti, A. (2003b). A closer look at the relationship of cognitive andmetacognitive strategy use to EFL reading comprehension test perform-ance. Language Testing, 20, 26–56.
Phakiti, A. (2005). An empirical investigation into the nature of and factorsaffecting test takers’ calibration within the context of an EnglishPlacement Test (EPT). Spaan Fellow Working Papers in Second orForeign Language Assessment, 3, 27–46.
Phakiti, A. (2008). Strategic competence as a fourth-order factor: A structuralequation modeling approach. Language Assessment Quarterly, 5, 20–42.
Purpura, J. E. (1999). Learner strategy use and performance on languagetests: A structural equation modeling approach. Cambridge: CambridgeUniversity Press.
Read, J. (2000). Assessing vocabulary. Cambridge: Cambridge UniversityPress.
Robinson, M. (2001). Task complexity, task difficulty, and task production:Exploring interactions in a componential framework. AppliedLinguistics, 22, 27–57.
Rumelhart, D. E. (1977). Toward an interactive model of reading. In S. Dornic& P. Rabbitt, editors, Attention and performance, Vol. 6, (pp. 573–603.).New York: Academic Press.
Schmidt, F. L. & Hunter, J. E. (1999). Theory testing and measurement error.Intelligence, 27, 183–198.
Schmidt, R. (1995). Consciousness and foreign language learning: A tutorialon the role of attention and awareness in learning. In R. Schmidt, editor,Attention and awareness in foreign language learning (pp. 1–63).Honolulu: University of Hawai’i Press.
Schmidt, R. (2001). Attention. In P. Robinson, editor, Cognition and secondlanguage instruction (pp. 3–32). Cambridge: Cambridge University Press.
086783_LTJ_237-272.qxd 26/2/08 4:28 PM Page 266
Schraw, G. & Moshman, D. (1995). Metacognitive theories. EducationalPsychology Review, 7, 351–371.
Segalowitz, N. (2003). Automaticity and second language development. InC. Doughty & M. Long, editors, Handbook of second language acquisi-tion (pp. 382–408). Oxford: Blackwell.
Skehan, P. (1998). A cognitive approach to language learning. Oxford: OxfordUniversity Press.
Song, X. (2004). Language learning strategy use and language performance forChinese learners of English. Unpublished master’s thesis. Ontario: Queen’sUniversity, Kingston, Canada.
Song, X. (2005). Language learner strategy use and English proficiency on theMichigan English Language Assessment Battery. Spaan Fellow WorkingPapers in Second or Foreign Language Assessment, 3, 1–26.
Spielberger, C. D. (1972). Conceptual and methodological issues in anxietyresearch. In C. D. Speilberger, editor, Anxiety: Current trends in theoryand research, Vol. 2 (pp. 481–493). New York: Academic Press.
Spolsky, B. (1995). Measured words. Oxford: Oxford University Press.Sternberg, R. J. (1998). Metacognition, abilities, and developing expertise:
What makes an expert student? Instructional Science, 26,Tseng W., Dörnyei, Z. & Schmitt, N. (2006). A new approach to assessing
127–140. strategic learning: The case of self-regulation in vocabularyacquisition. Applied Linguistics, 27, 78–102.
VanPatten, B. (1994). Evaluating the role of consciousness in second languageacquisition: Terms, linguistic features and research methodology. AILAReview, 11, 27–36.
Aek Phakiti 267
086783_LTJ_237-272.qxd 26/2/08 4:28 PM Page 267

268 Construct validation of a strategic competence model
Appendix A: Trait and state strategy use questionnaires
Trait reading strategy questionnaire
Directions: Read each statement and indicate how you normallythink when read in English. Choose 0 (never), 1 (rarely), 2 (some-times), 3 (often), 4 (usually) or 5 (always) on each statement thatbest describes how you think.
No. Your thinking 0 1 2 3 4 5
1. I plan what to do before I begin to read English texts or tasks.2. I make sure I clarify the goals of the reading tasks.3 I consider steps needed to complete the reading.4 I make sure I understand what has to be done and how to do it.5. I know what to do if my plans do not work efficiently.6. I scan through the reading and tasks before I actually begin doing it.7. I try to understand the relationships between ideas in the text.8. I try to understand the content without looking up every word.9. I think what is going to happen next while reading.
10. I analyze what the author means or tries to say.11. I try to interpret hidden ideas/meanings in texts.12. I translate text or reading tasks into my first language.13. I summarize the main information in the text.14. I relate the information from the reading or tasks to my prior
knowledge or experience.15. I reread texts or tasks several times when I feel I do not
understand them.16. I know which information is more or less important.17. I identify or guess meanings of unknown words using context
clues.18. I apply my learned grammar rules while reading or completing
reading tasks.19. I guess meanings of unknown words using root words.20. I am aware of time limitations and constraints.21. I know how much the reading and tasks remain to be done while
reading.22. I check if I understand the text or task.23. I check my own performance and progress as I move along the
reading tasks.24. I know when I lose concentration while reading.25. I evaluate my plans or goals of my reading constantly.26. I know when I should read more quickly or carefully.27. I double-check my reading comprehension or performance.28. I immediately correct my misunderstanding or mistakes in
reading tasks when found.29. I notice when and where I am confused in the text.30. I know when I feel worried, tense or unmotivated while reading.
086783_LTJ_237-272.qxd 26/2/08 4:28 PM Page 268

State reading strategy questionnaire
Directions: Read each statement and indicate how you actuallythought when taking this reading test. Choose 0 (never), 1 (rarely),2 (sometimes), 3 (often), 4 (usually) or 5 (always) on each statementthat best describes how you thought.
No. Your thinking 0 1 2 3 4 5
1. I planned what to do before I began to complete this reading test.2. I made sure I clarified the goals of the reading test tasks.3. I considered essential steps needed to complete the reading test.4 I made sure I understood what had to be done and how to do it.5. I knew what to do if my intended plans did not work efficiently
while completing this reading test.6. I flipped through the reading test before I actually stated to
complete it.7. I tried to understand the relationships between ideas in the text
and tasks.8. I tried to understand the content of the text and tasks without
looking up every word.9. I thought what was going to happen next while I was reading
the text.10. I analyzed what the author meant or tried to say in the text.11. I tried to interpret hidden ideas/meanings in the texts.12. I translated the text, tasks or questions into my first language.13. I summarized the main information in the text.14. I related the information from the text or tasks to my prior
knowledge or experience.15. I reread texts or tasks several times when I felt I did not
understand them.16. I knew which information was more or less important.17. I identified or guessed meanings of unknown words using
context clues.18. I applied my learned grammar rules while reading and
completing the reading tasks.19. I guessed meanings of unknown words using root words.20. I was aware of the time limitations and constraints in this test.21. I knew how much of the reading and test tasks remained to be done
while taking the test.22. I checked if I understood the texts and reading tasks.23. I checked my own performance and progress as I moved along
the test tasks.24. I knew when I lost concentration while completing this test.25. I evaluated my plans or goals of my reading tasks constantly.26. I knew when I should read or complete the test more quickly or
carefully.27. I double-checked my reading comprehension or performance.28. I immediately corrected my misunderstanding or performance
mistakes when found.30. I knew when I felt worried, tense or unmotivated to complete this
reading test.
Aek Phakiti 269
086783_LTJ_237-272.qxd 26/2/08 4:28 PM Page 269

270 Construct validation of a strategic competence model
0.88
*
TM
SU1*
0.84
*
TPL
N1
0.54
E1*
0.73
*T
MO
N1
0.68
E2*
TEV
A1
0.47
E3*
0.87
*
TC
SU1
0.85
*
TC
OM
10.
53E4
*
0.85
*T
MEM
10.
53E5
*
TR
ET1
0.49
E6*
0.89
*
SMSU
1
0.81
*SP
LN1
0.58
E7*
0.69
*SM
ON
10.
73E8
*
SEV
A1
0.46
E9*
0.87
*
SCSU
1
0.84
*
SCO
M1
0.55
E10*
0.81
*SM
EM1
0.59
E11*
SRET
10.
48E1
2*
0.95
*
D2* 0.33
0.22
*D
4*
0.37
0.76
*D
3*
0.65
0.76
*
0.85
*
EFL
LEX
-GR
1
0.73
*LE
X-G
R1
0.69
E13*
0.78
*LE
X-G
R2
0.63
E14*
LEX
-GR
30.
53E1
5*
0.87
*EF
L R
CO
M1
0.71
*T
xtC
OM
10.
70E1
6*
Txt
CO
M2
0.50
E17*
0.99
*
D12
*
0.13
0.56
*
D11
*
0.83
0.88
*
0.84
*
0.54
0.73
*0.
68
0.47
0.87
*
0.85
*
0.53
0.85
*0.
53
0.49
0.89
*
0.81
*
0.58
0.69
*0.
73
0.46
0.87
*
0.84
*
0.55
0.81
*0.
59
0.48
0.95
*
0.33
0.22
*
0.37
0.76
*
0.65
0.76
*
0.85
*0.73
*0.
69
0.78
*0.
63
0.53
0.87
*
0.71
*0.
70
0.50
0.99
*
0.13
0.56
*
0.83
Chi
-squ
are
(χ2 (1
07))
= 64
8.38
7 P
= 0.
00 C
FI =
0.9
3 R
MSE
A =
0.0
9
App
endi
x B
:C
ross
-sec
tion
al h
ypot
hesi
zed
SEM
mod
els
(Tim
es 1
and
2)
086783_LTJ_237-272.qxd 26/2/08 4:28 PM Page 270

Aek Phakiti 271
0.83
*
SCSU
2
0.83
*
SCO
M2
0.56
E27*
0.81
*SM
EM2
0.59
E28*
SRET
20.
56E2
9*
0.90
*
SMSU
2
0.83
*
SPLN
20.
56E2
4*
0.74
*SM
ON
20.
67E2
5*
SEV
A2
0.44
E26*
0.87
*
TC
SU2
0.88
*
TC
OM
20.
48E2
1*
0.82
*T
MEM
20.
57E2
2*
TR
ET2
0.49
E23*
0.90
*
TM
SU2*
0.85
*
TPL
N2
0.52
E18*
0.76
*T
MO
N2
0.65
E19*
TEV
A2
0.44
E20*
0.73
*
D7*
0.28
0.28
*0.
79*
D8*
0.62
0.95
*
D9*
0.30
0.79
*EF
L R
CO
M2
0.78
*
Txt
CO
M3
0.62
E33*
Txt
CO
M4
0.61
E34*
0.79
*EF
L LE
X-G
R2
0.64
*
LEX
-GR
40.
77E3
0*
0.79
*LE
X-G
R5
0.62
E31*
LEX
-GR
60.
61E3
2*
0.61
*
D14
*
0.79
0.93
*
D13
*
0.38
0.83
*
0.83
*
0.56
0.81
*0.
59
0.56
0.90
*
0.83
*
0.56
0.74
*0.
67
0.44
0.87
*
0.88
*
0.48
0.82
*0.
57
0.49
0.90
*
0.85
*
0.52
0.76
*0.
65
0.44
0.73
*
0.28
0.28
*0.
79*
0.62
0.95
*
0.30
0.79
*
0.78
*
0.62
0.61
0.79
*
0.64
*
0.77
0.79
*0.
62
0.61
0.61
*
0.79
0.93
*
0.38
Chi
-squ
are
(χ2 (1
07))
= 58
7.58
6 P
= 0.
00 C
FI =
0.9
3 R
MSE
A =
0.0
9
086783_LTJ_237-272.qxd 26/2/08 4:28 PM Page 271

272 Construct validation of a strategic competence model
0.89
*
TM
SU1*
0.83
*
TPL
N1
0.56
E1*
0.74
*T
MO
N1
0.67
E2*
TEV
A1
0.46
E3*
0.87
*
TC
SU1*
0.84
*
TC
OM
10.
54E4
*
0.84
*T
MEM
10.
54E5
*
TR
ET1
0.48
E6*
0.89
*
TM
SU2*
0.85
*
TPL
N2
0.52
E18*
0.76
*T
MO
N2
0.65
E19*
TEV
A2
0.45
E20*
0.87
*
TC
SU2*
0.88
*
TC
OM
20.
48E2
1*
0.82
*T
MEM
20.
57E2
2*
TR
ET2
0.50
E23*
0.54
*
0.95
*
0.56
*
0.97
*
0.52
*
0.51
*
0.89
*
0.83
*
0.56
0.74
*0.
67
0.46
0.87
*
0.84
*
0.54
0.84
*0.
54
0.48
0.89
*
0.85
*
0.52
0.76
*0.
65
0.45
0.87
*
0.88
*
0.48
0.82
*0.
57
0.50
0.54
*
0.95
*
0.56
*
0.97
*
0.52
*
0.51
*
Chi
-squ
are
(χ2 (4
4)) =
208
.037
P =
0.0
0 C
FI =
0.9
7 R
MSE
A =
0.0
8
App
enei
x C
Cor
rela
tion
s be
twee
n tr
ait
met
acog
niti
ve a
nd c
ogni
tive
str
ateg
y us
e in
Tim
es 1
and
2
086783_LTJ_237-272.qxd 26/2/08 4:28 PM Page 272
