constructed-response mathematics tasks study - ets … · 2016-05-19 · constructed-response...
TRANSCRIPT

Constructed-Response Mathematics Tasks Study
James H. Fife
Edith Aurora Graf
Sarah Ohls
Research Report ETS RR–11-35

Constructed-Response Mathematics Tasks Study
James H. Fife, Edith Aurora Graf, and Sarah Ohls
ETS, Princeton, New Jersey
August 2011

Technical Review Editor: Joel Tetreault
Technical Reviewers: Malcolm Bauer and Elizabeth Marquez
Copyright © 2011 by Educational Testing Service. All rights reserved.
ETS, the ETS logo, and LISTENING. LEARNING. LEADING. are registered trademarks of Educational Testing
Service (ETS).
As part of its nonprofit mission, ETS conducts and disseminates the results of research to advance
quality and equity in education and assessment for the benefit of ETS’s constituents and the field.
To obtain a PDF or a print copy of a report, please visit:
http://www.ets.org/research/contact.html

i
Abstract
Six tasks, selected from assessments administered in 2007 as part of the Cognitively Based
Assessment of, for, and as Learning (CBAL) project, were revised in an effort to remove
difficulties with the tasks that were unrelated to the construct being assessed. Because the revised
tasks were piloted on a different population from the original tasks, it was not possible to make
direct comparisons between the performance of the revised tasks and that of the original tasks,
other than to make a qualitative assessment of whether or not the nonconstruct difficulties had, in
fact, been removed. But we were able to pilot between 2 and 4 versions of each revised task, and
we could compare the performance of our pilot sample on the various versions of each task. For
Mix It Up, we prepared 2 nonparallel versions—the first attempted to preserve the construct-
related difficulty of the original while removing the nonconstruct-related ambiguities, and the
second was intended to be an easier task that measured the same skills and abilities. For Fruit
Drink and Paste we created 4 versions, carefully varying different aspects of the language while
keeping other aspects constant. For the 2 tasks from Bigfoot, we varied 2 features independently,
creating 2 versions of each feature and therefore 4 versions of each task. Finally, for Forest
Carbon, we created 4 versions, varying from unscaffolded to carefully scaffolded. Because the
revision of each task was its own experiment, the analysis of each task, and our conclusions from
that analysis, are described separately.
Key words: student responses, alternative versions, mathematics tasks, solution strategies, task
revision, analysis of responses

ii
Table of Contents
Description of the Project ............................................................................................................... 3
Review and Revision of the Tasks .............................................................................................. 3
Assembling the Tasks into Forms ............................................................................................... 4
Scoring the Responses ................................................................................................................ 6
Analyzing the Results ..................................................................................................................... 6
Mix It Up..................................................................................................................................... 6
Fruit Drink ................................................................................................................................ 18
Paste .......................................................................................................................................... 26
Bigfoot (1) ................................................................................................................................. 30
Bigfoot (2) ................................................................................................................................. 34
Forest Carbon ............................................................................................................................ 38
Summary and Conclusions ........................................................................................................... 46
References ..................................................................................................................................... 50
Appendix A. Revised Items ........................................................................................................ 51
Appendix B. Codes Used in Scoring Tasks and Frequency of Response Data .......................... 51

iii
List of Figures
Figure 1. Mix It Up, original version. ............................................................................................. 7
Figure 2. Fruit Drink, original version .......................................................................................... 19
Figure 3. Paste, original version ................................................................................................... 26
Figure 4. Bigfoot (1), original version .......................................................................................... 30
Figure 5. Bigfoot (2), original version .......................................................................................... 34
Figure 6. Forest Carbon, original version. .................................................................................... 39

iv
List of Tables
Table 1. Forms Design for Grade 7 ............................................................................................. 4
Table 2. Forms Design for Grade 8 ............................................................................................. 5
Table 3. Preferred Proportion of Red Paint to Blue Paint, by Student ........................................ 7
Table 4. Responses to “Explain your response …” ..................................................................... 8
Table 5. Common Responses to Original Version of Mix It Up ............................................... 11
Table 6. Most Frequent Responses to Mix It Up Version 1 (N = 177) ...................................... 12
Table 7. Summary of Responses to “Explain your response …” Question ............................... 12
Table 8. Responses to “Explain …” Question by Responses to Numeric Questions ................ 13
Table 9. Most Frequent Responses to Mix It Up Version 2 ...................................................... 15
Table 10. Summary of Responses to “Explain …” Question ...................................................... 15
Table 11. Responses to “Explain …” Question by Responses to Numeric Question ................. 16
Table 12. Responses to “Explain …” Question by Students who Responded “6” ...................... 16
Table 13. Responses to “Explain …” Question by Students who Responded 5 ......................... 17
Table 14. Summary of Responses to Fruit Drink, by Version ..................................................... 23
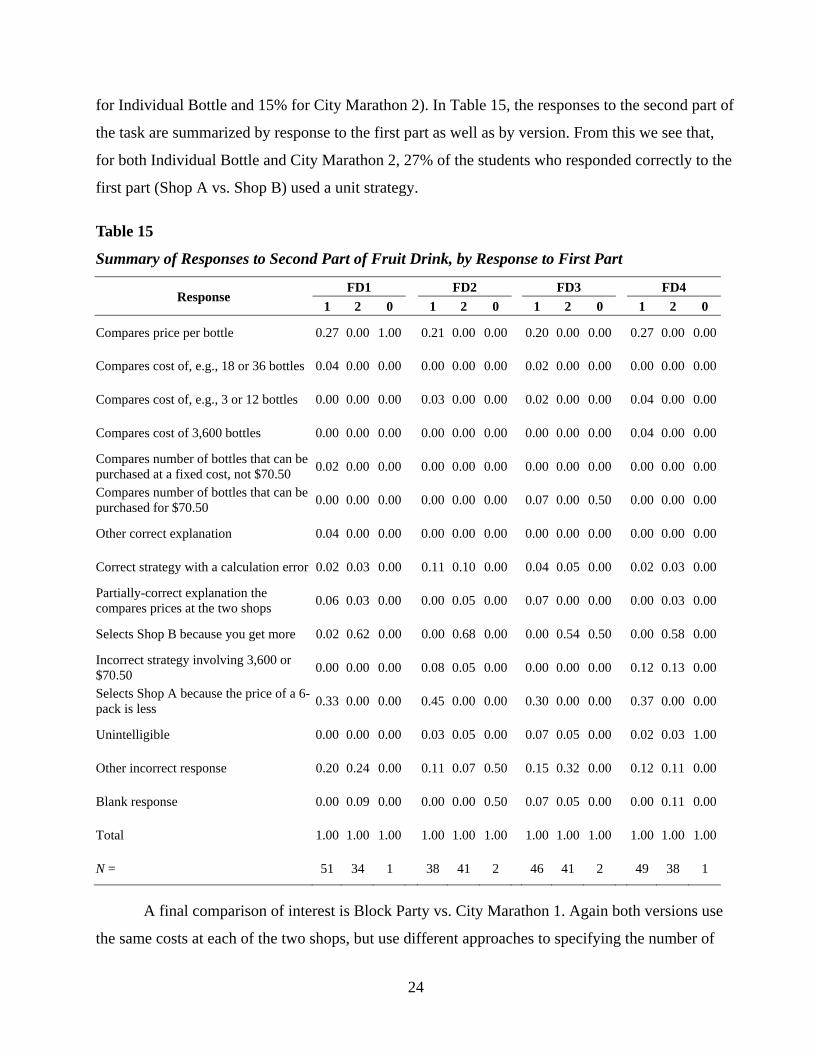
Table 15. Summary of Responses to Second Part of Fruit Drink, by Response to First Part ...... 24
Table 16. Frequency of Responses to Paste ................................................................................. 28
Table 17. Distribution of Variants for Bigfoot (1) ....................................................................... 31
Table 18. Summary of Responses to Bigfoot (1) Variants .......................................................... 32
Table 19. Summary of Responses to Bigfoot (1) by Version ...................................................... 32
Table 20. Students who Did or Did Not Respond with an Equation by Version ........................ 33
Table 21. Distribution of Variants for Bigfoot (2) ....................................................................... 35
Table 22. Summary of Responses for Bigfoot (2) Variants ........................................................ 37
Table 23. Summary of Responses to Bigfoot (2) by Version ...................................................... 37
Table 24. Responses to Explanation Question by Previous Response ........................................ 38
Table 25. Summary of Responses to Forest Carbon Variants (first part) .................................... 44
Table 26. Summary of Responses to Forest Carbon Variants (second part) ............................... 45
Table 27. Responses to “Show your work” Question by Previous Response ............................. 45

1
In this report, the authors describe the results of a research project that explored potential
ways in which selected constructed-response mathematics tasks might be revised to reduce
construct-irrelevant variance. The assessments from which these tasks were selected are part of an
extensive ETS research project known as Cognitively Based Assessment of, for, and as Learning
(CBAL). The goal of CBAL is to develop a research-based assessment system that provides
accountability testing (assessment of learning) and formative assessment (assessment for learning)
in an environment that is a worthwhile learning experience in and of itself (assessment as learning)
(Bennett & Gitomer, 2009). Assessments are being developed in mathematics, reading, and
writing. One feature of the project is that accountability assessments will be administered
periodically during the course of the year instead of all at once, at the end of the year; these
assessments are called Periodic Accountability Assessments (PAAs).
Because the PAAs are designed both to provide rich evidence of student learning and to
provide meaningful learning opportunities, most CBAL Mathematics tasks are constructed-
response tasks that require students to integrate multiple skills in the context of an extended
scenario (Graf, Harris, Marquez, Fife, & Redman, 2009), almost always involving a real-world
setting. Such tasks are more difficult to develop than traditional tasks, in part because it is
challenging to clarify the nature of the expected response. An example of this is described by
Marshall (1995), who was a member of the Mathematics Advisory Committee for the California
Assessment Program (CAP). The committee reviewed a sample of responses to open-ended items
that had been field-tested with Grade 12 students and discussed their results in a report. Marshall,
in her paper, discussed one of the items summarized in that report; about one-quarter of the
students who answered this particular item did not respond in mathematical terms, focusing instead
on situational factors. Her point was that many of the students may not have understood the
purpose of the task. This is not an uncommon experience in the development of open-ended tasks,
where there are no options to provide cues as to what constitutes an acceptable response. Attention
to the design of the prompt can help avoid this situation; breaking a task into parts can also help
provide supporting structure that can clarify how a task should be interpreted.
An examination of the mathematics tasks piloted for CBAL suggested that, for some
questions, students interpreted the question in a nonmathematical way or misunderstood what kind
of response was expected. An example of a nonmathematical interpretation occurred with the Fruit
Drink task; students were asked to consider which of two packs of fruit drink was the “better buy.”

2
The intention was that students should select the pack with the lower unit cost (the lower price per
bottle). It was clear from the responses, however, that a number of students had an alternative,
nonmathematical interpretation of the term “better buy.” This example is discussed at some length
in Graf et al. (2009).
This raises the question of whether problematic tasks can be revised to reduce construct-
irrelevant variance. This question was addressed by Ahmed and Pollitt (2007), who investigated
whether it is possible to manipulate the focus of contextualized science questions through revision.
They defined focus “…as the extent to which the most salient aspects of the context correspond to
the main issues addressed in the question” (p. 205). For each of several science test questions,
Ahmed and Pollitt constructed several different versions in which they manipulated the degree of
focus. They hypothesized that versions that were more focused would also be of higher quality. In
every case, they found that versions that were designed to be more focused were also of better
quality (as indicated by the corrected discrimination index). The focused versions also tended to be
easier; Ahmed and Pollitt attributed this to the removal of task-irrelevant difficulty. They
concluded that developing focused questions can improve their quality, probably because they are
more likely to activate construct-relevant schemas.
For this project, we selected six CBAL Mathematics tasks for revision, including Fruit
Drink. For each task, the rationales for selecting the task, the hypotheses we wanted to test with the
revisions, and the methods selected for revising the task were different. Sometimes, as with Fruit
Drink, we carefully varied certain features of the task while holding other features constant to see
what effect the variations had. At other times, as with Forest Carbon, we wrote variants that ranged
from unscaffolded to highly scaffolded. With the two tasks from the Bigfoot set, we independently
varied two features, each in two ways, producing four versions of each task.
The tasks were assembled into forms and piloted in two middle schools. The responses
were double human scored and the results analyzed.
In the sections that follow, we describe in detail how the six tasks were selected for
revision and we describe the protocols followed for assembly of the forms. Then we discuss each
task at length, describing the issues we found with the original version, demonstrating the various
ways in which the task was revised, and finally summarizing the results of our analysis. (The first
three sections of this report are adapted from Chapter 5 of Haberstroh, Harris, Bauer, Marquez, and
Graf , 2010).

3
Description of the Project
Review and Revision of the Tasks
The first step in the present study was to review piloted CBAL mathematics tasks (with
accompanying responses) to identify candidate questions for revision. As stated earlier, most CBAL
mathematics tasks consist of a series of questions addressing a common extended scenario. For the
present project, the unit of analysis (and proposed revision) was an individual question within a
task. Revision of the entire extended scenario was beyond the scope of this project. The candidate
questions were chosen because they elicited responses from students that may have been due to any
of the following: (a) an ambiguity in the question, (b) inattention to important information that was
not emphasized in the text of the question, (c) a nonmathematical interpretation of the question, or
(d) cognitive load due to the content or format of the display. From among the candidates, the six
questions that were selected appeared to have the potential for substantial clarification via revision.
Three of the six questions were from the Grade 7 PAAs and three were from the Grade 8 PAAs.
The questions are designated in this report by the task name. To identify the specific question
within the task that was revised, we have indicated here (in parentheses) the question number within
the corresponding PAA. The Fruit Drink task consisted of only one question and hence does not
have a number in parentheses. From the Grade 7 tasks, the following questions were revised: Fruit
Drink, Mix It Up (15), and Paste (7). From the Grade 8 tasks, the following questions were revised:
Bigfoot (1), Bigfoot (2), and Forest Carbon (3).
As suggested earlier, the revision of each question constituted its own experiment. Four
revised versions were developed for each of Fruit Drink, Paste, Forest Carbon, Bigfoot (1), and
Bigfoot (2), while two versions were developed for Mix It Up.
As stated earlier, because the revision of each question was its own experiment, the
rationales, hypotheses, and methods for each question were very different. To revise the questions,
the authors worked in pairs. Since there were three possible pairs, each pair worked on revising
two questions. Revisions to each question were discussed among all three authors and were
modified further as a result. For a few of the questions, one or two experts outside the group of
authors were also asked to provide input on the revised versions; a number of their suggested
changes were incorporated. Once there was agreement that the revised versions were conceptually
complete, they were submitted to fairness review and edit.
4
Assembling the Tasks into Forms
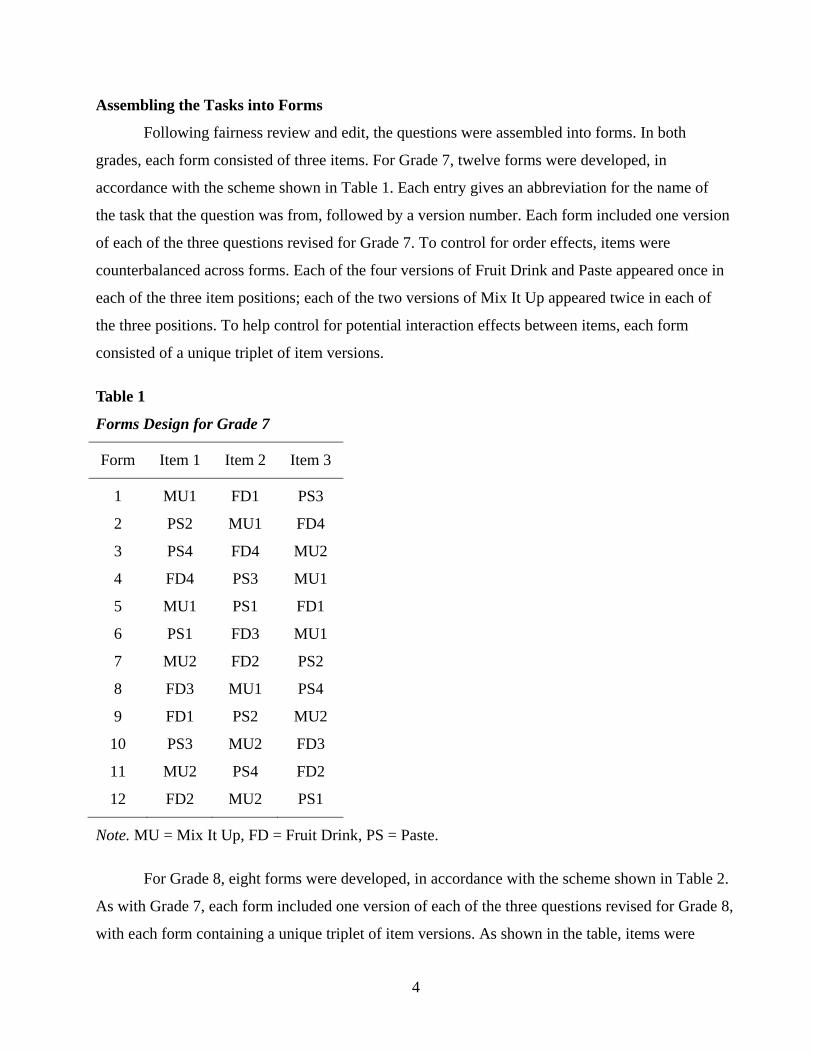
Following fairness review and edit, the questions were assembled into forms. In both
grades, each form consisted of three items. For Grade 7, twelve forms were developed, in
accordance with the scheme shown in Table 1. Each entry gives an abbreviation for the name of
the task that the question was from, followed by a version number. Each form included one version
of each of the three questions revised for Grade 7. To control for order effects, items were
counterbalanced across forms. Each of the four versions of Fruit Drink and Paste appeared once in
each of the three item positions; each of the two versions of Mix It Up appeared twice in each of
the three positions. To help control for potential interaction effects between items, each form
consisted of a unique triplet of item versions.
Table 1
Forms Design for Grade 7
Form Item 1 Item 2 Item 3
1 MU1 FD1 PS3
2 PS2 MU1 FD4
3 PS4 FD4 MU2
4 FD4 PS3 MU1
5 MU1 PS1 FD1
6 PS1 FD3 MU1
7 MU2 FD2 PS2
8 FD3 MU1 PS4
9 FD1 PS2 MU2
10 PS3 MU2 FD3
11 MU2 PS4 FD2
12 FD2 MU2 PS1
Note. MU = Mix It Up, FD = Fruit Drink, PS = Paste.
For Grade 8, eight forms were developed, in accordance with the scheme shown in Table 2.
As with Grade 7, each form included one version of each of the three questions revised for Grade 8,
with each form containing a unique triplet of item versions. As shown in the table, items were

5
counterbalanced across forms, subject to the constraint that Bigfoot (1) needed to immediately
precede Bigfoot (2), as the questions were designed to appear in this order. There was also a
constraint on how the versions could be paired. As stated earlier, two features of each item were
varied. One of the features varied was the graphic display that accompanied both items. Two
versions were made of the graphic, producing A versions and B versions of Bigfoot (1) and A
versions and B versions of Bigfoot (2). When pairing Bigfoot (1) and Bigfoot (2), A versions of
Bigfoot (1) had to be paired with A versions of Bigfoot (2) and B versions of Bigfoot (1) had to be
paired with B versions of Bigfoot (2).
Table 2
Forms Design for Grade 8
Form Item 1 Item 2 Item 3
1 BF1_A1 BF2_A1 FC3
2 FC1 BF1_A1 BF2_A2
3 FC4 BF1_A2 BF2_A1
4 BF1_A2 BF2_A2 FC2
5 BF1_B1 BF2_B1 FC1
6 FC3 BF1_B1 BF2_B2
7 FC2 BF1_B2 BF2_B1
8 BF1_B2 BF2_B2 FC4
Note. BF1 = Bigfoot (1), BF2 = Bigfoot (2), FC = Forest Carbon
Each page of each form was labeled with a unique student ID number. (This was done to
ensure that data from each student could be recovered should the pages become separated during
administration.) The last page of each form was a background questionnaire. The background
questionnaire was included at the end to reduce the possibility that stereotype threat might impact
performance. Excel macros were written that automatically generated the student ID numbers and
spiraled the forms. The resulting forms were printed, stapled, and packed into boxes (one box for
each school) and the boxes were shipped out. Forms from one school were returned in late
November 2009; forms from the other school were returned in early December.

6
Scoring the Responses
After the forms were returned, the responses were transcribed to an Excel spreadsheet. The
text responses were double-human coded according to rubrics that isolated what we thought might
be various incorrect solution strategies. (See Appendix B for the codes and descriptions.) The
codings were then checked for discrepancies, which were resolved by consensus.
The numeric responses and the codes for the text responses were then analyzed for each
task. For the analysis, some codes with a small occurrence frequency were combined. Because the
rationales, hypotheses, and methods for each task were different, each task was its own
experiment. Hence the analysis that was conducted on the responses to the revisions differed from
one task to another. In the next section, we will examine each task in detail, discussing the
rationale for selecting that task for revision, the types of revisions that we wrote and the
motivations for each, and the results of our analysis of the responses.
Analyzing the Results
The revised versions of the questions were administered under very different conditions
from the original questions—the original questions were delivered on computer as part of a
complete PAA, while the revised versions were administered on paper as discrete questions. Also,
the students who received the original versions were sampled from a different population from
those who received the revised versions. Because of this, our quantitative analysis will be limited
to comparing performance differences among the revised versions. Comparisons of the revised
versions with the original questions will be based strictly on a qualitative determination of whether
a misunderstanding is still present or has been introduced. Even so, these results must be
interpreted with caution, because there is always the possibility that a misunderstanding is present
or absent due to something particular about the sample.
Mix It Up
Mix It Up was a task administered in the fall 2007 Grade 7 pilot PAA. The story line
involves a team of students who are going to fix up a teen center with donated paint. They have
some red paint and some blue paint, and decide to mix the two colors to produce purple paint. The
task assesses the examinee’s understanding of proportions by exploring how different proportions
of red paint and blue paint lead to different shades of purple.

7
After playing around with various shades of purple, the team has 15 quarts of red paint and
24 quarts of blue paint remaining. Three students have proposed different shades of purple, in
terms of the ratio of red paint to blue paint required, as shown in Table 3.
Table 3
Preferred Proportion of Red Paint to Blue Paint, by Student
Student Proportion of red paint, r, to blue paint, b
Rosie 3
2
r
b
Juan 5
3
r
b
Karen 5
6
r
b
The team decides they like Karen’s purple best, so they mix all 15 quarts of red paint with
18 quarts of blue paint to produce 33 quarts of purple paint in Karen’s shade. At this point, the
examinee was presented with the question shown in Figure 1.
Figure 1. Mix It Up original version.
Test Section Question Number Testing Tools
Mix it Up 1 of 4
After making 33 quarts of purple paint using Karen’s proportion, the team decides they like Juan’s color better and will buy more paint to fix the color.
a. Which color will they have to buy?
b. How many quarts of that color will they have to buy?
The team used all 15 quarts of donated red paint and 18 quarts of donated blue paint to make Karen’s shade of purple. Of the donated paint, only 6 quarts of blue remain.
Proportion of red paint, r, to
blue paint b
Karen
Juan
Rosie3
2
r
b
5
3
r
b
5
6
r
b
Explain your response, using numbers equations, or words.
quarts
RedBlue

8
The intended response was that the team should mix 15 quarts of red paint to the 33 quarts
of purple paint, producing 48 quarts of paint that is a mixture of 30 quarts of red paint and 18 quarts
of blue paint—the 5:3 ratio favored by Juan. However, of the 195 examinees who responded to this
question, only 8 correctly responded that the team should mix 15 quarts of red paint, and of these 8,
only 2 or 3 gave an explanation that indicated that they understood why they should mix 15 quarts
of red paint; see Table 4.
Table 4
Responses to “Explain your response …”
18/3 = 6 6 x 5=30 15 x 2 = 30
Juan only uses three quarts of blue insted of six so you need to multiply the red by two.
because they like jauns better which is light so you need more red because red makes it lighter
idk
They used 15 quarts of red, and 18 quarts of blue. To match Juan’s mixture, which would have a ratio of 30:18, they’d have to buy 15 quarts of red paint.
the would need more red becuase you need alot more then Rosies
Because if you keep adding on to the 33 quarts, and than start doing Juan’s proportion or ratio, it will come out to be 30 quarts of red paint and 27 quarts of blue paint.
Blank response
Of course this question was, by intent, not easy. The examinee had to first recognize that
the 5:3 ratio of red paint to blue paint in Juan’s mixture was to be based on the 18 quarts of blue
paint in Karen’s mixture and not the 15 quarts of red paint. Then, after solving the proportion
18 5 3x to see that Juan’s mixture must have 30 quarts of red paint, the examinee had to
recognize that the mixture already contained 15 quarts of red paint and therefore the correct
answer was 30 15 15 quarts of red paint. (One examinee missed this last step and responded
that the team should buy 30 quarts of red paint.) But difficulty alone is not sufficient to account

9
for 3195 0.015p . One must look at other features of the question to understand the poor student
performance.
Much of the problem lies in the ambiguity of the phrase fix the color. The intended
response assumed that the team wanted to buy the minimum amount of paint to add to the 33
quarts of Karen’s purple to produce Juan’s purple, ignoring the 6 quarts of blue paint left over
from the previous mixing. But other interpretations of fix the color are defensible:
The team wants to use as much of the donated paint as they can. They mix the 6 quarts
of leftover blue paint to the 33 quarts of Karen’s purple and then add 25 quarts of red
paint to produce 64 quarts of Juan’s purple.
The team has already used the 33 quarts of Karen’s purple and they want to add enough
red paint to the 6 quarts of leftover blue paint to produce Juan’s mixture. So they buy 10
quarts of red paint.
The team has used the 33 quarts of Karen’s purple to paint the center, and now they
want to mix up 33 quarts of Juan’s purple to repaint the center (“fixing” what they’ve
already painted). For this they will need 20.625 quarts of red paint and 12.375 quarts of
blue paint.
Only one examinee responded that the team should buy 25 quarts of red paint, but 35
responded that they should buy 10 quarts of red paint, and at least 28 of these gave a correct
explanation based on the reasoning in the second bullet above. One examinee seems to have
thought along the lines of the third bullet. The format of the question did not permit a response
that the team should buy both red paint and blue paint, but this examinee seems to have assumed
that the 33 quarts of red paint could be separated out into its constituent parts of 15 quarts of red
and 18 quarts of blue; the examinee then determined that the team needed to buy
20.625 15 5.625- = quarts of red paint.
While it may not have affected student performance, we were also concerned with the
unrealistic nature of the item. Thirty-three quarts is more than 8 gallons. Apparently, the students
mixed up 8 gallons of paint before using any of it. Did they mix up all the paint in one giant tub?
Where did they find a container large enough to hold more than 8 gallons of paint? Or did they
mix up three batches of 11 quarts each? If so, why didn’t they mix up and use one batch before
10
mixing up any more? If they had realized after mixing 11 quarts that they preferred Juan’s
purple, they could have “fixed” the color of the paint without buying any more paint.
To resolve these difficulties, we wrote two revisions of the question. In Version 1 (see the
Appendix for the revised versions), the team only mixes 11 quarts of Karen’s purple before
deciding they like Juan’s better. The revision also makes clear that the team decides they prefer
Juan’s purple before they use any of the 11 quarts of Karen’s, and it resolves the other
ambiguities by specifying that the team wants to make 24 quarts of Juan’s purple. The examinee
must calculate the amount of red paint and the amount of blue paint that must be added to
Karen’s 11 quarts to produce 24 quarts of Juan’s purple.
While the mathematics required to solve Version 1 is not quite the same as that required
to solve the original version, it is quite similar. The team wants 24 quarts of purple paint at a red-
to-blue ratio of 5:3. To solve the problem, the examinee must find numbers r and b such that
5 3r b and 24r b+ = . Alternatively, the examinee can solve the proportion 24 5 8r .
Either way, once the examinee determines that the 24 quarts of Juan’s purple must have 15
quarts of red paint and 9 quarts of blue paint, the examinee must subtract the 5 quarts of red and
6 quarts of blue already in the 11 quarts of Karen’s purple to determine that 10 quarts of red and
3 quarts of blue must be added.
Version 1 was intended to retain the construct-related difficulty of the original question
while removing the non-construct-related ambiguities. As a result, it is still a hard question, and
we thought that it might be a good idea also to pilot an easier version of the question. In Version
2, the team has again mixed up 33 quarts of Karen’s purple (though not necessarily all at once)
and they have used all 33 quarts to paint the center. Now they want to paint the roof in Juan’s
purple. The examinee must determine the amount of red paint to add to the 6 quarts of blue paint
remaining to produce a batch of Juan’s purple. This was the interpretation of the original version
mentioned in the second bullet on page 9. The correct response to this interpretation is that the
team should buy 10 quarts of red paint. Among the examinees who responded that the team
should buy red paint, more than twice as many examinees gave a response of 10 as gave any
other response (see Table 5.)

11
Table 5
Common Responses to Original Version of Mix It Up
Response Frequency
10 35 5 14 3 9
15* 8 6 6 2 5 4 4 1 3 7 2 9 2 12 2 14 2 17 2 18 2 20 2 35 2
* Correct response
Another possible explanation for the poor student performance on the original version of
this task could reside in the “unfriendliness” of the ratios, especially the 5:3 ratio in Juan’s
purple. It might be possible to produce an item with improved student performance by retaining
the original scenario but changing the ratios of Karen’s purple and Juan’s purple to ratios of the
form n:1. However, to have a mathematically nontrivial item, we would need ratios of at least
3:1 for Karen and 5:1 for Juan. But a mixture of 5 parts red paint to 1 part blue paint is not going
to be purple; it will be barely distinguishable from red. We could have changed the context so
that these ratios would be realistic, but that would have been outside the scope of this project.
Since the revised versions of the task were to be piloted without the previous questions in
the set to establish the story line, we created an introductory slide, shown in the appendix.
Analysis of results—Version 1. Table 6 shows the frequency of responses to the numeric
questions in Mix It Up Version 1. Overall performance on Version 1 was about the same as on the
original version. Of the 177 examinees who were administered Version 1, only 8 (or about 5%)
responded correctly that the group should add 10 quarts of red paint and 3 quarts of blue paint. The
most common response was that the group should add 5 quarts of red paint and 6 quarts of blue
paint, producing Karen’s preferred purple instead of Juan’s. Of the 15 students who gave this

12
response, one third gave an explanation that seemed to indicate they thought the question referred to
the 11 quarts of Karen’s purple previously mixed (see Table 7 and Table 8); for example, one
student wrote, “Since the class used 5 quarts of donated red paint and 6 quarts of donated blue
paint, 5 plus 6 equals 11.” Another third gave some sort of incorrect calculation using the numbers
in the item, and one fifth did not respond to the explanation question.
Table 6
Most Frequent Responses to Mix It Up Version 1 (N = 177)
Responses Frequency Percentage
5|6 15 8% 7|6 12 7% 6|7 10 6% 6|5 9 5%
10|3* 8 5% 8|5 7 4%
13|11 6 3% 11|13 5 3% 13|13 5 3% 5|3 5 3%
blank 5 3%
* Correct response
Table 7
Summary of Responses to “Explain your response …” Question
Response to “Explain your response…” question Frequency
Correct explanation 0.02
The student understands that 13 quarts are required with more red than blue. 0.02
The student understands only that 13 quarts are required. 0.14
The student thought the numbers should be the numbers in Juan’s ratio—5 and 3. 0.03
The student thought the numbers should be the numbers in Karen's ratio—5 and 6. 0.03
The student thought the ratio of red to blue should be Karen’s ratio. 0.01
The student gave an incorrect calculation using the numbers in the item. 0.28
The response is not interpretable. 0.03
Other incorrect response 0.28
Blank response 0.18
Total 1.00
N = 177

13
Table 8
Responses to “Explain …” Question by Responses to Numeric Questions
Response to “Explain your response...” question
5|6 7|6 6|7 6|5 10|3 8|5 13|11 11|13 13|13 5|3
Correct explanation 0.00 0.00 0.00 0.00 0.38 0.00 0.00 0.00 0.00 0.00 The student understands that 13 quarts are required with more red than blue.
0.00 0.08 0.00 0.00 0.00 0.29 0.00 0.00 0.00 0.00
The student understands only that 13 quarts are required.
0.00 0.75 0.30 0.00 0.25 0.57 0.00 0.00 0.00 0.00
The student thought the numbers should be the numbers in Juan's ratio–5 and 3.
0.00 0.00 0.00 0.00 0.00 0.00 0.00 0.00 0.00 0.80
The student thought the numbers should be the numbers in Karen's ratio–5 and 6.
0.33 0.00 0.00 0.00 0.00 0.00 0.00 0.00 0.00 0.00
The student thought the ratio of red to blue should be Karen's ratio.
0.07 0.00 0.00 0.00 0.00 0.00 0.00 0.00 0.00 0.00
The student gave an incorrect calculation using the numbers in the item.
0.33 0.08 0.00 0.67 0.13 0.00 0.50 0.60 0.80 0.00
The response is not interpretable. 0.07 0.00 0.00 0.00 0.00 0.00 0.00 0.00 0.00 0.00
Other incorrect response 0.00 0.00 0.40 0.22 0.13 0.00 0.33 0.00 0.00 0.20
Blank response. 0.20 0.08 0.30 0.11 0.13 0.14 0.17 0.40 0.20 0.00
Total 1.00 1.00 1.00 1.00 1.00 1.00 1.00 1.00 1.00 1.00
N = 15 12 10 9 8 7 6 5 5 5
Twelve students responded that the group should add 7 quarts of red paint and 6 quarts of
blue paint, and ten responded that the group should add 6 quarts of red and 7 quarts of blue. The
responses of these 22 students to the explanation question seem to indicate that, while they realized
that a total of 13 quarts of paint needed to be added to the 11 quarts, they thought the 13 quarts
should be divided as evenly as possible between red and blue. For example, one student wrote
“Because I tried to make the red and blue equal but this was what I got,” and another wrote “Six of
blue and seven of red because there is thirteen left that they need & then you have to divide that.”
Nine students responded with 6 quarts of red and 5 quarts of blue. The responses of these
students to the explanation question seem to indicate that they were confused about the 11 quarts
already mixed up and thought that 11 more quarts needed to be added, and that these 11 quarts
should be divided as evenly as possible; one student response was “You need six quarts of red and
5 five quarts of blue to get right amount” and another was “That is the best way to equally divide
it.”

14
Seven students responded with 8 quarts of red and 5 quarts of blue. These students knew
that 13 quarts total were needed, but thought that the 13 quarts could be divided arbitrarily between
red and blue (“You add 8 and 5 it gets 24. But [you] can do any number”), perhaps with the
constraint that there should be more red than blue (“…because Juan’s color uses more red and they
need 13 quarts to add to 11.”)
Eighteen students responded with some combination of 13 quarts and 11 quarts (two
responded 11 and 11). The students who responded 13 red and 11 blue or 11 red and 13 blue did
not seem to realize that they were adding paint to the already-mixed 11 quarts, and so thought they
needed a total of 24 quarts. Since the only other number they had was 11 quarts, they seem to have
assumed that they would need to use 11 quarts of one of the two colors. Those who responded 13
red and 11 blue realized that they needed more red paint than blue paint (“The students need less
blue paint if you look at the chart and more red.”) Those who responded 11 red and 13 blue either
gave some sort of incorrect calculation to justify their response or else left the explanation question
blank. Those who responded 13 quarts of red and 13 quarts of blue seemed to realize that they
needed to add 13 quarts of paint but did not realize that they were supposed to break that 13 quarts
into the number of quarts of red paint and the number of quarts of blue paint; here are two of the
responses:
well [you] add 11+13=24 quarts
24 quarts minus eleven is 13 which was the remainder
The two students who responded 11 red and 11 blue did not seem to have any understanding of the
problem (“[I] used 11 quarts for both to [add] to 24”).
Finally, five students responded 5 red quarts and 3 blue quarts. It seems clear from those
students’ responses to the explanation question that they used 5 and 3 because they are the
numbers that appear in Juan’s ratio: “If you used 5 red and 3 blue you would get Juan’s purple. I
found out by looking at the chart.”
In summary, the revised item was, like the original, a difficult item, although for a different
population of students. The revisions did remove the non-construct-related errors present with the
original item. The errors that the students made seem to reflect a lack of understanding of the
mathematics, with perhaps a resultant desperate grasp at any thread that might lead to a solution.
Analysis of results—Version 2. Table 9 shows the most frequent responses to the numeric
question in Version 2. As expected, this version was considerably easier than Version 1, with 31

15
correct responses (19%; for a two-sample z-test, 0.0001p ); furthermore, 84% of these students
gave a correct explanation of their answer in the second part of the item (see Table 10 and Table
11).
Table 9
Most Frequent Responses to Mix It Up Version 2
Response Frequency Percentage
10* 31 19%
6 24 14%
5 22 13%
3 13 8%
9 11 7%
15 7 4%
blank 7 4%
4 5 3%
7 5 3%
8 5 3%
* Correct response
Table 10
Summary of Responses to “Explain …” Question
Response to “Explain your response…” question Frequency
Correct explanation 0.16
The student thought the numbers should be the numbers in Juan’s ratio—5 and 3. 0.05
The student was possibly using the incorrect addition strategy. 0.04
The student was possibly using Karen’s ratio instead of Juan’s. 0.07
The student gave an incorrect calculation using the numbers in the item. 0.16
The response is not interpretable. 0.06
Other incorrect response 0.35
Blank response 0.11
Total 1.00
N = 167

16
Table 11
Responses to “Explain …” Question by Responses to Numeric Question
Response to “Explain…” item
10 6 5 3 9 15 blank
4 7 8
Correct explanation 0.84
0.00
0.00
0.00
0.00
0.00
0.00
0.00
0.00
0.00
The student thought the numbers should be the numbers in Juan’s ratio—5 and 3.
0.00
0.00
0.32
0.08
0.00
0.00
0.00
0.00
0.00
0.00
The student was possibly using the incorrect addition strategy.
0.00
0.00
0.05
0.00
0.00
0.00
0.00
0.20
0.00
0.80
The student was possibly using Karen’s ratio instead of Juan’s.
0.00
0.00
0.45
0.00
0.00
0.00
0.00
0.20
0.00
0.00
The student gave an incorrect calculation using the numbers in the item.
0.00
0.13
0.05
0.08
0.45
0.00
0.00
0.00
0.00
0.20
The response is not interpretable.
0.06
0.04
0.00
0.08
0.00
0.14
0.14
0.00
0.20
0.00
Other incorrect response 0.03
0.83
0.14
0.46
0.27
0.71
0.14
0.40
0.80
0.00
Blank response 0.06
0.00
0.00
0.31
0.27
0.14
0.71
0.20
0.00
0.00
Total 1.00
1.00
1.00
1.00
1.00
1.00
1.00
1.00
1.00
1.00
N = 31 24 22 13 11 7 7 5 5 5
The most frequent incorrect response was 6 quarts, with 24 responses (14%). Students who
responded “6 quarts” seemed to think that the new purple mixture needed to have the same amount
of red paint as blue; see Table 12 for some typical responses.
Table 12
Responses to “Explain …” Question by Students who Responded “6”
Responses They can't have [too] much or to less of the color because it might come out lighter or darker. So that the red paint will match the number of quarts the color blue has to make it even because there is 0 red and 6 quarts of blue so they need at least 5 or 6 quarts of red 6 quarts because it has 6 quarts of [blue] and it will make it equal Well they already have six they need a double of it to paint the whole room you will need 6 blue and 6 red quarts to make 12 quarts of purple They need to get the same amount that they got in blue. If you use 6 quarts of red and 6 quarts of blue it would be an equal amount of each to make purple You need the same amount for both

17
The second-most frequent incorrect response was 5 quarts, with 22 responses (13%). Of
these students, 32% gave an explanation that indicated they thought that Juan’s ratio of 5 quarts
of red paint to 3 quarts of blue paint meant that they should necessarily add 5 quarts of red paint,
regardless of the amount of blue paint present. About 45% thought that the presence of 6 quarts
of blue paint meant that Karen’s ratio was the relevant one (it is the only one with 6 quarts of
blue paint) and therefore 5 quarts of red paint was required. See Table 13 for some responses by
these students.
Table 13
Responses to “Explain …” Question by Students who Responded “5”
Responses that refer to Juan’s mixture
o They have already used Karen mixture all only 6 quarts remain. That's enough to make Juan mixture for blue all you need is 5 quarts of red paint.
o if you look at the chart r=red and b=blue So its r/b=r (red)/3 (blue)
o Because Juan wants 5 quarts of paint in his proportion.
o I got this because if they used all 15 quarts for Karen than they need 5 quarts for Juan.
o because it says she wants 3 blue and 5 red
o Because they are using 6 and [Juan’s] but 6 is all they have and [Juan] needs 5 in order for them to be completed.
o I looked at [Juan’s] ratio and the ratio of red is 5
Responses that refer to Karen’s mixture
o Karen’s mixture uses 6 quarts of blue and 5 quarts of red to make purple so I used her proportions.
o they need 5 quarts because if they want a purple then they will get a purple that [Karen] made
o Because R/15=5/6 then only 6 quarts of blue and they need 5 quarts of red.
o The reason why I picked this answer is not because I knew since the problem said they used up 6 quarts I saw an equation on my left and I just put 5 as my answer
o Because if you look at the chart then you go all the way down to [Karen] then it s the same fraction of the problem
o look of the [Karen]
Thirteen students, or 8%, responded that 3 quarts should be added. Among these students,
there does not seem to be a common misconception that produced this response. Some typical
explanations are the following:
If you used 3 less quarts of red paint then the color would match the wall
Because I subtracted and got the difference of eighteen and fifteen.
18
I say 3 because over there they cross multiply so I say 3
Eleven students (7%) thought that 9 quarts of red paint were required. Most arrived at this
number by means of some sort of calculation involving the given numbers. For example, one
student used the 15 quarts of red paint and 24 quarts of blue paint that the group had before mixing
the 33 quarts of Karen’s mixture, and concluded that “24 quarts of blue paint – 15 quarts of red
paint = 9 quarts of red paint.” Another student used the 15 quarts of donated red paint and the 6
quarts of blue paint left over to conclude that “15 quarts of red paint – 6 quarts of blue paint = 9
quarts of red paint.”
Seven students (4%) responded that 15 quarts of red paint are needed. At least some of these
students seem to be making the (not unreasonable) assumption that there are three classmates doing
the painting (Rosie, Juan, and Karen), and that each will need 5 quarts (since Juan’s ratio is being
used).
Finally, five students each gave a response of 4, 7, or 8 quarts. The most common error here
was the use of an incorrect addition strategy—solving the equation 6 5 3x- = - instead of the
proportion, 6 5 3x = .
In summary, Version 2 was, as was expected, easier than Version 1, although it was still a
difficult item for these students. The errors that these students made were due to construct-related
misconceptions and/or lack of construct-related skills, so again we were successful in removing the
construct-irrelevant difficulty while crafting an item that was less difficult than Version 1.
Fruit Drink
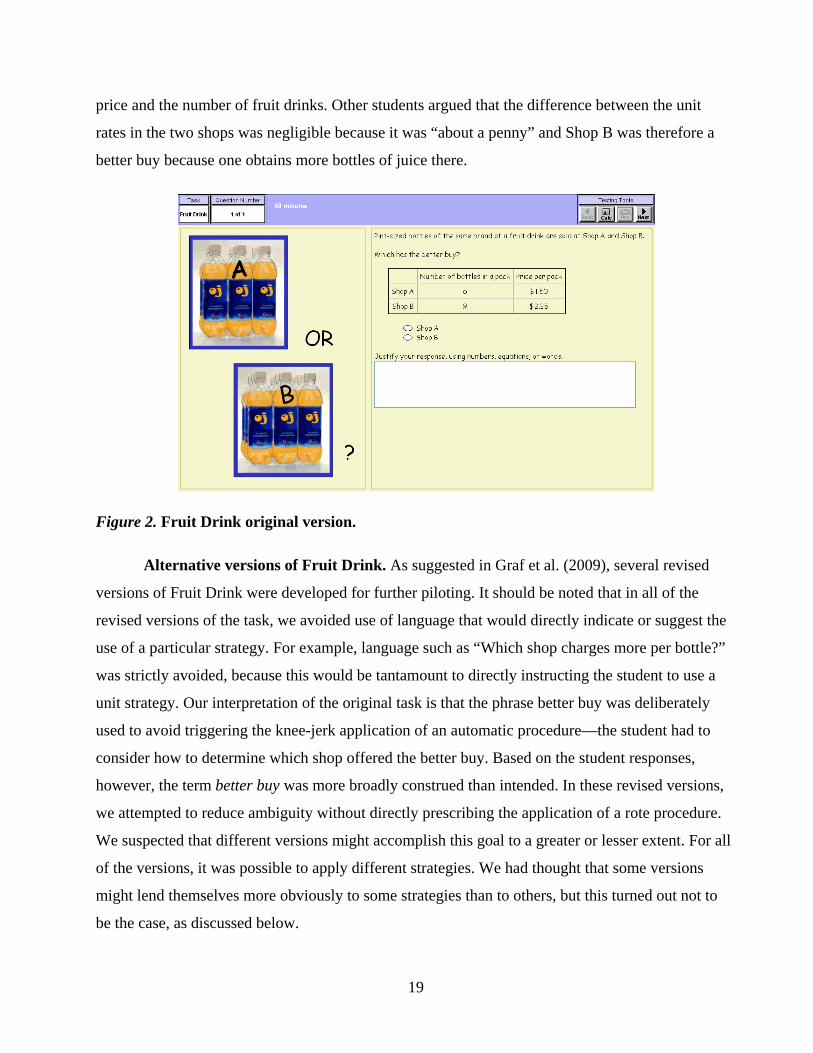
Fruit Drink was a short task delivered as part of the fall 2007 PAA for Grade 7. The
original task as administered to students is shown in Figure 2. The intent of this task was for the
student to use proportional reasoning to determine which shop offers the lower unit cost, and to
explain his or her reasoning. As such, the task was designed to assess the Argue/Justify and Use
Proportionality with Understanding competencies from the CBAL Mathematics competency
model. Note, however, that providing the intended correct response was dependent on a particular
interpretation of the phrase better buy, an interpretation not always shared by the students. This
issue was discussed in some length in Graf et al. (2009). Some students interpreted better buy to
mean something other than the lowest unit price—they may have interpreted it to mean the
purchase of a larger number of fruit drinks or a decision that involves considering both the unit
19
price and the number of fruit drinks. Other students argued that the difference between the unit
rates in the two shops was negligible because it was “about a penny” and Shop B was therefore a
better buy because one obtains more bottles of juice there.
Figure 2. Fruit Drink original version.
Alternative versions of Fruit Drink. As suggested in Graf et al. (2009), several revised
versions of Fruit Drink were developed for further piloting. It should be noted that in all of the
revised versions of the task, we avoided use of language that would directly indicate or suggest the
use of a particular strategy. For example, language such as “Which shop charges more per bottle?”
was strictly avoided, because this would be tantamount to directly instructing the student to use a
unit strategy. Our interpretation of the original task is that the phrase better buy was deliberately
used to avoid triggering the knee-jerk application of an automatic procedure—the student had to
consider how to determine which shop offered the better buy. Based on the student responses,
however, the term better buy was more broadly construed than intended. In these revised versions,
we attempted to reduce ambiguity without directly prescribing the application of a rote procedure.
We suspected that different versions might accomplish this goal to a greater or lesser extent. For all
of the versions, it was possible to apply different strategies. We had thought that some versions
might lend themselves more obviously to some strategies than to others, but this turned out not to
be the case, as discussed below.

20
City Marathon Version 1. This is Version FD2 in the appendix. Note that we have avoided
the term better buy. In addition, since the number of bottles to be purchased is specified and is
clearly a multiple of both 6 and 9, this version eliminates the concern that one might need to
purchase more bottles than were required at one of the stores.
Note that several other modifications were made to the original task—these modifications
are common to all of the revised versions. A motivating context (i.e., a reason to purchase the fruit
drink) was introduced, although this context varied across versions. The table on the right side of
the screen was eliminated. Although tables are useful for presenting several rows and/or columns
of data, for the amount of information here a table was probably unnecessary and used a large
amount of screen space. In the original task, the graphics on the left were not directly connected to
the information presented in the table. In the revised versions, the information about the cost at
each shop appears next to the corresponding graphic.
A final change concerns the language used to introduce the context. The original sentence,
“Pint-sized bottles of the same brand of a fruit drink are sold at Shop A and Shop B.” used
potentially sensitive language and introduced a possibly unfamiliar unit (if a student has grown up
using the metric system, for example). The following alternative wordings were considered:
1. The same bottles of fruit drink are sold at Shop A and Shop B.
2. The same brand of a fruit drink is sold at Shop A and at Shop B. The sizes of the bottles
at both shops are the same.
3. Shop A and Shop B sell bottles of fruit drink of the same brand and size.
4. Bottles of fruit drink sold in Shop A are identical to those sold in Shop B.
5. Bottles of fruit drink sold in Shop A are identical to bottles of fruit drink sold in Shop B.
6. Bottles of fruit drink sold in Shop A are identical (same brand and size) to those sold in
Shop B.
7. Bottles of fruit drink sold in Shop A are identical (same brand and size) to bottles of
fruit drink sold in Shop B.
8. Shop A and Shop B sell identical bottles of fruit drink.

21
9. The same brand of a fruit drink is sold at Shop A and at Shop B. The bottles come in one
size.
10. Sixteen-ounce bottles of the same brand of a fruit drink are sold at Shop A and Shop B.
Most of these options introduce other ambiguities, however. For example, Option 1, while
simple, suggests that exactly the same bottles (rather than identical bottles) are sold at Shop A and
Shop B. Options 2 through 8 do not have this issue, but may be interpreted to mean that Shops A
and B sell identical collections of bottles (but that each shop may sell bottles in several different
sizes, for example). Option 9 stipulates that the bottles come in only one size, without committing
to a particular unit. While this version was seriously considered, in the end it was decided that it is
less understandable than Option 10, which uses a concrete unit. Option 10 avoids the potential
sensitivity issue. While the unit may be unfamiliar to students who were not schooled using the
British system, the unit per se is not essential to answering the question. Finally, each bottle in the
graphic is labeled “16 FL OZ.” Since altering the image was out of scope for this activity, it was
decided that it would be sensible to use wording consistent with the label in the image, so all of the
revised versions use Option 10.
Individual Bottle version. The City Marathon version of Fruit Drink demonstrates one
approach to eliminating potential confusion about the number of bottles that may be purchased at
each shop. This approach introduced another number (3,600) into the problem, however. In
addition, we had thought the version might discourage the use of a unit strategy (finding the price
per bottle), which was strongly suggested in the original version of the task. Another approach
would be to stipulate that bottles are sold individually, and to modify the numbers slightly so that
the cost for each bottle would be a whole number of cents. A version of the task with these
modifications, which we refer to as the Individual Bottle version, is shown in the appendix as FD1.
The key is still the same as in the original version, but in this version the cost of purchasing one
bottle from Shop B is 26 cents instead of 1926 cents. Although this change might have made the
problem easier, and would not provide evidence for students’ ideas about when rounding is
appropriate, it seemed a necessary modification given the stipulation that bottles are sold
individually.
City Marathon Version 2. City Marathon Version 2 is exactly the same as City Marathon
Version 1, except that the cost of 9 bottles at Shop B is $2.34 instead of $2.35. In other words, City

22
Marathon Version 2 is identical to City Marathon Version 1, except that it uses the costs from the
Individual Bottle version. This version is shown in the appendix as FD4. The primary purpose for
including City Marathon Version 2 was to examine the impact that changing the numbers would
have on task difficulty (by comparing student performance on City Marathon Version 1 with
student performance on City Marathon Version 2). We can also compare performance on City
Marathon Version 2 with performance on Individual Bottle, since these two versions use the same
costs at each of the two shops but use different approaches to eliminating confusion about the
number of bottles that may be purchased at each shop.
Block Party version. Another approach to eliminating potential confusion about the
number of bottles that may be purchased at each shop is to fix the amount of money that may be
spent so that it is a multiple of both $1.50 and $2.35. The least common multiple of 150 and 235 is
7,050. A version of the task that takes this approach is in the appendix as FD3. We can compare
performance on the Block Party version with performance on City Marathon Version 1. These two
versions use the same costs; in City Marathon, the objective is to buy a fixed number of bottles for
the least cost, while in Block Party, the objective is to buy the maximum number of bottles for a
fixed cost.
Analysis of results. The responses to the four variants of Fruit Drink are summarized in
Table 14. For the first part of the question (selecting Shop A or Shop B), there was no significant
difference in difficulty among the four versions. We had thought that changing the price of 9 bottles
at Shop B from $2.35 to $2.34 might make the task easier (since 2.34 is divisible by 9 and 2.35 is
not). If this change were to make the task easier, it would be most obvious by comparing City
Marathon 1 with City Marathon 2, since the difference in price is the only difference between these
two versions. While 56% of the students who saw City Marathon 2 (with the Shop B price of $2.34)
responded correctly to the first part of the task vs. 47% who saw City Marathon 1 (with the Shop B
price of $2.35), the total number of students involved was too small for this difference to be
statistically significant ( 0.1264p = ). The pilot would need to be repeated with a larger sample of
students in order to determine if this change to the task actually makes it easier or not.

23
Table 14
Summary of Responses to Fruit Drink, by Version
Response to first part of task FD1 FD2 FD3 FD4 Total
Shop A* 0.59 0.47 0.52 0.56 0.53
Shop B 0.40 0.51 0.46 0.43 0.45
No response 0.01 0.02 0.02 0.01 0.02
Total 1.00 1.00 1.00 1.00 1.00
N = 86 81 89 88 344
* Correct response
Response to second part of task FD1 FD2 FD3 FD4 Total
Compares price per bottle 0.17 0.10 0.10 0.15 0.13
Compares cost of, e.g., 18 or 36 bottles 0.02 0.00 0.01 0.00 0.01
Compares cost of, e.g., 3 or 12 bottles 0.00 0.01 0.01 0.02 0.01
Compares cost of 3,600 bottles 0.00 0.00 0.00 0.02 0.01
Compares number of bottles that can be purchased at a fixed cost, not $70.50 0.01 0.00 0.00 0.00 0.00
Compares number of bottles that can be purchased for $70.50 0.00 0.00 0.04 0.00 0.01
Other correct explanation 0.02 0.00 0.00 0.00 0.01
Correct strategy with a calculation error 0.02 0.10 0.04 0.02 0.05
Partially-correct explanation the compares prices at the two shops 0.05 0.02 0.03 0.01 0.03
Selects Shop B because you get more 0.26 0.35 0.26 0.25 0.28
Incorrect strategy involving 3,600 or $70.50 0.00 0.06 0.00 0.13 0.05
Selects Shop A because the price of a 6-pack is less 0.20 0.21 0.16 0.20 0.19
Unintelligible 0.00 0.04 0.06 0.03 0.03
Other incorrect response 0.21 0.10 0.22 0.11 0.16
Blank response 0.03 0.01 0.06 0.05 0.04
Total 1.00 1.00 1.00 1.00 1.00
N = 86 81 89 88 344
Note. FD1 = Individual Bottle, FD2 = City Marathon 1, FD3 = Block Party, FD4 = City Marathon 2.
Another comparison of interest is Individual Bottle vs. City Marathon 2. Both versions use
the same costs at each of the two shops (so that the cost of an individual bottle is a whole number of
cents), but use different approaches to eliminate the confusion about the number of bottles that may
be purchased at each shop. There was essentially no difference in the difficulty of the two versions
(59% correct for Individual Bottle vs. 56% correct for City Marathon 2). We had expected that a
unit strategy would be the preferred solution method for the Individual Bottle version but not for the
City Marathon 2 version; in fact, the unit strategy was the preferred strategy for both versions (17%
24
for Individual Bottle and 15% for City Marathon 2). In Table 15, the responses to the second part of
the task are summarized by response to the first part as well as by version. From this we see that,
for both Individual Bottle and City Marathon 2, 27% of the students who responded correctly to the
first part (Shop A vs. Shop B) used a unit strategy.
Table 15
Summary of Responses to Second Part of Fruit Drink, by Response to First Part
Response FD1 FD2 FD3
FD4
1 2 0 1 2 0 1 2 0 1 2 0
Compares price per bottle 0.27 0.00 1.00 0.21 0.00 0.00 0.20 0.00 0.00
0.27 0.00 0.00
Compares cost of, e.g., 18 or 36 bottles 0.04 0.00 0.00 0.00 0.00 0.00 0.02 0.00 0.00
0.00 0.00 0.00
Compares cost of, e.g., 3 or 12 bottles 0.00 0.00 0.00 0.03 0.00 0.00 0.02 0.00 0.00
0.04 0.00 0.00
Compares cost of 3,600 bottles 0.00 0.00 0.00 0.00 0.00 0.00 0.00 0.00 0.00
0.04 0.00 0.00
Compares number of bottles that can be purchased at a fixed cost, not $70.50
0.02 0.00 0.00 0.00 0.00 0.00 0.00 0.00 0.00
0.00 0.00 0.00
Compares number of bottles that can be purchased for $70.50
0.00 0.00 0.00 0.00 0.00 0.00 0.07 0.00 0.50
0.00 0.00 0.00
Other correct explanation 0.04 0.00 0.00 0.00 0.00 0.00 0.00 0.00 0.00
0.00 0.00 0.00
Correct strategy with a calculation error 0.02 0.03 0.00 0.11 0.10 0.00 0.04 0.05 0.00
0.02 0.03 0.00
Partially-correct explanation the compares prices at the two shops
0.06 0.03 0.00 0.00 0.05 0.00 0.07 0.00 0.00
0.00 0.03 0.00
Selects Shop B because you get more 0.02 0.62 0.00 0.00 0.68 0.00 0.00 0.54 0.50
0.00 0.58 0.00
Incorrect strategy involving 3,600 or $70.50
0.00 0.00 0.00 0.08 0.05 0.00 0.00 0.00 0.00
0.12 0.13 0.00
Selects Shop A because the price of a 6-pack is less
0.33 0.00 0.00 0.45 0.00 0.00 0.30 0.00 0.00
0.37 0.00 0.00
Unintelligible 0.00 0.00 0.00 0.03 0.05 0.00 0.07 0.05 0.00
0.02 0.03 1.00
Other incorrect response 0.20 0.24 0.00 0.11 0.07 0.50 0.15 0.32 0.00
0.12 0.11 0.00
Blank response 0.00 0.09 0.00 0.00 0.00 0.50 0.07 0.05 0.00
0.00 0.11 0.00
Total 1.00 1.00 1.00 1.00 1.00 1.00 1.00 1.00 1.00
1.00 1.00 1.00
N = 51 34 1 38 41 2 46 41 2
49 38 1
A final comparison of interest is Block Party vs. City Marathon 1. Again both versions use
the same costs at each of the two shops, but use different approaches to specifying the number of

25
bottles to be bought. About 47% of the students answered City Marathon 1 correctly vs. 52% who
answered Block Party correctly, a difference that is not significant given the small number of
students ( 0.2669p ). Of the students who responded correctly to the first part, 21% of the
students who saw City Marathon 1 and 20% of those who saw Block Party used a unit strategy.
Returning for a moment to the City Marathon 1 / City Marathon 2 comparison, there was a
difference between the percentage of students who answered City Marathon 1 correctly by using a
unit strategy and the percentage who answered City Marathon 2 correctly by using a unit strategy—
21% vs. 27%. Due to the small number of students involved, this difference is not statistically
significant ( 0.2744p ), but it does suggest the possibility that a unit strategy is more appealing
when the unit price is a whole number of cents. Note that students who saw City Marathon 1 were
more likely to have a correct strategy but make a calculation error, although again the numbers here
are too small to claim that the difference is statistically significant. It would be interesting to repeat
the experiment with a larger sample size to see if these differences are real.
It is worth noting, however, that for all four versions, a large percentage of the students who
responded Shop A did so because the price of a 6-pack of bottles in Shop A was cheaper than the
price of a 9-pack of bottles in Shop B.
It is also worth noting that, in spite of the various revisions, it was still the case that a
common error was to respond that one should buy the fruit drink from Shop B because one got
more bottles in a pack at Shop B. In fact, for all four versions, among the students who responded
Shop B, this was by far the most common reason (62% for Individual Bottle, 68% for City
Marathon 1, 54% for Block Party, and 58% for City Marathon 2).
On a concluding note, we would like to point out that there is a subtle issue that is not
addressed by any of the alternative versions. It is often the case that the unit rate goes down when
purchases are made in bulk. None of the alternative versions specifically state that the unit rate in
each shop is constant (although it is strongly implied in the Individual Bottle version, which
stipulates that bottles are sold individually). As such, these tasks were not as tightly specified as
perhaps they should be. We could not think of a good way to convey that the unit rate is constant in
each shop without referring to it explicitly, which we did not want to do, as explained previously.
That said, this issue was also present in the original task (though perhaps to a slightly lesser extent).
In any event, this did not seem to be an issue for the students who took the pilot; all students who

26
used a unit strategy answered the first part correctly (except one student who did not answer the
first question but gave a correct argument as a response to the second question).
Paste
Paste was also a short task administered to Grade 7 students. The original task as
administered to the students is shown in Figure 3. The intent of the task was to assess students’
ability to apply proportional reasoning to qualitative arguments in situations in which the exact
numerical values might not be known. The student is presented with two bowls of paste made by
mixing flour and water. The student is not told either the ratio of flour to water in the paste or the
amount of paste in each bowl, although one bowl appears to contain more paste than the other. The
student is told that the two bowls contain paste of the same thickness, from which the student is to
conclude that the two bowls contain the same ratio of flour to water. One scoop of water is then
added to each bowl. The student is to conclude that the paste in the bowl with the larger amount of
paste will now be thicker.
Figure 3. Paste, original version.
Student performance on this task was poor. Analysis of student responses indicated three
possible causes unrelated to the construct being tested:
The original version did not allow students to respond that the two bowls of paste are
now equally thick; they had to commit themselves to choosing one of the bowls to be

27
thicker. Some of the more incoherent responses may well have been from students who
believed that the two bowls were now equally thick, but tried to formulate a response
that would match the choice they gave. The revised versions have an option for students
to respond that the paste in the two bowls will now be equally thick.
In the original version, the picture showed two bowls of the same size with different
amounts of paste in each. But the difference was not dramatic; some students who did
not look closely at the picture may not have noticed. In the revised versions, the picture
has been replaced with one that shows two bowls of different sizes, one much larger
than the other.
For several reasons, another source of confusion may have been the use of the word
thicker. Students could potentially have interpreted thicker as meaning the depth of the
paste in the bowl, students who have not made paste may not have understood what
thickness meant in this context, and the word could potentially be a problem for English
language learners. In the three revised versions that use paste, an explanation of what
makes paste thick was added.
We wrote four revised versions of this task. The first version was similar to the original
version with the three changes described above—the new option that the two bowls of paste are
equally thick, a different picture showing bowls of different sizes, and an explanation about that
thickness means in the context of paste. In an effort to determine the extent to which the context of
mixing paste from flour and water affected the results, we wrote a version that is exactly like the
first version except that paste is replaced with oatmeal, and instead of adding water to make the
paste less thick we add sugar to make the oatmeal sweeter. The third version was identical to the
first version except that the stem gives the exact amount of flour and water in the two bowls, to see
if the presence of numeric information would help students. Finally, the fourth version was the
same as the third version except that the question does not indicate how much water was added to
each bowl; it only says that the same amount of water was added to each bowl.
Analysis of results. Table 16 shows the frequency of the responses to the four revised
versions of Paste. Of particular interest is the fact that 46% of the students who saw Version 1
correctly identified the bowl with the thicker paste while 81% of the students who saw Version 2

28
correctly identified the bowl with the sweeter oatmeal ( 0.0001p ). This suggests that the context
of making paste by mixing flour and water contributed to the difficulty of this task, perhaps because
students were unfamiliar with making paste in this way. For both versions, very few students were
able to supply a correct explanation, but 69% of the students who were administered the second
version were able to give an at least partially-correct response, as opposed to 27% of the students
who were administered the first version ( 0.0001p ).
Table 16
Frequency of Responses to Paste
Response PS1 PS2 PS3 PS4
Bowl C 0.22 0.81* 0.12 0.15
Bowl D 0.46* 0.06 0.38* 0.45*
Equal 0.32 0.13 0.51 0.40
Total 1.00 1.00 1.00 1.00
N = 90 85 85 82
* Correct response
Explanation PS1 PS2 PS3 PS4 Total
Correct response 0.01 0.05 0.01 0.05 0.03
Partially-correct response 0.26 0.64 0.16 0.28 0.33
Incorrect response 0.43 0.15 0.61 0.48 0.42
Blank, uninterpretable, off-topic 0.30 0.16 0.21 0.19 0.22
Total 1.00 1.00 1.00 1.00 1.00
N = 90 86 85 83 344
We had thought that by specifying the original quantity of flour and water in each bowl,
students would find the task easier. This does not seem to have been the case—only 38% of the
students who were administered Version 3 correctly identified Bowl D as having the thicker
paste, as opposed to 46% of the students who were administered Version 1. Due to the small
sample size, this difference is not statistically significant ( 0.1435p ). However, substantially
more of the Version 3 students than the Version 1 students responded that the two bowls had
paste of the same thickness (51% vs. 32%; 0.0061p ). This suggests that adding the original

29
quantities of flour and water made students more likely to think that the two bowls of paste
would still have the same proportions after the same amount of water was added to each bowl.
The students’ responses to the explanation question do not necessarily show this (although they
do not dispute it, either). Of the 43 students who responded to Version 3 that the paste in the two
bowls was equally thick, only five provided an explanation that even mentioned the exact
amounts of flour and water in the original mixtures. Most of the students gave a response similar
to the following:
If they are already the same, adding 1 scoop of water to each will make both the same
This could just as well have been the response of a student who answered in Version 1 that
the paste in the two bowls was equally thick after the addition of one scoop of water to each. But it
seems that the presence of the actual amounts of flour and water in the bowls originally makes it
more likely that a student will make this argument.
Version 4 was the same as Version 3 except that the students were not told how much
water was added to the paste, just that the same amount of water was added to each bowl. This
version was easier than Version 3 for the students in the pilot, with 45% answering correctly,
approximately the same percentage of students who responded correctly to Version 1. As with the
Version 1 vs. Version 3 difference, this difference is not statistically significant ( 0.1628p ).
Students in our sample who saw Version 4 were less likely to think that the paste in the two bowls
had the same thickness after the addition of the water than the students who saw Version 3, but
were more likely than the students who saw Version 1. But none of these differences is statistically
significant.
It would seem reasonable to conjecture that students are more likely to think that the paste
in the two bowls has the same thickness after the addition of water when they know the exact
amounts of flour and water in the bowls originally and the amount of water added to each bowl,
less likely when they know the exact amounts of flour and water in the bowls originally but only
that the same amount of water is added to each bowl, and least likely to make this mistake when
they only know that the thickness of the paste in the two bowls is the same to begin with and that
the same amount of water is added to each bowl. But this experiment would need to be repeated
with a larger sample size to confirm this conjecture.
30
Bigfoot (1)
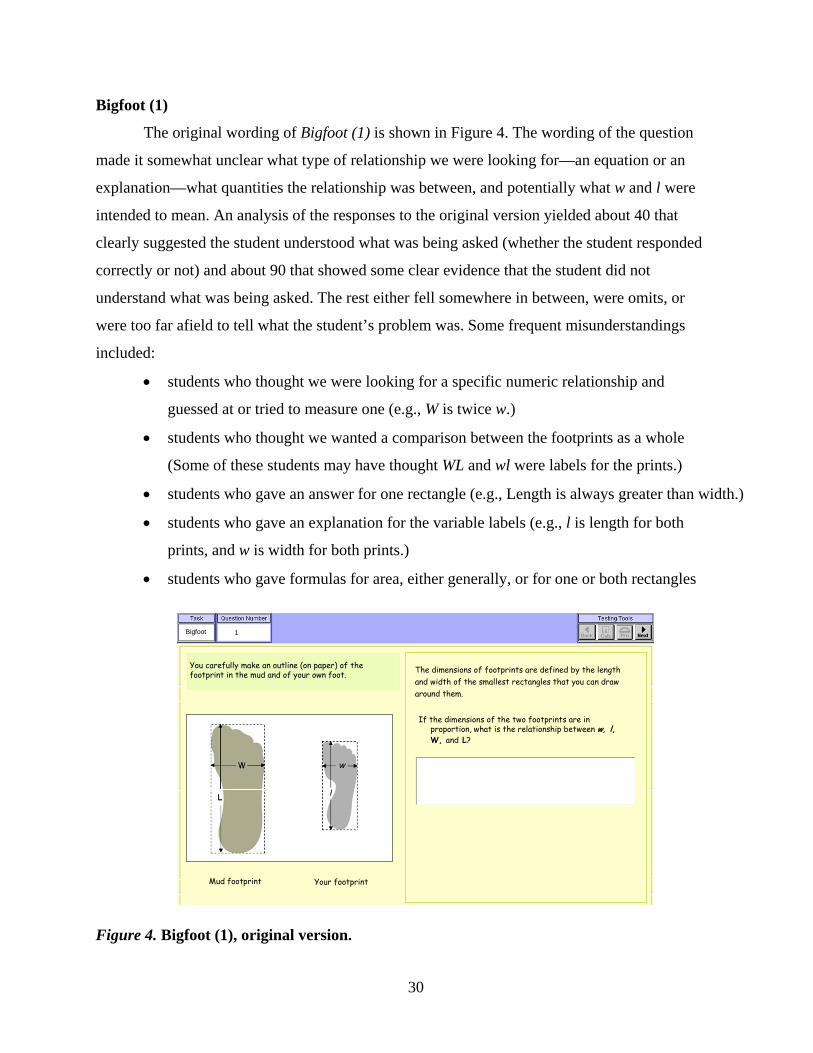
The original wording of Bigfoot (1) is shown in Figure 4. The wording of the question
made it somewhat unclear what type of relationship we were looking for—an equation or an
explanation—what quantities the relationship was between, and potentially what w and l were
intended to mean. An analysis of the responses to the original version yielded about 40 that
clearly suggested the student understood what was being asked (whether the student responded
correctly or not) and about 90 that showed some clear evidence that the student did not
understand what was being asked. The rest either fell somewhere in between, were omits, or
were too far afield to tell what the student’s problem was. Some frequent misunderstandings
included:
students who thought we were looking for a specific numeric relationship and
guessed at or tried to measure one (e.g., W is twice w.)
students who thought we wanted a comparison between the footprints as a whole
(Some of these students may have thought WL and wl were labels for the prints.)
students who gave an answer for one rectangle (e.g., Length is always greater than width.)
students who gave an explanation for the variable labels (e.g., l is length for both
prints, and w is width for both prints.)
students who gave formulas for area, either generally, or for one or both rectangles
1Bigfoot
You carefully make an outline (on paper) of the footprint in the mud and of your own foot. The dimensions of footprints are defined by the length
and width of the smallest rectangles that you can draw around them.
If the dimensions of the two footprints are in proportion, what is the relationship between w, l, W, and L?
Mud footprint Your footprint
Figure 4. Bigfoot (1), original version.

31
In an attempt to avoid these misunderstandings, the stimulus material on the left of the
screen was rewritten to make it clear that we were interested in the rectangle circumscribed around
the footprints, rather than the footprints themselves, and to clearly define W, L, w, and l. We also
replaced the somewhat ambiguous sans-serif italic l with the more customary script . The question
itself was split into two parts, one of which clearly directs students to give an equation, and the
other of which asks them to describe the relationship in a sentence. Both questions refer to “the
variables w, , W, and L” rather than simply “w, , W, and L”. The two questions were
counterbalanced for order in different versions. The versions were further subdivided, with half
using the mud footprint used in the original version and half using a new mud footprint that is
identical to “your” footprint except that it has been enlarged.
Thus there are four versions of the revised Bigfoot (1)—A1, A2, B1, and B2; see Table
17. In the A versions, the footprints are the same as in the original versions, while in the B
versions, the mud footprint is identical to the human footprint except for size. In the 1 versions
the equation question comes first, and in the 2 versions the explanation question comes first. The
four revised versions of Bigfoot (1) are in the appendix.
Table 17
Distribution of Variants for Bigfoot (1)
1 version: Equation first 2 version: Explanation first
A version: Original figures A1 A2
B version: Revised figures B1 B2
Analysis of results. The responses to the two questions in the Bigfoot (1) variants are
summarized in Table 18. Approximately 10% of the students answered the equation question
correctly. There was no significant difference between the A and the B groups (about 10% of
each group; see Table 19), or between the students who were asked the equation question first
and those who were asked the explanation question first (9% vs. 11%).

32
Table 18
Summary of Responses to Bigfoot (1) Variants
Equation item A1 A2 B1 B2 Total
Correct or equivalent equation 0.08 0.12 0.09 0.11 0.10
WL w= 0.14 0.11 0.10 0.07 0.11
Other incorrect equation 0.20 0.19 0.34 0.34 0.27
Any variable expression 0.42 0.34 0.37 0.26 0.35
Other incorrect response 0.11 0.14 0.08 0.14 0.12
No response 0.05 0.10 0.02 0.08 0.06
Total 1.00 1.00 1.00 1.00 1.00
N = 85 83 89 85 342
Explanation item A1 A2 B1 B2 Total
Correct explanation 0.04 0.00 0.06 0.04 0.03
Explanation that specifies W = width and/or L = length 0.22 0.46 0.33 0.36 0.34
Other incorrect explanation 0.68 0.48 0.56 0.55 0.57
No response 0.06 0.06 0.06 0.05 0.06
Total 1.00 1.00 1.00 1.00 1.00
N = 85 83 88 85 341
Table 19
Summary of Responses to Bigfoot (1) by Version
Equation item A B 1 2
Correct or equivalent equation 0.10 0.10 0.09 0.11
WL w= 0.13 0.09 0.12 0.09
Other incorrect equation 0.20 0.34 0.27 0.27
Any variable expression 0.38 0.32 0.40 0.30
Other incorrect response 0.13 0.11 0.09 0.14
No response 0.07 0.05 0.03 0.09
Total 1.00 1.00 1.00 1.00
N = 168 174 174 168
Explanation item A B 1 2
Correct explanation 0.02 0.05 0.05 0.02
Explanation that specifies W = width or L = length 0.34 0.35 0.28 0.41
Other incorrect explanation 0.58 0.55 0.62 0.52
No response 0.06 0.05 0.06 0.05
Total 1.00 1.00 1.00 1.00
N = 168 173 173 168

33
For the most part, the common misconceptions that were present in the responses to the
original version (when those responses were equations) were not evident in the responses to the
equation question on the revised versions. The only common incorrect response was to equate
the products instead of the quotients (WL w instead of W L w ); about 11% of the
responses contained this error. Again there was no significant difference between students who
were administered the A version and students who were administered the B version (13% vs.
9%) or between students who were asked the equation question first and students who were
asked the equation question second (12% vs. 9%).
Approximately 27% of the students responded with an incorrect equation other than
WL w , although no single equation appeared with any frequency among these responses.
Whether students were asked the equation question first or second did not seem to matter, but
students who were administered the B versions of the questions were far more likely to fall into
this category than students who were administered the A versions (34% vs. 20%; 0.0013p ).
The reason for this may be that, more generally, students who were administered the B version,
with its human-like mud footprint, were more likely to respond with an equation of some sort
than were the students who were administered the A version, with its large, nonhuman mud
footprint (52% vs. 42%; 0.0309p ), while the two groups were equally likely to respond with
the correct equation and were more-or-less equally likely to respond with the incorrect equation
WL w= ; see Table 20. It is not clear why students who saw the A version of the mud footprint
were less likely to give an equation as a response than were the students who saw the B version.
More research is needed on this point.
Table 20
Students who Did or Did Not Respond with an Equation by Version
Equation Item A version B version
Students who responded with an equation 0.42 0.52
Students who did not respond with an equation 0.58 0.48
Total 1.00 1.00
N = 168 174
About 35% of the students gave an expression instead of an equation. Students who were
asked the equation question first were more likely to make this error (40% vs. 30%; 0.266p ),

34
suggesting that students were aided by being required to describe the relationship in words
before attempting to express that relationship in an equation.
Very few students were able to give a correct explanation—only about 3%. About 34%
gave an response that merely explained what one or more of the variables W, L, w, or
represented. Whether the students saw the version A or the version B footprint was not relevant
here, but students who were asked the explanation question first were more likely to make this
mistake (41% to 28%; 0.0045p ). This may be the converse reaction to what we saw with the
equation question; students who were first asked to write an equation were less likely to give an
explanation that merely stated what the variables represented.
Bigfoot (2)
The original wording of Bigfoot (2) is shown in Figure 5. There were two main problems
with this task. The problem most transparent from the data collected on the item had to do with the
pictures used. Of the 233 responses, 51 responses made references to the arch, the heel, or the
shape of the toes in the response to part d. (All but one of these responses included incorrect
responses to parts b and c.) In addition, there was a large number of responses (probably at least as
many) in which the students said something along the lines of having “looked at it”, without being
more explicit. Students who were using the more familiar, technical definition of similar, rather
than the one given with the task, were focusing on aspects of shape other than what was intended.
2Bigfoot
a. Fill out the table about the three footprints. Round to two decimal places.
Mud footprint
Your footprint
Yourfriend’s footprint
You measure three footprints.
Decimal
Fraction 4
10.5
3.4
9.25
7.5
17.5
Friend’sYoursMud
w
l
b. Are your footprint and your friend’s footprint a similar shape?
Yes No
c. Are your footprint and the footprint in the mud a similar shape?
Yes No
When their ratios, , are approximately the same, we say two footprints have a similar shape.
wl
d. How did you decide whether they were similar shapes?
Figure 5. Bigfoot (2), original version.

35
The second problem with the task was that students were expected to develop and apply their
own rules and definitions, without ever being explicitly told what they needed to be doing; e.g.,
approximately was never quantified. It would be possible to develop the task along these lines with
appropriate scaffolding, but this was a revision that was outside the scope of the current project.
Our solution was to change the question so that students were explicitly asked to identify
which two footprints have the closest ratios, eliminating the table at the beginning of the question.
We made the question a two-part item—the first part was to select the appropriate pair and the
second part was to explain how the student found the answer to the first part. This revision
eliminated both problems. We also replaced the friend’s footprint with a baby’s footprint. This
eliminated responses based solely on size. As with Bigfoot (1), there were two versions of the task
that used two different sets of footprints. The A version used the mud footprint and “your” footprint
from the original task; the B version used the same picture for all three prints, but stretched or
shrunk so that the sizes of the footprints were the same as those in the A version, making all
irrelevant features of the footprints largely the same.
We also subdivided each version by creating two versions of the prompt for the first
question, a shorter version:
For which two footprints are the ratios of the length to the width of the rectangles closest?
and a longer version:
Consider the ratio of the length to the width for each of these rectangles. For which two footprints are the ratios closest to each other?
So, as with Bigfoot (1), there are four versions of the revised Bigfoot (2); see Table 21.
Table 21
Distribution of Variants for Bigfoot (2)
“1” version: Short prompt “2” version” Long prompt
“A” version: Original figures A1
B1
A2
“B” version: Revised figures B2
These four versions are in the appendix.
Of course, these revisions substantially altered the construct being tested by the item.
Whereas the original item was primarily concerned with students’ ability to develop and apply

36
rules, the new item was focused instead on their ability to calculate and compare ratios, and to a
lesser extent on their ability to recognize that features such as size and toe and arch shape are
irrelevant to determining ratios. As explained above, however, maintaining the original intention
of the question would have required lengthy revisions that were out of the scope of this project,
and the revised versions still allowed us to test the concept we were most interested in, which
was the degree to which the pictures used affect the responses.
Analysis of results. The responses to the two questions in the Bigfoot (2) variants are
summarized in Table 22. About 56% of the examinees correctly identified the two footprints
with the closest ratios, while 37% identified the mud footprint and “your” footprint as the two
with the closest ratios. Only 4% identified the mud footprint and the baby’s footprint as the two
with the closest ratios. It is worth noting that, of the students who saw the A version of the mud
footprint, 60% responded correctly that the baby’s footprint and “your” footprint were the two
with the closest ratios and 33% responded that the mud footprint and “your” footprint were the
two with the closest ratio, while, of the students who saw the B version of the mud footprint,
53% responded correctly and 41% responded incorrectly. (See Table 23.) Due to the small
sample size, these differences may not be significant ( 0.0877p = and 0.0757p = ). But they
suggest the possibility that students may have been influenced by the shape of the mud footprint.
In our sample of students, those who saw a mud footprint that was shaped like a human footprint
were more likely to select the mud footprint as being the footprint closest to “your” footprint,
while those students who saw the mud footprint that was shaped differently from a human
footprint were more likely to select the baby footprint. Of course, these data are confounded by
the fact that the baby footprint is the correct answer. In a future research project, a redesigned
experiment (without this confounding factor) could be run with a larger sample.
There was no significant difference in responses between the students who saw the short
version of the prompt and those who saw the long version. Of the students who saw the short
version, 55% responded correctly, 37% responded that the mud footprint and “your” footprint
had the closest ratio, and 5% responded that the mud footprint and the baby’s footprint had the
closest ratio. For the students who saw the long version, the percentages were 58%, 37%, and
3%.

37
Table 22
Summary of Responses for Bigfoot (2) Variants
Response A1 A2 B1 B2 Total No response 0.02 0.04 0.03 0.01 0.03 Mud footprint and “your” footprint 0.35 0.32 0.39 0.43 0.37 “Your” footprint and baby’s footprint 0.59 0.61 0.52 0.54 0.56 Baby's footprint and mud footprint 0.04 0.04 0.06 0.02 0.04 Total 1.00 1.00 1.00 1.00 1.00 N = 83 85 87 87 342
Explanation A1 A2 B1 B2 Total Correct explanation 0.01 0.00 0.01 0.00 0.01 Correct reasoning with calculation or other error 0.01 0.00 0.02 0.01 0.01 Comparison of lengths and/or widths 0.33 0.28 0.22 0.31 0.28 Visual strategy 0.22 0.26 0.16 0.16 0.20 Other incorrect response 0.40 0.41 0.53 0.44 0.44 No response 0.04 0.05 0.06 0.08 0.06 Total 1.00 1.00 1.00 1.00 1.00 N = 83 85 87 87 342
Table 23
Summary of Responses to Bigfoot (2) by Version
Response Version A Version B Version 1 Version 2
No response 0.03 0.02 0.03 0.02
Mud footprint and “your” footprint 0.33 0.41 0.37 0.37
“Your” footprint and baby’s footprint 0.60 0.53 0.55 0.58
Baby's footprint and mud footprint 0.04 0.04 0.05 0.03
Total 1.00 1.00 1.00 1.00
N = 168 174 170 172
Explanation Version A Version B Version 1 Version 2
Correct explanation 0.01 0.01 0.01 0.00
Correct reasoning with calculation or other error 0.01 0.02 0.02 0.01
Comparison of lengths and/or widths 0.30 0.26 0.27 0.30
Visual strategy 0.24 0.16 0.19 0.21
Other incorrect response 0.40 0.48 0.46 0.42
No response 0.04 0.07 0.05 0.06
Total 1.00 1.00 1.00 1.00
N = 168 174 170 172

38
Only about 1% of the examinees gave a correct explanation and another 1% gave an
explanation with correct reasoning but with a calculation error. The most common incorrect
response was to compare the lengths and/or widths of the rectangles; 28% of the students made
some form of this error. There was not much difference between those students who saw the
version A mud footprint and those who saw the version B footprint—30% vs. 26%
Approximately 20% of the students attempted to use some sort of visual strategy, such as
saying that the two footprints “looked similar” or “were about the same size”. There was a
significant difference here between the A group and the B group—of the students who saw the
version A footprint, 24% attempted to use a visual strategy, while of those who saw the version B
footprint, only 16% attempted to use a visual strategy ( 0.0366p ). Moreover, of the 20% of
students who responded with a visual strategy, 69% had selected the mud footprint and “your”
footprint as the two with the closest ratios (see Table 24). These results suggest that one of the
problems with the original version of Bigfoot (2)—that students attempted to use a visual strategy—
persisted in the revisions.
Table 24
Responses to Explanation Question by Previous Response
Explanation Mud & your Your & baby Baby & mud
Correct explanation 0.00 1.00 0.00
Correct reasoning with calculation or other error 0.50 0.50 0.00
Comparison of lengths and/or widths 0.29 0.68 0.02
Visual strategy 0.69 0.24 0.06
Other incorrect response 0.31 0.63 0.05
No response 0.16 0.63 0.00
Total 0.37 0.56 0.04
N = 127 193 13
Forest Carbon
Forest Carbon was an extended task delivered as part of the fall PAA for Grade 8. For our
revisions, we focused on one question, Forest Carbon 3. The original question is shown in Figure
6. This was a difficult question for students, probably for a number of reasons. The competencies
associated with this task include Use (create) and interpret data displays and Understand and
operate with rational numbers. Part a was designed to assess only the first competency, while part

39
b was designed to address both. It also appears that a goal of this question was to assess students’
capacity to identify and use relevant information across representations.
Figure 6. Forest Carbon, original version.
The question also required a number of other skills, not all of which may be construct
relevant. First, the student must be highly observant. The two graphs convey different
information—the graph on the left refers to total land area, while the graph on the right refers to
forest land area only. In part b, students who overlooked the words “total land area” might have
answered the question just by reading the graph on the right (most students did this). Students who
overlooked the words forest land in part b might have calculated the percentage based on the figure
at left (which other students did, though fewer). This may have occurred because earlier questions
in the task involved trends in forest land. This is speculation, however; it is not clear from the
student responses to what extent these errors are due to the students overlooking important
information, to their having a more general reading comprehension problem, or to their lack of
understanding of the mathematics. Note that part b required a high degree of verbal sophistication
to parse, even if the student did note that the chart on the left refers to total land area and the chart
on the right refers to forest land area only.
Total land area of United States in 2002 (by region)
Use the data represented above to answer these questions:
a. Which region of the US had the most forest land in 2002? West South North
b. In which region of the US was the smallest percentage of the total land area forest land in 2002?West South North Show your work.
413 million acresNorth
535 million acresSouth
1,315 million acresWest
413 million acresNorth
535 million acresSouth
1,315 million acresWest
The table below shows the total land area of the USA by region as illustrated in the map. The line graph shows the trends in forest lands in each of those regions from 1907 through 2002.
Forest Carbon 3
100
150
200
250
300
350
400
1900 1920 1940 1960 1980 2000
North South West
Year
Am
oun
t of
For
est (
Mill
ion
Acr
es)
Forest Land Trends in Regions in US
100
150
200
250
300
350
400
100
150
200
250
300
350
400
1900 1920 1940 1960 1980 2000
North South West
North South West
Year
Am
oun
t of
For
est (
Mill
ion
Acr
es)
Forest Land Trends in Regions in US
40
Modifications to Forest Carbon. We revised Forest Carbon with the goal of reducing the
difficulties students would have with the question due to their overlooking important information
or to their difficulties with reading comprehension while still assessing the target competencies.
For example, the question was rewritten to make it very clear, in both the charts and the prompts,
when total land area was being referred to and when forest land only was being referred to. This
was accomplished by some rewording and underlining. The prompt in part b was rewritten to make
it more direct. Note that while part b referred to a percentage, answering part b correctly did not
require that the student consider percentage per se. It seemed more direct to ask the student to
consider the ratio of forest land area to total area, and to leave it to the student to decide whether to
calculate the ratio as a fraction, a decimal, or a percentage. Although finding a percentage was not
specifically identified as a target competency, this may be due to the fact that the competencies are
specified at a high grain size. It is also possible that the term percentage was used because the
vocabulary term might be better understood than the vocabulary term ratio, but this is just
conjecture. All things considered, we decided to use the term ratio, and we used coverage of the
term as part of the participation screening questionnaire.
The chart on the right of the screen and the table on the left contain all the information
needed to answer the question. In other words, the chart on the left of the screen was unnecessary.
It did, however, provide a potentially useful visual that may have helped students understand the
question. Since the chart was disconnected from the information in the table, however, this may
have been more distracting than helpful. Furthermore, a table is not really needed to present such a
small amount of data. Chandler and Sweller (1992) recommended integrating information about a
diagram into the diagram itself in order to minimize cognitive load. In this question, the table can
be eliminated by labeling the regions with the appropriate numbers. The units can be specified in
parentheses in the title of the chart or in each region.
In the chart on the right of the screen, a line graph was used to express trend data. But to
answer the question, the student only needed to consider data for the year 2002. It may be that part
of the intent in presenting a line graph was for continuity (earlier questions asked about trends) or
to see if students could ignore data that was not relevant to answering the question. Although the
graph in this question is a trend graph, it is different from the graphs in the questions that preceded
it. This graph was referred to again later in the task, but another graph could be substituted at that
point. So it did not appear essential to keep the graph in this question for continuity reasons.
41
Although the trend graph does present data that is not needed (for years other than 2002), part b
would have been answered the same way regardless of which year was considered. Thus it is not
clear from a student’s response whether the student considered the correct year or some other year.
So while it may be important to assess whether a student can ignore irrelevant information, we
would suggest that these data are not suitable for eliciting that evidence. For all of these reasons,
we decided to simplify the graph so that it presented data only for 2002, and to present the data in a
bar chart. The question still assessed whether the student could integrate information across
representations, albeit different representations from those in the original task.
As a result of the issues raised above, we made a number of editorial revisions to Forest
Carbon, the most notable of which are the following:
1. The chart titles and prompts were rewritten and/or parts were underlined to emphasize
the distinction between total land and forest land.
2. The prompt in part b was rewritten to refer to a ratio rather than a percentage.
3. On the left, the numbers in the table were moved to the corresponding regions of the
chart.
4. The line graph on the right was replaced with a bar graph showing data for 2002 only.
The new bar graph has a bar for each region, and the colors of the bars correspond to the
colors of the regions of the chart on the left. This was done to facilitate consolidating the
information presented in the two charts.
Alternative Versions of Forest Carbon. We made four revised versions of Forest Carbon.
These four versions are in the appendix. The first version (labeled FC4) contains all the revisions
discussed in the previous section as well as some other minor wording changes. This version still
has much in common with the original question. In this version, the numbers were moved from the
table to the corresponding regions of the chart, and the units are given in parentheses after the chart
title. All of the alternate versions, with one exception, use this approach.
Forest Carbon presents a lot of information on its one screen, even after the above
revisions. Because of this, we developed alternate versions of the question that split the
information into a familiarization screen and a prompt screen. The graphs are included on both
screens for reference. The version labeled FC1 in the appendix shows how this was

42
accomplished. On the first screen, the student is asked to become familiarized with the charts and
the information the charts provide, and then to answer a very basic question involving the
difference between the two charts. The purpose of this question was not to assess mathematical
competency; rather, it was to encourage students to attend to the differences between the two
charts and to provide evidence of whether the familiarization screen had served its intended
purpose—to slow students down, so that they fully understand the question. Polya’s (1957)
mathematical problem stages emphasize the importance of first understanding the question.
Providing a familiarization screen containing a question may provide greater opportunity for
students to absorb the information presented on the screen (including the distinction between the
two charts) before they launch into answering the original questions (shown on the next screen).
The responses to the familiarization question reveal whether students correctly interpreted the
distinction between the two charts. To the extent that performance on the familiarization question
was above chance and the performance of the following questions was higher than in other
alternate versions, it would suggest that the familiarization screen served its intended purpose.
Apart from the familiarization screen, the questions in FC1 are identical to those in FC4.
It had been predicted that for the chart on the left of the screen, moving the numbers from
the table to the corresponding regions would reduce cognitive load and facilitate interpretation.
Since the units appear in a parenthetical expression in the title, however, students must still
consolidate the information in the title with the information in the regions of the chart. It was
suggested that while this approach is standard for older students, it may be too difficult for
middle school students. An alternative approach is to label the units in each region. This
approach was taken in FC2. The questions in this version are otherwise identical to those in FC1.
Even with revision and a familiarization screen, we expected Forest Carbon to still be a
relatively difficult question. It is important to know whether students can answer questions at this
level of difficulty. But it would also be interesting to know whether students (perhaps students at
an earlier developmental stage) can answer a version of Forest Carbon that includes scaffolding
support. In the unscaffolded versions of Forest Carbon, the student must make a big mental leap
between parts a and b. The final alternate version (FC3) included two additional parts designed
to help the student answer the prompt in part d (part b in the unscaffolded versions). It might
sometimes be worthwhile to include scaffolding, either on the PAA, on formative tasks, or both.
One way to accomplish this would be to administer pairs of tasks that are otherwise the same
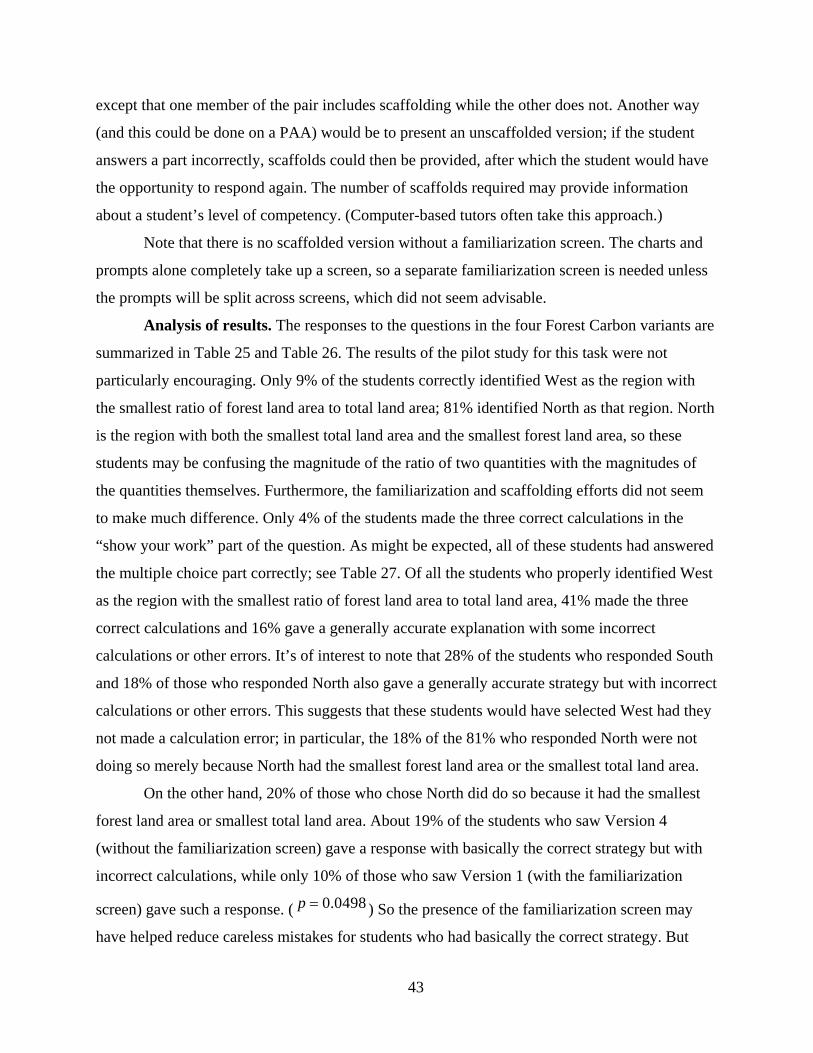
43
except that one member of the pair includes scaffolding while the other does not. Another way
(and this could be done on a PAA) would be to present an unscaffolded version; if the student
answers a part incorrectly, scaffolds could then be provided, after which the student would have
the opportunity to respond again. The number of scaffolds required may provide information
about a student’s level of competency. (Computer-based tutors often take this approach.)
Note that there is no scaffolded version without a familiarization screen. The charts and
prompts alone completely take up a screen, so a separate familiarization screen is needed unless
the prompts will be split across screens, which did not seem advisable.
Analysis of results. The responses to the questions in the four Forest Carbon variants are
summarized in Table 25 and Table 26. The results of the pilot study for this task were not
particularly encouraging. Only 9% of the students correctly identified West as the region with
the smallest ratio of forest land area to total land area; 81% identified North as that region. North
is the region with both the smallest total land area and the smallest forest land area, so these
students may be confusing the magnitude of the ratio of two quantities with the magnitudes of
the quantities themselves. Furthermore, the familiarization and scaffolding efforts did not seem
to make much difference. Only 4% of the students made the three correct calculations in the
“show your work” part of the question. As might be expected, all of these students had answered
the multiple choice part correctly; see Table 27. Of all the students who properly identified West
as the region with the smallest ratio of forest land area to total land area, 41% made the three
correct calculations and 16% gave a generally accurate explanation with some incorrect
calculations or other errors. It’s of interest to note that 28% of the students who responded South
and 18% of those who responded North also gave a generally accurate strategy but with incorrect
calculations or other errors. This suggests that these students would have selected West had they
not made a calculation error; in particular, the 18% of the 81% who responded North were not
doing so merely because North had the smallest forest land area or the smallest total land area.
On the other hand, 20% of those who chose North did do so because it had the smallest
forest land area or smallest total land area. About 19% of the students who saw Version 4
(without the familiarization screen) gave a response with basically the correct strategy but with
incorrect calculations, while only 10% of those who saw Version 1 (with the familiarization
screen) gave such a response. ( 0.0498p ) So the presence of the familiarization screen may
have helped reduce careless mistakes for students who had basically the correct strategy. But

44
28% of the students who saw the scaffolded version (FC3) gave this sort of response (
0.0015p ), suggesting that the scaffolding may have confused some students who had a
general understanding of the basic concepts.
Table 25
Summary of Responses to Forest Carbon Variants (first part)
Which chart shows forest land area only? FC1 FC2 FC3 TotalNo response 0.01 0.01 0.00 0.01 Chart 1 0.07 0.15 0.05 0.09 Chart 2 0.92 0.84 0.95 0.90 Total 1.00 1.00 1.00 1.00 N = 87 85 87 259 Which region of the US had the most total land? FC3 TotalNo response 0.00 0.00 West 0.99 0.99 South 0.01 0.01 North 0.00 0.00 Total 1.00 1.00 N = 87 87 Which region of the US had the most forest land? FC1 FC2 FC3 FC4 TotalNo response 0.00 0.00 0.01 0.01 0.01 West 0.97 0.99 0.94 0.96 0.96 South 0.03 0.00 0.05 0.02 0.03 North 0.00 0.01 0.00 0.00 0.00 Total 1.00 1.00 1.00 1.00 1.00 N = 87 85 87 83 342 Calculate the ratio of forest land area to total land area for North FC3 TotalCorrect calculation 0.00 0.00 Correct strategy, but incorrect calculations 0.24 0.24 Adds, subtracts, or multiplies the corresponding values from the two charts 0.09 0.09 Other incorrect response 0.54 0.54 No response 0.13 0.13 Total 1.00 1.00 N = 87 87
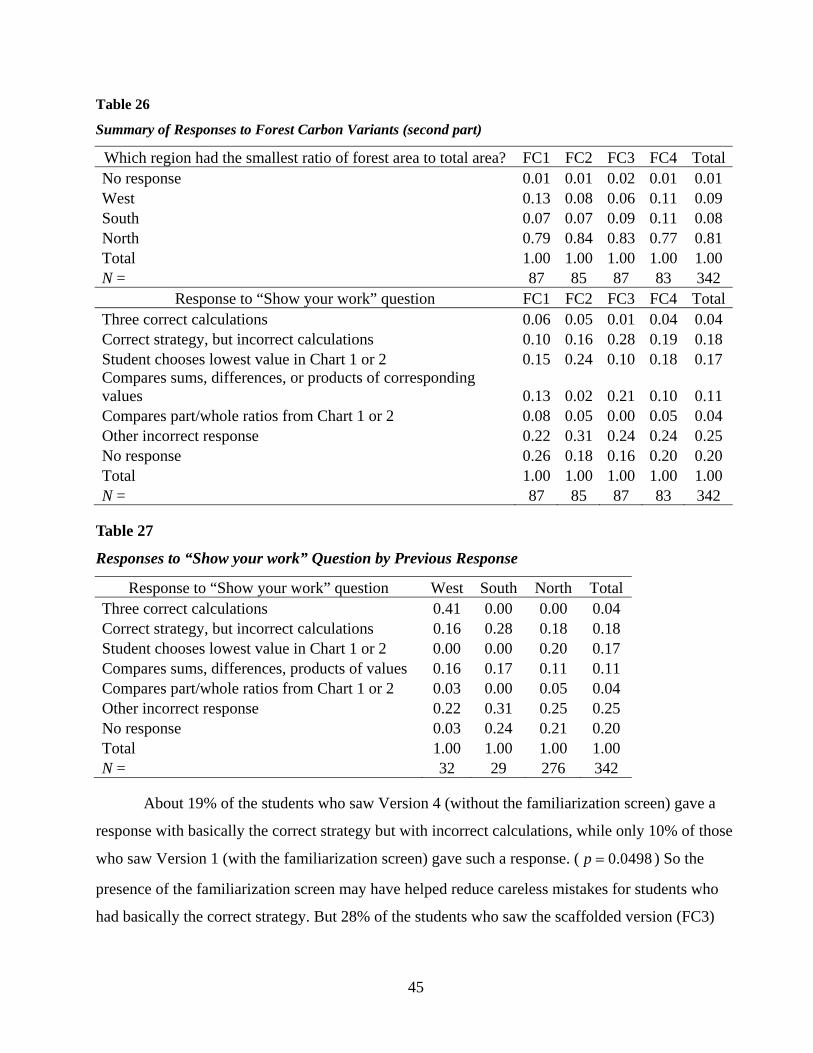
45
Table 26
Summary of Responses to Forest Carbon Variants (second part)
Which region had the smallest ratio of forest area to total area? FC1 FC2 FC3 FC4 TotalNo response 0.01 0.01 0.02 0.01 0.01 West 0.13 0.08 0.06 0.11 0.09 South 0.07 0.07 0.09 0.11 0.08 North 0.79 0.84 0.83 0.77 0.81 Total 1.00 1.00 1.00 1.00 1.00 N = 87 85 87 83 342
Response to “Show your work” question FC1 FC2 FC3 FC4 TotalThree correct calculations 0.06 0.05 0.01 0.04 0.04 Correct strategy, but incorrect calculations 0.10 0.16 0.28 0.19 0.18 Student chooses lowest value in Chart 1 or 2 0.15 0.24 0.10 0.18 0.17 Compares sums, differences, or products of corresponding values 0.13 0.02 0.21 0.10 0.11 Compares part/whole ratios from Chart 1 or 2 0.08 0.05 0.00 0.05 0.04 Other incorrect response 0.22 0.31 0.24 0.24 0.25 No response 0.26 0.18 0.16 0.20 0.20 Total 1.00 1.00 1.00 1.00 1.00 N = 87 85 87 83 342
Table 27
Responses to “Show your work” Question by Previous Response
Response to “Show your work” question West South North Total Three correct calculations 0.41 0.00 0.00 0.04 Correct strategy, but incorrect calculations 0.16 0.28 0.18 0.18 Student chooses lowest value in Chart 1 or 2 0.00 0.00 0.20 0.17 Compares sums, differences, products of values 0.16 0.17 0.11 0.11 Compares part/whole ratios from Chart 1 or 2 0.03 0.00 0.05 0.04 Other incorrect response 0.22 0.31 0.25 0.25 No response 0.03 0.24 0.21 0.20 Total 1.00 1.00 1.00 1.00 N = 32 29 276 342
About 19% of the students who saw Version 4 (without the familiarization screen) gave a
response with basically the correct strategy but with incorrect calculations, while only 10% of those
who saw Version 1 (with the familiarization screen) gave such a response. ( 0.0498p ) So the
presence of the familiarization screen may have helped reduce careless mistakes for students who
had basically the correct strategy. But 28% of the students who saw the scaffolded version (FC3)
46
gave this sort of response ( 0.0015p ), suggesting that the scaffolding may have confused some
students who had a general understanding of the basic concepts.
On the other hand, scaffolding may have contributed to the reduction of the number of
students who simply looked to see which region had the smallest total land area or smallest forest
land area (10% among those students who saw FC3 vs. 15% among those who saw FC1). But the
alternative labels in FC2 seem to have contributed to an increase in the number of students who
made this mistake (24% among those students who saw FC2 vs. 15% who saw FC1). Perhaps the
presence of the labels on the graphic in Chart 1 led students to just look at those numbers instead
of the appropriate ratios. However, for both of these comparisons, due to the small sample size, the
difference may not be significant ( 0.1802p = and 0.0756p = ).
While the scaffolding may have decreased the likelihood that a student would just choose
the lowest value on one of the charts, it seems to have increased the likelihood that a student would
compare sums, difference, or products of corresponding values instead of ratios of corresponding
values. Approximately 21% of the students who saw the scaffolded version made this error, while
only 10% of the students who saw the basic version (FC4) made this error ( 0.207p ).
Finally, scaffolding does seem to have reduced the number of students who did not respond
(16% of the students who saw FC3 vs. 26% who saw FC1; 0.0464p ).
Summary and Conclusions
Six questions were selected, drawn from mathematics tasks piloted as part of the CBAL
program—three Grade 7 tasks and three Grade 8 tasks. These questions were selected because
student responses indicated that there may have been non-construct-related issues influencing
student performance. Between two and four revisions of each task were created and piloted to
determine if the non-construct-related issues could be removed without affecting the construct-
related skills and abilities that the questions were designed to measure.
Each question constituted a separate experiment, so the analysis that was conducted on the
responses to the revisions differed from one question to another. For Mix It Up, we created two
nonparallel versions. Version 1 was intended to preserve the difficulty of the original version but
remove the ambiguities present in the language of the original version. Version 2 was intended to
be an easier item that measured the same skills and abilities as the original version. For the most
part, we seem to have achieved our goals with this question.
47
The original version of Fruit Drink used language that was intended to avoid suggesting a
unit price strategy for solving the problem. Unfortunately, the language caused some ambiguities
due to alternative interpretations by some students. We created four versions of Fruit Drink,
carefully varying different aspects of the language, removing ambiguities while still attempting to
avoid suggesting a unit price strategy. There were some suggestive differences in performance on
the various versions, but the number of students was too small for the differences to be statistically
significant. In any event, it seems certain that, for all four versions, the unit price strategy was the
most common strategy among the students who answered the question correctly. There were still
some common misconceptions, however. One was that the package of 6 bottles of fruit drink for
$1.50 is preferred to the package of 9 bottles for $2.35 (or $2.34) because the cost of the package
is less; another is that the package of 9 bottles is preferred because one gets more bottles.
Paste was designed to assess students’ ability to apply proportional reasoning to qualitative
arguments in situations in which the exact numerical values might not be known. The original task
had to do with mixing flour and water in various ratios to make paste. As with Fruit Drink, we
created four revised versions of Paste, varying different aspects of the task while holding other
aspects the same. Version 1 was similar to the original task with certain improvements designed to
avoid some of the difficulties with the original. Version 2 was identical with Version 1 except that
the context was changed from mixing paste to sweetening oatmeal. Version 3 returned to the paste
context of Version 1 but added the exact quantities of flour and water. Version 4 was the same as
Version 3 except that some of the exact amounts were removed.
It is clear from our results that the context of the problem contributed to its difficulty.
When the context was changed from making paste to adding sugar to oatmeal, the task became
considerably easier. We had thought that adding the exact amounts of flour and water to be mixed
would make the task easier, but this does not seem to have been the case. However, adding the
exact amounts did make it more likely that a student would erroneously conclude that if a large
bowl of paste and a small bowl of paste are equally thick, then after adding the same amount of
water to each bowl they will still be equally thick.
Two Bigfoot questions were selected for revision. Part of the purpose of the Bigfoot task
was to assess students’ ability to develop and apply their own rules and definitions and to use them
to apply appropriate models to real-world situations. But the students found the task too confusing
and not sufficiently directed. The task could have been revised along the original lines with

48
appropriate scaffolding, but such a revision would have been outside the scope of this project. So
we rewrote two of the Bigfoot questions. In doing so, we altered the construct being tested, but the
revised versions still allowed us to test the extent to which the pictures used affect the responses.
For both questions, we created two versions, one with the original, nonhuman mud footprint, and
one with a human-like mud footprint. There were several situations in which there was a
significant difference between the performances of the two versions. For example, students who
saw the nonhuman mud footprint were more likely to employ a visual strategy instead of a
computational one (even though the computations were the same for both versions).
In Bigfoot (1), we asked students to write an equation describing the relationship between
four proportional variables and also to write an explanation of the relationship. For this question, in
addition to varying the footprints, we varied the order in which we asked for an equation and an
explanation. A common error for the equation question was to provide a mathematical expression
instead of an equation. Students who were asked the equation question first were more likely to
make this error than were students who were asked the explanation question first, suggesting that
students were aided by being required to describe the relationship in words before attempting to
express that relationship in an equation.
Four versions of Forest Carbon were prepared. In all four versions, the language was
modified to remove difficulties that were not related to the construct. Three of the four versions
added a familiarization screen to reduce the amount of information presented on a single screen.
One of those three versions added some scaffolding to see if that improved student performance on
what was still a difficult item. Another of the three versions with the familiarization screen
modified some of the graphic labels to reduce the cognitive load and to facilitate interpretation.
Our results with Forest Carbon were inconclusive. The familiarization screens and the
scaffolding did not seem to have much effect on student performance, though the data suggest that
more students might have responded correctly had they not made calculation errors. Students who
saw one of the versions with the familiarization screen were less likely to make calculation errors
than were students who saw the version without the familiarization screen, so the familiarization
screen, with less information on a single screen, may have helped reduce careless mistakes. But the
students who saw the scaffolded version were more likely to make calculation errors, suggesting
that the scaffolding may have confused some students who had a general understanding of the

49
basic concepts. Students who saw the scaffolded version were also more likely to make certain
types of conceptual errors. On the other hand, they were less likely to not respond.
In conclusion, we were able to craft versions of the tasks that removed difficulties and
ambiguities not related to the construct, while generally preserving, for the population on which
they were piloted, the construct-related difficulty and preserving the skills and abilities that the
tasks were originally designed to measure. When we created parallel versions to test the
performance of the items with alternative features, our results were less conclusive. In some cases,
we found real differences in how the alternative versions performed. In other cases, while the
results were suggestive, the number of students was too small for the differences to be statistically
significant. These parts of the project must be retested with a larger sample of students for us to be
certain that the differences are real.

50
References
Ahmed, A., & Pollitt, A. (2007). Improving the quality of contextualized questions: An
experimental investigation of focus. Assessment in Education, 14(2), 201–232.
Bennett, R. E., & Gitomer, D. H. (2009). Transforming K-12 assessment: Integrating accountability
testing, formative assessment, and professional support. In C. Wyatt-Smith, & J. Cumming
(Eds.), Educational assessment in the 21st century (pp. 43–61). New York, NY: Springer.
Chandler, P., & Sweller, J. (1992). The split-attention effect as a factor in the design of instruction.
British Journal of Educational Psychology , 62(2), 233–246.
Graf, E. A., Harris, K., Marquez, E., Fife, J., & Redman, M. (2009). Cognitively Based Assessment
of, for, and as Learning (CBAL) in Mathematics: A design and first steps toward
implementation (ETS Research Memorandum No. RM-09-07). Princeton, NJ: ETS.
Haberstroh, J., Harris, K., Bauer, M., Marquez, L., & Graf, A. (2010). CBAL Mathematics final
report 2009 for the summative and formative assessment projects. Princeton, NJ: ETS.
Marshall, S. P. (1995). Some suggestions for alternative assessments. In S. F. Chipman, & P. D.
Nichols, Cognitively diagnostic assessment (pp. 431–453). Hillsdale, NJ: Lawrence
Erlbaum Associates.
Polya, G. (1957). How to solve it. New York, NY: Doubleday.

51
Appendix A
Revised Items
Mix It Up
Figure A1. Mix It Up - Version 1
Figure A2. Mix It Up - Version 2.
Test Section Question Number Testing Tools
Mix it Up 1 of 4
The team used 5 quarts of donated red paint and 6 quarts of donated blue paint to make 11 quarts of Karen’s mixture of purple. Of the donated paint, 10 quarts of red paint and 18 quarts of blue paint remain.
Proportion of red paint, r, to
blue paint b
Karen
Juan
Rosie3
2
r
b
5
3
r
b
5
6
r
b
• After mixing 11 quarts of purple paint using Karen’s proportion, but before painting any of the center, the team decides they like Juan’s color better. • They need 24 quarts of paint to completely cover the center. • They will add some of the remaining paint to the 11 quarts to make 24 quarts of Juan’s color.
How many quarts of each color do they need to add to the 11 quarts?
Explain your response, using numbers equations, or words.
quarts of red paint
quarts of blue paint
Test Section Question Number Testing Tools
Mix it Up 1 of 4
After using all of Karen’s mixture to paint the center, the team decides they want to paint the roof in Juan’s color.
They will use all 6 quarts of blue to mix a batch of Juan’s color for the roof.
How many quarts of red paint will they need to buy?
The team used all 15 quarts of donated red paint and 18 quarts of donated blue paint to make 33 quarts of Karen’s mixture of purple. Of the donated paint, only 6 quarts of blue remain.
quartsProportion of
red paint, r, to blue paint b
Karen
Juan
Rosie3
2
r
b
5
3
r
b
5
6
r
b
Explain your response, using numbers equations, or words.

52
Figure A3. Mix It Up introductory screen for both versions.
Test Section Question Number Testing Tools
Mix it Up 1 of 4
Your class is helping fix up a teen center. The class has received a donation of red paint and blue paint and has decided to mix them to get purple paint.
The class decides to experiment with different ratios of red to blue paint to get mixtures of purple that look good.
Rosie’s Purple
Red Blue
Below is a table showing the amounts and proportions used by classmates to get their favorite mixtures of purple.
After classmates determine their favorite mixtures of purple, the amount of donated paint that remains is
15 quarts of red
and
24 quarts of blue
Proportion of red paint, r, to
blue paint b
Karen
Juan
Rosie3
2
r
b
5
3
r
b
5
6
r
b
In total, how many quarts of donated paint remain?
quarts

53
Fruit Drink
Figure A4. FD1.
Figure A5. FD2.
Sixteen-ounce bottles of the same brand of a fruit drink are sold at Shop A and Shop B.
The cost of fruit drink at each shop is shown at left.Bottles of fruit drink are sold individually.
You need to buy a large number of bottles of fruit drink for a party, and you want to spend as little money as possible.
Should you buy the fruit drink from Shop A or Shop B?
Explain your response, using numbers, equations, or words.
FRUIT DRINK
Shop AShop B-OR-
Shop A6 bottles for $1.50
Shop B9 bottles for $2.34
FD1
Sixteen-ounce bottles of the same brand of a fruit drink are sold at Shop A and Shop B.
The cost of fruit drink at each shop is shown at left.
You volunteer to help prepare for a city marathon and are asked to buy fruit drink for the event. The race director asks you to buy 3,600 bottles of fruit drink using as little money as possible.
Should you buy the fruit drink from Shop A or Shop B?
Explain your response, using numbers, equations, or words.
FRUIT DRINK
Shop AShop B
-OR-
Shop A6 bottles for $1.50
Shop B9 bottles for $2.35
FD2

54
Figure A6. FD3.
Figure A7. FD4.
FRUIT DRINKSixteen-ounce bottles of the same brand of a fruit drink are sold at Shop A and Shop B.
The cost of fruit drink at each shop is shown at left.
You are buying fruit drink for a neighborhood party. Money has been collected for the event. The coordinator gives you $70.50 to spend and asks you to buy as much fruit drink as possible.
Should you buy the fruit drink from Shop A or Shop B?
Explain your response, using numbers, equations, or words.
Shop AShop B
-OR-
Shop A6 bottles for $1.50
Shop B9 bottles for $2.35
FD3
Sixteen-ounce bottles of the same brand of a fruit drink are sold at Shop A and Shop B.
The cost of fruit drink at each shop is shown at left.
You volunteer to help prepare for a city marathon and are asked to buy fruit drink for the event. The race director asks you to buy 3,600 bottles of fruit drink using as little money as possible.
Should you buy the fruit drink from Shop A or Shop B?
Explain your response, using numbers, equations, or words.
FRUIT DRINK
Shop AShop B
-OR-
Shop A6 bottles for $1.50
Shop B9 bottles for $2.34
FD4

55
Paste
Version 1
Figure A8. Paste - Version 1.
Figure A9. Paste - Version 2.
Paste is made by mixing flour and water. The more flour you add, the thicker the paste will be. The more water you add, the thinner the paste will be.
Bowl C and Bowl D contain paste of the same thickness.
If one scoop of water is added to each bowl, which one will hold the thicker paste?
Bowl CBowl DThe paste in both bowls will be equally thick.
Explain your answer.
C D
Paste Ps1
If one spoonful of sugar is added to each bowl, which one will hold the sweeter oatmeal?
Bowl CBowl DThe oatmeal in both bowls will be equally sweet.
Bowl C and Bowl D were filled with oatmeal from the same pot.
Explain your answer.
DC
Paste Ps2
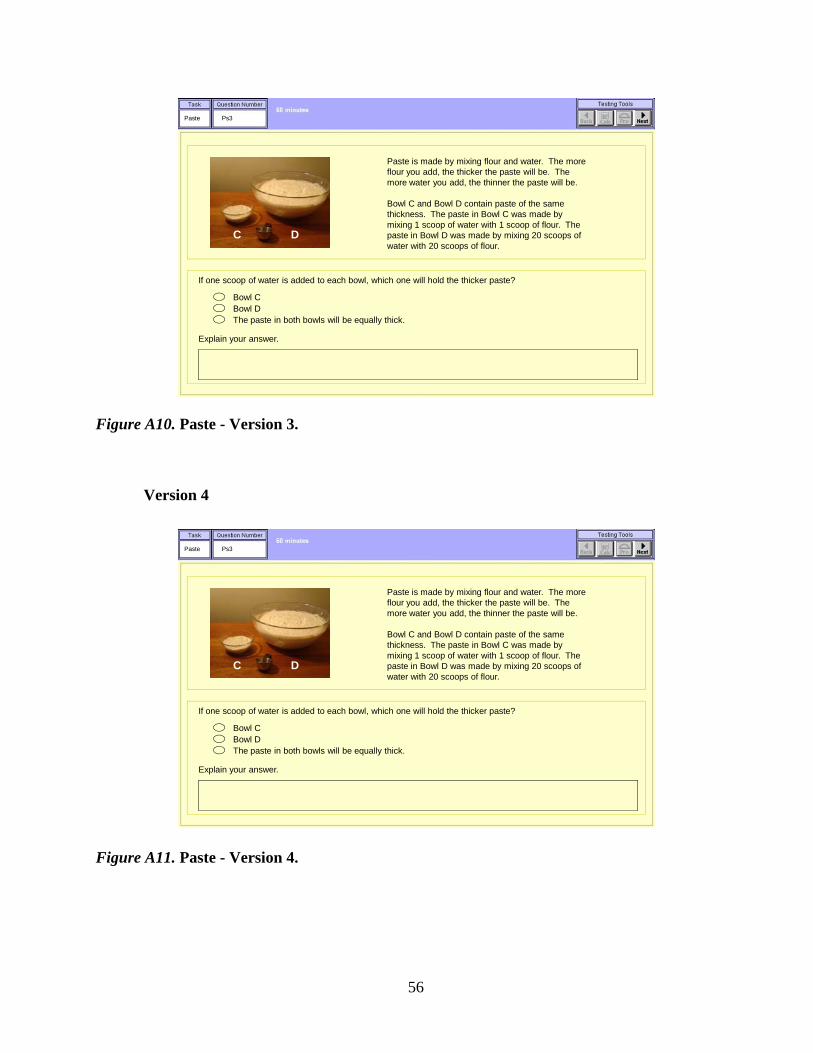
56
Figure A10. Paste - Version 3.
Version 4
Figure A11. Paste - Version 4.
Paste is made by mixing flour and water. The more flour you add, the thicker the paste will be. The more water you add, the thinner the paste will be.
Bowl C and Bowl D contain paste of the same thickness. The paste in Bowl C was made by mixing 1 scoop of water with 1 scoop of flour. The paste in Bowl D was made by mixing 20 scoops of water with 20 scoops of flour.
If one scoop of water is added to each bowl, which one will hold the thicker paste?
Bowl CBowl DThe paste in both bowls will be equally thick.
Explain your answer.
C D
Paste Ps3

57
Bigfoot (1)
Figure A12. Bigfoot (1) - Version A1.
Figure A13. Bigfoot (1) - Version A2.
BF1-A1Bigfoot
Assuming the dimensions of the two rectangles are in proportion, write an equation that gives the relationship among the variables W, L, w, and .
Assuming the dimensions of the two rectangles are in proportion, explain in words the relationship among the variables W, L, w, and .
You have carefully made an outline (on paper) of the footprint in the mud and of your own foot. You have drawn a rectangle around each outline. See the illustration below.
w is the width of the rectangle.
is the length of the rectangle.
Mud footprint Your footprint
W is the width of the rectangle.
L is the length of the rectangle.
W
L
w
BF1-A2Bigfoot
Assuming the dimensions of the two rectangles are in proportion, write an equation that gives the relationship among the variables W, L, w, and .
Assuming the dimensions of the two rectangles are in proportion, explain in words the relationship among the variables W, L, w, and .
You have carefully made an outline (on paper) of the footprint in the mud and of your own foot. You have drawn a rectangle around each outline. See the illustration below.
w is the width of the rectangle.
is the length of the rectangle.
Mud footprint Your footprint
W is the width of the rectangle.
L is the length of the rectangle.
W
L
w

58
Figure A14. Bigfoot (1) - Version B1.
Figure A15. Bigfoot (1) - Version B2.
BF1-B1Bigfoot
Assuming the dimensions of the two rectangles are in proportion, write an equation that gives the relationship among the variables W, L, w, and .
Assuming the dimensions of the two rectangles are in proportion, explain in words the relationship among the variables W, L, w, and .
You have carefully made an outline (on paper) of the footprint in the mud and of your own foot. You have drawn a rectangle around each outline. See the illustration below.
w is the width of the rectangle.
is the length of the rectangle.
Mud footprint Your footprint
W is the width of the rectangle.
L is the length of the rectangle.
w
L
W
BF1-B2Bigfoot
Assuming the dimensions of the two rectangles are in proportion, write an equation that gives the relationship among the variables W, L, w, and .
Assuming the dimensions of the two rectangles are in proportion, explain in words the relationship among the variables W, L, w, and .
You have carefully made an outline (on paper) of the footprint in the mud and of your own foot. You have drawn a rectangle around each outline. See the illustration below.
w is the width of the rectangle.
is the length of the rectangle.
Mud footprint Your footprint
W is the width of the rectangle.
L is the length of the rectangle.
W
L
w
L
W
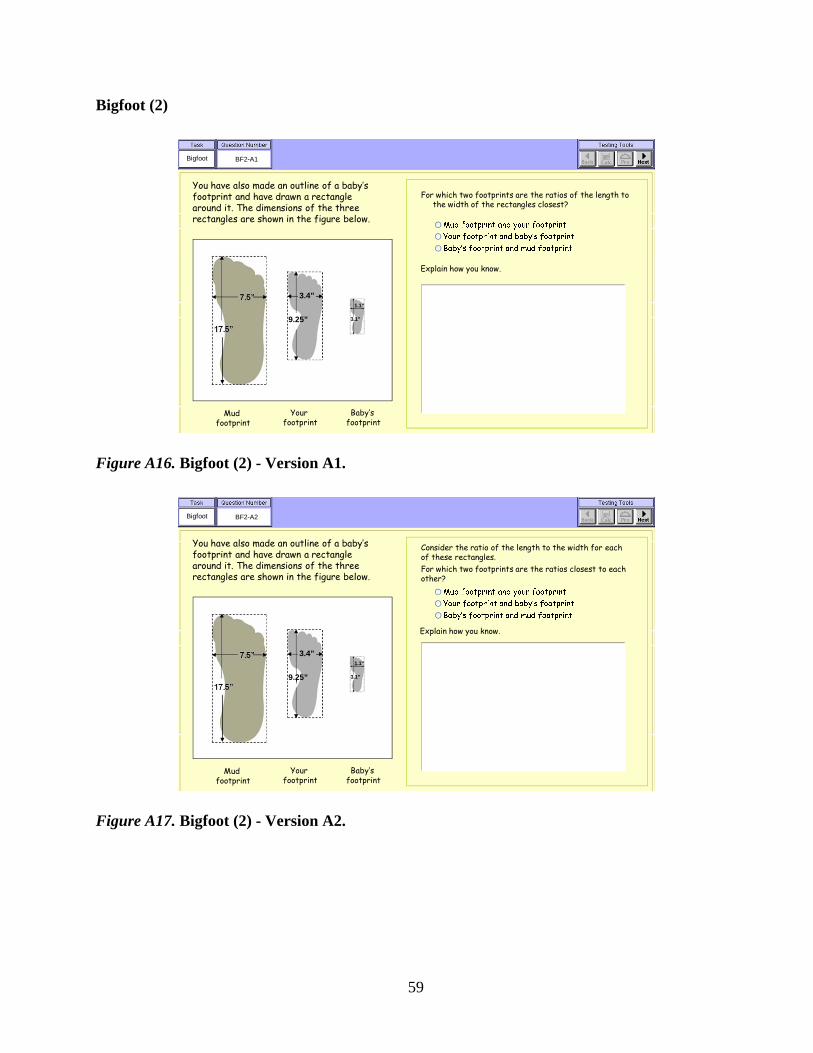
59
Bigfoot (2)
Figure A16. Bigfoot (2) - Version A1.
Figure A17. Bigfoot (2) - Version A2.
For which two footprints are the ratios of the length to the width of the rectangles closest?
Explain how you know.
BF2-A1Bigfoot
Mud footprint
Your footprint
Baby’s footprint
You have also made an outline of a baby’s footprint and have drawn a rectangle around it. The dimensions of the three rectangles are shown in the figure below.
3.4”
9.25” 3.1”
1.1”
BF2-A2Bigfoot
Consider the ratio of the length to the width for each of these rectangles. For which two footprints are the ratios closest to each other?
Explain how you know.
Mud footprint
Your footprint
Baby’s footprint
You have also made an outline of a baby’s footprint and have drawn a rectangle around it. The dimensions of the three rectangles are shown in the figure below.
3.4”
9.25” 3.1”
1.1”

60
Figure A18. Bigfoot (2) - Version B1.
Figure A19. Bigfoot (2) - Version B2.
Bigfoot
For which two footprints are the ratios of the length to the width of the rectangles closest?
Explain how you know.
You have also made an outline of a baby’s footprint and have drawn a rectangle around it. The dimensions of the three rectangles are shown in the figure below.
Mud footprint
Your footprint
Baby’s footprint
3.4”
9.25”
7.5”
17.5”3.1”
1.1”
BF2-B1
BF2-B2Bigfoot
Consider the ratio of the length to the width for each of these rectangles. For which two footprints are the ratios closest to each other?
Explain how you know.
Mud footprint
Your footprint
Baby’s footprint
You have also made an outline of a baby’s footprint and have drawn a rectangle around it. The dimensions of the three rectangles are shown in the figure below.
3.4”
9.25”
1.1”
3.1”
Mud footprint
Your footprint
Baby’s footprint
3.4”
9.25”
7.5”
17.5”
7.5”
17.5”3.1”
1.1”

61
Forest Carbon
Figure A20. FC4.
• Both charts are for the same three regions of the United States.• Chart 1 shows total land area.• Chart 2 shows forest land area only.
Forest Carbon 3Forest
Carbon 3 FC4
a. In 2002, which region of the United States had the most forest land? West South North
b. In 2002, which region of the United States had the smallest ratioof forest land area to total land area? West South North
Show your work.
1,315 413
535
Total Land Area in 2002by Region of the United States
(in Millions of Acres)
1,315 413
5350
50
100
150
200
250
300
350
400
West South North
Forest Land Area in 2002by Region of the United States
Region
Mill
ions
of A
cres
1. 2.

62
Figure A21. FC1.
Forest Carbon 3 FC1
a. Which chart shows forest land area only? Chart 1 Chart 2
Total Land Area in 2002by Region of the United States
(in Millions of Acres)
1,315 413
5350
50
100
150
200
250
300
350
400
West South North
Forest Land Area in 2002by Region of the United States
Region
Mill
ion
s o
f Acr
es
1. 2.
• Both charts are for the same three regions of the United States.• Chart 1 shows total land area.• Chart 2 shows forest land area only.
Familiarize yourself with the charts below, and answer the questions on this page and the next.
Forest Carbon 3 FC1
a. In 2002, which region of the United States had the most forest land? West South North
b. In 2002, which region of the United States had the smallest ratioof forest land area to total land area? West South North
Show your work.
1,315 413
535
Total Land Area in 2002by Region of the United States
(in Millions of Acres)
1,315 413
5350
50
100
150
200
250
300
350
400
West South North
Forest Land Area in 2002by Region of the United States
Region
Mill
ions
of A
cres
1. 2.

63
Figure A22. FC2.
Forest Carbon 3 FC2
a. Which chart shows forest land area only? Chart 1 Chart 2
Total Land Area in 2002by Region of the United States
1,315 million acres
413million acres
535million acres
0
50
100
150
200
250
300
350
400
West South North
Forest Land Area in 2002by Region of the United States
Region
Mill
ions
of A
cres
1. 2.
• Both charts are for the same three regions of the United States.• Chart 1 shows total land area.• Chart 2 shows forest land area only.
Familiarize yourself with the charts below, and answer the questions on this page and the next.
Forest Carbon 3 FC2
a. In 2002, which region of the United States had the most forest land? West South North
b. In 2002, which region of the United States had the smallest ratioof forest land area to total land area? West South North
Show your work.
1,315 413
535
Total Land Area in 2002by Region of the United States
1,315 million acres
413million acres
535million acres
0
50
100
150
200
250
300
350
400
West South North
Forest Land Area in 2002by Region of the United States
Region
Mill
ions
of A
cres
1. 2.

64
Figure A23. FC3.
Forest Carbon 3 FC3
a. Which chart shows forest land area only? Chart 1 Chart 2
Total Land Area in 2002by Region of the United States
(in Millions of Acres)
1,315 413
5350
50
100
150
200
250
300
350
400
West South North
Forest Land Area in 2002by Region of the United States
Region
Mill
ions
of A
cres
1. 2.
• Both charts are for the same three regions of the United States.• Chart 1 shows total land area.• Chart 2 shows forest land area only.
Familiarize yourself with the charts below, and answer the questions on this page and the next.
Forest Carbon 3 FC3
a. In 2002, which region of the United States had the most total land? West South North
b. In 2002, which region of the United States had the most forest land? West South North
c. Calculate the ratio of forest land area to total land area for the North region in 2002. Show your work.
d. In 2002, which region of the United States had the smallest ratioof forest land area to total land area? West South North
Show your work.
Total Land Area in 2002by Region of the United States
(in Millions of Acres)
1,315 413
5350
50
100
150
200
250
300
350
400
West South North
Forest Land Area in 2002by Region of the United States
Region
Mill
ions
of A
cres
1. 2.

65
Appendix B
Codes Used in Scoring Tasks and Frequency of Response Data
Table B1
Mix It Up – Version 1
Code Mix It Up Version 1 Frequency1 Correct explanation 3 2 Calculation error but otherwise correct 0 3 Explanation that stops at 15 quarts red and 9 quarts blue 0 4 Explanation that transposes red and blue 0 5 The student understands 13 quarts are required with more red than blue. 3
6 The student understands 13 quarts are required but not that more red than blue is required. 25
7 The student thought the numbers should be the numbers in Juan's ratio–5 and 3. 5
9 The student thought the numbers should be the numbers in Karen's ratio–5 and 6. 5
10 The student thought the ratio of red to blue should be Karen's ratio. 1 15 The student gave an incorrect calculation using the numbers in the item. 49 17 The response is not interpretable. 5 18 Other incorrect response 49 0 Blank response. 32
Table B2
Mix It Up – Version 2
Code Mix It Up Version 2 Frequency1 Correct explanation 26 2 Calculation error but otherwise correct 0 4 An explanation that suggests an inversion error. 0
7 The student thought the numbers should be the numbers in Juan's ratio–5 and 3. 9
11 The student was possibly using the incorrect addition strategy. 6 12 The student was possibly using Karen's ratio instead of Juan's. 11 13 The student was possibly using Rosie's ratio instead of Juan's. 0 15 The student gave an incorrect calculation using the numbers in the item. 27 17 The response is not interpretable. 10 18 Other incorrect response 59 0 Blank response 19

66
Table B3
Fruit Drink
Shop A or B? FD1 FD2 FD3 FD4
Shop A 51 38 46 49
Shop B 34 41 41 38
No response 1 2 2 1
Table B4
Fruit Drink codes
Code Explanation question FD1 FD2 FD3 FD4
1 Compares price per bottle 15 8 9 13
2 Compares cost of, e.g., 18 or 36 bottles 2 0 1 0
3 Compares cost of, e.g., 3 or 12 bottles 0 1 1 2
4 Compares cost of 3,600 bottles * 0 * 2
5 Compares number of bottles that can be purchased at a fixed cost, not $70.50 1 0 0 0
6 Compares number of bottles that can be purchased for $70.50 * * 4 *
7 Other correct explanation 2 0 0 0
8 Correct strategy with a calculation error 2 8 4 2
9 Correct comparison but chooses Shop B because you get more 2 0 0 1
10 Partially-correct explanation the compares prices at the two shops 4 2 3 1
11 Selects Shop B because you get more without comparing with Shop A 18 28 22 21
12 Incorrect comparison results in Shop A, but chooses B because you get more 2 0 1 0
13 Incorrect addition strategy 0 0 0 0
14 Incorrect strategy involving 3,600 or $70.50 * 5 0 11
16 Selects Shop A because the price of a 6-pack is less 17 17 14 18
17 Unintelligible 0 3 5 3
18 Other incorrect response 18 8 20 10
0 Blank response 3 1 5 4
* Certain codes not applicable for some versions

67
Table B5
Paste
Bowl C or D? PS1 PS2 PS3 PS4
Bowl C 20 69 10 12
Bowl D 41 5 32 37
Equal 29 11 43 33
Table B6
Paste - explanation
Explanation PS1 PS2 PS3 PS4
Correct response 1 4 1 4
Partially-correct response 23 55 14 23
Incorrect response 39 13 52 40
Blank, uninterpretable, off-topic 27 14 18 16

68
Table B7
Bigfoot (1)
Code Equation item A1 A2 B1 B2
1 Correct or equivalent equation 7 10 8 9
2 Equivalent system of equations 0 0 0 0
3 Correct equation for a different question 5 4 8 2
4 WL = w 12 9 9 6
5 L-W = -w 0 0 0 0
6 W+L = w+ 2 1 2 4
7 W/L = /w 1 0 2 1
8 Other incorrect equation 9 11 18 22
9 Any variable expression 36 28 33 22
10 Correct explanation 0 0 0 0
11 Explanation that specifies what W, L, w, and/or stand for 3 4 3 2
12 Other incorrect explanation 3 5 3 7
13 The response is indecipherable. 0 0 1 0
14 Other incorrect response 3 3 0 3
0 No response 4 8 2 7
Code Explanation item A1 A2 B1 B2
1 Correct explanation 3 0 5 3
2 Correct explanation to a different question 1 4 5 1
3 Partially-correct explanation 2 2 3 7
4 Incorrect explanation that refers to the shape of the foot 0 1 2 0
5 Incorrect explanation that suggests the feet have equal areas 3 0 1 0
6 Equal differences between the length and the width 0 0 0 0
7 Sums of the width and length are equal 0 0 0 0
8 Equal perimeters 0 0 0 0
9 Explanation that specifies what W, L, w, and/or l stand for 19 38 29 31
10 Correct equation 0 2 0 0
11 Incorrect equation 5 1 0 1
13 The response is indecipherable 4 3 5 1
14 Other incorrect response 43 27 33 37
0 No response 5 5 5 4

69
Table B8
Bigfoot (2)
Response Response A1 A2 B1 B2
0 No response 2 3 3 1
1 Mud footprint and "your" footprint 29 27 34 37
2 "Your" footprint and baby's footprint 49 52 45 47
3 Baby's footprint and mud footprint 3 3 5 2
Code Explanation A1 A2 B1 B2
1 Correct explanation 1 0 1 0
2 Correct reasoning with calculation error 1 0 2 1
3 At least one ratio is presented, but ratios are not compared 3 2 4 5
4 Compares differences between length and width 4 5 8 7
5 Compares lengths and/or widths 27 24 19 27
6 Compares sums of lengths and widths 0 4 1 7
7 Compares areas 1 6 3 4
8 Visual strategy 18 22 14 14
13 The response is indecipherable 7 2 3 1
14 Other incorrect response 18 16 27 14
0 No response 3 4 5 7

70
Table B9
Forest Carbon
Response Which chart shows forest land area only? FC1 FC2 FC3
0 No response 1 1 0
1 Chart 1 6 13 4
2 Chart 2 80 71 83
Response Which region of the US had the most total land? FC3
0 No response 0
1 West 86
2 South 1
3 North 0
Response Which region of the US had the most forest land? FC4 FC1 FC2 FC3
0 No response 1 0 0 1
1 West 80 84 84 82
2 South 2 3 0 4
3 North 0 0 1 0
Code Calculate the ratio of forest land area to total land area for the North region FC3
1 Correct calculation 0
2 Correct strategy, but incorrect calculations 21
3 Adds the corresponding values from the two charts 4
4 Multiplies the corresponding values from the two charts 1
5 Subtracts the corresponding values from the two charts 3
6 Finds a part/whole ratio based on Chart 1 or 2 0
13 The response is indecipherable. 0
14 Other incorrect response 47
0 No response 11

71
Response Which region had the smallest ratio of forest land area to total land area? FC4 FC1 FC2 FC3
0 No response 1 1 1 2
1 West 9 11 7 5
2 South 9 6 6 8
3 North 64 69 71 72
Code Show your work FC4 FC1 FC2 FC3
1 Three correct calculations 3 5 4 1
2 Correct strategy, but incorrect calculations 16 9 14 24
3 Student chooses lowest value in Chart 1 or 2 15 13 20 9
4 Compares sums of corresponding values 4 1 1 9
5 Compares products of corresponding values 0 0 0 1
6 Compares differences of corresponding values 4 10 1 8
7 Compares part/whole ratios from Chart 1 or 2 4 7 4 0
13 The response is indecipherable. 1 0 0 0
14 Other incorrect response 19 19 26 21
0 No response 17 23 15 14