constructing a framework for investigating and visualizing
DESCRIPTION
TRANSCRIPT
22nd Bled eConference
eEnablement:
Facilitating an Open, Effective and Representative eSociety June 14 - 17, 2009; Bled, Slovenia
Constructing a Framework for Investigating and Visualizing ERP Benefits and Business Change
Petra Schubert Centre for Applied Information and Communication Technologies – CAICT
Copenhagen Business School, Denmark
Susan P. Williams Discipline of Business Information Systems
University of Sydney, Australia
Abstract Realising business value and identifying the benefits arising from implementations of ERP systems remains a significant challenge for both research and practice. A review of existing work on ERP benefits reveals that current frameworks pay limited attention to contextual and temporal variations; socio-technical and business change; and levels of benefit realisation. This paper presents findings from an ongoing research project to develop a framework for investigating ERP benefits and business change, which addresses the identified limitations of previous research and provides a more detailed analysis of ERP benefits and their contextual variation. Using an iterative content analysis, the preliminary study presented here is based on 15 case studies. The final study will draw on data gathered from more than 60 case study organisations of differing size, maturity and industry sector.
Keywords: ERP benefits, enterprise system, benefits framework, business change
1 Introduction Identifying, managing and realising ERP benefits and obtaining value from investments in enterprise systems is an ongoing challenge for research and practice. A recent survey of 625 CFO's identified that “achieving the expected benefits from IT investments” ranked as the second most critical issue overall for organisations of all sizes and was the most critical issue for large organisations (greater than $1 billion in revenue) (CSC, 2008, p: 14). The same survey reveals that return on IT investments remains an issue
355
Petra Schubert, Susan P. Williams
with 43% of respondents reporting low, negative or unknown returns (CSC, 2008, p: 17) and that only 40% of responding organisations perform post completion audits of major IT projects (CSC, 2008, p: 18). Organisations' failure to identify ERP benefits may be partly related to the level of information available to monitor performance; information quality was the most critical issue identified in the survey (CSC, 2008, p3; p14) and corporate performance management (CPM) is seen as a significant challenge flowing on from this.
Identifying and managing ERP benefits is also an area of theoretical and practical concern for scholarly researchers and extensive research effort has been directed towards understanding the nature of ERP benefits (Legare, 2002; Murphy and Simon, 2002; Shang and Seddon, 2002; Staehr, Shanks, and Seddon, 2002; Stratman, 2007). In a previous paper (Schubert and Williams, 2009) we identify a number of limitations of existing ERP benefits frameworks. We argue that they include little insight into, or distinction between variations in:
1. Motivations for undertaking an ERP project and how these shape the identification and presentation of benefits;
2. Timing of benefits. For example, is the benefit desired/expected (declared as part of the project business case), an emergent or unanticipated benefit that arises during the project (an unintended consequence) or one that is realised (or not) as a project outcome?
3. Variations in reach and scope of ERP projects. Projects vary in reach from those narrowly focused into one functional area to those covering multiple functional areas or spanning multiple organisational boundaries. Projects also vary in scope from implementation of a single ERP module, expanding or upgrading an existing system, through to full suite implementations.
4. Locus of ERP benefits. Existing frameworks pay little attention to the locus of the benefit and to whom the benefit applies.
To understand the benefits organisations obtain from their ERP systems requires an in-depth understanding of the benefits they were initially seeking to obtain from the implementation, the way those benefits evolved (or not) over time and the nature of the change that arises from the benefits that were realised. Whilst existing frameworks make progress towards identifying lists and groupings of benefits they are largely descriptive and limited in the extent to which they address the distinctions outlined above. In particular, they do not provide insights into the varying contexts within which ERP projects are situated, or to the type and nature of ERP benefits and the changes that they enable.
Our research project addresses these limitations by investigating project motivations and the expected and realised ERP benefits. This work represents the preliminary stage of a long-term programme of research that seeks to:
assist organisations to identify, manage and realise the benefits of their investments in enterprise systems and
contribute to knowledge about benefits identification and realisation and to extend theorisations about how these can contribute to our understanding of business change and IT value in organisations.
356
Constructing a Framework for Investigating and Visualizing ERP Benefits and Business Change
The first stage of the research is to provide a comprehensive, heterogeneous, empirically derived classification of the drivers and benefits of ERP systems implementations. Such a framework extends current research by:
• deriving an extended classification to track benefits in context and over time
• providing insights into the range and complexity of motivations and a framework for mapping and discussing the ERP motivations and benefits in the context of individual implementations
• identifying and (where they exist) describing and explaining variations within and between organisations, for example in organisations: in different industries; of different size; in different stages of maturity; and with different project motivations and goals.
The paper is organised as follows. In the next section we present our research approach and the methodology for deriving the extended ERP benefits framework. We introduce and explain the dimensions of the framework as well as the values for the appraisal of benefits. The results section contains preliminary findings from the coding of the first 15 case studies. We conclude the paper with a discussion of our approach and an outlook on future research.
2 Constructing the Extended ERP Benefits Framework The research approach we use to develop the extended ERP benefits framework is discussed below. Our research design and methodology is presented in greater detail in (Schubert and Williams, 2009).
2.1 Data Source: eXperience Initiative The empirical data used in this study is derived from a longitudinal research project underway since 1999 (the eXperience initiative, Schubert and Wölfle, 2007). This project has developed more than 120 in-depth case studies of real world IS implementations. The majority of these cases deal with enterprise systems implementations. Drawing on this extensive source of detailed data we performed a comprehensive and in-depth content analysis applying open and axial coding techniques (cf. Miles and Huberman 1994, Boyatzis 1998).
The eXperience methodology (Schubert and Wölfle, 2007) has been specifically designed for the collection and the transfer of best practice experiences in enterprise systems projects. The cases have been developed using a standardised approach, which enables us to develop detailed profiles of individual organisations and the motivations for their ERP projects and to compare organisations and conduct structured cross-case analysis. Each research case includes an in-depth description of an existing enterprise system solution and respective practices in an organization. It encompasses:
• a description of the organisations and actors involved as well as the national regulations;
• the business scenario, partners, and company strategy; • the objectives, expectations, and desired benefits; • the actual outcome of the project (enterprise system solution); • the advantages achieved and the shortcomings observed (learnings).
357
Petra Schubert, Susan P. Williams
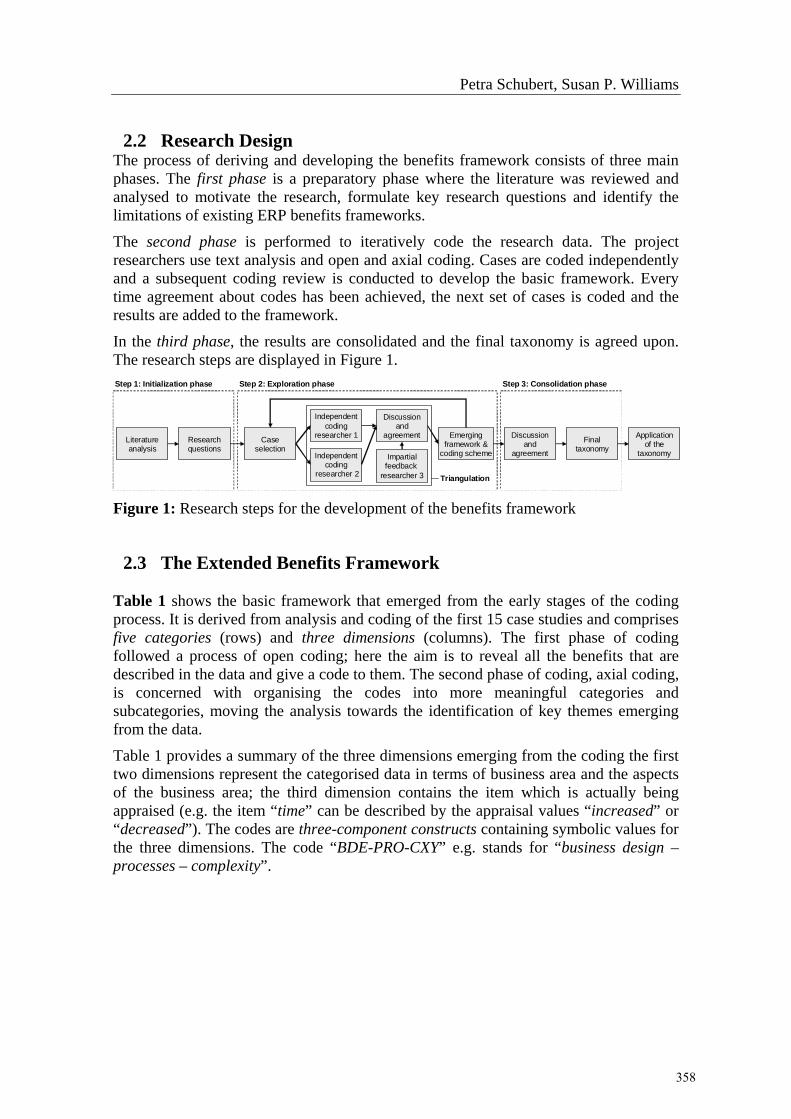
2.2 Research Design The process of deriving and developing the benefits framework consists of three main phases. The first phase is a preparatory phase where the literature was reviewed and analysed to motivate the research, formulate key research questions and identify the limitations of existing ERP benefits frameworks.
The second phase is performed to iteratively code the research data. The project researchers use text analysis and open and axial coding. Cases are coded independently and a subsequent coding review is conducted to develop the basic framework. Every time agreement about codes has been achieved, the next set of cases is coded and the results are added to the framework.
In the third phase, the results are consolidated and the final taxonomy is agreed upon. The research steps are displayed in Figure 1.
Literatureanalysis
Researchquestions
Caseselection
Independentcoding
researcher 1
Independentcoding
researcher 2
Discussionand
agreement Emergingframework &
coding scheme
Finaltaxonomy
Step 1: Initialization phase Step 2: Exploration phase Step 3: Consolidation phase
Impartialfeedback
researcher 3
Discussionand
agreement
Triangulation
Applicationof the
taxonomy
Figure 1: Research steps for the development of the benefits framework
2.3 The Extended Benefits Framework Table 1 shows the basic framework that emerged from the early stages of the coding process. It is derived from analysis and coding of the first 15 case studies and comprises five categories (rows) and three dimensions (columns). The first phase of coding followed a process of open coding; here the aim is to reveal all the benefits that are described in the data and give a code to them. The second phase of coding, axial coding, is concerned with organising the codes into more meaningful categories and subcategories, moving the analysis towards the identification of key themes emerging from the data.
Table 1 provides a summary of the three dimensions emerging from the coding the first two dimensions represent the categorised data in terms of business area and the aspects of the business area; the third dimension contains the item which is actually being appraised (e.g. the item “time” can be described by the appraisal values “increased” or “decreased”). The codes are three-component constructs containing symbolic values for the three dimensions. The code “BDE-PRO-CXY” e.g. stands for “business design – processes – complexity”.
358
Constructing a Framework for Investigating and Visualizing ERP Benefits and Business Change
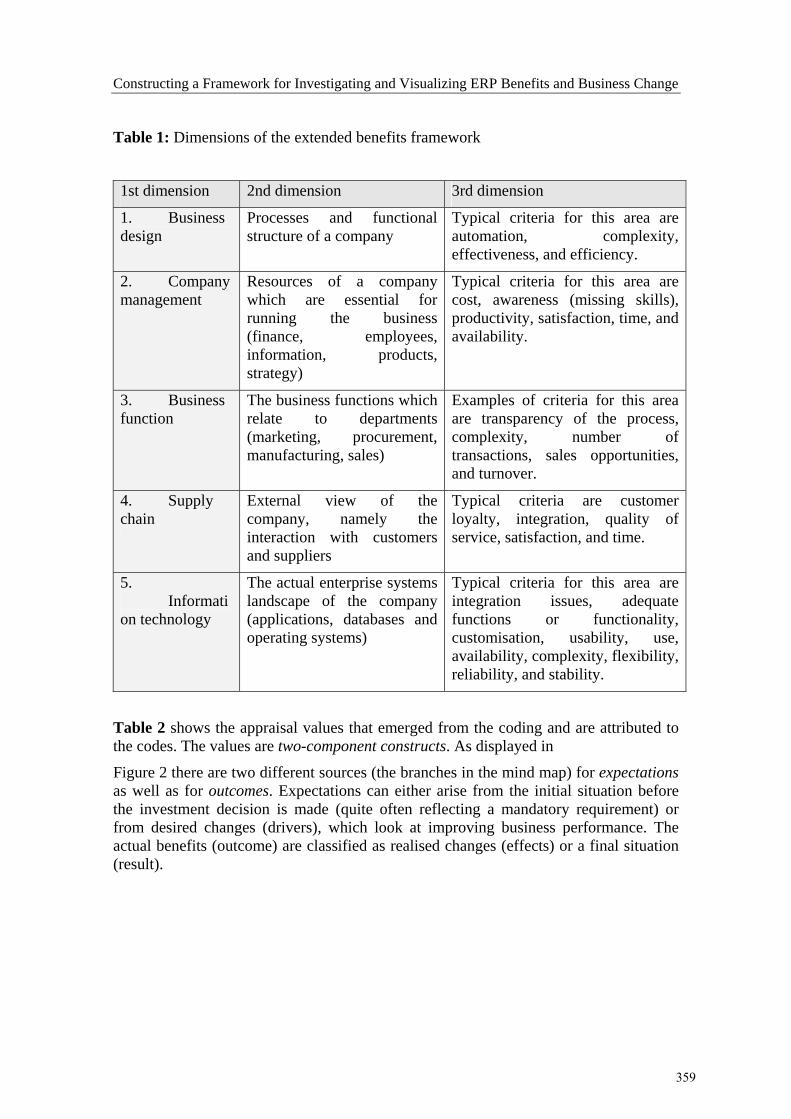
Table 1: Dimensions of the extended benefits framework
1st dimension 2nd dimension 3rd dimension
1. Business design
Processes and functional structure of a company
Typical criteria for this area are automation, complexity, effectiveness, and efficiency.
2. Company management
Resources of a company which are essential for running the business (finance, employees, information, products, strategy)
Typical criteria for this area are cost, awareness (missing skills), productivity, satisfaction, time, and availability.
3. Business function
The business functions which relate to departments (marketing, procurement, manufacturing, sales)
Examples of criteria for this area are transparency of the process, complexity, number of transactions, sales opportunities, and turnover.
4. Supply chain
External view of the company, namely the interaction with customers and suppliers
Typical criteria are customer loyalty, integration, quality of service, satisfaction, and time.
5. Information technology
The actual enterprise systems landscape of the company (applications, databases and operating systems)
Typical criteria for this area are integration issues, adequate functions or functionality, customisation, usability, use, availability, complexity, flexibility, reliability, and stability.
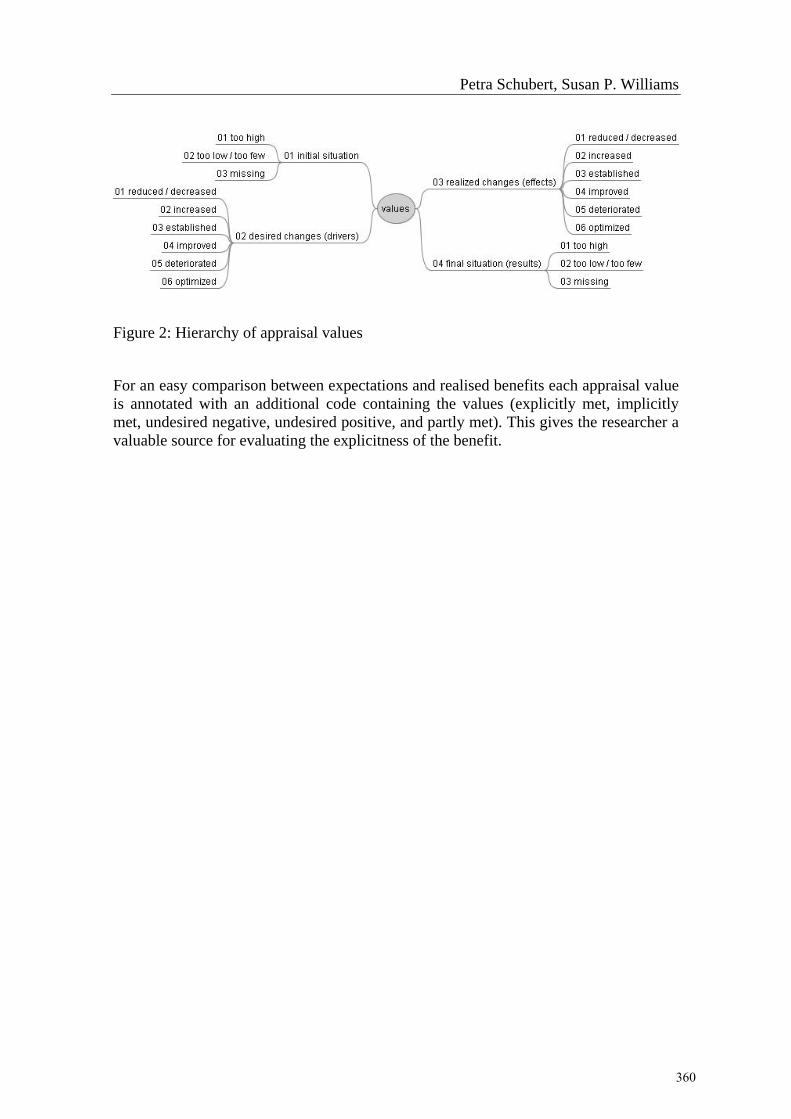
Table 2 shows the appraisal values that emerged from the coding and are attributed to the codes. The values are two-component constructs. As displayed in
Figure 2 there are two different sources (the branches in the mind map) for expectations as well as for outcomes. Expectations can either arise from the initial situation before the investment decision is made (quite often reflecting a mandatory requirement) or from desired changes (drivers), which look at improving business performance. The actual benefits (outcome) are classified as realised changes (effects) or a final situation (result).
359
Petra Schubert, Susan P. Williams
Figure 2: Hierarchy of appraisal values
For an easy comparison between expectations and realised benefits each appraisal value is annotated with an additional code containing the values (explicitly met, implicitly met, undesired negative, undesired positive, and partly met). This gives the researcher a valuable source for evaluating the explicitness of the benefit.
360
Constructing a Framework for Investigating and Visualizing ERP Benefits and Business Change
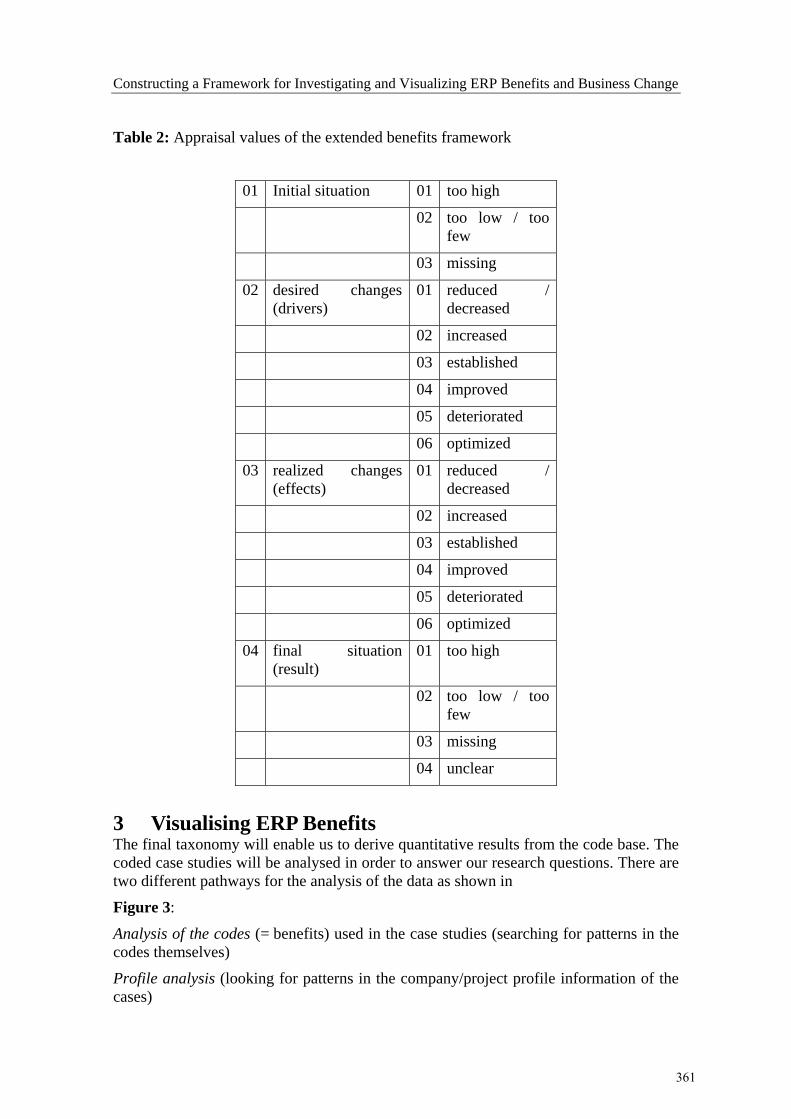
Table 2: Appraisal values of the extended benefits framework
01 Initial situation 01 too high
02 too low / too few
03 missing
02 desired changes (drivers)
01 reduced / decreased
02 increased
03 established
04 improved
05 deteriorated
06 optimized
03 realized changes (effects)
01 reduced / decreased
02 increased
03 established
04 improved
05 deteriorated
06 optimized
04 final situation (result)
01 too high
02 too low / too few
03 missing
04 unclear
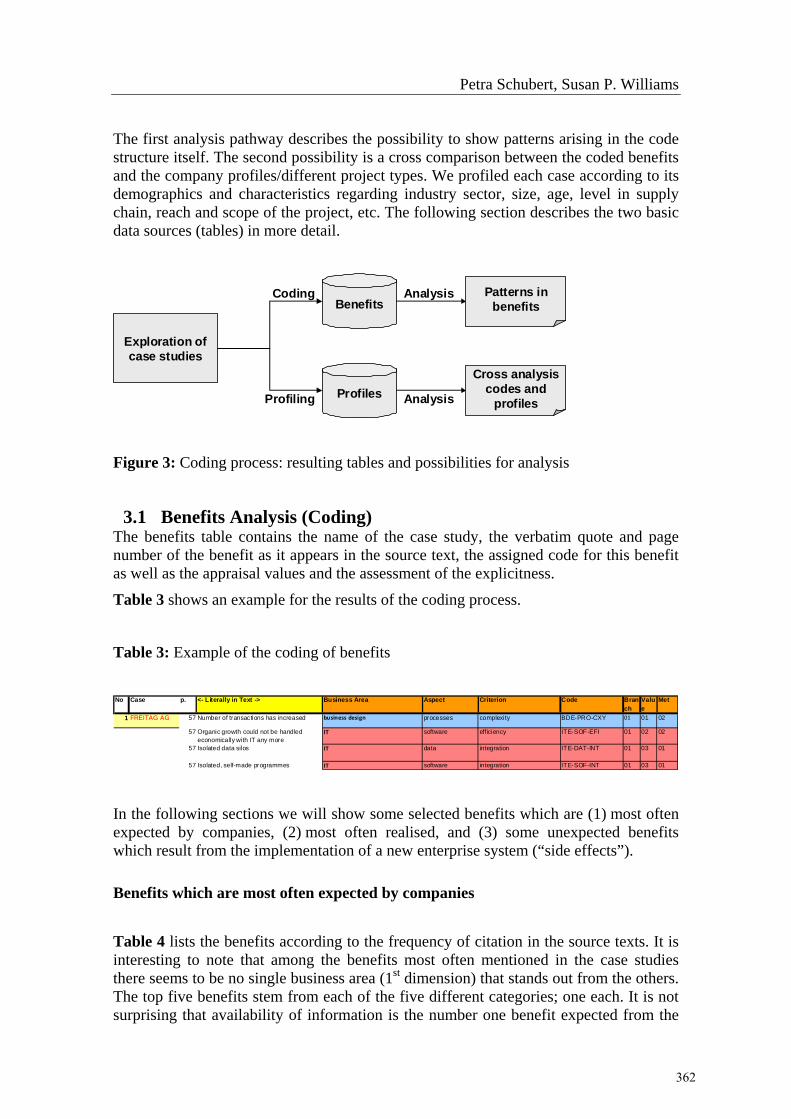
3 Visualising ERP Benefits The final taxonomy will enable us to derive quantitative results from the code base. The coded case studies will be analysed in order to answer our research questions. There are two different pathways for the analysis of the data as shown in
Figure 3:
Analysis of the codes (= benefits) used in the case studies (searching for patterns in the codes themselves)
Profile analysis (looking for patterns in the company/project profile information of the cases)
361
Petra Schubert, Susan P. Williams
The first analysis pathway describes the possibility to show patterns arising in the code structure itself. The second possibility is a cross comparison between the coded benefits and the company profiles/different project types. We profiled each case according to its demographics and characteristics regarding industry sector, size, age, level in supply chain, reach and scope of the project, etc. The following section describes the two basic data sources (tables) in more detail.
Exploration of case studies
Patterns in benefitsBenefits
ProfilesCross analysis
codes and profiles
Coding
Profiling
Analysis
Analysis
Figure 3: Coding process: resulting tables and possibilities for analysis
3.1 Benefits Analysis (Coding) The benefits table contains the name of the case study, the verbatim quote and page number of the benefit as it appears in the source text, the assigned code for this benefit as well as the appraisal values and the assessment of the explicitness.
Table 3 shows an example for the results of the coding process.
Table 3: Example of the coding of benefits
No Case p. <- Literally in Text -> Business Area Aspect Criterion Code Bran
chValue
Met
1 FREITAG AG 57 Number of transactions has increased business design processes complexity BDE-PRO-CXY 01 01 02
57 Organic growth could not be handled economically with IT any more
IT software efficiency ITE-SOF-EFI 01 02 02
57 Isolated data silos IT data integration ITE-DAT-INT 01 03 01
57 Isolated, self-made programmes IT software integration ITE-SOF-INT 01 03 01
In the following sections we will show some selected benefits which are (1) most often expected by companies, (2) most often realised, and (3) some unexpected benefits which result from the implementation of a new enterprise system (“side effects”).
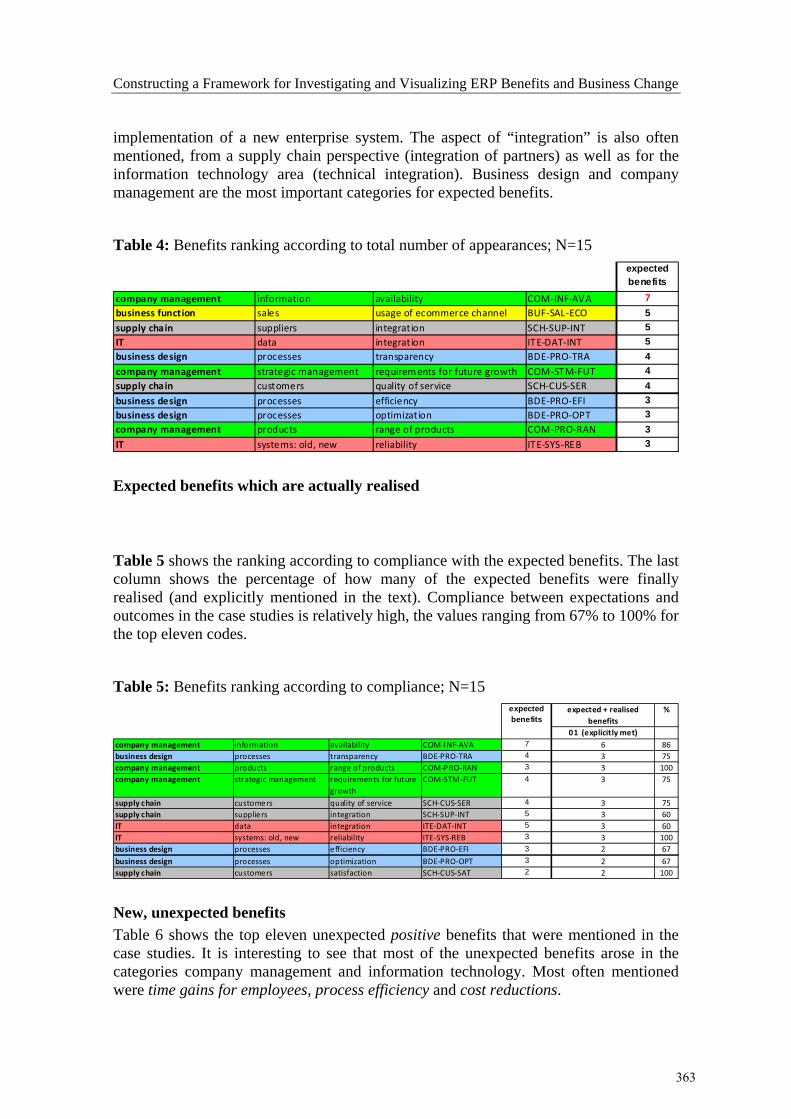
Benefits which are most often expected by companies Table 4 lists the benefits according to the frequency of citation in the source texts. It is interesting to note that among the benefits most often mentioned in the case studies there seems to be no single business area (1st dimension) that stands out from the others. The top five benefits stem from each of the five different categories; one each. It is not surprising that availability of information is the number one benefit expected from the
362
Constructing a Framework for Investigating and Visualizing ERP Benefits and Business Change
implementation of a new enterprise system. The aspect of “integration” is also often mentioned, from a supply chain perspective (integration of partners) as well as for the information technology area (technical integration). Business design and company management are the most important categories for expected benefits.
Table 4: Benefits ranking according to total number of appearances; N=15
company management information availability COM‐INF‐AVA 7business function sales usage of ecommerce channel BUF‐SAL‐ECO 5supply chain suppliers integration SCH‐SUP‐INT 5IT data integration ITE‐DAT‐INT 5business design processes transparency BDE‐PRO‐TRA 4company management strategic management requirements for future growth COM‐STM‐FUT 4supply chain customers quality of service SCH‐CUS‐SER 4business design processes efficiency BDE‐PRO‐EFI 3business design processes optimization BDE‐PRO‐OPT 3company management products range of products COM‐PRO‐RAN 3IT systems: old, new reliability ITE‐SYS‐REB 3
expected benefits
Expected benefits which are actually realised
Table 5 shows the ranking according to compliance with the expected benefits. The last column shows the percentage of how many of the expected benefits were finally realised (and explicitly mentioned in the text). Compliance between expectations and outcomes in the case studies is relatively high, the values ranging from 67% to 100% for the top eleven codes.
Table 5: Benefits ranking according to compliance; N=15
expected + realised benefits
%
01 (explicitly met)company management information availability COM‐INF‐AVA 7 6 8business design processes transparency BDE‐PRO‐TRA 4 3 7company management products range of products COM‐PRO‐RAN 3 3 100company management strategic management requirements for future
growthCOM‐STM‐FUT 4 3 7
supply chain customers quality of service SCH‐CUS‐SER 4 3 7supply chain suppliers integration SCH‐SUP‐INT 5 3 6IT data integration ITE‐DAT‐INT 5 3 6IT systems: old, new reliability ITE‐SYS‐REB 3 3 100business design processes efficiency BDE‐PRO‐EFI 3 2 6business design processes optimization BDE‐PRO‐OPT 3 2 6supply chain customers satisfaction SCH‐CUS‐SAT 2 2 100
expected benefits
65
5
500
77
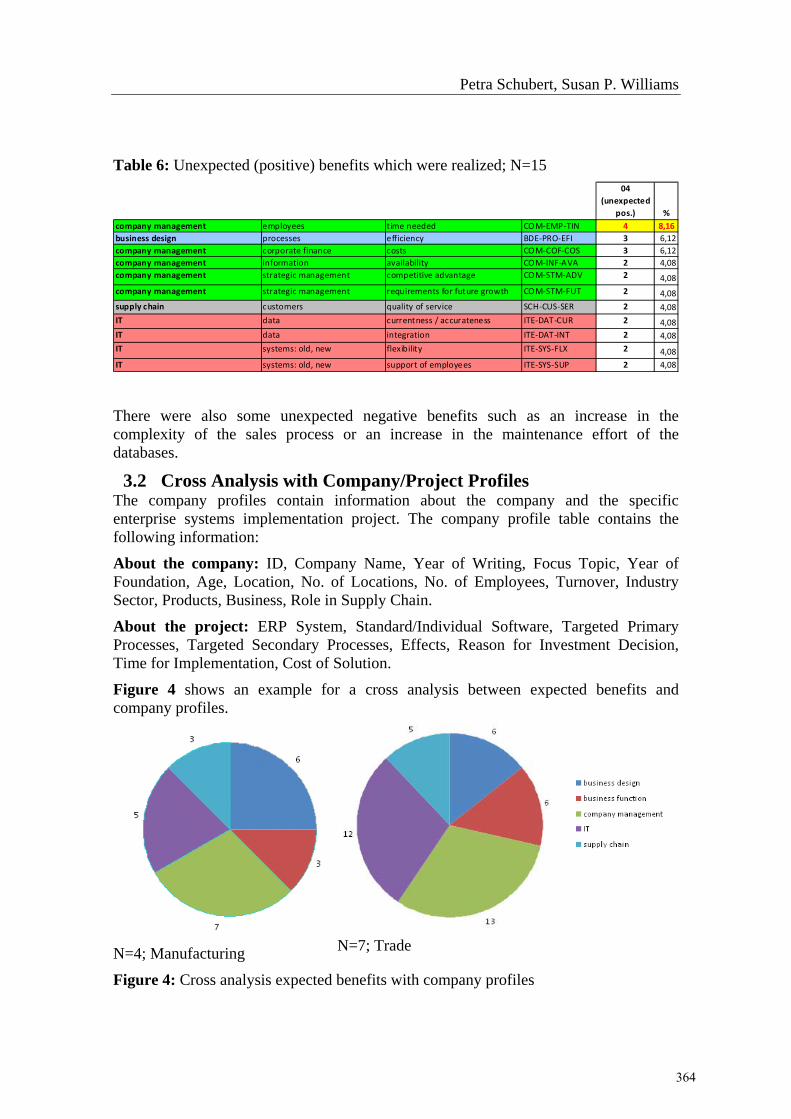
New, unexpected benefits Table 6 shows the top eleven unexpected positive benefits that were mentioned in the case studies. It is interesting to see that most of the unexpected benefits arose in the categories company management and information technology. Most often mentioned were time gains for employees, process efficiency and cost reductions.
363
Petra Schubert, Susan P. Williams
Table 6: Unexpected (positive) benefits which were realized; N=15
04 (unexpected
pos.) %company management employees time needed COM‐EMP‐TIN 4 8,16business design processes efficiency BDE‐PRO‐EFI 3 6,12company management corporate finance costs COM‐COF‐COS 3 6,12company management information availability COM‐INF‐AVA 2 4,08company management strategic management competitive advantage COM‐STM‐ADV 2 4,08company management strategic management requirements for future growth COM‐STM‐FUT 2 4,08supply chain customers quality of service SCH‐CUS‐SER 2 4,08IT data currentness / accurateness ITE‐DAT ‐CUR 2 4,08IT data integration ITE‐DAT ‐INT 2 4,08IT systems: old, new flexibility ITE‐SYS‐FLX 2 4,08IT systems: old, new support of employees ITE‐SYS‐SUP 2 4,08
There were also some unexpected negative benefits such as an increase in the complexity of the sales process or an increase in the maintenance effort of the databases.
3.2 Cross Analysis with Company/Project Profiles The company profiles contain information about the company and the specific enterprise systems implementation project. The company profile table contains the following information:
About the company: ID, Company Name, Year of Writing, Focus Topic, Year of Foundation, Age, Location, No. of Locations, No. of Employees, Turnover, Industry Sector, Products, Business, Role in Supply Chain.
About the project: ERP System, Standard/Individual Software, Targeted Primary Processes, Targeted Secondary Processes, Effects, Reason for Investment Decision, Time for Implementation, Cost of Solution.
Figure 4 shows an example for a cross analysis between expected benefits and company profiles.
N=4; Manufacturing
N=7; Trade
Figure 4: Cross analysis expected benefits with company profiles
364
Constructing a Framework for Investigating and Visualizing ERP Benefits and Business Change
It is interesting to see that, for example, the manufacturing industry puts a focus on company management and business design which include rather basic objectives such as resources (finance, employees, information, products, strategy) and business processes. The trade industry, on the other hand, pursues objectives primarily in the area of company management and information technology (data, software, systems), the latter representing a more detailed view on the effects companies want to realize with the new enterprise system. Further, it is notable that supply chain objectives are of higher importance in trade than in the manufacturing industry.
Due to space limitations we have only shown selected examples of cross analysis with the profiles table. Later studies will assist in answering questions such as:
• Are there typical expected benefits in certain industries?
• Which process areas are most often addressed in successful projects?
4 Discussion Most research into ERP benefits focuses on what benefits (generically) do ERP investments provide and how do we measure them? We argue that for an effective benefits realisation process organisations need ways of gathering information across time, being able to map their own benefits profile and identify areas where benefits are achieved and are not achieved and where unintended benefits arise.
In the literature we often find discussions of IT-induced benefits (Devadoss and Pan 2007). We argue that today many companies derive their business excellence from the effective use of software systems. So instead of using the term “IT-induced” we would suggest the use of the word IT-enabled. In a study of 1500 large organisations, Weill and Ross (2004) showed that “IT savvy” companies get a higher return on their IT investment than the non-savvy ones. Enterprise systems help companies build process excellence (Schubert, 2007). In an analogy this means that companies which explicitly pursue objectives with the introduction of enterprise systems instead of just acting out of a mere necessity are more likely to reap benefits than the ones that do not.
The first setting of objectives regarding benefits usually happens during the evaluation phase (i.e. in the decision process). This is a once and only look at benefits. We argue that the measurement of the realization of benefits is a continuous process, which needs to be performed before and after the introduction of the system as well as at recurring points in time during the actual system use. We argue that companies need to perform a continuous benefits measurement in order to see how effective they are using their enterprise system. This should therefore be incorporated and reflected in ERP benefits frameworks.
365
Petra Schubert, Susan P. Williams
Evaluation (selection
phase)
Implementation(introduction
phase)
Actual System Use(productive
phase)
Upgrade Re-Evaluation (possible
replacement)
Ex anteexpectationof benefits
Ex postrealizationof plannedbenefits
Ex postrealizationof plannedbenefits
UnexpectedbenefitsUnexpectedbenefits
Time
Benefits level
? ?
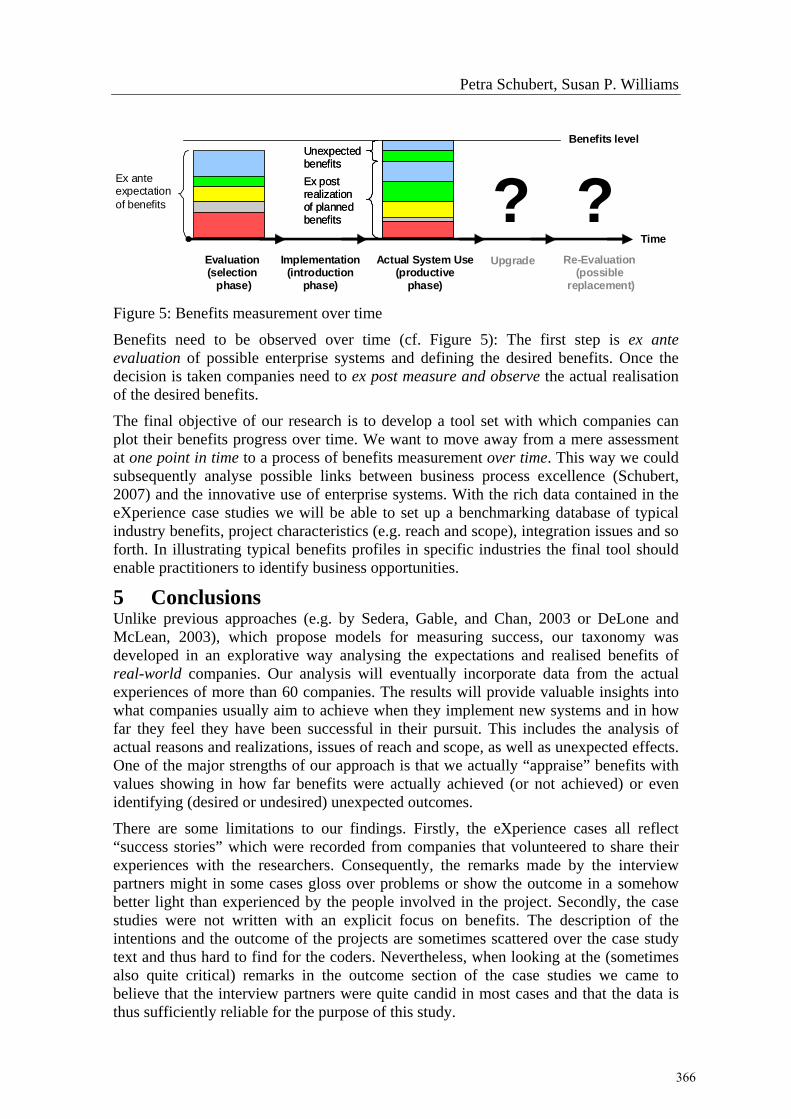
Figure 5: Benefits measurement over time
Benefits need to be observed over time (cf. Figure 5): The first step is ex ante evaluation of possible enterprise systems and defining the desired benefits. Once the decision is taken companies need to ex post measure and observe the actual realisation of the desired benefits.
The final objective of our research is to develop a tool set with which companies can plot their benefits progress over time. We want to move away from a mere assessment at one point in time to a process of benefits measurement over time. This way we could subsequently analyse possible links between business process excellence (Schubert, 2007) and the innovative use of enterprise systems. With the rich data contained in the eXperience case studies we will be able to set up a benchmarking database of typical industry benefits, project characteristics (e.g. reach and scope), integration issues and so forth. In illustrating typical benefits profiles in specific industries the final tool should enable practitioners to identify business opportunities.
5 Conclusions Unlike previous approaches (e.g. by Sedera, Gable, and Chan, 2003 or DeLone and McLean, 2003), which propose models for measuring success, our taxonomy was developed in an explorative way analysing the expectations and realised benefits of real-world companies. Our analysis will eventually incorporate data from the actual experiences of more than 60 companies. The results will provide valuable insights into what companies usually aim to achieve when they implement new systems and in how far they feel they have been successful in their pursuit. This includes the analysis of actual reasons and realizations, issues of reach and scope, as well as unexpected effects. One of the major strengths of our approach is that we actually “appraise” benefits with values showing in how far benefits were actually achieved (or not achieved) or even identifying (desired or undesired) unexpected outcomes.
There are some limitations to our findings. Firstly, the eXperience cases all reflect “success stories” which were recorded from companies that volunteered to share their experiences with the researchers. Consequently, the remarks made by the interview partners might in some cases gloss over problems or show the outcome in a somehow better light than experienced by the people involved in the project. Secondly, the case studies were not written with an explicit focus on benefits. The description of the intentions and the outcome of the projects are sometimes scattered over the case study text and thus hard to find for the coders. Nevertheless, when looking at the (sometimes also quite critical) remarks in the outcome section of the case studies we came to believe that the interview partners were quite candid in most cases and that the data is thus sufficiently reliable for the purpose of this study.
366
Constructing a Framework for Investigating and Visualizing ERP Benefits and Business Change
In summary, most current ERP benefits research appears to address the question “what benefits do ERP investments provide?” and does not fully address the questions of “why, where, when, how, and to whom do these investments provide benefits and value?”. The extended benefits framework developed in this research project provides the analytical tools to begin to answer these questions more fully.
367
Petra Schubert, Susan P. Williams
References Boyatzis, R., (1998): “Transforming Qualitative Information: Thematic Analysis and
Code Development”, SAGE Publishing Inc.: Thousand Oaks, CA.
CSC (2008): “Tenth annual technology issues for financial executives survey”. Tenth annual joint publication of the Committee on Finance and Information Technology of Financial Executives International, Financial Executives Research Foundation and Computer Sciences Corporation http://assets1.csc.com/management_consulting/downloads/10460_1.pdf
DeLone, W. H.; McLean, E. R., (2003): The DeLone and McLean Model of Information Systems Success: A ten-year Update, Journal of Management Information Systems, Vol. 19, No. 4, pp. 9–30.
Legare, T.L., (2002): The Role of Organizational Factors in Realizing ERP Benefits, Information Systems Management, Vol. 19, No. 4, pp. 21-42.
Miles, M. B., Huberman, A. M., (1994): “Qualitative Data Analysis – An Expanded Sourcebook (2nd edition)”, Sage Publications Inc., Thousand Oaks, CA.
Murphy, K.E., and Simon, J.S. (2002): Intangible benefits valuation in ERP projects. Information Systems Journal. Vol 12, pp. 301-320.
Schubert, P., (2007): Business Software as a Facilitator for Business Process Excellence: Experiences from Case Studies, Electronic Markets, Vol. 17, No. 3, 2007, pp. 187-198.
Schubert, P., Williams, S.P., (2009): An Extended Framework for Comparing Expectations and Realized Benefits of Enterprise Systems Implementations, 15th Americas Conference on Information System, San Francisco, August 2009.
Schubert, P., Wölfle, R. (2007): The eXperience Methodology for Writing IS Case Studies, Proceedings of the Thirteenth Americas Conference on Information Systems (AMCIS), Keystone, Colorado, 2007.
Sedera, D., Gable, G., Chan, T., (2003) Measuring Enterprise Systems Success: A Preliminary Model, Ninth Americas Conference on Information Systems Tampa, 476-485.
Shang, S., Seddon, P.B., (2002): Assessing and managing the benefits of enterprise systems: the business manager’s perspective. Information Systems Journal, Vol. 12, pp. 271-299.
Staehr, L., Shanks, G., Seddon, P.B., (2002): Understanding the business benefits of enterprise resource planning. Eighth Americas Conference on Information Systems, Dallas, Texas, pp. 899-906.
Stratman, J. K., (2007): Realizing Benefits from Enterprise Resource Planning: Does Strategic Focus Matter? Production and Operations Management Vol. 16, No. 2, pp. 203 - 216.
Weill, P., Ross, J., (2004): “IT Governance: How Top Performers Manage IT Decision Rights for Superior Results”, Harvard Business School Press, Boston.
368