construction of optimum portfolio with bse...
TRANSCRIPT

Volume 4, Number 1, January – March’ 2015
ISSN (Print):2279-0896, (Online):2279-090X
PEZZOTTAITE JOURNALS SJIF (2012): 2.844, SJIF (2013): 5.049
International Journal of Applied Financial Management Perspectives © Pezzottaite Journals. 1614 |P a g e
CONSTRUCTION OF OPTIMUM PORTFOLIO WITH BSE LISTED COMPANIES
Kiran25 Dr. Kushalappa S.26
ABSTRACT
The paper aims at constructing an optimal portfolio by applying Sharpe‘s single Index model of capital asset pricing, this
model helps an investor to select the best securities to be included in an optimal portfolio and the weights of investment in
each security. The main objective of the study is to construct an optimal portfolio of 30 Index Stocks of Bombay Stock
Exchange. The entire study is based on secondary data extracted from websites like Bombay Stock Exchange (BSE), Reserve
Bank of India (RBI), books and journals. The sample size 30 companies listed on BSE. The analysis is based on stock returns
of 30 companies for one year from 1st April 2013 to 31st March 2014.
KEYWORDS
Sharpe’s Single Index Model, Sharpe Ratio, Optimal Portfolio, Cut-Off Rate Portfolio, Optimal Portfolio, Market
Risk, Unsystematic Risk, Variance etc.
INTRODUCTION
Portfolio is the collection of financial or real assets such as equity shares, debentures, bonds, treasury bills and property etc.
portfolio is a combination of assets or it consists of collection of securities. These holdings are the result of individual preferences,
decisions of the holders regarding risk, return and most of other considerations. Modern portfolio theory has one central theme:
―In constructing their portfolios investors need to look at the expected return of each investment in relation to the impact that it
has on the risk of the overall portfolio‖. Portfolio management concerns the constructions and maintenance of a collection of
investment. It is investment of funds in different securities in which the total risk of the portfolio is minimized, while expecting
maximum return from it. It primarily involves reducing risk rather than increasing return. Return is obviously important though,
and the ultimate objective of portfolio manager is to achieve a chosen level of return by incurring the least possible risk.
OBJECTIVES OF STUDY
The main objective of the study is to construct an optimal portfolio of BSE 30 stocks. In order to achieve the main objective, the
following subsidiary objectives have been drawn:
To analyze the performance of sample companies based on their return, systematic risk, unsystematic risk.
To find out the excess return to beta ratio.
To identify the stocks supposed to be included in the optimum portfolio
To find out the proportion of investment under each security included in the optimum portfolio.
To offer meaningful suggestions to the investors based on the study
METHODOLOGY USED
The entire study is based on secondary data extracted from websites like Bombay Stock Exchange (BSE), Reserve Bank of India
(RBI), books and journals. The sample size is 30 companies listed on BSE Sensex. The analysis is based on stock returns of 30
companies for one year from April 1 2013 to 31st March 2014.
SCOPE OF STUDY
The study is all about construction of an optimal portfolio with stocks of BSE 30 companies. Thirty companies have been selected
for the purpose construction of an optimal portfolio. The study covers a period of one year from April 1st 2013 to 31st March 2014.
TOOLS USED FOR ANALYSIS
Return of the Stock is being calculated by using the following formula:
* 100
25Student (IInd Year MBA), A.I.E.T., Karnataka, India, [email protected] 26Senior Assistant Professor, Department of MBA, A.I.E.T., Karnataka, India, [email protected]
Volume 4, Number 1, January – March’ 2015
ISSN (Print):2279-0896, (Online):2279-090X
PEZZOTTAITE JOURNALS SJIF (2012): 2.844, SJIF (2013): 5.049
International Journal of Applied Financial Management Perspectives © Pezzottaite Journals. 1615 |P a g e
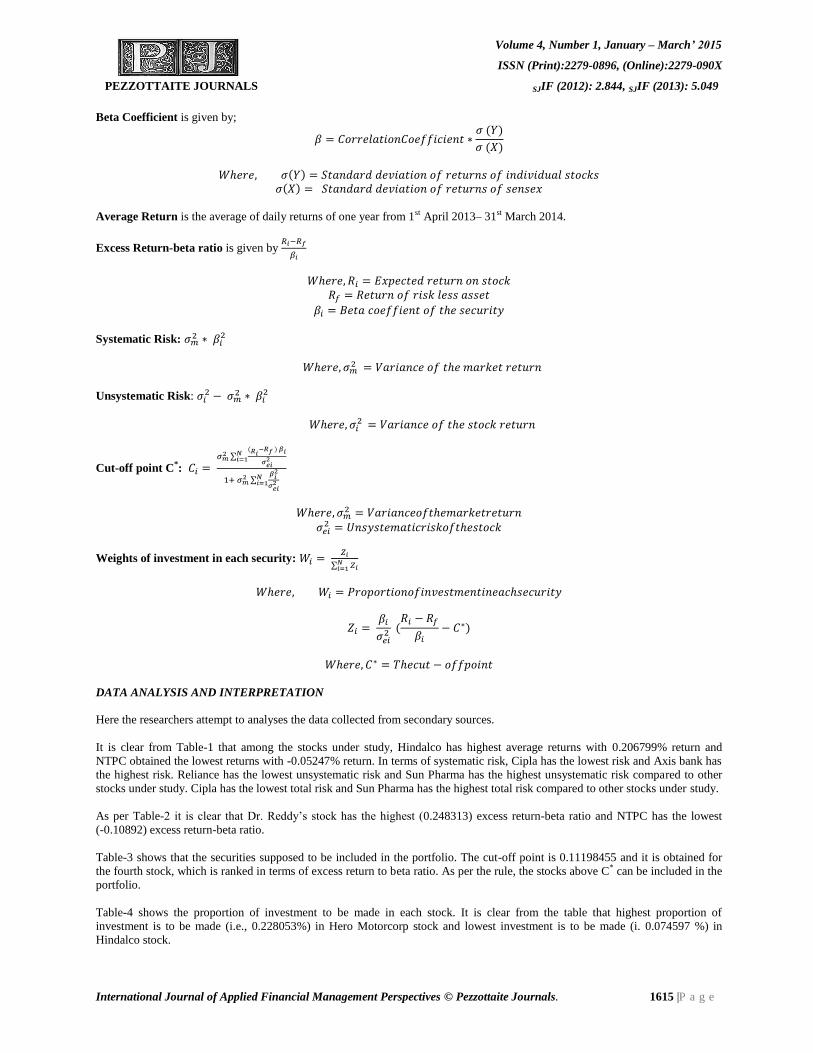
Beta Coefficient is given by;
Average Return is the average of daily returns of one year from 1st April 2013– 31st March 2014.
Excess Return-beta ratio is given by
Systematic Risk:
Unsystematic Risk:
Cut-off point C*:
∑
∑
Weights of investment in each security:
∑
DATA ANALYSIS AND INTERPRETATION
Here the researchers attempt to analyses the data collected from secondary sources.
It is clear from Table-1 that among the stocks under study, Hindalco has highest average returns with 0.206799% return and
NTPC obtained the lowest returns with -0.05247% return. In terms of systematic risk, Cipla has the lowest risk and Axis bank has
the highest risk. Reliance has the lowest unsystematic risk and Sun Pharma has the highest unsystematic risk compared to other
stocks under study. Cipla has the lowest total risk and Sun Pharma has the highest total risk compared to other stocks under study.
As per Table-2 it is clear that Dr. Reddy‘s stock has the highest (0.248313) excess return-beta ratio and NTPC has the lowest
(-0.10892) excess return-beta ratio.
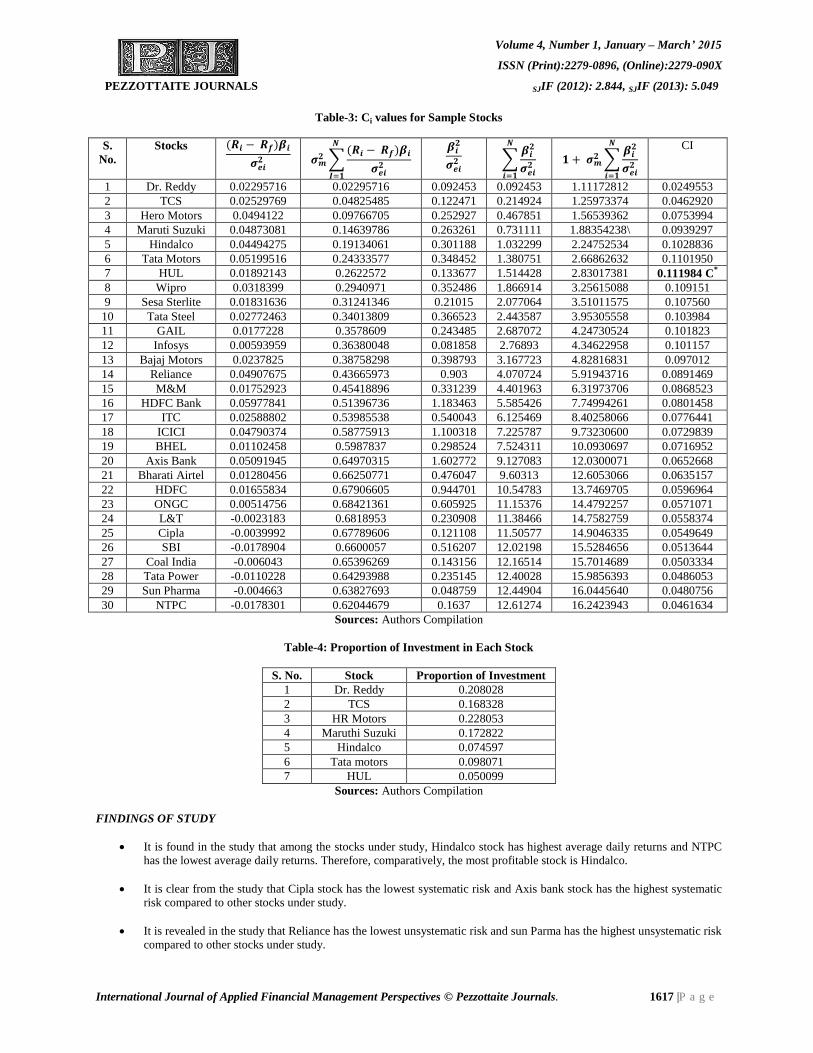
Table-3 shows that the securities supposed to be included in the portfolio. The cut-off point is 0.11198455 and it is obtained for
the fourth stock, which is ranked in terms of excess return to beta ratio. As per the rule, the stocks above C* can be included in the
portfolio.
Table-4 shows the proportion of investment to be made in each stock. It is clear from the table that highest proportion of
investment is to be made (i.e., 0.228053%) in Hero Motorcorp stock and lowest investment is to be made (i. 0.074597 %) in
Hindalco stock.

Volume 4, Number 1, January – March’ 2015
ISSN (Print):2279-0896, (Online):2279-090X
PEZZOTTAITE JOURNALS SJIF (2012): 2.844, SJIF (2013): 5.049
International Journal of Applied Financial Management Perspectives © Pezzottaite Journals. 1616 |P a g e
Table-1: Ranking of the Stocks of Sample Manufacturing Companies Based on Returns, Systematic Risk, Unsystematic
S. No. Stocks Daily Average
Returns (%)
Rank Systematic
Risk
Rank Unsystematic
Risk
Rank
1 Dr. Reddy 0.206799 1 1.797788 22 4.93921 26
2 TCS 0.192077 2 0.986917 13 3.102061 19
3 Hero Motors 0.184957 3 1.392179 17 3.306045 22
4 Maruti Suzuki 0.171369 4 0.680216 9 2.2254 9
5 Hindalco 0.146861 5 0.292013 2 2.613603 16
6 Tata Motors 0.140119 6 0.376661 3 2.544907 14
7 HUL 0.12674 7 1.653153 20 6.509378 28
8 Wipro 0.12151 8 1.975426 25 4.459807 25
9 Sesa Sterlite 0.115384 9 0.494934 5 3.063706 17
10 Tata Steel 0.109427 10 1.060738 14 2.490128 13
11 GAIL 0.093176 11 2.980922 29 2.241758 10
12 Infosys 0.089501 12 1.982849 26 1.386408 2
13 Bajaj Motors 0.084969 13 1.481221 18 1.357339 1
14 Reliance 0.078435 14 3.444405 30 1.778274 6
15 M&M 0.075953 15 0.596857 7 2.028403 8
16 HDFC Bank 0.075885 16 2.312397 28 6.409725 27
17 ITC 0.072917 17 0.78672 11 1.632407 4
18 ICICI 0.070865 18 0.915661 12 2.287438 11
19 BHEL 0.069711 19 1.060738 15 1.625308 3
20 Axis Bank 0.06559 20 0.381907 4 3.860593 23
21 Bharati Airtel 0.057572 21 1.793995 21 3.118367 20
22 HDFC 0.047695 22 2.06195 27 1.806092 7
23 ONGC 0.035382 23 1.875166 23 2.560809 15
24 L&T 0.012231 24 1.894098 24 6.78766 29
25 Cipla 0.009508 25 0.259163 1 1.770753 5
26 SBI -0.00411 26 0.566968 6 3.277208 21
27 Coal India -0.01437 27 1.543525 19 2.474263 12
28 Tata Power -0.02158 28 1.182864 16 4.162515 24
29 Sun Pharma -0.04936 29 0.726749 10 12.33352 30
30 NTPC -0.05247 30 0.608245 8 3.074582 18
Sources: Authors Compilation
Table-2: Excess Return to Beta Ratio and Cut-off Point Calculations for Manufacturing Companies under Study
S. No. Stocks Ri-Rf/βi Rank S. No. Stocks Ri-Rf/βi Rank
1 Dr. Reddy 0.248313 1 16 HDFC Bank 0.050511 16
2 TCS 0.20656 2 17 ITC 0.047937 17
3 Hero Motors 0.195362 3 18 ICICI 0.043536 18
4 Maruti Suzuki 0.185105 4 19 BHEL 0.03693 19
5 Hindalco 0.149218 5 20 Axis Bank 0.03177 20
6 Tata Motors 0.149218 6 21 Bharati Airtel 0.026898 21
7 HUL 0.141546 7 22 HDFC 0.017528 22
8 Wipro 0.090329 8 23 ONGC 0.008495 23
9 Sesa Sterlite 0.087158 9 24 L&T -0.01004 24
10 Tata Steel 0.075642 10 25 Cipla -0.03302 25
11 GAIL 0.072788 11 26 SBI -0.03466 26
12 Infosys 0.07256 12 27 Coal India -0.04221 27
13 Bajaj Motors 0.059636 13 28 Tata Power -0.04688 28
14 Reliance 0.054349 14 29 Sun Pharma -0.09563 29
15 M&M 0.05292 15 30 NTPC -0.10892 30
Sources: Authors Compilation
Volume 4, Number 1, January – March’ 2015
ISSN (Print):2279-0896, (Online):2279-090X
PEZZOTTAITE JOURNALS SJIF (2012): 2.844, SJIF (2013): 5.049
International Journal of Applied Financial Management Perspectives © Pezzottaite Journals. 1617 |P a g e
Table-3: Ci values for Sample Stocks
S.
No.
Stocks
∑
∑
∑
CI
1 Dr. Reddy 0.02295716 0.02295716 0.092453 0.092453 1.11172812 0.0249553
2 TCS 0.02529769 0.04825485 0.122471 0.214924 1.25973374 0.0462920
3 Hero Motors 0.0494122 0.09766705 0.252927 0.467851 1.56539362 0.0753994
4 Maruti Suzuki 0.04873081 0.14639786 0.263261 0.731111 1.88354238\ 0.0939297
5 Hindalco 0.04494275 0.19134061 0.301188 1.032299 2.24752534 0.1028836
6 Tata Motors 0.05199516 0.24333577 0.348452 1.380751 2.66862632 0.1101950
7 HUL 0.01892143 0.2622572 0.133677 1.514428 2.83017381 0.111984 C*
8 Wipro 0.0318399 0.2940971 0.352486 1.866914 3.25615088 0.109151
9 Sesa Sterlite 0.01831636 0.31241346 0.21015 2.077064 3.51011575 0.107560
10 Tata Steel 0.02772463 0.34013809 0.366523 2.443587 3.95305558 0.103984
11 GAIL 0.0177228 0.3578609 0.243485 2.687072 4.24730524 0.101823
12 Infosys 0.00593959 0.36380048 0.081858 2.76893 4.34622958 0.101157
13 Bajaj Motors 0.0237825 0.38758298 0.398793 3.167723 4.82816831 0.097012
14 Reliance 0.04907675 0.43665973 0.903 4.070724 5.91943716 0.0891469
15 M&M 0.01752923 0.45418896 0.331239 4.401963 6.31973706 0.0868523
16 HDFC Bank 0.05977841 0.51396736 1.183463 5.585426 7.74994261 0.0801458
17 ITC 0.02588802 0.53985538 0.540043 6.125469 8.40258066 0.0776441
18 ICICI 0.04790374 0.58775913 1.100318 7.225787 9.73230600 0.0729839
19 BHEL 0.01102458 0.5987837 0.298524 7.524311 10.0930697 0.0716952
20 Axis Bank 0.05091945 0.64970315 1.602772 9.127083 12.0300071 0.0652668
21 Bharati Airtel 0.01280456 0.66250771 0.476047 9.60313 12.6053066 0.0635157
22 HDFC 0.01655834 0.67906605 0.944701 10.54783 13.7469705 0.0596964
23 ONGC 0.00514756 0.68421361 0.605925 11.15376 14.4792257 0.0571071
24 L&T -0.0023183 0.6818953 0.230908 11.38466 14.7582759 0.0558374
25 Cipla -0.0039992 0.67789606 0.121108 11.50577 14.9046335 0.0549649
26 SBI -0.0178904 0.6600057 0.516207 12.02198 15.5284656 0.0513644
27 Coal India -0.006043 0.65396269 0.143156 12.16514 15.7014689 0.0503334
28 Tata Power -0.0110228 0.64293988 0.235145 12.40028 15.9856393 0.0486053
29 Sun Pharma -0.004663 0.63827693 0.048759 12.44904 16.0445640 0.0480756
30 NTPC -0.0178301 0.62044679 0.1637 12.61274 16.2423943 0.0461634
Sources: Authors Compilation
Table-4: Proportion of Investment in Each Stock
S. No. Stock Proportion of Investment
1 Dr. Reddy 0.208028
2 TCS 0.168328
3 HR Motors 0.228053
4 Maruthi Suzuki 0.172822
5 Hindalco 0.074597
6 Tata motors 0.098071
7 HUL 0.050099
Sources: Authors Compilation
FINDINGS OF STUDY
It is found in the study that among the stocks under study, Hindalco stock has highest average daily returns and NTPC
has the lowest average daily returns. Therefore, comparatively, the most profitable stock is Hindalco.
It is clear from the study that Cipla stock has the lowest systematic risk and Axis bank stock has the highest systematic
risk compared to other stocks under study.
It is revealed in the study that Reliance has the lowest unsystematic risk and sun Parma has the highest unsystematic risk
compared to other stocks under study.
Volume 4, Number 1, January – March’ 2015
ISSN (Print):2279-0896, (Online):2279-090X
PEZZOTTAITE JOURNALS SJIF (2012): 2.844, SJIF (2013): 5.049
International Journal of Applied Financial Management Perspectives © Pezzottaite Journals. 1618 |P a g e
As per study it is clear that Dr. Reddys stock has the highest (0.248313) excess return- beta ratio and NTPC has the
lowest (-0.10892) excess return-beta ratio.
It is found in the study that the cut-off point is 0.11198455and it is obtained for the seventh ranked stock.
The study shows the fact that highest proportion of investment is to be made 0.228053 in Hero Motorcorp stock and
lowest investment is to be made (i.e., 5.6421%) in HUL stock to construct the optimal portfolio.
CONCLUSION
Sharpe‘s model is a scientific technique, which can be used to construct the optimal portfolio. In this study out of thirty stocks
selected for the study, only seven stocks are suitable to construct the optimal portfolio. The stocks supposed to be included for the
constructions of optimal portfolio are; Dr Reddy‘s, TCS, Hero Motor Corp, Maruti Suzuki Hindalco Tata motor HUL. The
investor has to decide about the proportion of investment in each security as found in the study to make the investment more
scientific. Finally, it can be concluded that present study will help the investors to create optimal portfolio and help the investors
as a guiding record in future.
REFERENCES
1. Balla, V. K. (2002). Portfolio Analysis and Management. New Delhi: Sulthan Chand and Company Limited.
2. Bhat, Sudhindra. (2008). Security Analysis and Portfolio Management. New Delhi: Excel Books.
3. Booie, Zvi, & Kane, Alex. (et. al.). (2006). Investments (6th Edition). New Delhi: Tata McGraw Hill.
4. Chandra, Prasanna. (2008). Investment Analysis and Portfolio Management (3rd Edition). New Delhi: Tata McGraw
Hill.
5. Fisher, E. Donald, & Jordan, J. Ronald. (2006). Security Analysis and Portfolio Management. Pearson Prentice Hall.
6. Retrieved from http://www.bseindia.com/markets/equity/EQReports/StockPrcHistori.aspx?flag=0&expandable=7
7. Retrieved from http://www.rbi.org.in/scripts/BS_ViewBulletin.aspx?Id=15232
8. Kevin, S. (2008). Portfolio Management (2nd Edition). New Delhi: PHI Learning Private Limited.
9. Pandian, Punithavathy. (2004). Security Analysis and Portfolio Management. New Delhi: Vikas Publishing House
Private Limited.
10. Reilly, K. Frank, & Brown, C. Keith. (2006). Investment Analysis and Portfolio Management (8th Edition). New Delhi:
Cengage Learning India Private Limited.
11. Retrieved from http://in.linkedin.com/in/amulyaberi
12. Retrieved from http://pezzottaitejournals.net/index.php/IJAFMP/article/view/179
13. Retrieved from http://www.studymode.com/essays/Portfolio-Theory-And-The-Capital-Asset-273128.html
14. Retrieved from http://www.termpaperwarehouse.com/essay-on/Emerging-Markets/122143
15. Retrieved from
http://www.academia.edu/4400870/A_Study_on_Determinants_of_Risk_and_Return_of_Security_Analysis_and_...
16. Retrieved from
http://connection.ebscohost.com/c/articles/88009463/construction-optimum-portfolio-special-reference...
17. Retrieved from http://in.linkedin.com/in/amulyaberi
18. Retrieved from http://pezzottaitejournals.net/index.php/IJAFMP/article/view/179
*****