consultant management estimating tool
TRANSCRIPT
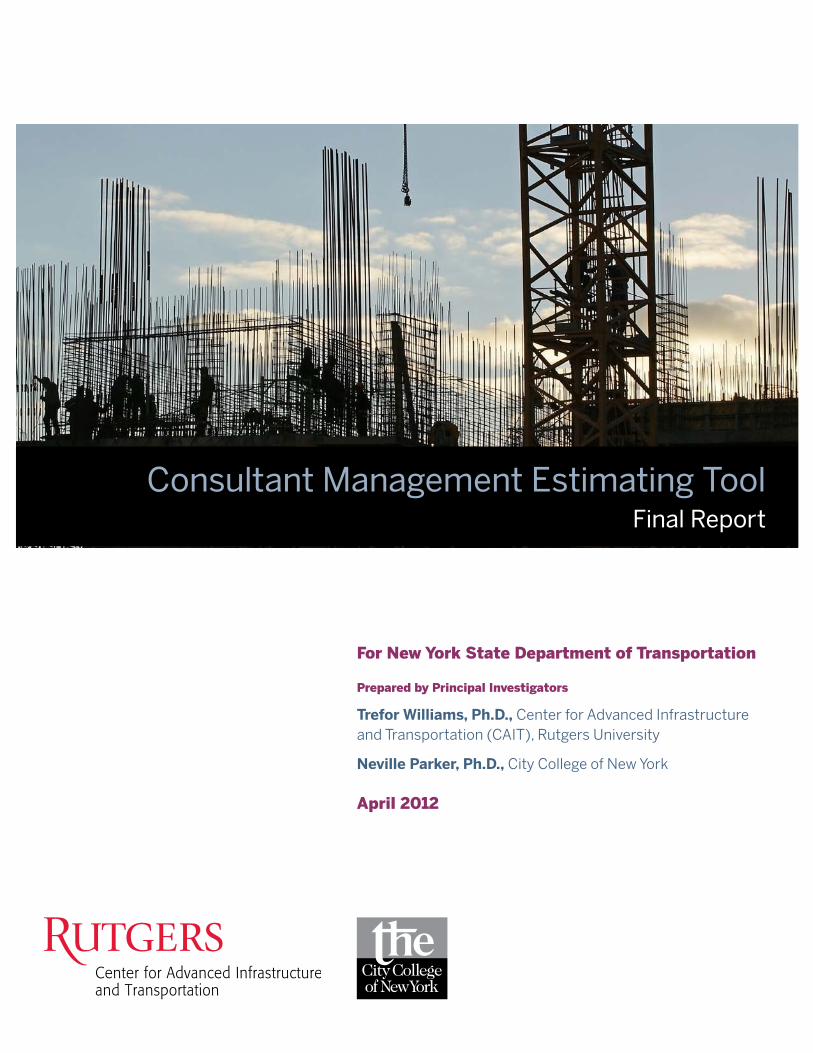
For New York State Department of Transportation
Prepared by Principal Investigators
Trefor Williams, Ph.D., Center for Advanced Infrastructure and Transportation (CAIT), Rutgers University
Neville Parker, Ph.D., City College of New York
April 2012
Consultant Management Estimating Tool Final Report
Disclaimer StatementThis report was funded in part through grant(s) from the Federal Highway Adminis-
tration, United States Department of Transportation, under the State Planning and
Research Program, Section 505 of Title 23, U.S. Code. The contents of this report do
not necessarily reflect the official views or policy of the United States Department of
Transportation, the Federal Highway Administration or the New York State Department
of Transportation. This report does not constitute a standard, specification, regulation,
product endorsement, or an endorsement of manufacturers.

TECHNICAL REPORT STANDARD TITLE PAGE 1. Report No. 2.Government Accession No. 3. Recipient’s Catalog No.
C-06-15
4. Title and Subtitle 5. Report Date Develop Consultant Management Estimating Tools April 2012
6. Performing Organization Code
7. Author(s) 8. Performing Organization Report No. Williams, Trefor, Ph.D. and Parker, Neville, Ph.D.
9. Performing Organization Name and Address 10. Work Unit No.
Rutgers, The State University of New Jersey Center for Advanced Infrastructure and Transportation 100 Brett Road Piscataway, NJ 08854-8014
11. Contract or Grant No.
12. Sponsoring Agency Name and Address 13. Type of Report and Period Covered Final Report
06/01/2008-12/31/2011 14. Sponsoring Agency Code
15. Supplementary Notes
16. Abstract
The New York State Department of Transportation (NYSDOT) Consultant Management Bureau’s primary responsibilities are to negotiate staffing hours/resources with engineering design consultants, and to monitor the consultant's costs. Currently the Consultant Management Bureau uses knowledge of past and current projects as well as engineering judgment to estimate consultant costs. The proposed research will focus on several major issues: • The establishment of a central database that contains historic total project cost and staffing level data. • The development of a computer based estimating tool that employs the data from the historical database to provide more accurate and efficient estimates of consultant resources. • We will identify the major variables that affect the consultant's hours and develop predictive models. We will study multiple regression analysis as a method for developing the models. We will only consider techniques that can easily be incorporated in an Excel spreadsheet. • The NYSDOT already employs an excel spreadsheet based estimating tool. We will determine how to best integrate the new computer tool with the existing spreadsheet. We will also explore how the developed estimating tool can exchange data with Primavera software. One meeting will be held with other interested parties in the NYSDOT to discuss the possibilities for integration • Training will be provided including at least three PowerPoint presentations to NYSDOT engineers. The meeting will occur in the main office, downstate, and in the Buffalo area. The PowerPoint presentations produced for the meetings will be provided to NYSDOT as a deliverable. A users manual will be developed to assist Consultant Managers using the system.
17. Key Words 18. Distribution Statement NYSDOT, Consultant Management, Estimating Tools, linear regression, correlation analysis
19. Security Classif (of this report) 20. Security Classif. (of this page) 21. No of Pages 22. Price
Unclassified Unclassified
Form DOT F 1700.7 (8-69)
City College of New York The University Transportation Research Center 230 West 41st Street New York, NY 10036
New York State Department of Transportation Albany, NY 12232
table of contentsIntroduction . . . . . . . . . . . . . . . . . . . . . . . . . . . . . . . . . . . . . . . . . . . . . . . . . . . . . . . . . . . . . . . . . . . . . . . 1
Data Collection and Analysis . . . . . . . . . . . . . . . . . . . . . . . . . . . . . . . . . . . . . . . . . . . . . . . . . . . . . . . . .2
Statistical Analysis of the Collected Data . . . . . . . . . . . . . . . . . . . . . . . . . . . . . . . . . . . . . . . . . . . . . . . . . 2
Correlation Analysis . . . . . . . . . . . . . . . . . . . . . . . . . . . . . . . . . . . . . . . . . . . . . . . . . . . . . . . . . . . . . . . . . . . . 2
Regression Models . . . . . . . . . . . . . . . . . . . . . . . . . . . . . . . . . . . . . . . . . . . . . . . . . . . . . . . . . . . . . . . . . . . . . 3
Regression through the Origin . . . . . . . . . . . . . . . . . . . . . . . . . . . . . . . . . . . . . . . . . . . . . . . . . . . . . . . . . . . 5
Other Modeling Techniques . . . . . . . . . . . . . . . . . . . . . . . . . . . . . . . . . . . . . . . . . . . . . . . . . . . . . . . . . . . . . . 5
Development and Implementation of the Consultant Management Estimating Tool . . . . . . . . . . . . . 5
Conclusions and Suggestions for Further Research . . . . . . . . . . . . . . . . . . . . . . . . . . . . . . . . . . . . . . . . . 6

1
introductionThe New York State Department of Transportation regularly contracts with engineering
consultants for design services for some of their capital improvement projects. The con-
tracts are administered through their Consultant Management Bureau, which includes
establishing the scope of work for a project and preparing an independent staffing esti-
mate for the design effort involved.
Because the department places a strong emphasis on fulfilling their responsibility to negotiate reasonable design
staffing hours with consultants as part of the department’s consultant acquisition process, it was decided to create
an independent resource estimating tool.
This report outlines the steps taken to produce a resource estimating tool that can be used to estimate a reasonable
design effort based on certain characteristics that are inherent for each of the department’s projects.
These characteristics were gathered and evaluated by a technical working group (TWG) comprising of NYSDOT and
FHWA personnel in collaboration with the University Transportation Research Center (UTRC)
Based on expert opinion, the following project characteristics were established and evaluated:
1. Complexity
2. Project type
3. Number of sub-consultants
4. Construction costs
5. Number of lanes
6. Number of plan sheets
7. State Environmental Quality Review (SEQR) classification
8. National Environmental Policy Act (NEPA) classification
9. Predominant bridge type
10. Number of bridges
11. Highway classification
12. Length of project
The goal of this project was to produce a computer tool that can be used by NYSDOT personnel to find historical in-
formation about the design hours required for NYSDOT highway and bridge projects that are similar in character. The
developed Microsoft Access database allows users to search for data about projects that match the characteristics
of a new project to help in negotiations with design consultants. Topics to be discussed in this final report include the
data collection efforts, the analysis of the available data, and the estimating tool developed using Microsoft Access.

2
Data Collection and AnalysisNYSDOT provided hourly staffing data from 73 past
projects, from which a spreadsheet of consultant design
hours for said projects was developed. Upon examination
of the data, it was found that 64 projects had enough
data to record hours associated with task levels outlined
in the department’s base scope of services (BSOS). The
spreadsheet also included several factors that influence
the number of design hours. These were identified by
the project TWG and were included in the project for
analysis purposes. Variables included the project com-
plexity, the type of project, the total cost of the project,
and the number of plan sheets.
Statistical Analysis of the Collected DataFigure 1 shows the median values found for the various
design functions, and Figure 2 shows the mean values
found for the design functions. The 1000 level tasks
are planning, 2000 tasks are design survey, 3000 are
right-of-way surveys, 4000 tasks are preliminary design,
5000 tasks are in the area of socio/environmental
impacts, bridge design is 7000, and 8000 are manage-
ment tasks. It was noted that the highest values were
in the 6000 category, which is final design.
Correlation Analysis A correlation analysis was conducted to determine
the relationship between the total project hours
and other project variables including the number of
sub-consultants, the number of plan sheets, the total
project cost, and the project complexity. The Pearson
correlation coefficient was calculated using the SPSS
statistical software (Sheskin 1997). The coefficient de-
scribes the linear relationship between variables. The
coefficient can take any value between -1 and +1. A
zero coefficient means the variables are not correlated.
Coefficients of +1 mean the variables are completely correlated. Values of -1 mean variables are perfectly negatively cor-
related, where as one variable increases, the other decreases. Table 1 shows the correlation table generated for the project
data. The table shows that the total project hours have statistically significant positive correlations with the total project
Figure 1. Median Values for Design Hours
Figure 2. Mean Values for Design Hours Correlation Analysis

3
cost, the total number of plan sheets, and the number of lanes. The number of sub-consultants is also highly correlated;
however, the expert opinion of the TWG indicates that the number of sub-consultants is not an independent variable that
should be included in further analysis because it is dependent on the number of estimated design hours, and requires D/
MWBE participation and specialized services.
Total Hours Const. Cost No. Plan Sheets Length (mi.) No. Lanes No. Subs
Total Hours Pearson Correlation 1 .838 ** .535 ** .345 .495 ** .516 **
Sig. (2-tailed) — .000 .009 .062 .005 .000
N 69 38 23 30 31 49
Construction Cost Pearson Correlation .838 ** 1 .750 ** .182 .263 .333
Sig. (2-tailed) .000 — .000 .395 .204 .054
N 38 40 25 24 25 34
No. Plan Sheets Pearson Correlation .535 ** .750 ** 1 .172 .080 .116
Sig. (2-tailed) .009 .000 — .556 .786 .637
N 23 25 25 14 14 19
Length (mi.) Pearson Correlation .345 .182 .172 1 .191 -.079
Sig. (2-tailed) .062 .395 .556 — .304 .694
N 30 24 14 31 31 27
No. Lanes Pearson Correlation .495 ** .263 .080 .191 1 .547 **
Sig. (2-tailed) .005 .204 .786 .304 — .003
N 31 25 14 31 32 28
No. Subs Pearson Correlation .516 ** .333 .116 -.079 .547 ** 1
Sig. (2-tailed) .000 .054 .637 .694 .003 —
N 49 34 19 27 28 50
Table 1. Correlations
** Correlation is significant at the 0.01 level (2-tailed).
Regression ModelsRegression was studied to determine if simple or multiple linear regression models could be used to provide accurate
predictions of total project hours and then be incorporated in the developed estimating support tool. The object of linear
regression is to use the linear relationship between a response (dependent) variable and factor (independent) variables
to predict or explain the behavior of the response variable. For this project the response variable was the design hours, as
well as other variables such as the project cost, and the independent variable was the number of plan sheets. Other factors
that were considered but not included in the model were project type (e.g., new or rehabilitation project).

4
Development of Regression Models To develop a linear regression equation, the stepwise equation-building technique and the backward elimination equa-
tion-building technique were employed. The stepwise procedure examines the significance of each input variable. Vari-
ables that are statistically significant are added to the regression equation. The order of insertion is determined by using
the partial autocorrelation coefficient as a measure of importance of variables not yet in the equation (Draper and Smith,
1981). Depending on the significance of the input variables, the technique can yield a simple or a multiple regression
equation. This technique is implemented in the SPSS statistical software package (Norusis, 1993). Using the stepwise
procedure, all of the variables identified by the TWG were considered for inclusion in the model. The stepwise proce-
dure examines the significance of each input variable. Variables that are statistically significant are added to the regression
equation. One simple equation was produced that relates the total project hours to the project construction cost.
The backward technique was also used to develop regression models. It is a method for sequentially removing variables,
which begins with a model containing all independent variables; the variables that change R2 the least are then removed.
Using this technique, multiple regression models were produced using several variables. It yielded a model that predicted
total hours based on the number of plan sheets, the number of lanes, and the project length in miles.
Regression Models Using Consultant DataUsing analyzed data from 73 projects designed by consultants, several regression models were constructed with project
cost, number of lanes, project length, and number of plan sheets as factor (independent) variables.
The database contained cases with missing data; in some instances this resulted in a lower number of independent vari-
able combinations for use in model building. It is anticipated that as more data is collected the regression models can be
recalculated so that other variable combinations can emerge as the “best” regression equation.
Several models have been studied. The two best performing models are shown in Table 2. R2 is a measure of the
performance of regression models. An R2 of 1 indicates the model and the data are perfectly correlated. At this time it is
recommended that equation one be employed as a predictor of total hours because it is the most parsimonious model and
has the highest R2 value.
State Designed Bridge ProjectsRegression was also applied to bridge projects designed internally by the NYSDOT. These data were used to determine
if a larger data set would result in higher R2. The stepwise regression method was applied with 202 cases in the database
used for analysis. The regression equation was found to be:
Total Hours = 519.249 + 93.408(No. of Plan Sheets)
The R value for this regression equation is 0.792 and the R2 value is 0.628. This regression R2 was similar to the R2
results reported for the regression models using the consultant data.
Table 2. Regression Models for Consultant Data
Model Number No. of Cases Model Equation R R2
1 22 Total Hours = (.001)Construction Cost + 8223.14 .830 .689
2 12Total Hours = (28)No. Plan Sheets + (793.14)No. of Lanes – (1108.603)Length + 10593.607
.792 .628

5
Regression through the OriginWhen using the regression equations derived from the consultant, it became apparent that the equation gave impractical
predictions. In particular, if there were zero plan sheets, because of the constant in the regression equation, the model
produced a positive number as the prediction. To prevent this it was decided to force the regression equation through the
origin to ensure that when there were zero plan sheets, no design hours would be predicted. The best-performing model
using the SPSS software when regression is forced through the origin was found to be:
Total Hours = 95.039(No. of Plan Sheets)
Based on this analysis, it was decided to use this simple relationship between the total hours and the number of plan
sheets in the consultant management decision support tool. However, the database has been programmed to continu-
ously recalculate the regression equation every time there is a search so that new data is automatically included in the
calculation of the simple regression model. It is anticipated that as more data is added, the regression predictions will
become more accurate.
Other Modeling TechniquesThe possibility of employing other modeling techniques to provide predictions of the total project design hours was
explored. Data visualization, data mining, and Monte Carlo simulation were studied to determine if useful predictions
could be produced. Unfortunately, the limited amount of consultant data available did not allow any useful models to be
developed. It is recommended that as the database is expanded and more project information is available, these methods
be restudied.
Development and Implementation of the Consultant Management Estimating ToolA Microsoft Access database was developed to provide a tool for retrieving historical information about consultant hours
from past projects, and to produce predictions of total hours required using the regression modeling technique studied in
the data analysis phase of the project. The project data collected formed the initial database for the estimating tool.
The estimating tool was designed to have a hierarchical structure of menus to provide an easy-to-use interface. The
functions and format of the database were developed in consultation with the TWG. The users’ manual for the consul-
tant management estimating tool is attached as an appendix to this report. The estimating tool has the following major
functions:
• Searchprojects.Thisfunctionallowsdataaboutprojectstoberetrievedfromthedatabase.Userscansearchusing
matching criteria to find historical projects similar to a new project they are initiating.
• Editandviewdata.Thisfunctionallowsrecordstobemodifiedandupdated.
• Insertandautomaticallyimportdata.TwoMicrosoftExcelspreadsheettemplatesweredevelopedthatcanbefilledin
to record estimated and actual hours, which are automatically uploaded to the estimating tool.
• Estimateoftotalhoursusingregressionanalysis.Thisfunctionprovidesamethodofobtainingpredictionsofthetotal
project hours required based on the number of project plan sheets. Users have the ability to filter the projects used for
the regression calculation. The equation is not fixed but is recalculated continuously based on the filter settings and
the projects contained in the database. Therefore, the prediction is expected to become more accurate as projects are
added to the database.
• Overviewgraphs.Theoverviewgraphsprovideuserswithpiechartsthatdescribethecharacteristicsofprojectscon-
tained in the database.

6
The consultant management estimating tool was tested extensively in the summer of 2011 by the NYSDOT. This pro-
vided the opportunity to thoroughly debug the operations of the tool and make modifications and enhancements based
on TWG suggestions.
Conclusions and Suggestions for Further ResearchThe estimating tool was developed as a practical application to provide enhanced information to NYSDOT consultant
management personnel. Extensive consultations with the TWG have allowed for the production of a useful tool that
conforms to the needs of the NYSDOT.
Several modeling techniques were studied to develop predictive models of total design hour requirements. Due to the
relatively small amount of data that was available, a simple relationship between the number of plan sheets and the total
hours for the established regression model were used. More data will be added to the consultant management estimating
tool as it is used by the NYSDOT. It is suggested that at some future date it will be useful to:
• Re-evaluatetheparametersusedintheregressionmodel.Asmoredatabecomesavailable,amoresophisticatedmul-
tiple regression model may yield improved predictions.
• Considerothermodelingtechniques.Withmoreprojectdataitmaybepossibletodevelopaccuratepredictionsusing
other data mining techniques, like machine learning and simulation methods such as the Monte Carlo technique.

7
AcknowledgementsWe would like to acknowledge James Klotz and all members of TWG for providing their valuable insights during the course
of the project.
ReferencesDraper, N. R. and Smith, H. (1981) Applied Regression Analysis, 2nd Ed., Wiley, New York.
Norusis, M. J. (1993) SPSS for Windows Base System User’s Guide, Release 6.0, SPSS, Inc., Chicago, IL.
Sheskin, David J. (1997) Handbook of Parametric and Non-Parametric Statistical Procedures. CRC Press, Boca Raton, FL.

Rutgers, The State University of New Jersey
100 Brett Road
Piscataway, NJ 08854-8058
University Transportation Research Center
Marshak Hall - Science Building, Suite J-910
The City College of New York
138th Street & Convent Avenue
New York, NY 10031
NYMTC RU0054 / April 2010