consumer analyst group of new york
TRANSCRIPT

CAGNY 2020
Consumer Analyst Group of New YorkRavi Saligram – President and Chief Executive Officer Chris Peterson – Chief Financial Officer and President, Business Operations

2© Newell Brands
Some of the statements in this presentation and its exhibits, particularly those anticipating future financial performance, business prospects, growth, operating strategies and similar matters, are forward- lookingstatements within the meaning of the U.S. Private Securities Litigation Reform Act of 1995. These statements generally can be identified by the use of words or phrases, including, but not limited to, “intend,”“anticipate,” “believe,” “estimate,” “project,” “target,” “plan,” “expect,” “setting up,” beginning to,” “will,” “should,” “would,” “resume” or similar statements. We caution that forward-looking statements are notguarantees because there are inherent difficulties in predicting future results. Actual results may differ materially from those expressed or implied in the forward-looking statements. Important factors that couldcause actual results to differ materially from those suggested by the forward-looking statements include, but are not limited to:
• our dependence on the strength of retail, commercial and industrial sectors of the economy in various countries around the world;• competition with other manufacturers and distributors of consumer products;• major retailers’ strong bargaining power and consolidation of our customers;• our ability to improve productivity, reduce complexity and streamline operations;• future events that could adversely affect the value of our assets and/or stock price and require additional impairment charges;• our ability to remediate the material weakness in internal control over financial reporting and to consistently maintain effective internal control over financial reporting;• our ability to develop innovative new products, to develop, maintain and strengthen end-user brands and to realize the benefits of increased advertising and promotion spend;• risks related to our substantial indebtedness, a potential increase in interest rates or changes in our credit ratings;• the impact of costs associated with divestitures;• our ability to effectively execute our turnaround plan;• changes in the prices of raw materials and sourced products and our ability to obtain raw materials and sourced products in a timely manner;• the impact of governmental investigations, subpoenas, lawsuits or other actions by parties;• the risks inherent to our foreign operations, including foreign exchange fluctuations, exchange controls and pricing restrictions;• a failure of one of our key information technology systems, networks, processes or related controls or those of our service providers;• the impact of U.S. and foreign regulations on our operations, including the escalation of tariffs on imports into the U.S. and exports to Canada, China and the European Union, environmental remediation
costs and data privacy regulations;• the potential inability to attract, retain and motivate key employees;• the impact of new Treasury and tax regulations and the resolution of tax contingencies resulting in additional tax liabilities;• product liability, product recalls or related regulatory actions;• our ability to protect intellectual property rights;• significant increases in funding obligations related to our pension plans; and• other factors listed from time to time in our filings with the Securities and Exchange Commission, including, but not limited to, our Annual Report on Form 10-K and our Quarterly Reports on Form 10-Q.
The information contained in this presentation and the tables is as of the date indicated. The company assumes no obligation to update any forward-looking statements as a result of new information, futureevents or developments.
This presentation and the accompanying remarks contain non-GAAP measures. An explanation of the analogous GAAP measures, if available, and reconciliations are contained in the Appendix after slide 45.
Forward Looking Statements

3© Newell Brands
Key Messages for CAGNY 2020
Strong foundation of iconic brands with leading market positions
Turnaround Plan on track and yielding results
Making progress towards financial benchmarks
Clear set of near-term priorities and strategic roadmap

4© Newell Brands
Newell at a Glance in 2019

5© Newell Brands and Ball® TMs Ball Corporation, used under license.
Portfolio of Iconic Brands

6© Newell Brands Note: Market share positions based on data from NPD, IRI and Kline.
$18BU.S. market
in categories where we are
#1 or #2
Markers
Highlighters
Car Seats
Strollers
Residential Fire Detection
Slow Cookers
Durable / Semi Durable Food Storage
Canning
Thermal Beverage Containers
Vacuum Sealers
Example Categories
79% of U.S. Sales Are in Categories Where We Are a Market Leader

7© Newell Brands
Current Portfolio Strength Is Varied
WritingBaby
Home Fragrance Connected Home & Security
FoodCommercial
Outdoor & RecreationAppliances & Cookware
✓ Proven strategies✓ Strong innovation pipeline✓ Executional focus
✓ Refreshed strategies✓ Good innovation pipeline✓ Building executional discipline
❑ Developing strategies ❑ Rebuilding innovation foundation❑ Execution needs strengthening
45% of ’19 net sales 23% of ’19 net sales 32% of ’19 net sales

8© Newell Brands
2019 Sales and Operating Income by Segment
17%
23%
29%
31%
Net Sales by Segment
Learning & Development
Home & Outdoor Living
Food & Commercial
Appliances & Cookware
$9.7B
6%
28%
15%
51%
Operating Income by Segment1
Learning & Development
Home & Outdoor Living
Food & Commercial
Appliances & Cookware
$1.0B
1. Operating income is Normalized and the segment percentages are based on approximately $1.2B in normalized operating income, which excludes corporate expenses

9© Newell Brands
Strong Baseline eCommerce Penetration with Opportunity to Expand
Baby Appliances &Cookware
Outdoor &Recreation
HomeFragrance
ConnectedHome
Writing Food Commercial
FY 2019, Global, % of net sales from eCommerce 15%eCommerce
NWL Global

10© Newell Brands
Significant International Opportunity
United States International
67%
33%
Total Newell ConnectedHome
HomeFragrance
Food Baby Commercial Writing Appliances &Cookware
Outdoor &Rec.
2019 Revenue by Geography

11© Newell Brands
Roadmap to Address Five Key Strategic Issues
Key Issues
Growth Complexity Overheads Structure Culture
2019 2020 2021+Turnaround Initiated Turnaround Takes Hold Delivering the Potential
Roadmap

12© Newell Brands
2019 Turnaround Initiated
2019 – Pivoted from Transformation to Turnaround 2020 2021+
Turnaround Takes Hold
Delivering the Potential
Roadmap
Developed Turnaround Plan
Enhanced digital strategy
Completed divestiture program
Initiated complexity reduction
Improved cash generation

13© Newell Brands
2020 Turnaround Takes Hold
2019 2020 – Foundational Year for Turnaround 2021+
Turnaround Initiated
Delivering the Potential
Roadmap
Leadership Team in place
Challenged businesses turnaround
Address tail categories and channels
FUEL initiative
Complexity reduction
Working capital improvement and debt reduction

14© Newell Brands
2021+ Delivering the Potential
2019 2020 2021+ – Footing Reestablished
Turnaround Initiated
Turnaround Takes Hold
Roadmap
Return to growth
International momentum
Winning culture
Innovation, customer collaboration and execution
Deleveraging to 3X
Market leading cash flow productivity

15© Newell Brands
How We Will WinN
ewel
l’s 5
Cs
1) Culture of Winning 'A players', domain expertise and team work
2) Consumer First Consumer First mindset; trend spotting
3) Customer Collaboration Renowned for customer collaboration
4) Channel Management Omnichannel focus
5) Continuous Improvement & Innovation
• Supply chain productivity • Leverage disparate technologies

16© Newell Brands
Moving to a Consumer First Approach
Who we are
End benefit
Organizational Mindset
We provide consumers affordable indulgences that brighten everyday lives!
Moments of happiness
Never disappoint….fulfill promises

17© Newell Brands
New Leadership Appointments
Kris Malkoski | Food Business Unit CEO• President for the Americas at Arc International
• President, Global Business and Chief Commercial Officer at World Kitchen
• GM, New Business Development, Healthcare at Procter & Gamble
Steve Parsons | Chief Human Resources Officer• Global Operating Partner, Human Capital at Z Capital
Partners
• Chief Human Resources Officer at Stage Stores
• EVP and Chief HR Officer at OfficeMax
Mike McDermott | Commercial Business Unit CEO• President, Omni-Channel Retail, at Bass Pro Shops
• EVP and Chief Customer Officer at Lowe’s
• Head of Sales at GE Appliances
Jim Pisani | Outdoor & Recreation Business Unit CEO• Global Brand President, Timberland, VF Corporation
• President, Licensed Sports, VF Corporation
• VP Business Development, PepsiCo

18© Newell Brands
Reigniting Core Sales GrowthInnovation
• Build on momentum in growth businesses• Continue improvement in Food and Commercial• Rebuild A&C and O&R innovation foundations• Rejuvenate brands for today’s consumer• Internet of Things (IoT)
eCommerce and Social Marketing• Achieve towering competitive advantage in
eCommerce and Social Marketing• Improve digital IQ of businesses and become a
truly digital-first company• Accelerate retail.com growth
U.S. Distribution Gaps• Close gaps in non-mass channels (e.g. Grocery,
Dollar, Drug)• Leverage Newell’s scale vs. individual business
units
Customer Collaboration and Execution• Become an exemplary business partner through
joint business planning and excellent customer service / fulfilment accuracy
• Top to top relationships
1 2
3 4
International• Focus on key drive countries and categories to build scale
5

19
Best-in-Class Business Gel Pen
CONTOURED GRIPFor comfortable writing
BEST-IN-CLASS WRITINGAlways vivid ink that won’t smear or bleed
CHROME RINGSIndicates ink color: Black, Blue, Red
MATTE FINISH Sleek, modern design
DURABLE CLIPFeatures chrome branding & point size indicator
CHROME CLICKER
BEST-IN-CLASS DESIGNOutperforms the market leader
POINT SIZES0.5, 0.7, 1.0
PACK TYPESBlister: 2, 4, 8, 12 countsBox: 12, 36 counts
S•GEL™
®

20
S• GEL™
2020 Pen Innovation
Profile Gel
Ballpoint
Gel
Roller
Profile Ball 1.0
ROLLER

21© Newell Brands 21
FoodSaver®
Handheld Vacuum SealerThis lightweight, easy to use vacuum sealer is convenient for your food preservation needs. The FoodSaverHandheld Vacuum Sealer works with FoodSaver zipper bags and vacuum containers making it easy to lock in freshness.

22© Newell Brands 22
For over 7 years, the Graco Modes™ stroller has provided versatility and function, growing with the family from newborn to big kid. And now, the newest member of the Modes family, Modes™ Nest offers the ability to bring baby closer with the Slide2Me™ height adjustable seat.
Supporting Modes Nest is the redesign and relaunch of the full Modes family of travel systems with Modes Basix, Modes Element and Modes Pramette.
Graco Modes™ Nest

23© Newell Brands 23
WoodWick®
Outdoor Candle
The perfect décor focal point for outdoor gatherings. Four wicks with PlusWick® Innovation provides ample glow while creating a soothing crackle that adds to the ambiance. Premium WoodWick ® candle fragrances are specifically formulated for the outdoors.Oversized, wood textured ceramic is beautifully accented by a rich interior glaze. When all the wax is gone, use the oversized vessel as planter.

24© Newell Brands
Bringing News Across Portfolio

25© Newell Brands
We Will FUEL the Future with an Enterprise Wide Productivity Initiative
Growth Investments
Margin Improvement

26© Newell Brands
Near-term Priorities
Restart Growth Engine
Build a Winning Team
Aggressive Focus on
Cash,Margin and
Debt Reduction

27© Newell Brands
Sustainable Profitable
Growth
Attractive Margins
Cash Efficiency
Winning Team
Strengthen Portfolio
Invest in attractive categories
aligned to our capabilities and
strategy
Engage our team and focus the best people on the right things
Focus on innovation,
digital marketing, eCommerce and
international
Drive productivity and overhead
savings to generate fuel for
the business
Dramatically improve DSO, DPO and DIO
across the company to lower CCC
Turnaround Plan Is on Track

28© Newell Brands
Business Key brands Timing
Waddington Jun ’18
Team Sports Jun ’18
Beauty Aug ’18
Fishing Dec ’18
Jostens Dec ’18
Process Solutions May ’19
Rexair May ’19
US Playing Cards Dec ‘19
$6.1B After-Tax Proceeds
Divestiture Program Is Complete

29© Newell Brands
Accelerating Core Sales Growth in 2019FY 2018 FY 2019
Connected Home & Security
Writing
Baby
Home Fragrance
Food
Outdoor & Recreation
Appliances & Cookware
Commercial
NWL Core Sales Growth -5.2% -1.9%
Note: 2018 excludes Commercial (RCP, Mapa/Spontex, Quickie); 1H 2019 excludes Commercial. Q3 2019 excludes Mapa/Spontex & Quickie

30© Newell Brands
International Core Sales Growth Accelerated to 2.9% in 2019 from a 1.7% Decline in 2018
EMEA+2.3% in’19
APAC+0.1% in ’19
LATAM+7.0% in ’19
Note: International core sales growth includes all geographies outside North America

31© Newell Brands
In 2019, We Enhanced eCommerce and Digital Marketing
Redesigning digital technology platform
Rationalized brand and DTC sites to reduce cost and increase focus• Reducing number of websites from 290 to 42• Showcasing new product innovation and brand storytelling• Limited DTC sites where scale is achievable and we can offer unique consumer proposition
Built social and influencer marketing capabilities
Extended analytics tool set and began AI/machine learning tests
Enhanced omni-channel marketing across the company

32© Newell Brands
Driving Gross Margin Expansion
35%34%
37% – 38%
Opportunity Actions
Note: 2019 figures are normalized; 2018 Baseline as presented at CAGNY 2019, prior to reclassification of Rubbermaid Commercial Products, Mapa/Spontex and Quickie to continuing operations; Benchmark based on representative peer group of consumable and durables companies

33© Newell Brands
'18 Funnel for '19 '19 Funnel for '20
2020 Funnel Build
Productivity Momentum Is Building

34© Newell Brands
Reducing SKU Complexity
50% Targeted SKU Reduction by 2021
Pursuing low risk opportunities
Multi-lingual
Customer specific
Variety packs
Excess and obsolete
102K
74K
~50K
2018 2019 2021
# of SKUs
28K SKUs taken out in 2019
Note: includes Rubbermaid Commercial, Quickie, and Mapa/Spontex

35© Newell Brands
Improving Forecast Accuracy
Shorter manufacturing cycle times
Improved labor efficiencies
Optimized inventory levels with less excess and obsolete inventory
Improved on-time delivery and fill rates
Reduction of expediting costs
36%
42%
60%
2018 2019 Aspiration
+610bps YOY

36© Newell Brands
Opportunity Actions
Reduced Overheads by 200 bps in 2019
21%19%
16% - 17%
Note: 2019 figures are normalized; 2018 Baseline as presented at CAGNY 2019, prior to reclassification of Rubbermaid Commercial Products, Mapa/Spontex and Quickie to continuing operations; Benchmark based on representative peer group of consumable and durables companies

37© Newell Brands
Made Significant Progress in 2019 on IT Systems and Infrastructure Consolidation
Completed 4 SAP implementations
Consolidated 16 diversified data centers into single private cloud
35 exchange environments retired and integrated into MSO365 environment
Consolidated 24 help desks into single platform
Rationalized more than 2,700 IT applications

38© Newell Brands
Year End Actuals/Estimates (sq. ft. and site count)
2.7
2.5
2.3
2018 2019 2020
Office Space (Square Feet M)
# of Sites 134 126 ~116
Real Estate Footprint Reduction

39© Newell Brands
Operating Margin Progress in 2019
9.1%
10.8%
2018 Baseline 2019
Normalized Operating Margin
+120 bps from portfolio decisions
+50 bps operating improvement
Note: 2018 Baseline as presented at CAGNY 2019, prior to reclassification of Rubbermaid Commercial Products, Mapa/Spontex and Quickie to continuing operations

40© Newell Brands
Strong Cash Flow Performance
$779MFree Cash Flow
+164% vs. 2018
$1BOperating Cash Flow
+54% vs. 2018
108% in ‘19FCF Productivity
vs. 25% in ‘18

41© Newell Brands
17 Day Cash Conversion Improvement in 2019
2018 Baseline 2019 Benchmark
+ Days Sales 78 69 -
+ Days Inventory 103 92 -
- Days Payables 66 63 -
Cash Conversion 115 98 70
Extended payable terms on 170 strategic suppliers and over 2,000 “tail suppliers”
Faster deduction resolution and process improvements
Reduced excess and obsolete inventory by 28%
Cut 28K SKUs
Roll out of integrated business planning and advanced analytics
Portfolio choices: over 10 days improvement on LFL basis
Note: 2018 Baseline as presented at CAGNY 2019, prior to reclassification of Rubbermaid Commercial Products, Mapa/Spontex and Quickie to continuing operations; Benchmark based on representative peer group of consumable and durables companies

42© Newell Brands
YE 2018 YE 2019
$6.5B
$5.4B
Net Debt
4.0XLeverage
Ratio
1. Net debt to normalized continuing operations EBITDA leverage ratio
Debt Paydown

43© Newell Brands
Establishing Long-Term Aspirational Targets
Core Sales Growth
Low single-digits
Operating Income Margin
50 bps annual increase
FCF Productivity
>100%
Leverage Ratio
3X

44© Newell Brands
Investment Highlights
Strong brands with leading positions in growing categories
Turnaround plan on track and yielding results; expect sequential annual progress
Project FUEL to fund necessary investments to reinvigorate top line growth and drive margin improvement
Dramatic working capital improvement roadmap with proven results
Excess cash deployed towards strengthening balance sheet
Roadmap established to restore growth potential

45
AppendixNon-GAAP Reconciliations
Non-GAAP Financial Measures

46© Newell Brands
CAGNY 2020
Non-GAAP Financial MeasuresThis presentation contains non-GAAP financial measures within the meaning of Regulation G promulgated by the U.S. Securities and Exchange Commission and includes a reconciliation of thesenon-GAAP financial measures to the most directly comparable financial measures calculated in accordance with GAAP.
The company uses certain non-GAAP financial measures that are included in this presentation and the additional financial information both to explain its results to stockholders and the investmentcommunity and in the internal evaluation and management of its businesses. The company’s management believes that these non-GAAP financial measures and the information they provide areuseful to investors since these measures (a) permit investors to view the company’s performance and liquidity using the same tools that management uses to evaluate the company’s pastperformance, reportable business segments, prospects for future performance and liquidity, and (b) determine certain elements of management incentive compensation.
The company’s management believes that core sales provides a more complete understanding of underlying sales trends by providing sales on a consistent basis as it excludes the impacts ofacquisitions, planned and completed divestitures, retail store openings and closings, certain market exits, and changes in foreign exchange from year-over-year comparisons. Core sales also excludethe impact of returns associated with a recall in the Outdoor & Recreation segment. The effect of changes in foreign exchange on 2019 reported sales is calculated by applying the prior year averagemonthly exchange rates to the current year local currency sales amounts (excluding acquisitions and divestitures), with the difference between the 2019 reported sales and constant currency salespresented as the foreign exchange impact increase or decrease in core sales. The company’s management believes that “normalized” gross margin, “normalized” SG&A expense, “normalized”operating income, “normalized” operating margin, “normalized” net income, “normalized” diluted earnings per share, “normalized” income from continuing operations, “normalized” depreciation andamortization, “normalized” EBITDA, “normalized” interest and “normalized” tax benefits, which exclude restructuring and restructuring-related expenses and one-time and other events such as costsrelated to the extinguishment of debt, certain tax benefits and charges, impairment charges, pension settlement charges, divestiture costs, costs related to the acquisition, integration and financingof acquired businesses, amortization of acquisition-related intangible assets, expenses related to certain product recalls and certain other items, are useful because they provide investors with ameaningful perspective on the current underlying performance of the company’s core ongoing operations and liquidity. “Free cash flow productivity” is calculated as the ratio of free cash flow(calculated as net cash provided by operating activities less capital expenditures) to normalized net income, and the company believes that free cash flow productivity is an important indicator ofliquidity realized from the company’s core ongoing operations. “Normalized EBITDA from continuing operations” is an ongoing liquidity measure (that excludes non-cash items) and is calculated aspro forma normalized earnings before interest, tax depreciation, amortization and stock-based compensation expense. “Net debt to normalized continuing operations EBITDA leverage ratio” is aliquidity measure calculated as the ratio of total debt less cash and cash equivalents to normalized earnings before interest, tax, depreciation, amortization and stock-based compensation expense.
The company determines the tax effect of the items excluded from normalized diluted earnings per share by applying the estimated effective rate for the applicable jurisdiction in which the pre-taxitems were incurred, and for which realization of the resulting tax benefit, if any, is expected. In certain situations in which an item excluded from normalized results impacts income tax expense, thecompany utilizes a “with” and “without” approach to determine normalized income tax expense. In the fourth quarter of 2019, these excluded items primarily reflected an income tax benefit of $522million associated with the deferred tax effects associated with the internal realignment of certain intellectual property rights as well as an income tax benefit associated with a taxable loss relatedto the impairment of certain assets.
While the company believes these non-GAAP financial measures are useful in evaluating the company’s performance and liquidity, this information should be considered as supplemental in natureand not as a substitute for or superior to the related financial information prepared in accordance with GAAP. Additionally, these non-GAAP financial measures may differ from similar measurespresented by other companies.

47© Newell Brands
CAGNY 2020
Reconciliation of GAAP and Non-GAAP Information in 2019
GAAP Measure Restructuring Acquisition Transactionsand restructuring amortization and and Other Proforma
related costs impairment related costs items AdjustmentsReported [1] [2] [3] [4] Normalized* [5] Proforma
Net sales $ 9,714.9 $ - $ - $ - $ - $ 9,714.9 $ - $ 9,714.9 Cost of products sold 6,495.5 (15.9) - - (72.4) 6,407.2 20.9 6,428.1Gross profit 3,219.4 15.9 - - 72.4 3,307.7 (20.9) 3,286.8
33.1% 34.0% 33.8%Selling, general and administrative expenses 2,451.0 (38.2) (130.9) (30.4) (15.6) 2,235.9 2.4 2,238.3
25.2% 23.0% 23.0%Restructuring costs, net 27.1 (27.1) - - - - - -Impairment charges 1,223.0 - (1,223.0) - - - - -Operating income (loss) (481.7) 81.2 1,353.9 30.4 88.0 1,071.8 (23.3) 1,048.5
(5.0)% 11.0% 10.8%Non-operating (income) expenses, net 369.9 - - - (56.7) 313.2 - 313.2Income (loss) before income taxes (851.6) 81.2 1,353.9 30.4 144.7 758.6 (23.3) 735.3Income tax provision (benefit) [6] (1,037.7) 19.0 292.9 7.2 783.2 64.6 (6.3) 58.3Income (loss) from continuing operations 186.1 62.2 1,061.0 23.2 (638.5) 694.0 (17.0) 677.0Income (loss) from discontinued operations, net of tax (79.5) (0.2) 84.4 47.7 (7.3) 45.1 - 45.1
Net income (loss) $ 106.6 $ 62.0 $ 1,145.4 $ 70.9 $ (645.8) $ 739.1 $ (17.0) $ 722.1
Diluted earnings (loss) per share ** $ 0.25 $ 0.15 $ 2.70 $ 0.17 $ (1.52) $ 1.74 $ (0.04) $ 1.70
[3] Divestiture costs of $33.8 million ($5.5 million of which is reported in discontinued operations) primarily related to planned and completed divestitures; acquisition related costs of $2.1 million and net gain on dispositions of $7.3 million reported in discontinued operations.
[4] Cumulative depreciation and amortization catch-up of $54.4 million related to the inclusion of the Commercial Business, Mapa and Quickie businesses in continuing operations; loss of $20.5 million due to changes in the fair value of certain investments; Argentina hyperinflationary adjustment of $11.9 million; $19.8 million of costs associated with a product recall; $9.1 million of other charges, primarily related to fees for certain legal proceedings; a loss on extinguishment of debt of $28.3 million; $0.7 million loss on pension settlement and other financial charges and net tax adjustment primarily related to foreign and state tax impacts of offshore earnings and a withholding tax refund from Switzerland. Includes an income tax benefit of $522 million related to the deferred tax effects associated with the internal realignment of certain intellectual property rights as well as an income tax benefit of $227 million associated with a taxable loss related to the impairment of certain assets.
[6] The Company determined the tax effect of the items excluded from normalized results by applying the estimated effective rate for the applicable jurisdiction in which the pre-tax items were incurred, and for which realization of the resulting tax benefit, if any, is expected. In certain situations in which an item excluded from normalized results impacts income tax expense, the Company uses a "with" and "without" approach to determine normalized income tax expense.
[5] Depreciation and amortization expense related to the Commercial Business, and the Mapa and Quickie businesses that would have been recorded had they been continuously classified as held and used.
[1] Restructuring and restructuring related costs of $81.0 million (benefit of $0.2 million is reported in discontinued operations).
[2] Acquisition amortization costs of $130.9 million; impairment charges of $1.3 billion primarily related to tradenames and customer relationships ($1.1 billion) and goodwill ($168.8 million); $112.1 million of which was reported in discontinued operations.
Totals may not add due to rounding.
**Adjustments and normalized earnings per share are calculated based on diluted weighted average shares of 423.9 million shares for the twelve months ended December 31, 2019.
* Normalized results are financial measures that are not in accordance with GAAP and exclude the above normalized adjustments. See below for a discussion of each of these adjustments.
NEWELL BRANDS INC.RECONCILIATION OF GAAP AND NON-GAAP INFORMATION (UNAUDITED)
CERTAIN LINE ITEMS(Amounts in millions, except per share data)
Non-GAAP MeasureTwelve months ended December 31, 2019

48© Newell Brands
CAGNY 2020
Reconciliation of Operating Income by Segment in 2019
Reported Reported Proforma Proforma Reported Reported Proforma Proforma
Operating Operating Excluded Operating Operating Operating Operating Excluded Operating Operating
Net Sales Income (Loss) Margin Items [1] Income (Loss) [3] Margin [3] Net Sales Income (Loss) Margin Items [2] Income (Loss)
[3]Margin [3] $ % $ %
APPLIANCES AND COOKWARE $ 1,691.0 $ (535.3) (31.7)% $ 613.7 $ 78.4 4.6 % $ 1,818.6 $ (1,596.3) (87.8)% $ 1,718.1 $ 121.8 6.7 % $ (127.6) (7.0)% $ (43.4) (35.6)%
FOOD AND COMMERCIAL 2,243.9 (42.3) (1.9)% 386.2 343.9 15.3 % 2,403.6 (1,458.9) (60.7)% 1,817.4 358.5 14.9 % (159.7) (6.6)% (14.6) (4.1)%
HOME AND OUTDOOR LIVING 2,823.4 (173.2) (6.1)% 361.3 188.1 6.7 % 2,946.7 (4,237.7) (143.8)% 4,497.0 259.3 8.8 % (123.3) (4.2)% (71.2) (27.5)%
LEARNING AND DEVELOPMENT 2,956.6 587.2 19.9 % 45.8 633.0 21.4 % 2,981.6 237.9 8.0 % 393.1 631.0 21.2 % (25.0) (0.8)% 2.0 0.3 %
OTHER - - - % - - - % 3.5 3.8 108.6 % - 3.8 108.6 % (3.5) (100.0)% (3.8) (100.0)%
CORPORATE - (291.0) - % 96.1 (194.9) - % - (416.0) - % 89.6 (326.4) - % - - % 131.5 40.3 %
RESTRUCTURING - (27.1) - % 27.1 - - % - (86.8) - % 86.8 - - % - - % - - %
$ 9,714.9 $ (481.7) (5.0)% $ 1,530.2 $ 1,048.5 10.8 % $ 10,154.0 $ (7,554.0) (74.4)% $ 8,602.0 $ 1,048.0 10.3 % $ (439.1) (4.3)% $ 0.5 - %
[1]
[2]
[3] Proforma normalized operating income (loss) and margin reflect an adjustment within excluded items for depreciation and amortization expense of $23.3 million and $31.1 million related to the Commercial Business, and the Mapa and Quickie businesses in the Food and
Commercial segment that would have been recorded had they been continuously classified as held and used.
The twelve months ended December 31, 2018 excluded items consists of $8.3 billion of impairment charges for goodwill and tradenames; $132.8 million of acquisition amortization costs; $97.9 million of restructuring and restructuring-related charges; and $33.6 million of
transaction related costs, $42.2 million of other costs and fire-related losses, net of insurance recovery of $(10.5) million.
The twelve months ended December 31, 2019 excluded items consists of $1.2 billion impairment charges, primarily related to tradenames and goodwill; $130.9 million of acquisition amortization costs; $81.2 million of restructuring and restructuring-related charges; $54.4
million of cumulative depreciation and amortization catch-up related to the inclusion of the Commercial Business, Mapa and Quickie in continuing operations; $30.4 million of transaction related costs and $33.6 million related to Argentina hyperinflationary adjustment, legal
fees related to certain proceedings and a product recall.
RECONCILIATION OF GAAP AND NON-GAAP INFORMATION (UNAUDITED)
Net Sales Operating Income (Loss)
Proforma
Twelve months ended December 31, 2019 Twelve months ended December 31, 2018 Year over year changes
(Amounts in millions)
FINANCIAL WORKSHEET - SEGMENT REPORTING
NEWELL BRANDS INC.

49© Newell Brands
CAGNY 2020
Reconciliation of Core Sales Change by Region in 2019
2019Net Sales
(REPORTED)
Acquisitions,Divestitures and
Other, Net [2] Net Sales
Base Business Currency Impact
[3] 2019
Core Sales [1]
2018Net Sales
(REPORTED)
Divestitures and Other, Net
[2] 2018
Core Sales [1]
NORTH AMERICA 6,920.1$ (561.2)$ 6,358.9$ 8.1$ 6,367.0$ 7,263.6$ (652.4)$ 6,611.2$ (244.2)$ (3.7)%
EUROPE, MIDDLE EAST, AFRICA 1,397.8 (241.4) 1,156.4 56.1 1,212.5 1,462.9 (277.1) 1,185.8 26.7 2.3 %LATIN AMERICA 702.3 (44.9) 657.4 49.1 706.5 709.2 (48.9) 660.3 46.2 7.0 %ASIA PACIFIC 694.7 (19.6) 675.1 17.0 692.1 718.3 (26.7) 691.6 0.5 0.1 %MARKETS OUTSIDE NORTH AMERICA 2,794.8 (305.9) 2,488.9 122.2 2,611.1 2,890.4 (352.7) 2,537.7 73.4 2.9 %
TOTAL COMPANY 9,714.9$ (867.1)$ 8,847.8$ 130.3$ 8,978.1$ 10,154.0$ (1,005.1)$ 9,148.9$ (170.8)$ (1.9)%
[3] “Currency Impact” represents the effect of foreign currency on 2019 reported sales and is calculated as the difference between the 2019 reported sales and by applying the prior year average monthly exchange rates to the current year local currency sales amounts (excluding acquisitions and divestitures).
For the twelve months ended December 31, 2019 For the twelve months ended December 31, 2018
Increase (Decrease)Core Sales
$ %
NEWELL BRANDS INC.CORE SALES ANALYSIS BY GEOGRAPHY (UNAUDITED)
(Amounts in millions)
[1] “Core Sales” provides a consistent basis for year-over-year comparisons in sales as it excludes the impacts of acquisitions, completed divestitures, retail store openings and closings, changes in foreign currency. Core Sales Increases/(Decreases) excludes the impact of currency, acquisitions and divestitures.
[2] Divestitures include the exit of a distribution agreement with FireAngel (formerly Sprue Aegis) during the first quarter of 2018, the transition of direct sales to a licensing arrangement for Graco® within the European region entered into during the third quarter of 2018, the removal of specialized writing sales associated with the Bond® brand in anticipation of exiting the business, the planned exit of the North American distributorship of Uniball® Products and, consistent with standard retail practice, current and prior period net sales from retail store closures from the decision date to close through their closing dates. Divestitures also include 2019 sales of the Commercial Business for the first and second quarter, Mapa and Quickie businesses for the first, second and third quarters, based on timing of when the Company decided to retain and reclass them to continuing operations. Results for 2019 also exclude the impact of customer returns related to a product recall in Home and Outdoor Living segment.

50© Newell Brands
CAGNY 2020
Reconciliation of Core Sales Change by Region in 2018
2018Net Sales
(REPORTED)
Acquisitions,Divestitures and Other, Net [2] [3]
Net SalesBase Business
Currency Impact[4]
2018Core Sales [1]
2017Net Sales
(REPORTED)
Divestitures and Other, Net
[2] [5]
ASC 606 Revenue
Recognition Adjustments [6]
2017Core Sales [1]
NORTH AMERICA 6,202.4$ (62.8)$ 6,139.6$ 0.4$ 6,140.0$ 6,936.4$ (175.7)$ (190.6)$ 6,570.1$ (430.1)$ (6.5)%
EUROPE, MIDDLE EAST, AFRICA 1,096.1 (13.2) 1,082.9 (37.8) 1,045.1 1,215.6 (79.7) (15.7) 1,120.2 (75.1) (6.7)%LATIN AMERICA 647.8 (0.1) 647.7 50.8 698.5 679.7 (8.9) (12.0) 658.8 39.7 6.0 %ASIA PACIFIC 684.6 (26.8) 657.8 3.6 661.4 720.3 (45.0) (8.3) 667.0 (5.6) (0.8)%MARKETS OUTSIDE NORTH AMERICA 2,428.5 (40.1) 2,388.4 16.6 2,405.0 2,615.6 (133.6) (36.0) 2,446.0 (41.0) (1.7)%
TOTAL COMPANY 8,630.9$ (102.9)$ 8,528.0$ 17.0$ 8,545.0$ 9,552.0$ (309.3)$ (226.6)$ 9,016.1$ (471.1)$ (5.2)%
[4] “Currency Impact” represents the effect of foreign currency on 2018 reported sales and is calculated as the difference between the 2018 reported sales and by applying the prior year average monthly exchange rates to the current year local currency sales amounts (excluding acquisitions and divestitures).
[5] The Company has revised the classification of certain items, principally related to customer supply chain related payments, formerly included in costs of goods sold. The impact to net sales for the twelve months ended December 31, 2017 was a decrease of $40.1 million.
[6] Certain costs and cash payments made to customers previously recorded in costs of products sold and selling, general and administrative expenses have been reclassified against sales as they do not meet the specific criteria of providing a distinct good or service under the new guidance—ASC 606.
[1]“Core Sales” provides a consistent basis for year-over-year comparisons in sales as it excludes the impacts of acquisitions, completed divestitures, retail store openings and closings, changes in foreign currency and the impact of the adoption of revenue recognition standard ASC 606 as of January 1, 2018. Core Sales Increases/(Decreases) excludes the impact of currency, acquisitions and divestitures.
[2] Divestitures include actual divestitures of Tools (excluding Dymo Industrial Labelling) in the first quarter of 2017; Fire Building, Lehigh® and Teutonia® businesses in the second quarter of 2017; two winter sports units, Völkl® and K2® products and a remaining portion of the Rubbermaid® Consumer Storage business during the third quarter of 2017; the exit of a distribution agreement with Sprue Aegis (now FireAngel) during the first quarter of 2018; the transition of regional sales to a licensing arrangement for Graco® within the European region entered into during the third quarter of 2018 and the removal of specialized writing sales associated with the Bond® brand in anticipation of closing the business.
[3] Acquisitions exclude net sales until the one year anniversary of their respective dates of acquisition, comprised of Chesapeake® Bay Candle and Sistema®. Since the completion of the Jarden acquisition and consistent with standard retail practice, the Home Fragrance and the Outdoor and Recreation businesses in the Home and Outdoor Living segment exclude net sales from retail store openings until the one year anniversary of their opening dates and current and prior period net sales from retail store closures from the decision date to close through their closing dates.
For the twelve months ended December 31, 2018 For the twelve months ended December 31, 2017
Increase (Decrease)Core Sales
$ %
NEWELL BRANDS INC.CORE SALES ANALYSIS BY GEOGRAPHY (UNAUDITED)
(Amounts in millions)

51© Newell Brands
CAGNY 2020
Reconciliation of Gross Margin in 2018
Net sales (1) 8,630.9$ Adjust for the inclusion of Commercial Business, Mapa/Spontex and Quickie business (2) 1,523.1 As recasted (2) 10,154.0$
Gross profit (1) 3,008.8$ Normalization adjustments (2) (3) (10.5) Normalized gross profit and margin (3) 2,998.3 34.7%
Adjustments for the inclusion of Commercial Business, Mapa/Spontex and Quickie business (2) 508.9 Proforma adjustments (2) (4) (27.0) As recasted, proforma gross profit and margin (2) 3,480.2$ 34.3%
(1) As reported on the Company's Annual Report on Form 10-K for the year ended December 31, 2018.
(2) As recasted on the Company's Form 8-K filed on February 10, 2020.
(3) As presented at CAGNY in 2019 and on the Company's Form 8-K for the quarter and year ended December 31, 2018, furnished on February 15, 2019.
(4) Depreciation and amortization expense related to the Commercial Business, and the Mapa and Quickie businesses that would have been recorded had they been continuously classified as held and used.
NEWELL BRANDS INC.GROSS MARGIN
FOR THE YEAR ENDED DECEMBER 31, 2018
52© Newell Brands
CAGNY 2020
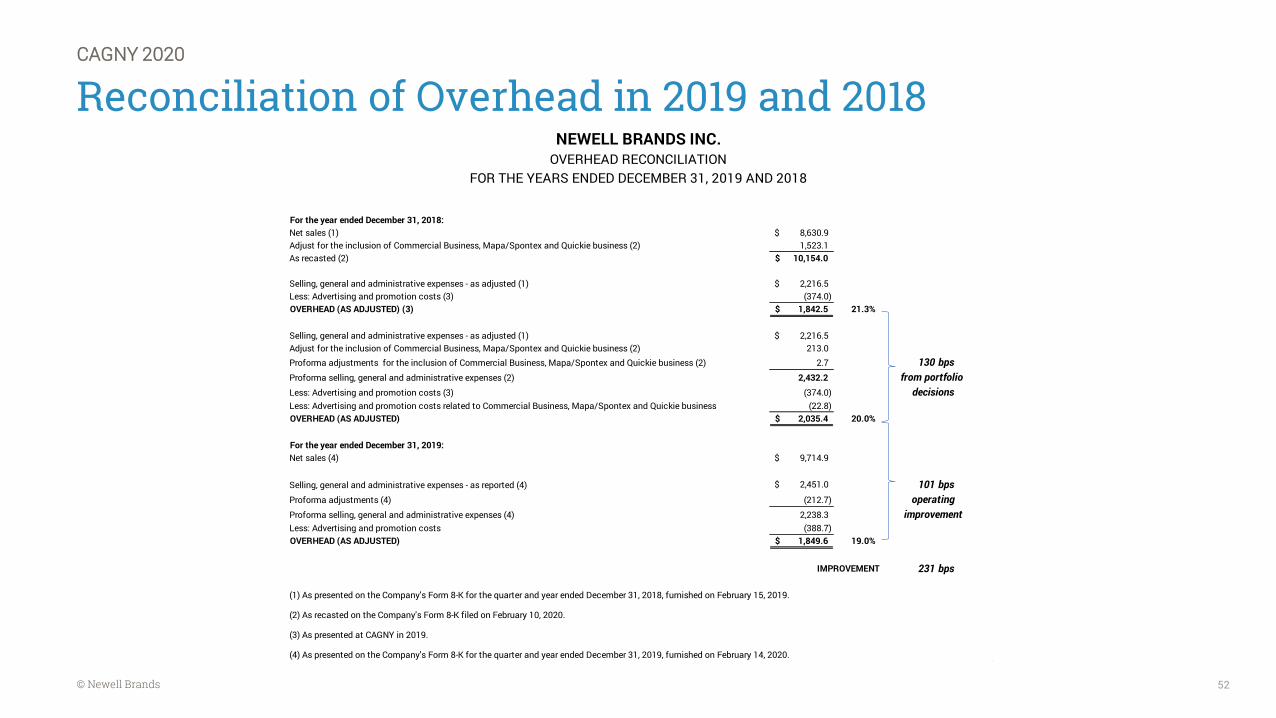
Reconciliation of Overhead in 2019 and 2018
For the year ended December 31, 2018:Net sales (1) 8,630.9$ Adjust for the inclusion of Commercial Business, Mapa/Spontex and Quickie business (2) 1,523.1 As recasted (2) 10,154.0$
Selling, general and administrative expenses - as adjusted (1) 2,216.5$ Less: Advertising and promotion costs (3) (374.0) OVERHEAD (AS ADJUSTED) (3) 1,842.5$ 21.3%
Selling, general and administrative expenses - as adjusted (1) 2,216.5$ Adjust for the inclusion of Commercial Business, Mapa/Spontex and Quickie business (2) 213.0 Proforma adjustments for the inclusion of Commercial Business, Mapa/Spontex and Quickie business (2) 2.7 130 bpsProforma selling, general and administrative expenses (2) 2,432.2 from portfolio Less: Advertising and promotion costs (3) (374.0) decisionsLess: Advertising and promotion costs related to Commercial Business, Mapa/Spontex and Quickie business (22.8) OVERHEAD (AS ADJUSTED) 2,035.4$ 20.0%
For the year ended December 31, 2019:Net sales (4) 9,714.9$
Selling, general and administrative expenses - as reported (4) 2,451.0$ 101 bpsProforma adjustments (4) (212.7) operatingProforma selling, general and administrative expenses (4) 2,238.3 improvementLess: Advertising and promotion costs (388.7) OVERHEAD (AS ADJUSTED) 1,849.6$ 19.0%
IMPROVEMENT 231 bps
(1) As presented on the Company's Form 8-K for the quarter and year ended December 31, 2018, furnished on February 15, 2019.
(2) As recasted on the Company's Form 8-K filed on February 10, 2020.
(3) As presented at CAGNY in 2019.
(4) As presented on the Company's Form 8-K for the quarter and year ended December 31, 2019, furnished on February 14, 2020.
NEWELL BRANDS INC.OVERHEAD RECONCILIATION
FOR THE YEARS ENDED DECEMBER 31, 2019 AND 2018

53© Newell Brands
CAGNY 2020
Reconciliation of Operating Margin in 2018
Net sales (1) 8,630.9$ Adjust for the inclusion of Commercial Business, Mapa/Spontex and Quickie business (2) 1,523.1 As recasted (2) 10,154.0$
Operating loss (1) (7,828.5) Normalization adjustments (4) 8,610.3 Normalized operating income and margin (4) 781.8 9.1%
Adjustments for the inclusion of Commercial Business, Mapa/Spontex and Quickie business (2) 274.5 Proforma adjustments (2) (5) (8.3) As recasted, proforma operating income and margin (3) 1,048.0$ 10.3%
(1) As reported on the Company's Annual Report on Form 10-K for the year ended December 31, 2018.
(2) As recasted on the Company's Form 8-K filed on February 10, 2020.
(3) As presented on the Company's Form 8-K for the quarter and year ended December 31, 2019, furnished on February 14, 2020.
(4) As presented at CAGNY in 2019 and on the Company's Form 8-K for the quarter and year ended December 31, 2018, furnished on February 15, 2019.
NEWELL BRANDS INC.OPERATING MARGIN
FOR THE YEAR ENDED DECEMBER 31, 2018
(5) Depreciation and amortization expense of $31.1 million related to the Commercial Business, and the Mapa and Quickie businesses that would have been recorded had they been continuously classified as held and used.

54© Newell Brands
CAGNY 2020
Reconciliation of Free Cash Flow and Free Cash Flow Productivity in 2019 and 2018
2019 2018
Net cash provided by operating activities 1,044.0$ 680.0$ Less: Capital expenditures (264.9) (384.4) FREE CASH FLOW (1) 779.1$ 295.6$
PROFORMA NORMALIZED NET INCOME (2) 722.1$ 1,166.3$
FREE CASH FLOW PRODUCTIVITY (3) 108% 25%
(1) Free cash flow is defined as net cash provided by operating activities, less capital expenditures.
NEWELL BRANDS INC.FREE CASH FLOW PRODUCTIVITY RECONCILIATION
FOR THE YEARS ENDED DECEMBER 31, 2019 AND 2018
December 31,
(3) Free cash flow productivity is calculated as the ratio of free cash flow to proforma normalized net income, and the company believes that free cash flow productivity is an important indicator of liquidity realized from the company’s core ongoing operations.
(2) As presented on the Company's Form 8-K for the quarter and year ended December 31, 2019, furnished on February 14, 2020.

55© Newell Brands
CAGNY 2020
Reconciliation of Net Debt in 2019 and 2018
2019 2018 $ Change
NET DEBT RECONCILIATION:
Short-term debt and current portion of long term debt $ 332.4 $ 318.7
Long- term debt 5,391.3 6,696.3
Gross debt 5,723.7 7,015.0 $ (1,291.3)
Less: Cash and cash equivalents 348.6 495.7
NET DEBT [1] $ 5,375.1 $ 6,519.3 $ (1,144.2)
December 31,
NEWELL BRANDS INC.
RECONCILIATION OF GAAP AND NON-GAAP INFORMATION (UNAUDITED)
NET DEBT RECONCILIATION (Amounts in millions)
[1] Net debt is defined as gross debt less the total of cash and cash equivalents, and current and long-term marketable securities.
The Company believes net debt is meaningful to investors as it considers net debt and its components to be an important
indicator of liquidity and a guiding measure of capital structure strategy.

56© Newell Brands
CAGNY 2020
Reconciliation of Net Debt to Normalized EBITDA from Continuing Operations Leverage Ratio in 2019
December 31, 2019
NET DEBT RECONCILIATION:Short term debt and current portion of long term debt 332.4$ Long term debt 5,391.3 Gross debt 5,723.7 Less: Cash and cash equivalents 348.6 NET DEBT 5,375.1$
EBITDA RECONCILIATION:Income from continuing operations 186.1$ Normalized items (1) 490.9
PROFORMA NORMALIZED INCOME FROM CONTINUING OPERATIONS 677.0
Proforma normalized income tax (2) 58.3 Interest expense, net 303.3 Proforma normalized depreciation and amortization (3) 251.3 Stock-based compensation (4) 42.1 NORMALIZED EBITDA FROM CONTINUING OPERATIONS 1,332.0$
NET DEBT TO NORMALIZED EBITDA FROM CONTINUING OPERATIONS LEVERAGE RATIO (5) 4.0 x
(4) Represents non-cash expense associated with stock compensation from continuing operations.
(3) Proforma Normalized Depreciation and Amortization excludes from GAAP depreciation and amortization the following items: (1) an acquisition amortization expense of $130.9 million associated with intangible assets recognized in purchase accounting; (2) cumulative depreciation and amortization cost of $31.1 million related to the inclusion of the Commercial Business, Mapa and Quickie businesses in continuing operations; and (3) $32.7 million of accelerated depreciation costs associated with restructuring activities. Refer to "Reconciliation of GAAP and Non-GAAP Information (Unaudited)" - Certain Line Items" for the twelve months ended December 31, 2019 for further information.
(5) The Normalized EBITDA from continuing operations leverage ratio is defined as Net Debt divided by Normalized EBITDA from continuing operations. The Company's debt has certain financial covenants such as a debt to equity ratio and interest coverage ratio; however, the Normalized EBITDA from continuing operations leverage ratio is used by management and is not prescribed in the Company's debt covenants.
NEWELL BRANDS INC.RECONCILIATION OF NON-GAAP MEASURES
NET DEBT TO NORMALIZED EBITDA RATIO(Amounts in millions)
(1) Refer to "Reconciliation of GAAP and Non-GAAP Information (Unaudited)" - Certain Line Items" for the twelve months ended December 31, 2019 for further information and disclosures on normalized items excluded from income from continuing operations.
(2) Refer to "Reconciliation of GAAP and Non-GAAP Information (Unaudited)" - Certain Line Items" for the twelve months ended December 31, 2019 for further information and disclosures on normalized items excluded fromincome tax provision (benefits).