consumer demand for quality - department of agriculture ... · consumer demand for quality a/prof....
TRANSCRIPT
Consumer Demand for Quality A/Prof. Wendy Umberger, Ph.D.
Director, Global Food Studies
ABARES 2015 Canberra Tuesday, 3 March 2015
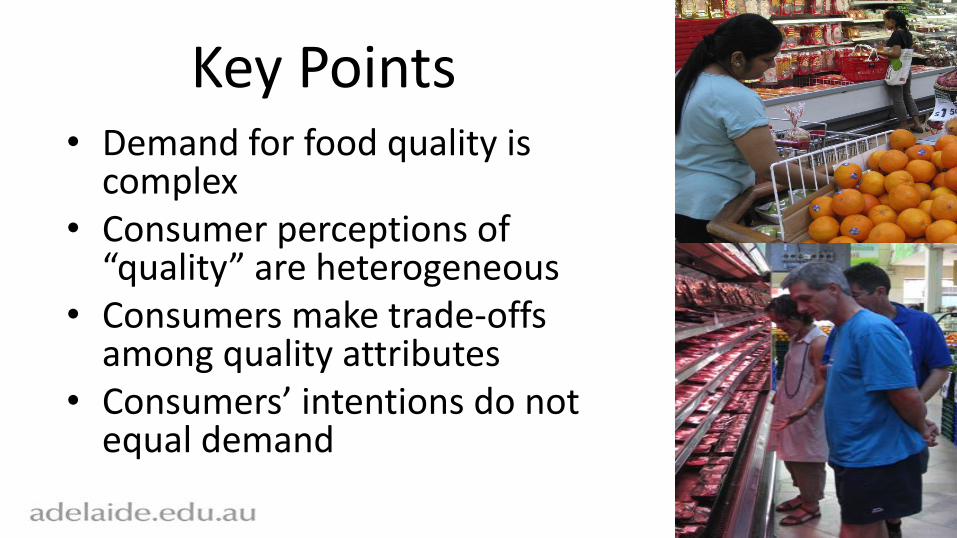
Key Points • Demand for food quality is
complex • Consumer perceptions of
“quality” are heterogeneous • Consumers make trade-offs
among quality attributes • Consumers’ intentions do not
equal demand
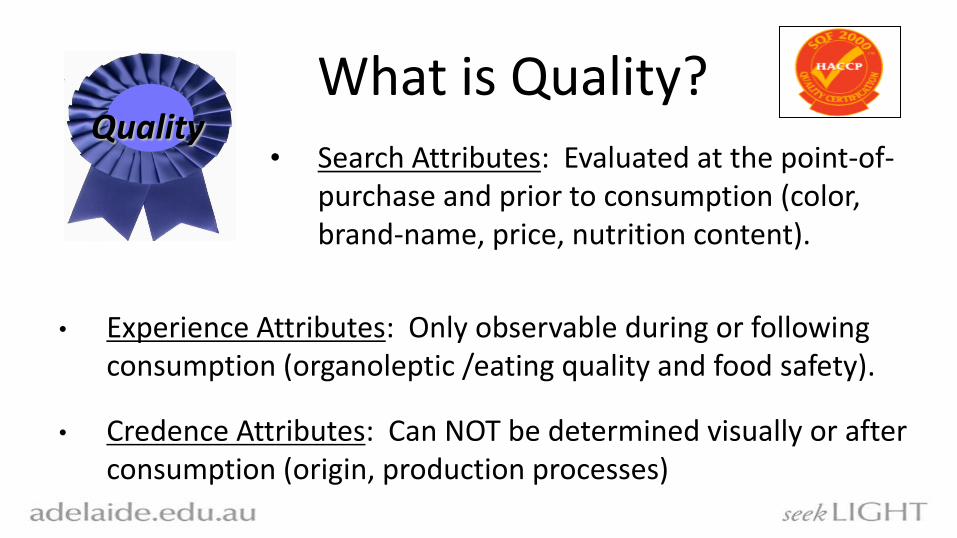
• Experience Attributes: Only observable during or following consumption (organoleptic /eating quality and food safety).
• Credence Attributes: Can NOT be determined visually or after consumption (origin, production processes)
Quality • Search Attributes: Evaluated at the point-of-
purchase and prior to consumption (color, brand-name, price, nutrition content).
What is Quality?
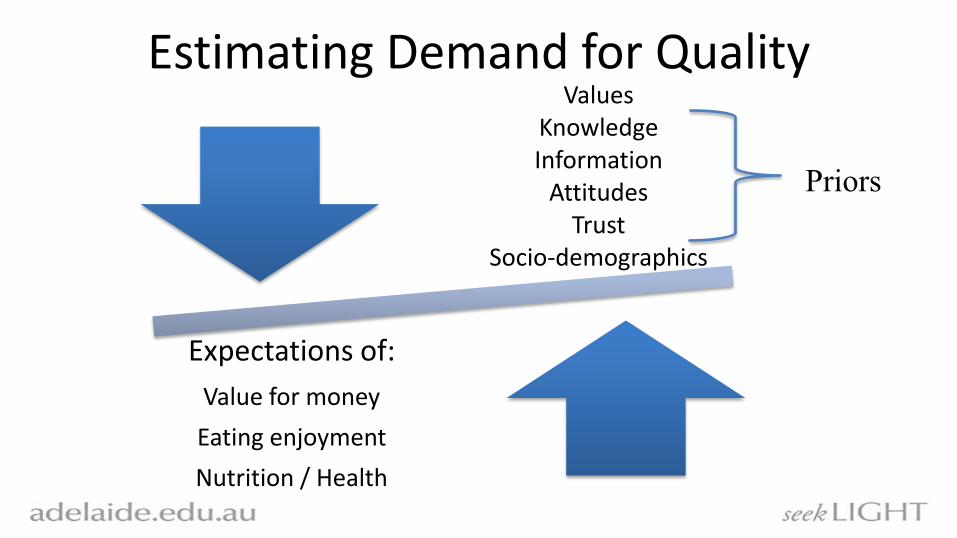
Estimating Demand for Quality Values
Knowledge Information
Attitudes Trust
Socio-demographics
Expectations of:
Value for money
Eating enjoyment
Nutrition / Health
Priors
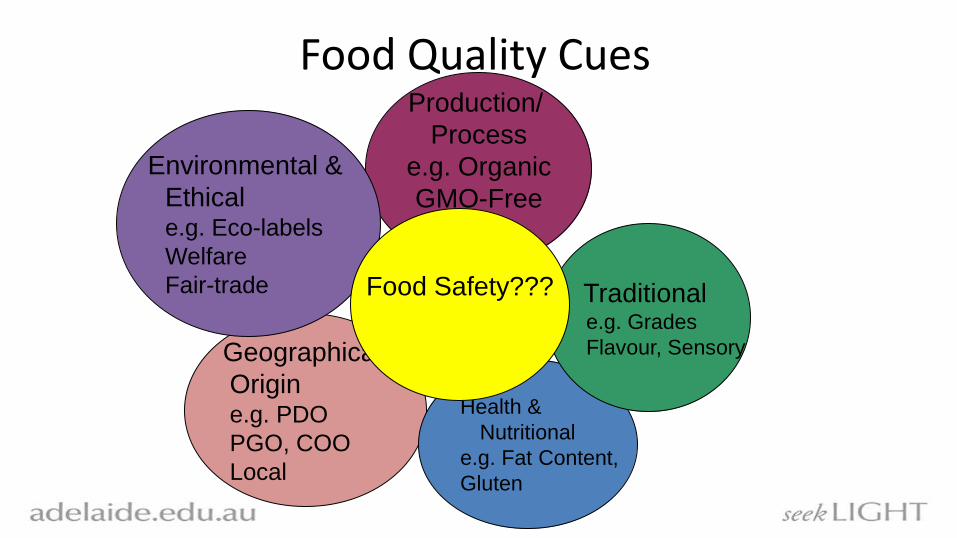
Food Quality Cues Production/
Process
e.g. Organic
GMO-Free
Geographical
Origin e.g. PDO
PGO, COO
Local
Environmental &
Ethical e.g. Eco-labels
Welfare
Fair-trade
Health &
Nutritional
e.g. Fat Content,
Gluten
Traditional e.g. Grades
Flavour, Sensory
Food Safety???
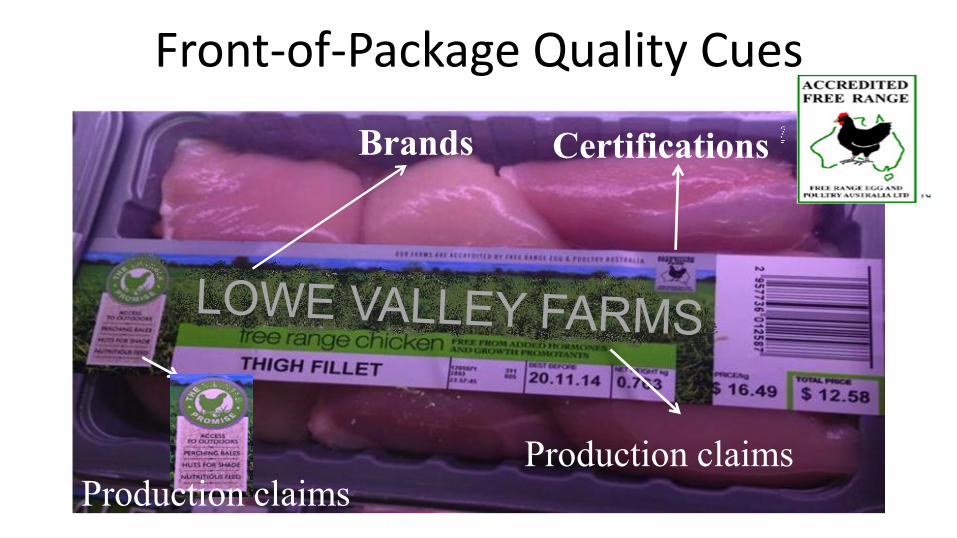
Front-of-Package Quality Cues
Brands Certifications
Production claims Production claims
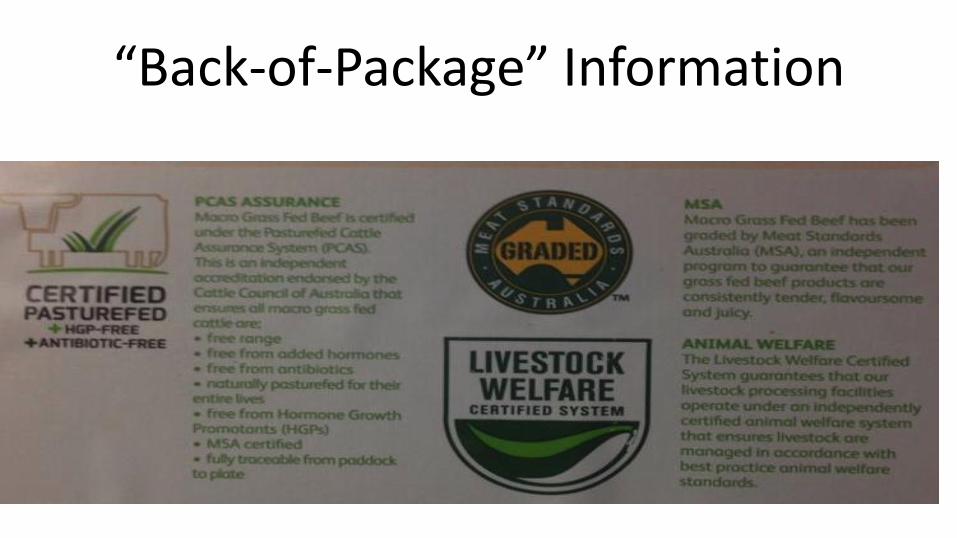
“Back-of-Package” Information
Consumers are Confused
• Confused about the “benefits” of food claims – Cynicism
– Lack of understanding
– Perceive claims (e.g. organic) to mean • Safer
• Healthier
• Better for the environment
• Guarantee improved welfare
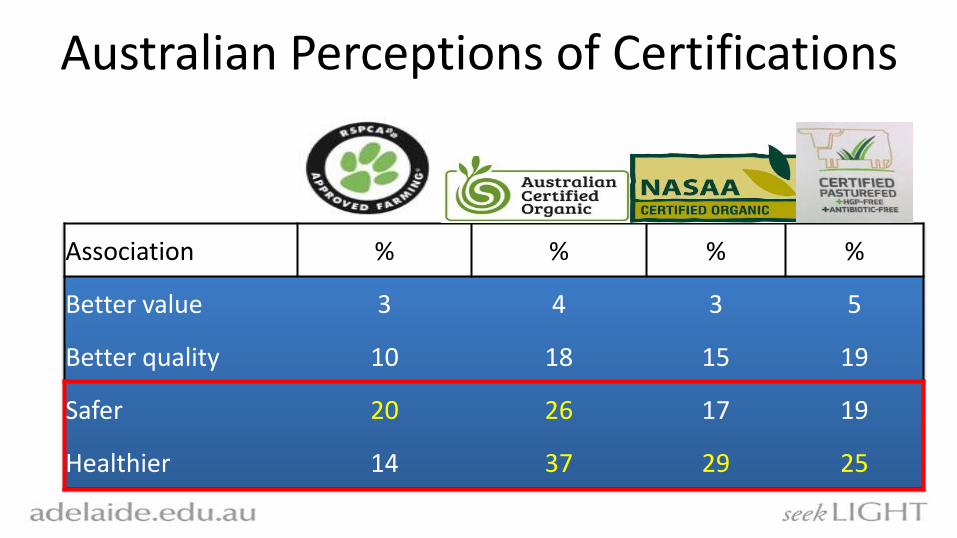
Australian Perceptions of Certifications
Association % % % %
Better value 3 4 3 5
Better quality 10 18 15 19
Safer 20 26 17 19
Healthier 14 37 29 25

Consumers are Conflicted Citizens = Public Values
• Social values – Environment
– Local
– Workers/society
– Animals
Consumers = Private Values • Value for money
• Personal / family benefits – Safety – Enjoyment – Nutrition – Health
• Convenience
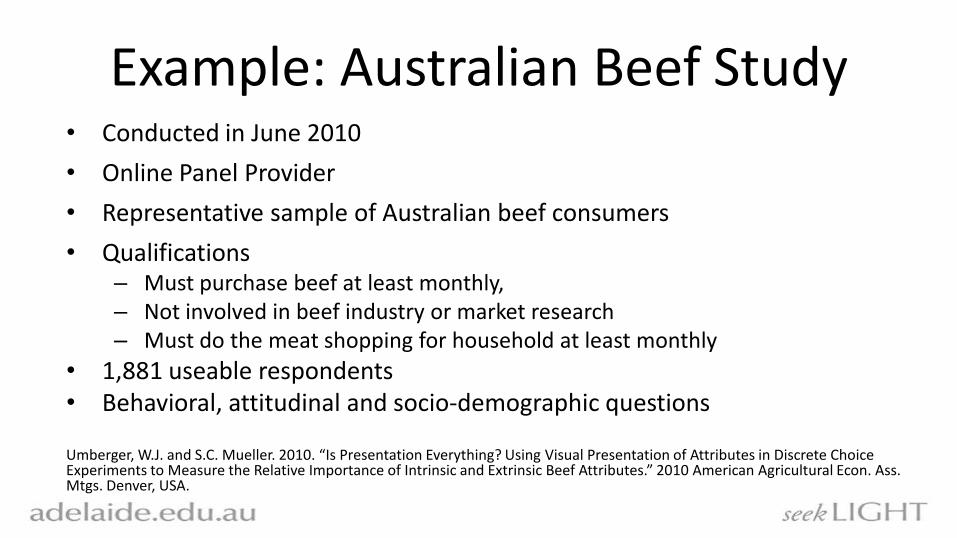
• Conducted in June 2010
• Online Panel Provider
• Representative sample of Australian beef consumers
• Qualifications – Must purchase beef at least monthly, – Not involved in beef industry or market research – Must do the meat shopping for household at least monthly
• 1,881 useable respondents • Behavioral, attitudinal and socio-demographic questions Umberger, W.J. and S.C. Mueller. 2010. “Is Presentation Everything? Using Visual Presentation of Attributes in Discrete Choice Experiments to Measure the Relative Importance of Intrinsic and Extrinsic Beef Attributes.” 2010 American Agricultural Econ. Ass. Mtgs. Denver, USA.
Example: Australian Beef Study
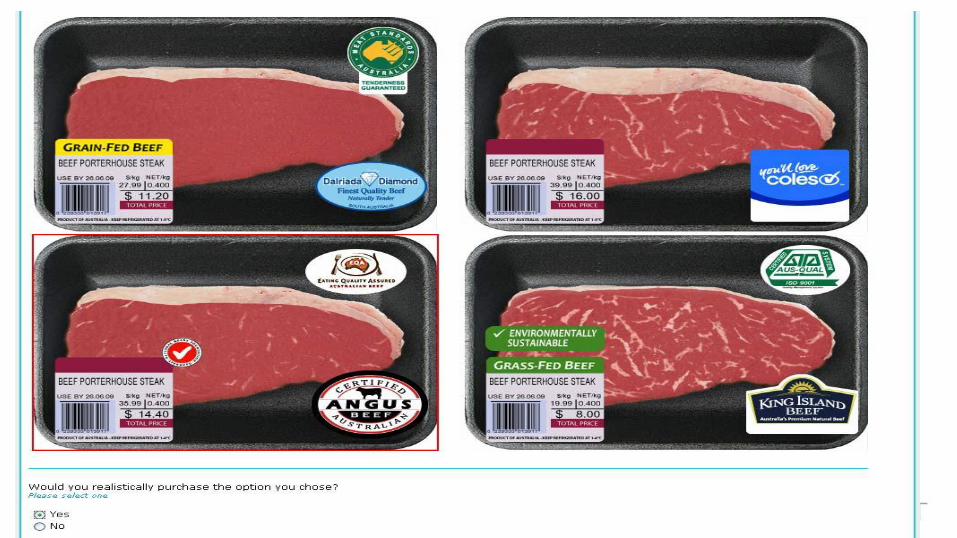
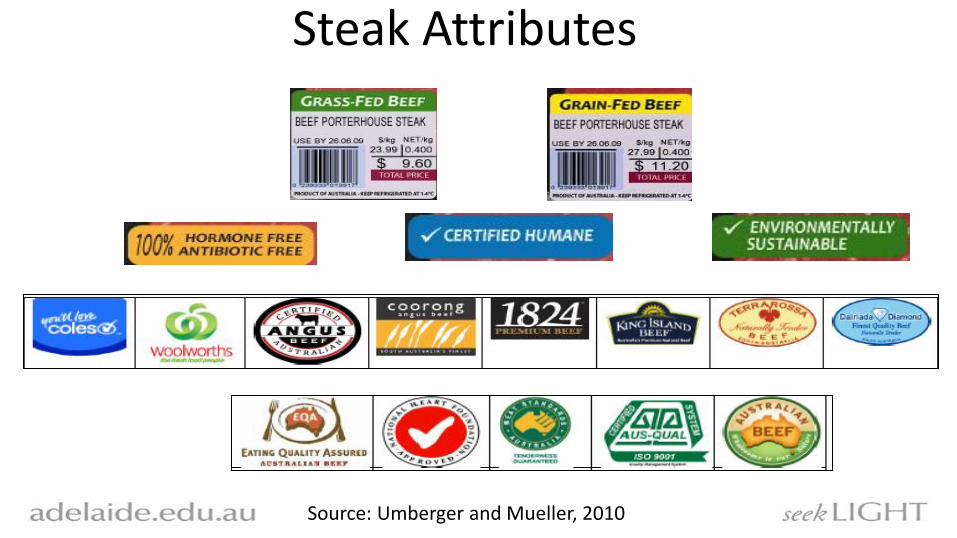
Steak Attributes
Source: Umberger and Mueller, 2010
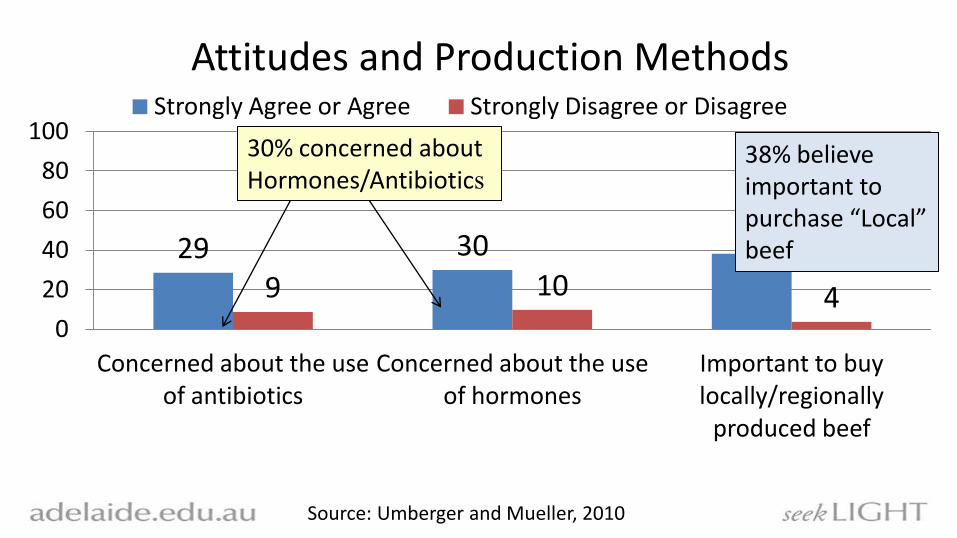
29 30 38
9 10 4 0
20
40
60
80
100
Concerned about the use of antibiotics
Concerned about the use of hormones
Important to buy locally/regionally
produced beef
Strongly Agree or Agree Strongly Disagree or Disagree
Attitudes and Production Methods
30% concerned about Hormones/Antibiotics
38% believe important to purchase “Local” beef
Source: Umberger and Mueller, 2010
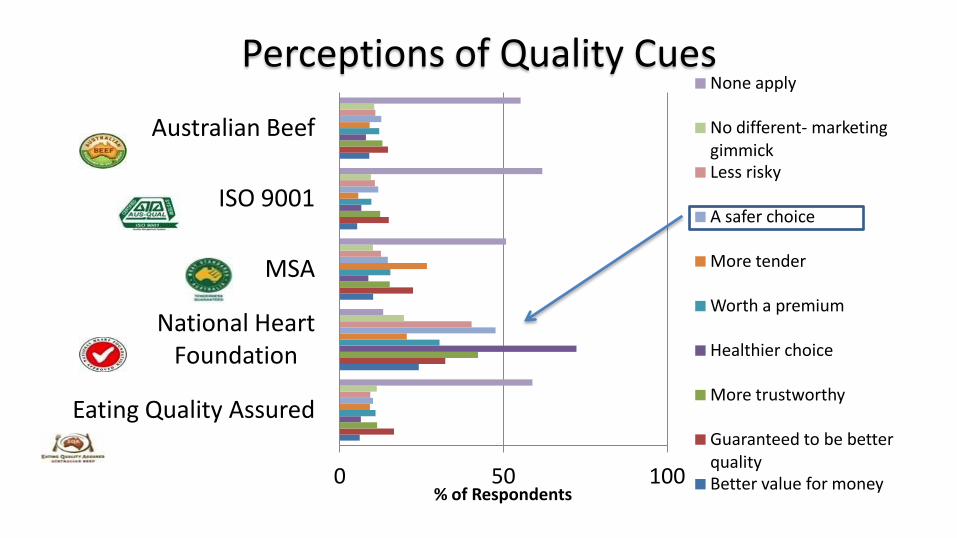
0 50 100
Eating Quality Assured
National Heart Foundation
MSA
ISO 9001
Australian Beef
% of Respondents
None apply
No different- marketing gimmick Less risky
A safer choice
More tender
Worth a premium
Healthier choice
More trustworthy
Guaranteed to be better quality Better value for money
Perceptions of Quality Cues
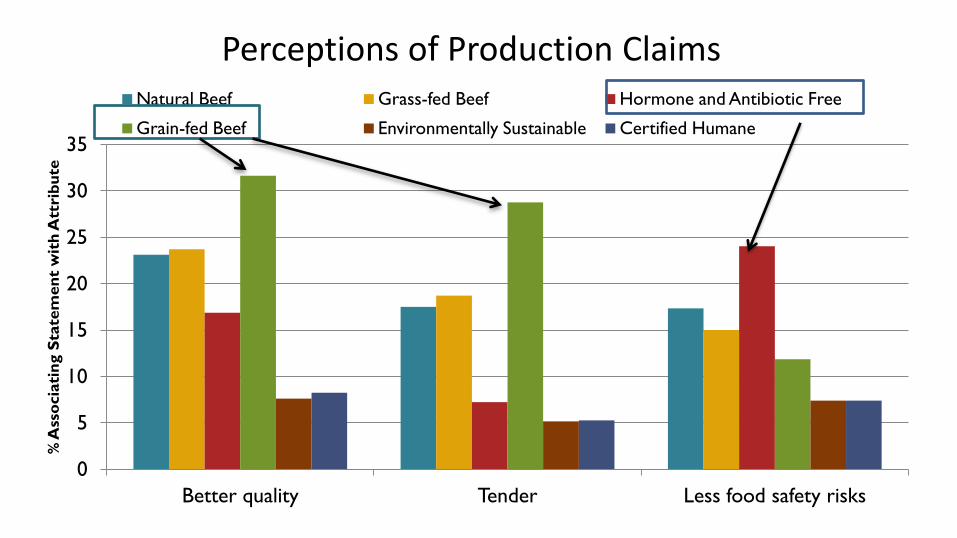
Perceptions of Production Claims
0
5
10
15
20
25
30
35
Better quality Tender Less food safety risks
% A
sso
cia
tin
g S
tate
men
t w
ith
Att
rib
ute
Natural Beef Grass-fed Beef Hormone and Antibiotic Free
Grain-fed Beef Environmentally Sustainable Certified Humane
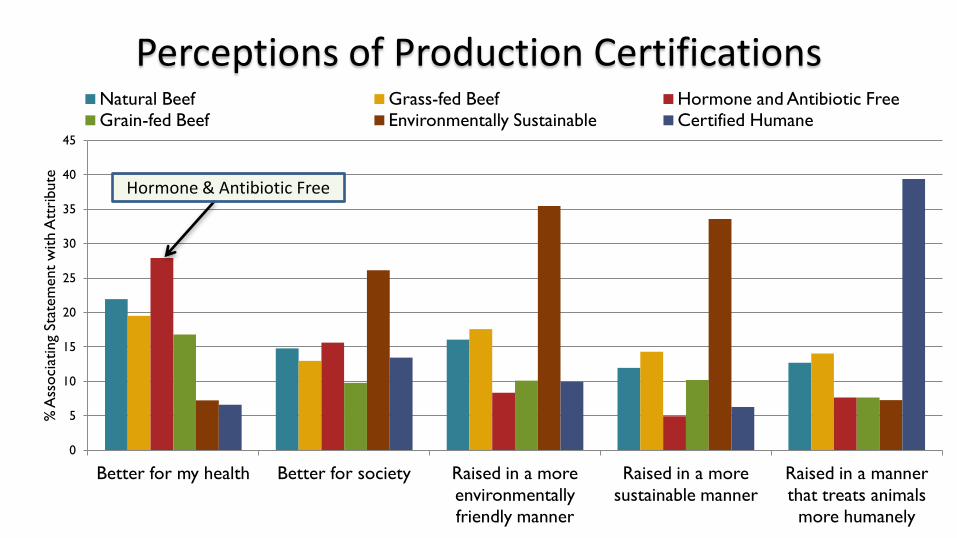
0
5
10
15
20
25
30
35
40
45
Better for my health Better for society Raised in a more
environmentally
friendly manner
Raised in a more
sustainable manner
Raised in a manner
that treats animals
more humanely
% A
ssoci
atin
g Sta
tem
ent
with A
ttri
bute
Natural Beef Grass-fed Beef Hormone and Antibiotic Free Grain-fed Beef Environmentally Sustainable Certified Humane
Perceptions of Production Certifications
Hormone & Antibiotic Free
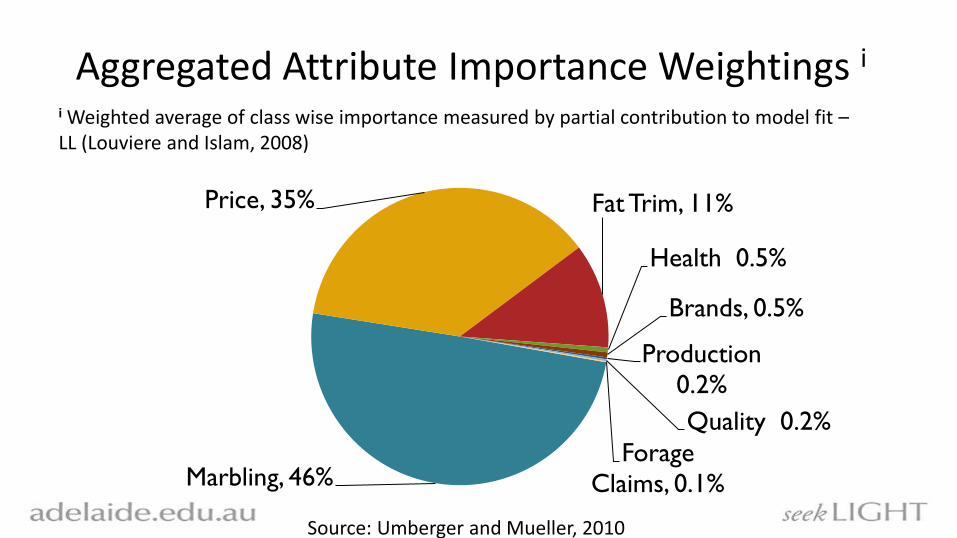
Aggregated Attribute Importance Weightings i
Marbling, 46%
Price, 35% Fat Trim, 11%
Health 0.5%
Brands, 0.5%
Production
0.2%
Quality 0.2%
Forage
Claims, 0.1%
i Weighted average of class wise importance measured by partial contribution to model fit – LL (Louviere and Islam, 2008)
Source: Umberger and Mueller, 2010
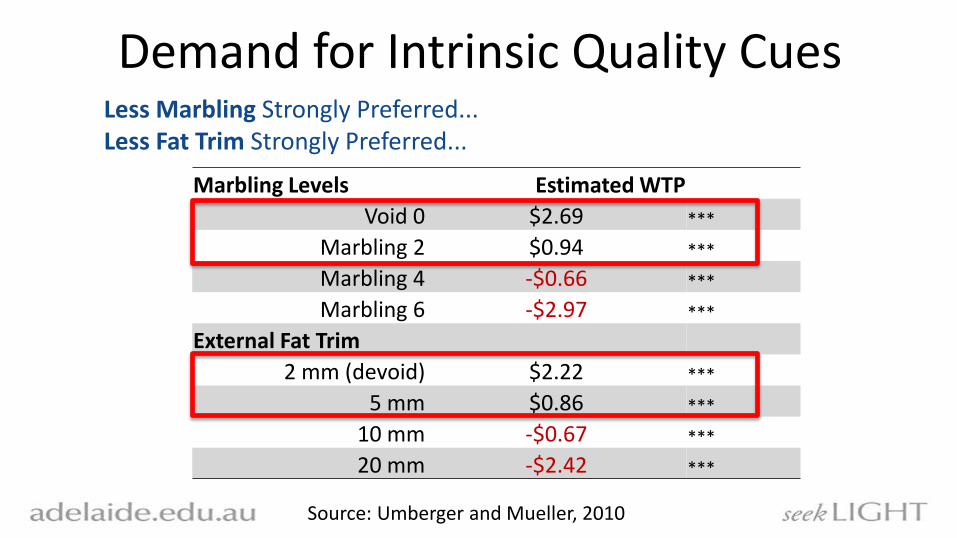
Demand for Intrinsic Quality Cues
Marbling Levels Estimated WTP
Void 0 $2.69 ***
Marbling 2 $0.94 ***
Marbling 4 -$0.66 ***
Marbling 6 -$2.97 ***
External Fat Trim
2 mm (devoid) $2.22 ***
5 mm $0.86 ***
10 mm -$0.67 ***
20 mm -$2.42 ***
Less Marbling Strongly Preferred... Less Fat Trim Strongly Preferred...
Source: Umberger and Mueller, 2010
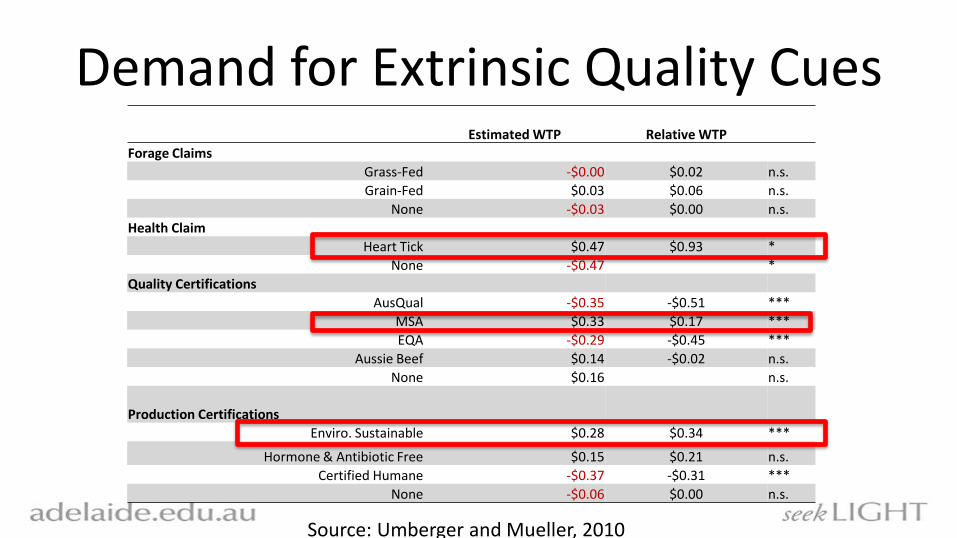
Demand for Extrinsic Quality Cues Estimated WTP Relative WTP
Forage Claims
Grass-Fed -$0.00 $0.02 n.s.
Grain-Fed $0.03 $0.06 n.s.
None -$0.03 $0.00 n.s.
Health Claim
Heart Tick $0.47 $0.93 *
None -$0.47 *
Quality Certifications
AusQual -$0.35 -$0.51 ***
MSA $0.33 $0.17 ***
EQA -$0.29 -$0.45 ***
Aussie Beef $0.14 -$0.02 n.s.
None $0.16 n.s.
Production Certifications
Enviro. Sustainable $0.28 $0.34 ***
Hormone & Antibiotic Free $0.15 $0.21 n.s.
Certified Humane -$0.37 -$0.31 ***
None -$0.06 $0.00 n.s.
Source: Umberger and Mueller, 2010
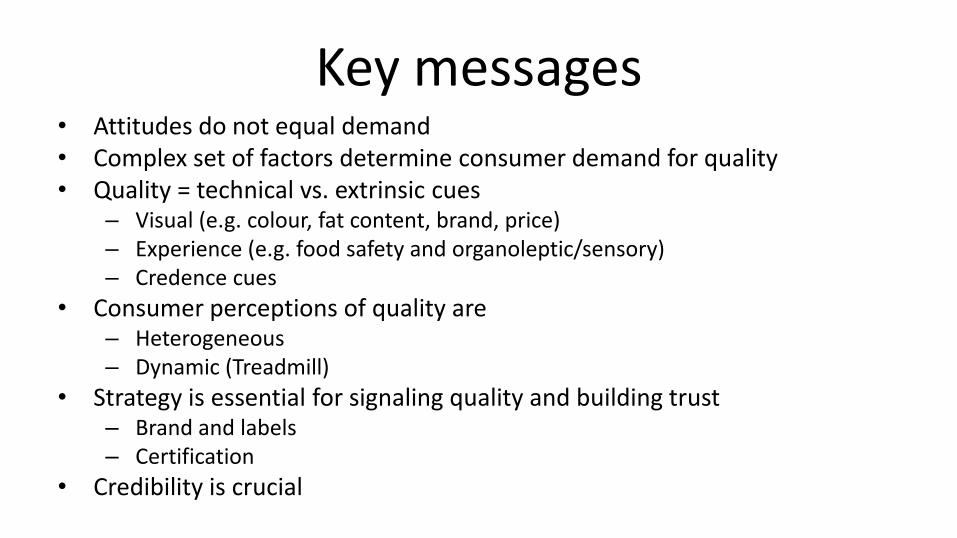
Key messages • Attitudes do not equal demand • Complex set of factors determine consumer demand for quality • Quality = technical vs. extrinsic cues
– Visual (e.g. colour, fat content, brand, price) – Experience (e.g. food safety and organoleptic/sensory) – Credence cues
• Consumer perceptions of quality are – Heterogeneous – Dynamic (Treadmill)
• Strategy is essential for signaling quality and building trust – Brand and labels – Certification
• Credibility is crucial

Thank you! Questions?
http://www.adelaide.edu.au/global-food http://www.adelaide.edu.au/global-
food/blog/[email protected]