consumer intelligence series | video content consumption - pwc
TRANSCRIPT

www.pwc.com
Consumer Intelligence SeriesVideo content consumption
Through PwC’s ongoing Consumer Intelligence Series, we gain directional insights on consumer attitudes and behaviors in the rapidly changing media and technology landscape.

2 Consumer Intelligence Series | Video content consumption
This report summarizes key findings from a 1,008-respondent survey conducted in June 2013, combined with follow-up focus groups conducted separately with consumers 21-34 and 35-49 years old in Los Angeles in July 2013, and a social media listening campaign1 exploring the topic of consumer attitudes and behavior relative to consumer choice in video content. The goal of this research was to explore current video subscription services as well as desires for new services and package options. Specific objectives were to explore consumer desires and attitudes toward:
• Consumers’ current behavior and preferences for video packages, including why they prefer what they prefer,
• Optimal video packages and amounts consumers are willing to pay,
• Critical factors of influence for TV show/channel selection,
• Willingness to watch ads in lieu of paying fees, by device,
• Nature of interaction of mobile device use with traditional and online video,
• Consumption patterns related to content viewing: live versus recorded.
Series overview and study objectives
Research: Channels and Demographics• Survey of 1,008 respondents
• Focus groups with consumers 21-34 and 35-49
• The listening campaign includes conversations that happened in non-password protected public forums using a mix of keywords to identify conversations about television consumption for online conversations.
• Demographics - 49% male, 51% female – 20% of sample: 18-24 (62% female, 38% male) – 30% of sample: 25-34 (54% female, 46% male) – 30% of sample: 35-49 (44% female, 56% male) – 20% of sample: 50-59 (52% female, 48% male)

3 Consumer Intelligence Series | Video content consumption
Traditional versus online video
1. Traditional subscriptions still dominate: For the majority, traditional subscription packages are still valuable. The largest percentage (70%) of respondents subscribe.
� Focus group respondents explained that there’s a certain place for traditional video, which other providers cannot match.
� Cable/satellite delivery is the staple. It is the foundation of the TV viewing experience. Basic and premium service provides most customers with much of what they are looking for. Additional subscription services are added to complement or expand on the options cable/satellite provides.
~ “ I think a lot of that is a ton of people have just your basic cable because it’s like how my parents still have a landline. That’s like a basic thing that you get with your house. You get gas, you get basic cable and you get water.” (21-34)
~ “The only challenge with cable right now is the movies are limited. If I want to watch a movie, I tend to go to Netflix because it’s instant. The library is pretty deep at this point. If I want to binge on a series, I go to Hulu.” (35-49))
� Further, consumers believed cable/satellite provides more flexibility to watch shows “when I want” (e.g., on demand, DVR, don’t want to wait a week for availability elsewhere).
� Per the social media scan, sports programming is the most-mentioned reason why people do not cancel service, and often as a reason to start service.
� Additionally, the top three reasons for canceling a traditional service per the scan were: service outages, customer service issues and high prices.
~ “2.5 hr after time for the cable guy, on hold 30 min, still not here. Day 4 w/o TV. Gonna cancel ASAP.” (US Consumer, via Twitter)
� Bundling discussions about channels are almost entirely one-sided online. The majority of conversations, in order of volume were: too many channels to choose from, paying for channels that are never watched or unwanted to begin with, and having to bargain with cable/satellite companies to take advantage of offers.
~ “I hate that I forgot what all the TV channels are. It takes me forever to find something to watch… too many channels.” (US Consumer)
Key findings

4 Consumer Intelligence Series | Video content consumption
Key findings
� Consumers also felt they have access to more specific programming (e.g., sports, lifestyle, local language series, etc.)
~ “Because I watch a lot of like reality TV shows and I know that there are some shows where they’ll show you it on the website, but I just prefer not to have to wait a week to see it when it comes up on the website… because I don’t like waiting a week like when I’m waiting to see what’s going to happen on the next episode.” (21-34)
~ “Because of the series and the ability to DVR them.” (35-49)
Cable Netflix Satellite Amazon Prime
iTunes Hulu Other
Which of the following Pay TV packages do you have now?
70%
41%
26%18% 16%
8%
Total Respondents
2%
73%
64%66%
56%
51%
37%
19% 20%
33%
27%
18%
26%
18%
8%
14%18%
20%
10%7%
10%8%
5%2%1%1%
6%
24%
77%
Age groups
18-2425-3435-4950-59

5 Consumer Intelligence Series | Video content consumption
Key findings
� Some consumers also like how non-traditional video services ‘understand’ their preferences, based on past behavior, and make suggestions for what other content they might be interested in. There is great interest in content discovery and curation.
~ “I think that goes back to the point about trusting the technology for suggestions more than we trust our friends, because the technology knows the truth of what we really watch, what we really like, what we linger on. Many times I’ll stop on Lifetime. Well, you know what? Technology knows you stop at Lifetime. It knows you’re watching it, so it makes suggestions.” (21-34)
~ “Definitely, yeah. I consider that a feature. Like I go there a lot to that page, like suggested for you or whatever it’s called. A discovery of things I wasn’t aware of before.” (35-49)
2. More! More! More!: Most respondents—no matter the age—have more than one video subscription, each of which provides a specific and unique benefit.
� Driven significantly by the younger 18-24 (56%) and 25-34 (51%) demographics versus the older 35-49 (37%) and 50-59 demographics (19%). This varies from some prevailing opinions that older/more wealthy consumers subscribe to additional subscription services and may demonstrate the concept of some younger consumers bypassing traditional subscriptions as “cord-nevers.”
� Non-traditional video services are appreciated for the convenience of watching all kinds of content (especially library titles) or original programming.
~ “I initially got Netflix 4 years ago when I had my daughter so that I can watch old shows because it was just easier to watch it at my convenience. So, old shows like ‘Sons of Anarchy’ and things like that I didn’t start watching from the beginning, so I got it to stream those kinds of things.” (21-34)
� Non-traditional video services also offer the ability to watch movies/series, whenever and wherever.
~ “I have [it] because like [my satellite provider], even though you can get On Demand, it’s kind of complicated because you have to hook it up to your Internet. So, it’s a little easier for me to just watch a movie on the computer, rather than having to take a long cord from my Internet all the way to the TV, so it becomes a hassle, and then it’s just more convenient to watch a movie whenever.” (21-34)
~ “There’s only so many TVs in the house and that sort of thing. Video games here, television here. There’s too much stuff going on, so it gives people options in the household.” (35-49)
Most respondents—no matter the age—have more than one video subscription, each of which provides a specific and unique benefit.

6 Consumer Intelligence Series | Video content consumption
Content discovery
3. Sources of content discovery: Recommendations from Technology seem to be more credible to some than social recommendations. In the absence of a traditional TV subscription, 64% of respondents would look to online sources for automated recommendations on content, while only 6% of respondents say they would seek friends’ suggestions.
If you didn’t have a TV subscription service, how do you think you might go about finding new content?
Content Discovery Sources
Total 18-24 25-34 35-49 50-59
Online Services 64% 76% 72% 65% 41%
Online / Internet
53% 60% 56% 57% 38%
Netflix 5% 4% 9% 4% 2%
Hulu 5% 7% 7% 4% 1%
Other Offline Sources
22% 21% 19% 23% 29%
Word of Mouth/ Friend's Suggestion
6% 7% 8% 4% 5%
Newspaper / Magazines
5% 6% 1% 5% 12%
TV Guide 5% 2% 3% 7% 7%
TV Providers 7% 1% 3% 9% 15%
Don't know 6% 3% 4% 6% 10%
4. Factors influencing content selection: The top influential factor in selecting which TV shows/programming to watch is based primarily on past viewing history and personal familiarity with the programming.
� This is true because viewing time is “allotted.” There are only so many hours in the day, and consumers want to be sure they watch the shows, series, and movies that they like.
~ “As being a busy working person who works sometimes 12-15-hour days and not having time to watch TV or want to do something else… Not having the time to watch TV, not wanting to really get invested in things, I’ll step into things from time to time, an episode…” (21-34)
~ “I mean, I DVR 99% of everything I watch. The only thing I watch live is the news because I work from home like 90% of the time so I can watch stuff and be on phone calls and send emails at the same time, and I can get through a lot of stuff.” (35-49)
� Contrary to the insignificance of friends’ recommendations for how to find content in the absence of a traditional service, 59% of consumers say they are in fact influenced by family and friends when it comes to selecting specific TV shows or channels to watch—although only 4% say that social media in general is an influence.
� Interestingly, 45% simply channel surf their way into new programming discovery, and 42% acknowledge being influenced by advertising.
Of the following options, which three best reflect how you determine what TV shows/channels you are going to watch?
Key findings
It’s a show that I have watched in the past
It was recommended by a friend/family member directly
I just flip through the channels until I see something that interests me
I saw a commercial—on TV, online, billboard, other
Was recommended from social media—not a friend or family member
88%
59%
45%
42%
4%

7 Consumer Intelligence Series | Video content consumption
Key findings
C. Packages, pricing, and advertising
6. My package preference: The mantra of customization and personalization remains loud and strong. Consumers want what they want, when they want it. 73% of consumers would prefer to customize their package, picking and choosing the channels that suit their individual interests.
� This provides more control over the content that appears on their screens and allows their viewing time to be more enjoyable and well-spent. They say they feel a sense of “excitement” and “happiness” at being an “appreciated” and “valued” customer.
~ “So, if I can have a package that only fits around my schedule, I can watch what I want to watch, and if I want to watch – oh, my God.” (21-34)
~ “Think about what’s more beneficial to you. Do you want to watch a TV show with your kids or do you want to go out and play on the beach with them? I’d rather not be paying for the time of the service if I’m not using it. That’s why I love that image of the person – freedom from the chains of paying this bill and the services that I may or may not use.” (21-34)
5. Original programming is critical: Original programming is important to a majority of respondents (63%), skewing more so to the 25-34 age group (72%) and less so to the 50-59 age group, of whom 52% say it is not important.
� Focus group respondents reinforced the importance of original programming in their selection of a particular subscription service and cited this as a key reason they stay with that service.
~ “I mean, Netflix is nominated for Emmys this year. That’s the shocker right there – original content developed for Internet only is nominated for Emmys. Well, ‘House of Cards’ is up for best drama. It’s not a TV show through your cable provider.” (21-34)
~ “Netflix has series that only Netflix has, really good series, quite frankly. So, that plus my kids, they always watch it. I just watch it for the series. Awesome. It’s definitely worth the $8.00 a month. And like I said, my kids watch everything on there.” (35-49)
How important is original programming in influencing your interest in subscribing to a particular service?
23%
Very important
Somewhat important
TotalRespondents
18-24yrs
25-34yrs
35-49yrs
50-59yrs
40%
23%
14%
21%
45%
23%
11%
28%
44%
20%
8%
25%
37%
23%
15%
16%
32%
29%
23%
Not very important
Not at all important

8 Consumer Intelligence Series | Video content consumption
Key findings
� For some, there is an expectation that in customizing their own packages, they would save money on their service. They believe if they are accessing fewer channels or shows that they should be paying less for their subscription.
~ “It’s like you have to keep paying more money just to get the channels that you want. So I’d rather customize my package so that I can pay one price, but I know the channels that I’m getting are all going to be the ones that I want to watch.” (21-34)
~ “If you get the channels that you really want, you have to pay extra and you’re going to get a bunch of [content] you don’t want. So you’re paying for a lot of generals and a lot of advertising that you aren’t going to watch anyway, but you’re paying for it. You’re paying to have it available to you, even though you’re not even going to utilize it. So, I feel like I’m being taken advantage of because I’m paying to access that when I don’t ever access it.” (21-34)
~ “I think customized more for me implies that you’re paying for the package that you put together, rather than you paying for everything. So that’s like a major part of it for me.” (35-49)
~ “It’s just that I also have a bunch of other channels that just sit there, that aren’t doing anything. So, if they could take that off and lower my bill each month, that would be great. That’s why it’s better to have a customized package.” (35-49)
~ If I have something specific targeted towards me, I want to pay accordingly to it. The content is what I’m paying for. I don’t want to pay for the marketing material, the advertising involved. I just want to pay for the content that I asked for. Liberating, free, relaxing. And I’m saving money. I’m saving myself time.” (21-34)
I would prefer an “a la carte” package of channels that I put together
I would prefer my pay-TV package to be more customized to my individual interest
I prefer to have the entire “full package” of programming so I have more options
I would prefer a smaller “essentials” or basic package
I would prefer my pay-TV package to allow access to individualized shows rather than full channels
Age groups
18-2425-3435-4950-59
TotalRespondents
44%
73%
29%
14%8% 6%
38%
47%49%
43%
30%28%
29%27%
21%
15%
12%
9%7% 8% 7%
10%
6% 7%5% 5%
Please indicate which of the following packages best reflects your preference for Pay TV Packages:

9 Consumer Intelligence Series | Video content consumption
7. Number of channels willing to access: Of those interested in a customized/a la carte package, 65% would be willing to access 10+ channels to customize their package. This is driven slightly by the older demographic (50-59, at 73%), while the youngest demographic (18-24) is more likely to access fewer (6-9) channels.
� Among those interested in a customized package, cable channels continue to rule, as 69% would be more likely to select basic and 67% would select premium as channels to be purchased as part of a customized package.
� As previously indicated, cable networks/programming is considered a staple of TV viewing. While it is not all-encompassing relative to programming desires, it provides a foundation that must be a part of any customized package of services.
� Basic sports (59%), lifestyle (56%), and news (45%, driven by the oldest demographic at 55%) channels are also likely to make the cut.
� There is less interest in children’s programming (21%) or premium sports channels (29%).
Key findings
How many different channels would you be willing to go to in order to put together your “a la carte” or custom package?
Which programming channels would you be most likely to purchase as part of your “a la carte” or custom package?
Basic cable
Premium cable
Sports
Lifestyle (e.g., home, food)
News
Premium sports
Children’s programming
Other
69%
67%
59%
56%
45%
29%
21%
7%Total Respondents
6%8%9%13%9%
21%
73%
25%
67%
28%
64%
32%
55%
26%
65%
10 or more
6-9
2-5
Totalrespondents
18-24yrs
25-34yrs
35-49yrs
50-59yrs
10 Consumer Intelligence Series | Video content consumption
Key findings
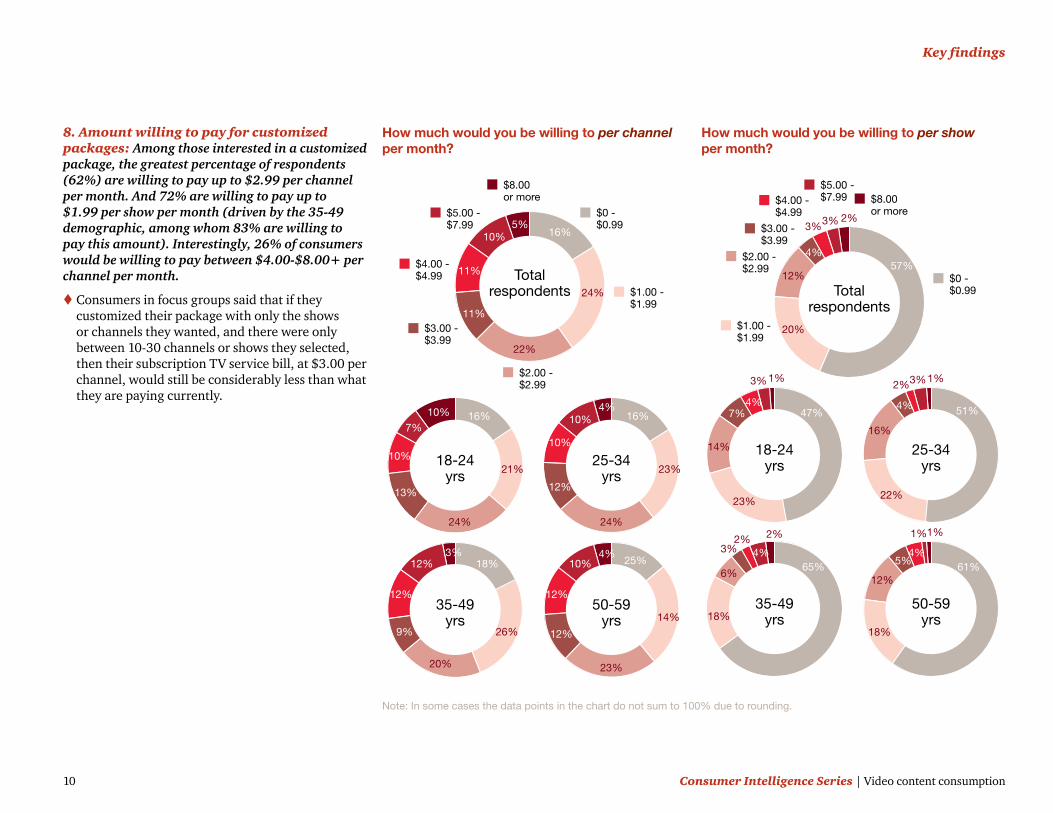
8. Amount willing to pay for customized packages: Among those interested in a customized package, the greatest percentage of respondents (62%) are willing to pay up to $2.99 per channel per month. And 72% are willing to pay up to $1.99 per show per month (driven by the 35-49 demographic, among whom 83% are willing to pay this amount). Interestingly, 26% of consumers would be willing to pay between $4.00-$8.00+ per channel per month.
� Consumers in focus groups said that if they customized their package with only the shows or channels they wanted, and there were only between 10-30 channels or shows they selected, then their subscription TV service bill, at $3.00 per channel, would still be considerably less than what they are paying currently.
5%
$8.00 or more
$5.00 -$7.99
$3.00 -$3.99
Totalrespondents
18-24yrs
25-34yrs
35-49yrs
50-59yrs
10%
11%
11%
22%
24%
16%
10%
7%
10%
13%
24%
21%
16% 16%
23%
24%
12%
10%
10%4%
14%
25%
23%
12%
12%
10%4%
18%
26%
20%
9%
12%
12%3%
$4.00 -$4.99
$2.00 - $2.99
$1.00 - $1.99
$0 - $0.99
2%3%3%
$8.00 or more
$5.00 -$7.99
$3.00 -$3.99
Totalrespondents
18-24yrs
25-34yrs
35-49yrs
50-59yrs
4%
12%
20%
57%
4%
4%
6%
7%
14%
23%
47%
1%3% 3%2%
2%2%3%
51%
22%
16%
12%
18%
4%
4%5%
1%
1%1%
18%
65% 61%
$4.00 -$4.99
$2.00 - $2.99
$1.00 - $1.99
$0 - $0.99
How much would you be willing to per channel per month?
How much would you be willing to per show per month?
Note: In some cases the data points in the chart do not sum to 100% due to rounding.

11 Consumer Intelligence Series | Video content consumption
Key findings
9. Willingness to watch ads in lieu of fees: Eight out of 10 respondents preferring a customized TV package are willing to watch advertising in lieu of paying fees.
� Focus group respondents want to know how much they are going to save by watching ads.
• For the older crowd (35-49) especially, watching ads is mostly not worth what they’d save in fees.
• The younger crowd (21-34) seemed more willing to accept the general offer, although they were also curious about how much they would be saving in fees.
� Of those willing to watch ads in lieu of fees, 60% would be willing to watch 1-2 MORE ads on their television screen, if given the opportunity to select the ad category that appealed to them. And 58% are willing to watch 1-2 MORE ads on their computer screen. This suggests that computer screens are becoming more mainstream for TV or movie viewing.
� As the screens get smaller and more mobile, the willingness to watch advertising in lieu of fees—even ads that may directly appeal to them—greatly diminishes.
Television60%
Tablet47%
Cell phone47%
Computer58%
18-24
19% 12%30% 25%
15%25%
32%
28%
23% 29%30% 34%
15%23%
28%34%
25-34 35-49 50-59
Totalrespondents
3 ads or more 2 ads 1 ad 0 ads
15%23%
32%31%
18-24
39% 37%7% 9%
7%
16%
31%
46%
34% 33%
21% 21% 48%9%
31%
12%
25-34 35-49 50-59
Totalrespondents
63%3%
26%
8%
18-24
50% 50%
8% 7%
7%9%
25%
60%
28% 29%14% 14%
62%
8%25% 5%
25-34 35-49 50-59
Totalrespondents
79%
4%13% 4%
18-24
24% 20%12% 14%
29%13%
23%
35%
36% 36%
28%
30%
31%17%
36%
17%
25-34 35-49 50-59
Totalrespondents
46%8%
31%
15%
Number of ads willing to watch
Note: In some cases the data points in the chart do not sum to 100% due to rounding.

12 Consumer Intelligence Series | Video content consumption
Key findings
~ “Maybe it’s my age, but I still like to be there Wednesday nights at 9:00 or whenever it comes on. I want to see it live.” (35-49)
~ “I still wouldn’t watch it live. I’d watch it at like 9:00 or a little after the show. Nowadays, 90% of the cable companies have a DVR service. Fast-forward through the commercials. You’re just going to record it and watch it later and go through the commercials.” (21-34)
� The issue with watching ads on mobile devices is that when they are viewing content on their smaller-screen mobile devices (especially their cell phones) – and this is something respondents did not do much of, as reported in PwC’s Consumer Intelligence Series 2011 research on Premium Content – they are usually “on the move” and have a short amount of time to view content. They don’t want that time interrupted with advertising.
• At home they can walk away from the ads if they want to. When they’re on the go, they cannot.
� There’s also concern about using up their bandwidth and battery.
� And finally, it’s simply not “comfortable” watching a lot of content on smaller screens, so they don’t want to be further inconvenienced by having to extend their time by watching ads.
~ “Sometimes I watch through the iPad and they have ads, and it’s always repeating ads. Like I think one of them was Home Depot or something. But if you click on it… it took me to a Home Depot site. So, one, that was annoying, but if it was something like it was tailored to me… oh, these are the categories that I like, and then I click on it and it takes me there, maybe you could do the same thing, like it figures out what I want and then it tailors ads to me. So it could be more broad, but have the same genre of ads. And it would keep growing, depending on other things that I clicked.” (21-34)
~ “Because when you’re on your cell phone watching something, you’re usually on the go or you’re usually doing something and you don’t really have time to waste watching it.” (21-34)
~ “And it’s annoying because you’re like say waiting at a doctor’s office or… Your time is short. Whereas when you’re at home, that’s probably where you’re watching TV, you have more time.” (21-34)
~ “One commercial is okay, but then when it’s like 2 or 3… and repeating them over and over.” (35-49)
~ “You have to look at the comfort level of watching something on a cell phone. It’ll get to your neck at a certain point. Your arms might start hurting. The commercials are prolonged and then you just get annoyed and sometimes just turn it off.” (35-49)
10. Current viewing behavior: A slight majority of consumers (57%) record their preferred TV content to view at a later, more convenient time. This is less prevalent among the 50-59 demographic (37%).
� Although focus group respondents insist they want control over when and where they view their preferred content and say they record their preferred shows for convenient viewing (and to avoid the commercials), there are a few shows that command a “live” viewing—especially if they are active users of social media who don’t want “spoilers”.
� This supports the quantitative research, in which 47% of consumers say they watch most of their TV content “live.” (This is more prevalent among the older demographic, 50-59, at 65%.)
~ “Live? Only the news.” (35-49)
~ “NFL network, I watch that 50% of the time, quite frankly, live. And then I guess the other sport stuff. ” (35-49)
I record most of the TV conent I watch to view at a later time convenient to me
Total Respondents
I watch most of my TV content live
I “binge-view” favorite series—that is I record each episode and then watch all at once
I often record shows for later viewing, but then never get around to watching them
10% 7%
57% 47%
Real-time versus time-shifted viewing

13 Consumer Intelligence Series | Video content consumption
Key findings
D. Interaction with online and mobile
11. Online access of content: The majority of consumers (66%) access some content online.
� Driven mostly by the 18-24 and 25-34 demographics
� Consumers access more TV content from Netflix (63%) than any other option provided
• Netflix access driven most by the 18-24 demographic (77%) and least by the 50-59 (35%)
� 49% of consumers access TV content from TV networks’ online sites (no age skews)
� At 35%, Hulu rounds out the top three sites from which TV content is accessed.
• Skewed more by the 18-24 demographic (50%)
• Skewed less by the 35-49 demographic (25%)
• In focus groups, the older demographic actually had much more affinity for Hulu than the younger group, but this was largely for HuluPlus.
• The younger demographic was favorable toward Hulu because they could access the latest episodes (without having to wait). But they were not as favorable about having to pay (for HuluPlus) when they could just as easily DVR their favorite shows.
~ “If you’re paying for Hulu, I’m not going to pay for my cable. But since I have cable already, why pay for Hulu? Hulu, based on all the shows, they come out that day or the following day. But since we have DVR services nowadays and are paying for so many different packages of cable, I just watch it on my DVR.” (21-34)
~ “I think because Hulu is 100% streaming and Netflix is not, I guess there’s an option. I don’t know why somebody would want to be responsible for a DVD in the mail. That’s crazy to me, but Hulu, like I said, it’s 100% streaming.” (35-49)
63%Netflix
11%
10%
6%
3%
9%
Hulu Plus
TV Links
Sidereel
The Pirate Bay
Other
49%TV networks’online sites
35%Hulu
28%Amazon Prime
25%iTunes
24%HBO GO
14%XFINITY
Total Respondents
12. Use of mobile device (second screen) while watching TV: More than half the respondents (55%) say they usually/sometimes/always use their mobile device while watching TV (and 45% rarely or never use it). This skews slightly to the 25-34 age group (65%).
� Among this group, 56% say their use of a mobile device while watching TV is sometimes related to a specific show.
• Consumers in the 25-34 demographic are more likely than the other groups to always use their mobile device related to a specific show (small absolute percentage).
� Only 39% of consumers are interested/very interested in using their mobile device to access additional content related to specific TV shows they watch most often.
• What interest exists is driven mostly by the 18-24 demographic (47%).
• Among the 50-59 group, 74% are not very/not at all interested.
� Few online conversations mention interactivity through apps while watching content, though there are over 3,000 people that discuss consuming on-demand content on their phones or tablets.
� Online conversations about shows delivered via traditional providers are largely event-driven, such as season debuts or significant plot changes, even when those shows are available via on-demand. There is a regular cadence of build up and decline as each episode airs for the first time.
What sites do you go to access TV content online?

14 Consumer Intelligence Series | Video content consumption
Key findings
13. Effect of increased availability of Internet content on traditional packages and subscriptions:
� For 35% of respondents, the increased availability of Internet content has little or no effect on the value they place on traditional subscription packages. This finding is not surprising, given the focus group’s passion about the shows they love – many of which require access to traditional subscription packages.
� That said, a similar number of respondents (31%) say increased availability of content on the Internet will lessen the value placed on traditional subscription packages. Perhaps this can be attributed to a perception that more and more “traditional pay TV content” will become accessible on the Internet in a more acceptable time frame.
� In qualitative discussion, simultaneous mobile phone engagement while watching TV seems to be much more prevalent than respondents in the survey. Consumers say they have their phone with them “all the time” they are watching TV, using it to check out characters, actors, and so on that have to do with the particular show they are watching, or emailing, texting (sometimes about the show they are watching, sometimes not), game-playing, or checking their calendar.
~ “That’s what I use the phone for when I’m watching something. It’s like, I’ve seen that person before. Where have I seen them before? And I’ll go and look up where I’ve seen them before. Or this is an interesting episode. I wonder who directed this episode. I use it for looking up and finding the connections of things. One thing that the Xbox has with some of the content is it’s got a smart glass app with my iPad, so it syncs up with some of the shows and gives you some kind of information. So when you watch, there’s a map of where things are taking place in their universe and you can follow along with it. So, that to me is a little bit more of what I’ll use it for.” (21-34)
~ “When I first started watching, I was catching up… I had a friend turn me on to it and so I was texting her – ‘oh, this is amazing’ or ‘I can’t believe this.’ But then that kind of went down… then I would only text her during commercials when we were watching the show at the same time.” (21-34)
~ “If there’s like a business call or something, an email, I have to put the TV on pause and take care of that and then go back to TV. Or my daughter gets into something, the TV has to go paused. I’m pausing it all the time.” (35-49)
~ “If I’m watching something and somebody says something that I’m interested in, I might look it up and if it’s really interesting, then I’ll pause what I’m watching to get a little more immersed in whatever I’ve just looked up. Or I’m doing it at the same time, which is probably more common.” (35-49)
~ “I look up IMDB, location stuff. What else was that actor in? I can’t remember that actor’s name, but I know that they were in it with this other person, so I can look up a couple of names and figure out what that other movie was.” (35-49)
Value of Pay-TV with Internet Content
Total 18-24 25-34 35-49 50-59
Effect 35% 33% 28% 39% 45%
Has no effect 27% 27% 21% 28% 36%
Has little effect 7% 4% 6% 9% 7%
Decreases/Lessens Value 31% 32% 38% 28% 24%
Decreases/loses value 23% 24% 28% 22% 17%
Hope price would decrease since value decreased 6% 6% 7% 5% 7%
Prefer Internet 14% 14% 18% 14% 9%
Considering discontinuing pay TV/cable 5% 3% 7% 6% 3%
Prefer/Like Pay TV 13% 14% 15% 10% 12%
Prefer to watch on regular TV, not PC/laptop 5% 6% 4% 4% 6%
Other 5% 4% 6% 3% 5%

15 Consumer Intelligence Series | Video content consumption
� There may be an opportunity to “wean into” acceptance on the smaller screens if fees are more substantially reduced.
6. The use of mobile devices while watching TV content is prevalent and, based on the qualitative discussion, on the rise.
� Consumers seem to enjoy the interaction between the television content and their mobile device. There is an opportunity to better integrate “live” shows, especially with the younger demographic, with content-related links for more information about the show.
� This increases engagement with the show and could perhaps promote more “live” viewership.
7. There is a lack of consensus on the effect of increased availability of online content on the value of traditional subscriptions.
� To maintain the value of traditional subscriptions, providers must continue to offer exclusive programming that is either not available online or is only available in a less timely fashion.
1. Consumers generally subscribe to more than one service. With traditional video subscriptions as the foundation, there is an opportunity to continue to make this venue even more viable with original programming and customization options.
2. Consumers continue to want control over when and where they watch their TV content, and what it will be. TV Everywhere services are growing in usage and importance to consumers and can differentiate subscription providers. With this said, there is an opportunity to “push” live TV consumption, since certain shows (especially news, sports, and reality genres), can command more of a “live” presence.
3. Customization is empowerment. Being able to design their own subscription packages gives consumers a sense of control - especially as it involves how they spend their money. They want to know that they are paying only for what they want to watch. There is an opportunity, via programming, “recommendation engines,” and pricing options – designed by the subscription services – for subscription services to “excite” the consumer by making them feel more empowered. And also discover new content and channels.
� Basic and premium cable channels will usually populate a consumer-designed custom package.
� Since they are willing to pay by show and by channel, there is an opportunity to offer, as an upgrade, a list of specific shows/channels from which to customize.
4. Having an online presence with a strong content recommendation engine opens the door to content discovery. In the absence of knowledge of the content specific services provide, consumers will consult online sources to find out about new programming. Even if friends and family make recommendations, there is a likelihood that online sources will be consulted to provide more information on programming. And some consumers believe the recommendation engine makes better recommendations due to a better understanding of their preferences than friends/family.
5. Consumers are generally willing to watch ads in lieu of fees. This has become a mainstream expectation for consumers. And willingness increases with the ability to select advertising categories related to individual interests.
� Given that consumers are more receptive to viewing ads on the larger screens, such as TV and computer, they will likely be more amenable to ad-attached packages for these formats than for tablets or mobile phones.
Implications
© 2013 PricewaterhouseCoopers LLP, a Delaware limited liability partnership. All rights reserved. PwC refers to the US member firm, and may sometimes refer to the PwC network. Each member firm is a separate legal entity. Please see www.pwc.com/structure for further details. This content is for general information purposes only, and should not be used as a substitute for consultation with professional advisors.
DC-14-0029. Rr.
www.pwc.com
For more information on this research, the PwC Consumer Intelligence Series, or how changing consumer preferences are shaping the entertainment, media, and communications industries, please contact one of our specialists:
Deborah [email protected](213) 217-3302
Matthew [email protected](213) 217-3326
Cindy [email protected](213) 217-3545
Mary Shelton [email protected] (310) 741-7011
Todd [email protected](213) 356-6505
Explore other issues of this series online at http://www.pwc.com/consumerintelligenceseries