consumer path to purchase - retail council of · to better understand the consumer path to purchase...
TRANSCRIPT

Copyright 2014. The NPD Group, Inc. All Rights Reserved. This document is
Proprietary and Confidential and may not be disclosed in any manner, in whole or in
part, to any third party without the express written consent of NPD.
The Retail Council of Canada
March 2014
Consumer Path to Purchase

2
Objectives and Methodology p.3
Executive Summary: Insights and Implications p.4
Executive Summary: Metrics at a Glance p.16
Understanding the Touchpoints
Winter Apparel p.22
Personal Accessories p.36
Beauty p.49
PC/ Electronics p.61
Beverage DA p.74
Online Purchase, Consideration and In-Store Synergies p.87
Table of Contents

3
Objective: To better understand the consumer path to purchase with an emphasis on how digital touchpoints influence
consumer behaviour and potentially interact with the consumer in-store experience.
The study aims to help retailers identify opportunities to increase purchase conversion by improving digital
marketing strategies and tactics and the synergy between digital efforts and in-store efforts.
Methodology: An Online survey was fielded from January 23 to February 7, 2014 to a Canadian representative sample of
3,337 panelists aged 18-64, representing Canadian adult demographics.
To qualify, respondents indicated a planned purchase of one of the following products in the past month:
o Winter Apparel n=698 (Winter coat or jacket n=362, Winter boots n=336)
o Personal Accessory n=555 (Watch n=409, Handbag, purse or satchel n=146)
o Beauty n=699 (Face or beauty cream n=699)
o PC/ Electronics n=793 (Headphones n=403, Tablet computer n=212, Notebook/ laptop/ desktop computer n=179)
o Beverage DA n=592 (Single serve coffee machine n=340, Juicer/ Juice extractor n=108, Espresso machine n=76, Soda maker n=69 )
Research notes: NPD reports at n>75. However, if base sizes are between 75-99, these are noted by an asterisk as an
indication of interpretation with caution
Objectives and Methodology

The image should fill up the entire space of the gray box, no gray should be seen
Executive Summary: Insights and Implications

5
Path to Purchase Overview
• The present study reinforces that physical stores are
still the dominant purchase channel (for planned
purchases)
• Channel dominance varies by category, e.g.,
91% in-store purchases for Beauty vs. 70% for
PC/Electronics
• Moreover, online purchase consideration among the
in-store buyers is low
• Varies by category, e.g., 8% consideration in
Beauty vs. 31% in PC/Electronics
• Consistent with expectations, the in-store
experience is a dominant touchpoint to convert
shoppers to buyers
• The in-store visit was the most common touchpoint
used among Winter Apparel, Personal Accessories
and Beauty buyers and ranked second for
PC/Electronics and Beverage Domestic Appliances

6
Path to Purchase Overview
• Yet, among those who reported information
gathering in-store, many did not make a purchase at
that point and opted to explore other touchpoints
after the store visit
• There is an opportunity, therefore, for retailers to
improve their in-store experience to better convert
shoppers to buyers (rather than risk losing these
potential sales)
• A retailer has to ensure that all point-of-sale
materials are optimized and store associates are
thoughtfully trained to help a shopper reach a
purchase decision
• One possible strategy that appears to resonate
with consumers is to provide access to
interactive digital displays in the store to allow
shoppers to learn more about the brands and
products

7
Path to Purchase Overview
• The demand for digital interactive displays is
quite high ranging from 52% in Beauty to 71%
in Beverage Domestic Appliances
• Another strategy is to allow shoppers to purchase
products from a store’s website if the product,
model, size or colour was not available in-store
• Varying by category, two-thirds or more would
like to be able to purchase products from a
store’s website as part of their in-store
transaction
• Also of great interest, across all categories there
were a large proportion of shoppers who explored
various information sources yet reported that they
did not rely on in-store information to inform their
decision at all
• Varies by category, e.g., 58% in Beverage
Domestic Appliances vs. 36% in Beauty

8
Path to Purchase Overview
• The planned buyers captured in this study reported
their purchase process took about 3 weeks thus
highlighting the opportunity that retailers and brands
have to engage with consumers
• Duration varies by category, e.g., average of 22
days for PC/Electronics and Beverage
Domestic Appliances vs. only 7 days for Beauty
• At the broadest level, therefore, the general findings
are consistent with the assumption of informed
consumption
Ultimately the present study revealed the overall
importance of understanding the path to purchase,
the touchpoints utilized along the way and the
opportunity to influence or recruit shoppers during
their decision process

9
Brand Conversion from Initial Consideration
• On average, shoppers reported that they had less
than 2 brands in mind when they first thought about
making their purchase
• Although in some categories brand purchase
conversion from initial consideration set was high
(e.g., 85% in Beauty and 81% in Beverage Domestic
Appliances) other categories revealed a tremendous
opportunity for brands to enter the consideration set
and rise above the competitors
• For example, only 52% conversion in Winter
Apparel and 60% in Personal Accessories
• There are many implications that stem from low
conversion from initial brand consideration to
purchase conversion
• It is not enough to simply drive brand
awareness and earn initial consideration

10
Brand Conversion from Initial Consideration
• Emerging brands or smaller, less dominant
brands have the opportunity to recruit buyers
and successfully compete with brands that may
have been on the initial consideration set
• Obviously, optimizing a brand’s footprint across
touchpoints is critical
• Brand information should highlight performance
on key purchase selection criteria, establish
brand differentiation while guiding consumers to
specific products that fit their willingness to
spend

11
Retailer Conversion from Initial Consideration
• On average, shoppers reported that they had less
than 2 retailers in mind when they first thought about
making their purchase
• Retailer conversion from initial consideration to
purchase was generally higher than brand
conversion
• Retailer purchase conversion from initial
consideration was highest in Beauty (88%) and
lowest in Personal Accessories (72%) and
Winter Apparel (73%)
• While retailer conversion from initial consideration is
higher than for brands, there is still a viable
opportunity to recruit shoppers to other destinations

12
Touchpoint Influence and Impact
• All touchpoints were deemed helpful by a majority of
their respective users across all product categories
(i.e., no touchpoint received less than 63%
endorsement for this measure)
• Perhaps more importantly, the majority of touchpoint
users across all categories, with the exception of
Beauty, reported that they either identified new
brands or retailers worth considering or were able to
rule out brands or retailers that they had been
considering
• Word of Mouth is the most impactful for identifying a
brand or retailer
• For example in Winter Apparel, 56% reported
identifying a new brand and 48% a new retailer
• More than 30% in both PC/Electronics and
Beverage Domestic Appliances reported
identifying a new retailer

13
Touchpoint Influence and Impact
• Store Websites are most important for identifying
new brands for PC/Electronics (52%) and Beverage
Domestic Appliances (44%)
• Online brand or product reviews appear to be the
most influential in ruling out a brand
• For example, 49% in both PC/Electronics and
Beverage Domestic Appliances and 40% in
Winter Apparel
• Online brand or product reviews can also
impact retailer consideration with 33% of Winter
Apparel buyers reporting that the touchpoint
helped rule out a retailer
• In contrast, touchpoints generally have relatively
little influence on retailer consideration for Beauty

14
Touchpoint Influence and Impact
• Price/promotion and product information are
dominant motivators for touchpoint usage across all
categories
• Although shipping cost is particularly unique
and relevant for Online Retailers without a Store
Location
• Obviously wanting to see and touch the product
appears to be a significant motivator for an In-
Store visits across all categories
Overall, the pattern of results suggests that brands
and retailers will not optimize their sales without
thoughtful consideration of their footprint across
touchpoints
Strategies should be derived to reach and recruit
new consumers while satisfying their core
customer base

The image should fill up the entire space of the gray box, no gray should be seen
Executive Summary: Metrics at a Glance

16
5)
No. of Days Passed 18 20 7 22 22
No. of Brands in Mind 1.4 1.6 1.6 1.7 1.7
Bought the Brand
from Consideration
set (%)
No. of Retailers in
mind 2.2 1.9 1.4 2.0 2.1
Bought among
retailers first
considered (%)
74
51
72 78 70
Incidence of Planned
Purchasing (%)
73 72 88
81 81
Yes Yes Yes Yes
Influences on the purchase decision appear to impact purchasers of Winter Apparel and Personal
Accessories most, both index low on the rate of which the purchased brand was an originally
considered option. Beauty indexes low for both time passed before purchase and number of
retailers considered.
52 60 85 71 81
Yes
Yes Yes Yes Yes Yes
Base: Planned
Purchasers
Winter Apparel (698)
Personal
Accessory (555)
Beauty (699)
PC/ Electronics (793)
Beverage DA (592)

17
Usage of Touchpoints
Q.7 Which of the following sources of information, if any, did you use to inform
your purchase decision (where to buy it or what brand to buy)?
42
24
24
20
17
13
9
20
Winter Apparel
(698)
Personal
Accessory
(555)
Beauty
(699)
PC/
Electronics
(793)
Beverage DA
(592)
40
14
19
13
18
15
20
20
25
20
8
17
9
8
5
39
30
28
35
25
26
29
21
14
35
34
28
38
27
30
14
7
In-Store Displays, Product
Info, Store Associates
Retail Flyers
Store Websites
Word of Mouth
Recommendations
Brand or Manufacturer
Websites
Online Brand or Product
Reviews
Online Stores w/o Store
Locations or Auction Sites
None of the Above
%
Base: Planned purchasers
In-Store Touchpoints generally dominate although Store Websites for PC/Electronics and Word of
Mouth sources for Beverage Domestic Appliances are relied on more often.
Beauty customers are the least likely to utilize information sources to inform their purchase decision.

18
89
77
91
70
84
Winter Apparel (698)
Personal
Accessory (555)
Beauty (699)
PC/ Electronics (793)
Beverage DA (592)
17
83
19
81
8
92
31
69
26
74
Online In-Store
11
23
9
30
16
Base: Planned Purchasers, Floating Base
Q.38 Did you buy it in-store or online?
Q.41 Did you consider making your purchase online?
Considered Online?
No
No
No
No
No
Yes
Yes
Yes
Yes
Yes
Online Purchase
%
A clear majority of buyers from all product segments made their purchase In-store, most
noticeably 91% in Beauty, of which only 8% of in-store buyers even considered purchasing online.
Customers of PC/Electronics appear most likely to consider online purchases.
*Online indexes
high with males
and In-Store
indexes high with
respondents aged
55-64.

19
% Winter Apparel Personal
Accessories Beauty PC/Electronics Beverage DA
Base: In-store purchasers (622) (425) (635) (556) (499)
Want to see and touch the product 60 50 25 36 34
Risk/inconvenience with return 45 25 13 21 23
Didn't want to wait for delivery 22 20 32 34 29
Don't like to shop online 18 18 18 16 15
Shipping and handling costs 16 18 24 21 26
Prefer to talk to the store associates 13 14 9 21 11
Using credit card doesn't feel safe 11 13 10 11 13
I don't own a credit card 9 8 5 8 8
Online pricing was higher 8 9 6 8 16
Risk of losing the product in the mail 7 8 6 10 8
Not available online 4 6 5 2 3
Don't deliver to my area 1 2 1 1 3
No particular reason 6 12 16 10 6
Across all categories, the most significant barrier for purchasing from online is the need to see
and touch the product, followed by risk/inconvenience with return especially for Winter Apparel
and Person Accessories. The preference to talk to the store associates appears to be a barrier
particularly for PC/Electronics.

The image should fill up the entire space of the gray box, no gray should be seen
Understanding the Touchpoints -Winter Apparel

21
Bought a brand Among first considered
74% of purchases
are planned
18 Days passed between first thought
of buying product and making purchase
52
Bought at Retailer among first considered
73 1.4 2.2
Brands in mind
Retailers in mind
% %
Three quarters of purchases were planned and touchpoint influence appears to impact brand
consideration considerably more than retailer consideration. The purchase took place between 2-3
weeks after the first thought of buying the product.
Snapshot of Path to Purchase
Q.6 About how much time passed between the moment you first thought about
buying a [INSERT PRODUCT] and when you made the purchase?
Q.3 Please indicate whether you planned to purchase each product before you
visited the store (or website) or if you spontaneously decided to purchase the
product while you were shopping (online)
Q.4 How many brands, if any, did you have in mind when you first thought about
buying a [INSERT PRODUCT]?
Q5. And how many retailers (i.e., stores/websites), if any, did you have in mind
when you first thought about buying a [INSERT PRODUCT]?
Q.39 And was this store or online source among the ones
you had first considered when you started to think about
buying a [INSERT PRODUCT]?
Q.40 And was the brand you bought among the ones you
had first considered when you started to think about
buying a [INSERT PRODUCT]?
Base: Purchasers of
Winter Apparel, n=2,666
Base: Planned Purchasers
of Winter Apparel, n=698

22
In-Store
Displays,
Product Info,
Store
Associates
Retail Flyers Store Websites Word of Mouth Brand or
Manufacturer
Websites
Online Brand or
Product
Reviews
Online Stores
w/o Store
Locations or
Auction Sites
None of the
Above
42
24 24 20
17 13
9
20
Base: Planned Purchasers, n=698
Q.7 Which of the following sources of information, if any, did you use to inform
your purchase decision (where to buy it or what brand to buy)?
Touchpoints Usage
%
In-store information sources are clearly the preferred touchpoint for the Winter Apparel segment,
capturing 42% usage. Retail Flyers and Store Websites trail significantly behind in second.
*Index high
among 55-64 *Index high
among 18-34

23
Not Helpful At All
Base: Touch point users
Q.10,14, 18, 23, 28, 33 How helpful was the information you found?
Word of
Mouth
(139)
Store
Websites
(170)
Brand or
Manufacturer
Websites
(118)
Online Brand
or Product
Reviews
(92*)
In-Store
(294)
Helpfulness
46 53
42 53 52
29 18
21
13 22
24 26
34 31
26
1 1
3 1
1 1 1
75
71
63
66 74
*Caution: Low base size; Online W/O Store Location is BTS, Not reported
%
Extremely Helpful
Very Helpful
Somewhat Helpful
Not Very Helpful
All touchpoints are considered helpful, especially Word of Mouth and In-store.

25
41
31
40
37
30
30
40
29
30
30
39
43
44
45
56
Impact on Brand Consideration
Identified additional brands Ruled out brands Didn’t learn anything new
Word of Mouth
(139)
Store Websites
(170)
Brand or Manufacturer
Websites
(118)
Online Brand or
Product Reviews
(92*)
In-Store
(294)
Base: Touch point users
Q.11, 15, 19, 24, 29, 34 Did you identify any brands worth considering that you hadn't
already considered or rule out any brands that you had already been considering?
%
*Caution: Low base size; Online W/O Store Location is BTS: Not reported
At 56%, Word of Mouth information appears the most likely to expand brand consideration and
Online Brand or Product Reviews appear the most likely cause for brands being ruled out, as
indicated by 40% users.
70
63
60
69
59
Total
Impact

26
62
42
41
36
35
24
33
26
33
25
18
38
43
41
48
Impact on Store/Website Consideration
Base: Touch point users
Q.11, 15, 19, 24, 29, 34 Did you identify any stores or websites worth
considering that you hadn't already considered or rule out any stores or
websites that you had been considering already?
*Caution: Low base size; Online W/O Store Location is BTS: Not reported
%
Word of Mouth
(139)
Store Websites
(170)
Brand or Manufacturer
Websites
(118)
Online Brand or
Product Reviews
(92*)
In-Store
(294)
At 48%, Word of Mouth information appears the most likely to expand Store and Website
consideration.
65
64
59
58
38
Total
Impact
Identified additional stores/websites
Ruled out stores/websites Didn’t learn anything new

27
87
69
61
37
33
Base: Touch point users
Q.13, 17, 22, 27, 31 What type of information did you look for on/in
[INSERT TOUCHPOINT]?
Prices, sales,
promotions
Product
information
Availability
Shipping costs
User reviews
%
Types of Information Sought After (Top 5)
Store Websites
(170)
Brand or Manufacturer
Websites
(118)
Online Brand or
Product Reviews
(92*)
In-Store
(294)
Product
information
Prices, sales,
promotions
Availability
User reviews
Brand information
*Caution: Low base size; Online W/O Store Location is BTS: Not reported
68
61
50
44
42
Product
information
Prices, sales,
promotions
Brand information
Availability
Just shopping around/
looking for ideas
77
67
51
38
16
Prices, sales,
promotions
Wanted to see/
touch product
Product
information
Recommendations
Return policy
79
67
50
23
23
Users of each touchpoint except In-Store information indicate product information and price
including sales and promotion as the top two types of information for research. A desire to
see/touch the item pushes product information to third place for In-Store users.
87% of customers who visit Store Websites are looking for price related information.

29
16 7
17 8
10 6
8 6
7 5
7 3
Pre In-Store Post In-Store
Store Websites
Retail Flyers
Word of Mouth
Brand or Manufacturing
Websites
Online Brand or Product
Reviews
Online w/o Store
Location
Q.7 Which of the following sources of information, if any, did you use to inform
your purchase decision (where to buy it or what brand to buy)?
Q.8 And in what order did you use these information sources?
38% don’t rely on In-Store touchpoints to inform their purchase decision. Among those who do, many
do not make a final purchase decision at this point and go on to explore other touchpoints.
Interestingly, those who rely on in-store touchpoints are significantly less likely to rely on the majority
of other touchpoints.
In-Store Visit
39
37
35
29
20
13
23
25
16
14
12
10
Didn’t rely on In-store
Information (n=263)
The in-store
visit is not
always the
final step in
the path to
purchase
38% Relied on In-store
Information (n=294) 42%

30
88
23
8
5
4
4
3
9
Talked to friend, family or coworkers
Professional Blogs
Personal Blogs
Discussion Forums
All Other Sources
Base: Word of Mouth users, n=139
Q.9 Which of these sources did you use word-of-mouth recommendations
on [INSERT PRODUCT]?
Digital NET =
30
Word of Mouth Usage
Information received by speaking directly to friends, family or coworkers (88%) was the dominant
source of influence among Word of Mouth users. Digital Word of Mouth sources were utilized by
30% of the users, clearly led by Facebook at 23%.

31
31
31
18
5
Base: Touch point non-users
Q.12, 16, 20, 25, 30, 35 Why didn’t you review any [INSERT TOUCHPOINT]
before buying your [INSERT PRODUCT]?
Just looked at options
In-Store
Relied on other types of
information
Information not helpful
Don’t know how to use
Word of Mouth
(418)
Store Websites
(387)
Brand or Manufacturer Websites
(439)
Usage Barriers (Top 5)
32
22
14
4
34
26
13
5
Just looked at options
In-Store
Relied on other types of
information
Information not helpful
Don’t know how to use
Just looked at options
In-Store
Relied on other types of
information
Information not helpful
Don’t know how to use
%
Consistent with In-store information sources being the most utilized touchpoints in the Winter
Apparel segment, non-users for 4 of the other 5 touchpoints indicate that they just looked at
options in-store as the main reason why the respective touchpoint was not utilized.

32
31
22
17
12
6
Won’t purchase this
product online
Just looked at options
In-Store
Relied on other types of
information
Information not helpful
Don’t know how to use
24
21
20
16
4
62
35
9
Just looked at options
In-Store
Won’t purchase this
product online
Relied on other types of
information
Information not helpful
Don’t know how to use
Already knew what I was
going to buy
Relied on other types of
information
Didn’t visit any store
locations
% Online w/o Store Location
(494)
Online Brand or Product Reviews
(466)
In-Store
(263)
Base: Touch point non-users
Q.12, 16, 20, 25, 30, 35 Why didn’t you review any [INSERT TOUCHPOINT]
before buying your [INSERT PRODUCT]?
About one third report they won’t buy winter apparel products online as the main reason why not
researching online retailers without store locations.
Usage Barriers (Top 5)

33
- At 42%, In-store touchpoints are the most utilized information source by Winter Apparel buyers.
- All touchpoints are considered helpful, especially Word of Mouth and In-store.
- Word of Mouth information is the most impactful towards the expansion of both Brand and
Store/Website Consideration at 56% and 48% respectively.
- At 40%, Online Brand and Product Reviews index high for ruling out Brand Consideration.
- Users of each touchpoint indicate product information and price as the top two reasons for
touchpoint usage except for In-store users, in which the more intimate form of information
gathering through feel and touch pushes product research to third place.
- Those who rely on in-store touchpoints are significantly less likely to rely on the majority of other
touchpoints.
- Many In-Store touchpoint users do not make a final purchase decision at this point and go on to
explore other touchpoints.
- The main reason why In-Store touchpoints were not utilized was that In-Store information is
sufficient for their purchase decision.
Summary

The image should fill up the entire space of the gray box, no gray should be seen
Understanding the Touchpoints -Personal Accessory

35
Bought a brand Among first considered
51% of purchases
are planned
20 Days passed between first thought
of buying product and making purchase
60 72 1.6 1.9
Brands in mind
Retailers in mind
% %
Half of purchases were planned and touchpoint influence appears to impact brand consideration
more than retailer consideration. The purchase took place roughly 3 weeks after the first thought
of buying the product.
Snapshot of Path to Purchase
Q.6 About how much time passed between the moment you first thought about
buying a [INSERT PRODUCT] and when you made the purchase?
Q.3 Please indicate whether you planned to purchase each product before you
visited the store (or website) or if you spontaneously decided to purchase the
product while you were shopping (online)
Q.4 How many brands, if any, did you have in mind when you first thought about
buying a [INSERT PRODUCT]?
Q5. And how many retailers (i.e., stores/websites), if any, did you have in mind
when you first thought about buying a [INSERT PRODUCT]?
Q.39 And was this store or online source among the ones
you had first considered when you started to think about
buying a [INSERT PRODUCT]?
Q.40 And was the brand you bought among the ones you
had first considered when you started to think about
buying a [INSERT PRODUCT]?
Base: Purchasers of
Winter Apparel, n=2,666
Base: Planned Purchasers
of Winter Apparel, n=698
Bought at Retailer among first considered

36
In-Store
Displays,
Product Info,
Store
Associates
Retail Flyers Store Websites Word of Mouth Brand or
Manufacturer
Websites
Online Brand or
Product
Reviews
Online Stores
w/o Store
Locations or
Auction Sites
None of the
Above
40
14 19
13 18
15 20 20
Touchpoints Usage
%
With 40% usage by Personal Accessories buyers, In-Store information sources are utilized by
about twice as many buyers as any particular digital touchpoint.
*Index high
among 18-34
*index high with
male respondents
Base: Planned Purchasers, n=555
Q.7 Which of the following sources of information, if any, did you use to inform
your purchase decision (where to buy it or what brand to buy)?

37
56 50
36
54 52
21
19
29
17 17
20 27
30 22 27
2
4 5
6 3
1
1 1
1
Base: Touch point users
Q.10,14, 18, 23, 28, 33 How helpful was the information you found?
Store
Websites
(104)
Brand or
Manufacturer
Websites
(101)
Online w/o
Store
Location
(112)
Online Brand
or Product
Reviews
(82*)
In-Store
(224)
77
69
65
71 69
*Caution: Low base size; Word of Mouth is BTS: Not reported
Helpfulness
%
Not Helpful At All
Not Very Helpful
Somewhat Helpful
Very Helpful
Extremely Helpful
All touchpoints are considered very helpful by the majority of the users. At 77%, Store Websites appear most helpful to informing the purchase decision of its respective users.

38
41
33
25
39
34
29
31
30
23
32
41
50
56
51
52
Impact on Brand Consideration
%
Base: Touch point users
Q.11, 15, 19, 24, 29, 34 Did you identify any brands worth considering that you hadn't
already considered or rule out any brands that you had already been considering?
*Caution: Low base size; Word of Mouth is BTS: Not reported
Store Websites
(104)
Brand or Manufacturer
Websites
(101)
Online w/o Store
Location
(112)
Online Brand or
Product Reviews
(82*)
In-Store
(224)
About half of the digital touchpoint users report identifying additional brands to consider.
Identified additional brands Ruled out brands Didn’t learn anything new Total
Impact
66
61
75
67
59

39
61
39
38
41
31
23
36
33
30
31
20
31
38
40
50
Impact on Store/Website Consideration
Base: Touch point users
Q.11, 15, 19, 24, 29, 34 Did you identify any stores or websites worth
considering that you hadn't already considered or rule out any stores or
websites that you had been considering already?
*Caution: Low base size; Word of Mouth is BTS: Not reported
%
Store Websites
(104)
Brand or Manufacturer
Websites
(101)
Online w/o Store
Location
(112)
Online Brand or
Product Reviews
(82*)
In-Store
(224)
Users of Store Websites appear the most likely to identify additional stores or websites for
consideration.
Identified additional stores/websites
Ruled out stores/websites Didn’t learn anything new
Total
Impact
69
59
62
61
39

40
74
61
48
40
39
Prices, sales,
promotions
Product information
Availability
Shipping costs
Brand information
69
63
47
39
35
66
64
44
41
36
Shipping costs
Prices, sales, promotions
Product information
User Reviews
Delivery times
% Store Websites
(104)
Brand or Manufacturer Websites
(101)
Online w/o Store Location
(112)
Prices, sales,
promotions
Product information
Brand information
Availability
User reviews
Base: Touch point users
Q.13, 17, 22, 27, 31 What type of information did you look for on/in
[INSERT TOUCHPOINT]?
Word of Mouth is BTS: Not reported
Price is the most prevalent information being sought after, especially for Store Website and In-
Store visitors, as indicated by roughly three quarters of their respective users. Shipping costs narrowly supplant Price as the information most sought after at Online Stores w/o Store Location.
Types of Information Sought After (Top 5)

41
72
67
44
43
20
Product information
Prices, sales,
promotions
Availability
Brand information
Just shopping around/
looking for ideas
% Online Brand or Product Reviews
(82*)
In-Store
(224)
Prices, sales,
promotions
Wanted to see/ touch
product
Product information
Brand information
Return policy
76
60
46
28
28
Base: Touch point users
Q.13, 17, 22, 27, 31 What type of information did you look for on/in
[INSERT TOUCHPOINT]?
*Caution: Low base size
Continued from previous slide…
Types of Information Sought After (Top 5)

42
9 7
8 7
10 9
6 5
6 7
11 7
Pre In-Store Post In-Store
Store Websites
Retail Flyers
Word of Mouth
Brand or Manufacturing
Websites
Online Brand or Product
Reviews
Online w/o Store
Location
Q.7 Which of the following sources of information, if any, did you use to inform
your purchase decision (where to buy it or what brand to buy)?
Q.8 And in what order did you use these information sources?
40% don’t rely on In-Store touchpoints to inform their purchase decision. Among those who do, many
do not make a final purchase decision at this point and go on to explore other touchpoints. The usage
Store, Brand and Online w/o Store Location websites and online reviews are noticeably less utilized
by In-Store users.
In-Store Visit
28
17
21
30
26
35
16
15
19
11
13
18
Didn’t rely on In-store
Information (n=221)
The in-store
visit is not
always the
final step in
the path to
purchase
40% Relied on In-store
Information (n=224) 40%

43
81
19
11
11
6
6
3
6
Talked to friend, family or coworkers
Discussion Forums
Personal Blogs
Professional Blogs
All Other Sources
Base: Word of Mouth users, n=74
Q.9 Which of these sources did you use word-of-mouth recommendations
on [INSERT PRODUCT]?
Digital NET =
34
Word of Mouth Usage
*Caution: Low base size
Information received by speaking directly to friends, family or coworkers (81%) was the dominant
source used by Word of Mouth Users. Digital Word of Mouth sources were utilized by 34% of the
users, clearly led by Facebook at 19%.

44
29
28
21
7
Relied on other types of
information
Just looked at options
In-Store
Information not helpful
Didn’t know how to use
Word of Mouth
(371)
Store Websites
(341)
Brand or Manufacturer Websites
(344)
27
25
16
5
33
24
17
5
Just looked at options
In-Store
Relied on other types of
information
Information not helpful
Don’t know how to use
Just looked at options
In-Store
Relied on other types of
information
Information not helpful
Don’t know how to use
%
Base: Touch point non-users
Q.12, 16, 20, 25, 30, 35 Why didn’t you review any [INSERT TOUCHPOINT]
before buying your [INSERT PRODUCT]?
Relying on other information sources and In-Store touchpoints being sufficient for information
gathering are the primary toughpoint usage barriers. One interesting exception is that two-thirds
of buyers who didn’t rely on In-Store touchpoints reported that their decision was already made.
Usage Barriers (Top 5)

45
67
26
11
25
22
21
14
7
Just looked at options
In-Store
Won’t purchase this
product online
Relied on other types on
information
Information not helpful
Don’t know how to use
23
21
18
13
6
Already knew what I was
going to buy
Relied on other types of
information
Didn’t visit any store
locations
% Online w/o Store Location
(333)
Online Brand or Product Reviews
(362)
In-Store
(221)
Relied on other types of
information
Just looked at options
In-Store
Information not helpful
Won’t purchase this
product online
Don’t know how to use
Base: Touch point non-users
Q.12, 16, 20, 25, 30, 35 Why didn’t you review any [INSERT TOUCHPOINT]
before buying your [INSERT PRODUCT]?
Usage Barriers (Top 5)
Continued from previous slide…

46
- With 40% usage, In-store touchpoints are the most utilized information sources by Personal
Accessories buyers.
- All touchpoints are deemed helpful, most significantly by 77% of Store Website users.
- At 50%, users of Store Websites are the most likely to identify additional stores or websites for
consideration.
- Price is generally the primary reason for touchpoint usage, especially for Store Website and In-
Store visitors.
- Four in 10 don’t rely on In-Store touchpoints to inform their purchase decision. Among those
who do, many do not make a final purchase decision at this point and go on to explore other
touchpoints.
- Relying on other information sources and In-Store touchpoints being sufficient for information
gathering are the primary toughpoint usage barriers. One interesting exception is that two-thirds
of buyers who didn’t rely on In-Store touchpoints reported that their decision was already made.
Summary

The image should fill up the entire space of the gray box, no gray should be seen
Understanding the Touchpoints -Beauty

48
Bought a brand among first considered
72% of purchases
are planned
7 Days passed between first thought
of buying product and making purchase
85 88 1.6 1.4
Brands in mind
Retailers in mind
% %
Just under three quarters of purchases were planned and touchpoint influence appears to be
relatively minor on both brand and retailer consideration. The purchase took place roughly a week
after the first thought of buying the product.
Snapshot of Path to Purchase
Q.6 About how much time passed between the moment you first thought about
buying a [INSERT PRODUCT] and when you made the purchase?
Q.3 Please indicate whether you planned to purchase each product before you
visited the store (or website) or if you spontaneously decided to purchase the
product while you were shopping (online)
Q.4 How many brands, if any, did you have in mind when you first thought about
buying a [INSERT PRODUCT]?
Q5. And how many retailers (i.e., stores/websites), if any, did you have in mind
when you first thought about buying a [INSERT PRODUCT]?
Q.39 And was this store or online source among the ones
you had first considered when you started to think about
buying a [INSERT PRODUCT]?
Q.40 And was the brand you bought among the ones you
had first considered when you started to think about
buying a [INSERT PRODUCT]?
Base: Purchasers of
Winter Apparel, n=2,666
Base: Planned Purchasers
of Winter Apparel, n=698
Bought at Retailer among first considered

49
In-Store
Displays,
Product Info,
Store
Associates
Retail Flyers Store Websites Word of Mouth Brand or
Manufacturer
Websites
Online Brand or
Product
Reviews
Online Stores
w/o Store
Locations or
Auction Sites
None of the
Above
25 20
8
17
9 8 5
39
Touchpoints Usage
%
In no product segment is touchpoint usage less than in Beauty. At 25%, In-store information
sources are the most utilized.
*Index high among
female respondents
18-34 *Index high with female
respondents
Base: Planned Purchasers, n=699
Q.7 Which of the following sources of information, if any, did you use to inform
your purchase decision (where to buy it or what brand to buy)?

50
Not Helpful At All
Base: Touch point users
Q.10, 14, 18, 23, 28, 33 How helpful was the information you found?
Word of Mouth
(119)
In-Store
(174)
60 53
17
17
22 29
1 1
77
70
Store Websites, Brand Manufacturer Websites, Online W/O Store Location,
and Online Brand or Product Reviews are BTS: Not reported
Extremely Helpful
Very Helpful
Somewhat Helpful
Not Very Helpful
Helpfulness
%
At 77% and 70% respectively, both the Word of Mouth and In-Store touchpoints receive high
measures for helpfulness among their respective users.

51
30
33
29
31
52
50
Impact on Brand Consideration
Word of Mouth
(119)
In-Store
(174)
Base: Touch point users
Q.11, 15, 19, 24, 29, 34 Did you identify any brands worth considering that you hadn't
already considered or rule out any brands that you had already been considering?
%
Store Websites, Brand Manufacturer Websites, Online W/O Store Location,
and Online Brand or Product Reviews are BTS: Not reported
Word of Mouth and In-store touchpoints receive similar measures for both increasing and
decreasing brand consideration.
Identified additional brands Ruled out brands Didn’t learn anything new
67
70
Total
Impact

52
65
57
20
19
18
31 Word of Mouth
(119)
In-Store
(174)
Impact on Store/Website Consideration
Base: Touch point users
Q.11, 15, 19, 24, 29, 34 Did you identify any stores or websites worth
considering that you hadn't already considered or rule out any stores or
websites that you had been considering already?
Store Websites, Brand Manufacturer Websites, Online W/O Store Location,
and Online Brand or Product Reviews are BTS: Not reported
%
At 31%, Word of Mouth information appears the most likely to increase Store or Website
consideration.
Identified additional stores or websites
Ruled out stores/websites Didn’t learn anything new
Total
Impact
43
35

53
%
In-Store
(174)
Prices, sales,
promotions
Wanted to see/ touch
product
Product information
Recommendations
Brand information
68
45
43
33
32
Base: Touch point users
Q.13, 17, 22, 27, 31 What type of information did you look for on/in
[INSERT TOUCHPOINT]?
Store Websites, Brand Manufacturer Websites, Online W/O Store Location,
and Online Brand or Product Reviews are BTS: Not reported
Price appears to be the most predominant information sought after in an In-Store visit.
Types of Information Sought After (Top 5)

54
16 9
10 6
5 5
4 7
7 4
3 1
Pre In-Store Post In-Store
Store Websites
Retail Flyers
Word of Mouth
Brand or Manufacturing
Websites
Online Brand or Product
Reviews
Online w/o Store
Location
Q.7 Which of the following sources of information, if any, did you use to inform
your purchase decision (where to buy it or what brand to buy)?
Q.8 And in what order did you use these information sources?
Just over one-third don’t rely on In-Store touchpoints to inform their purchase decision. Among
those who do, many do not make a final purchase decision at this point and go on to explore other
touchpoints. The use of In-Store touchpoints generally reduced the use of other touchpoints with the
exception of Store websites.
In-Store Visit
13
39
36
19
16
11
25
16
10
11
11
4
Didn’t rely on In-store
Information (n=252)
The in-store
visit is not
always the
final step in
the path to
purchase
36% Relied on In-store
Information (n=174) 25%

55
88
16
6
6
3
2
1
9
Talked to friend, family or coworkers
Personal Blogs
Professional Blogs
Discussion Forums
All Other Sources
Base: Word of Mouth users, n=119
Q.9 Which of these sources did you use word-of-mouth recommendations
on [INSERT PRODUCT]?
Digital NET =
23
Word of Mouth Usage
Information received by speaking directly to friends, family or coworkers (88%) was the dominant
source among Word of Mouth users. Digital Word of Mouth sources were utilized by 23% of users,
clearly led by Facebook at 16%.

56
38
27
19
3
Relied on other types of
information
Just looked at options
In-Store
Information not helpful
Don’t know how to use
Word of Mouth
(307)
Store Websites
(373)
Brand or Manufacturer Websites
(360)
34
25
12
2
32
25
13
2
Relied on other types of
information
Just looked at options
In-Store
Information not helpful
Don’t know how to use
Relied on other types of
information
Just looked at options
In-Store
Information not helpful
Don’t know how to use
%
Base: Touch point non-users
Q.12, 16, 20, 25, 30, 35 Why didn’t you review any [INSERT TOUCHPOINT]
before buying your [INSERT PRODUCT]?
Relying on other information sources is the primary barrier to touchpoint usage. One interesting
exception is that 78% of those who did not rely on In-Store information reported that their decision
was already made.
Usage Barriers (Top 5)

57
25
25
18
12
4
Relied on other types on
information
Won’t purchase this
product online
Just looked at options
In-Store
Information not helpful
Don’t know how to use
31
18
14
11
3
78
19
7
Already knew what I was
going to buy
Relied on other types of
information
Didn’t visit any store
locations
% Online w/o Store Location
(392)
Online Brand or Product Reviews
(368)
In-Store
(252)
Relied on other types of
information
Just looked at options
In-Store
Won’t purchase this
product online
Information not helpful
Don’t know how to use
Base: Touch point non-users
Q.12, 16, 20, 25, 30, 35 Why didn’t you review any [INSERT TOUCHPOINT]
before buying your [INSERT PRODUCT]?
Usage Barriers (Top 5)
Continued from previous slide…

58
- Touchpoints usage in Beauty was the lowest among all product categories explored. At 25%,
In-store information sources was the most utilized.
- At 77% and 70% respectively, both the Word of Mouth and In-Store touchpoints receive high
measures for helpfulness among their respective users.
- At 31%, Word of Mouth information appears the most likely to increase Store or Website
consideration.
- Price appears to be the most predominant reason why customers utilized In-Store information
sources.
- Only Retail flyers and Store Websites are noticeably affected by the presence of In-Store
touchpoints, utilization of both appear to increase in conjunction with an In-Store visit.
- Relying on other information sources is the primary barrier to touchpoint usage. One interesting
exception is that 78% of those who did not rely on In-Store information reported that their
decision was already made.
Summary

The image should fill up the entire space of the gray box, no gray should be seen
Understanding the Touchpoints -PC/ Electronics

60
Bought a brand among first considered
78% of purchases
are planned
22 Days passed between first thought
of buying product and making purchase
71 81 1.7 2.0
Brands in mind
Retailers in mind
% %
Just over 3 quarters of purchases were planned and touchpoint influence appears to impact brand
consideration a little more than retailer consideration. The purchase took place roughly 3 weeks
after the first thought of buying the product.
Snapshot of Path to Purchase
Q.6 About how much time passed between the moment you first thought about
buying a [INSERT PRODUCT] and when you made the purchase?
Q.3 Please indicate whether you planned to purchase each product before you
visited the store (or website) or if you spontaneously decided to purchase the
product while you were shopping (online)
Q.4 How many brands, if any, did you have in mind when you first thought about
buying a [INSERT PRODUCT]?
Q5. And how many retailers (i.e., stores/websites), if any, did you have in mind
when you first thought about buying a [INSERT PRODUCT]?
Q.39 And was this store or online source among the ones
you had first considered when you started to think about
buying a [INSERT PRODUCT]?
Q.40 And was the brand you bought among the ones you
had first considered when you started to think about
buying a [INSERT PRODUCT]?
Base: Purchasers of
Winter Apparel, n=2,666
Base: Planned Purchasers
of Winter Apparel, n=698
Bought at Retailer among first considered

61
In-Store
Displays,
Product Info,
Store
Associates
Retail Flyers Store Websites Word of Mouth Brand or
Manufacturer
Websites
Online Brand or
Product
Reviews
Online Stores
w/o Store
Locations or
Auction Sites
None of the
Above
30 28
35
25 26 29
21
14
Touchpoints Usage
%
At 35%, Store Websites appear to be the most utilized touchpoint among customer of
PC/Electronics. Usage levels for the remaining touchpoints are all within 10% of one another.
*Index high among male
respondents 55-64
*Index high with
male respondents
Base: Planned Purchasers, n=793
Q.7 Which of the following sources of information, if any, did you use to inform
your purchase decision (where to buy it or what brand to buy)?
*Index high with
male respondents

62
Base: Touch point users
Q.10,14, 18, 23, 28, 33 How helpful was the information you found?
Word of
Mouth
(201)
Store
Websites
(281)
Brand or
Manufacturer
Websites
(205)
Online
w/o
Store
Location
(165)
Online
Brand or
Product
Reviews
(230)
In-Store
(238)
Helpfulness
%
Not Helpful At All
Not Very Helpful
Extremely Helpful
Somewhat Helpful
Very Helpful
52 60
53 49 58
47
26 18
17 23 13
24
22 21 28 26 27 27
1
1 2 1 2 1
1 1
78 78
70 72 71
71
All touchpoints are deemed helpful by over 70% of their respective users. Store Websites and
Word of Mouth appear to be the most helpful, each capturing 78%.

63
33
29
36
32
29
37
31
49
35
40
39
38
47
43
46
42
52
38 Word of Mouth
(201)
Store Websites
(281)
Brand or Manufacturer
Websites
(205)
Online w/o Store
Location
(165)
Online Brand or
Product Reviews
(230)
In-Store
(238)
Impact on Brand Consideration
%
Base: Touch point users
Q.11, 15, 19, 24, 29, 34 Did you identify any brands worth considering that you hadn't
already considered or rule out any brands that you had already been considering?
Store Websites appear to increase brand consideration more than the other touchpoints. At 49%,
Online Brand and Product Reviews index high as touchpoints that rule out brands.
Total
Impact
63
71
68
64
71
67
Identified additional brands Ruled out brands Didn’t learn anything new

64
56
50
43
44
41
54
27
33
37
36
41
20
22
27
30
28
31
32
Impact on Store/Website Consideration
Base: Touch point users
Q.11, 15, 19, 24, 29, 34 Did you identify any stores or websites worth
considering that you hadn't already considered or rule out any stores or
websites that you had been considering already?
%
Store Websites appear to rule out Store or Website Consideration more than the other touchpoints,
capturing 41% of users.
Word of Mouth
(201)
Store Websites
(281)
Brand or Manufacturer
Websites
(205)
Online w/o Store
Location
(165)
Online Brand or
Product Reviews
(230)
In-Store
(238)
Total
Impact
46
59
56
57
50
44
Identified additional Stores or websites
Ruled out stores/websites Didn’t learn anything new

65
86
67
57
49
45
Prices, sales,
promotions
Product information
Availability
User reviews
Brand information
63
59
43
41
31
84
62
61
52
37
Prices, sales,
promotions
Shipping costs
Product information
User Reviews
Brand information
% Store Websites
(281)
Brand or Manufacturer Websites
(205)
Online w/o Store Location
(165)
Product information
Prices, sales,
promotions
Brand information
User reviews
Availability
Base: Touch point users
Q.13, 17, 22, 27, 31 What type of information did you look for on/in
[INSERT TOUCHPOINT]?
Information on Price is the overwhelming driver for usage among visitors of Store Websites,
Online Stores w/o Store Location and In-Store touchpoints. Customers who utilize Online Brand and Product Reviews index high in searching for product information.
Types of Information Sought After (Top 5)

66
84
64
53
38
13
Product information
Prices, sales,
promotions
Brand information
Availability
Just shopping around/
looking for ideas
% Online Brand or Product Reviews
(230)
In-Store
(238)
Prices, sales,
promotions
Wanted to see/ touch
product
Product information
Recommendations
Brand information
80
57
53
36
33
Base: Touch point users
Q.13, 17, 22, 27, 31 What type of information did you look for on/in
[INSERT TOUCHPOINT]?
Continued from previous slide…
Types of Information Sought After (Top 5)

67
27 11
23 9
15 8
25 10
22 7
10 8
Pre In-Store Post In-Store
Store Websites
Retail Flyers
Word of Mouth
Brand or Manufacturing
Websites
Online Brand or Product
Reviews
Online w/o Store
Location
Q.7 Which of the following sources of information, if any, did you use to inform
your purchase decision (where to buy it or what brand to buy)?
Q.8 And in what order did you use these information sources?
56% don’t rely on in-store touchpoints to inform their purchase decision. Among those who do, the
utilization of other touchpoints can continue after the store visit, though In-Store touchpoints appear
relatively closer to the purchase decision for this product group. In-Store visits also appear to have
less impact on the use of other touchpoints overall.
In-Store Visit
43
32
30
33
35
27
38
32
23
35
29
18
Didn’t rely on In-store
Information (n=447)
The in-store
visit is not
always the
final step in
the path to
purchase
56% Relied on In-store
Information (n=238) 30%

68
93
18
10
8
8
2
1
3
Talked to friend, family or coworkers
Personal Blogs
Discussion Forums
Professional Blogs
All Other Sources
Base: Word of Mouth users, n=201
Q.9 Which of these sources did you use word-of-mouth recommendations
on [INSERT PRODUCT]?
Digital NET =
30
Word of Mouth Usage
Information received by speaking directly to friends, family or coworkers (93%) was the dominant
source among Word of Mouth users. Digital Word of Mouth sources were utilized by 30% of users,
clearly led by Facebook at 18%.

69
Word of Mouth
(484)
Store Websites
(403)
Brand or Manufacturer Websites
(479)
40
24
23
2
43
26
21
2
Relied on other types of
information
Information not helpful
Just looked at options
In-Store
Don’t know how to use
Relied on other types of
information
Just looked at options
In-Store
Information not helpful
Don’t know how to use
%
Relied on other types of
information
Information not helpful
Just looked at options
In-Store
Don’t know how to use
49
24
18
6
Base: Touch point non-users
Q.12, 16, 20, 25, 30, 35 Why didn’t you review any [INSERT TOUCHPOINT]
before buying your [INSERT PRODUCT]?
Touchpoint non-users generally indicated that they used other information sources. Interestingly,
62% of those who did not rely on In-Store information reported that they had already made their
purchase decision.
Usage Barriers (Top 5)

70
30
23
22
17
5
Relied on other types on
information
Won’t purchase this
product online
Just looked at options
In-Store
Information not helpful
Don’t know how to use
39
17
16
11
6
62
33
13
Already knew what I was
going to buy
Relied on other types of
information
Didn’t visit any store
locations
% Online w/o Store Location
(520)
Online Brand or Product Reviews
(454)
In-Store
(447)
Relied on other types of
information
Just looked at options
In-Store
Information not helpful
Won’t purchase this
product online
Don’t know how to use
Base: Touch point non-users
Q.12, 16, 20, 25, 30, 35 Why didn’t you review any [INSERT TOUCHPOINT]
before buying your [INSERT PRODUCT]?
Usage Barriers (Top 5)
Continued from previous slide…
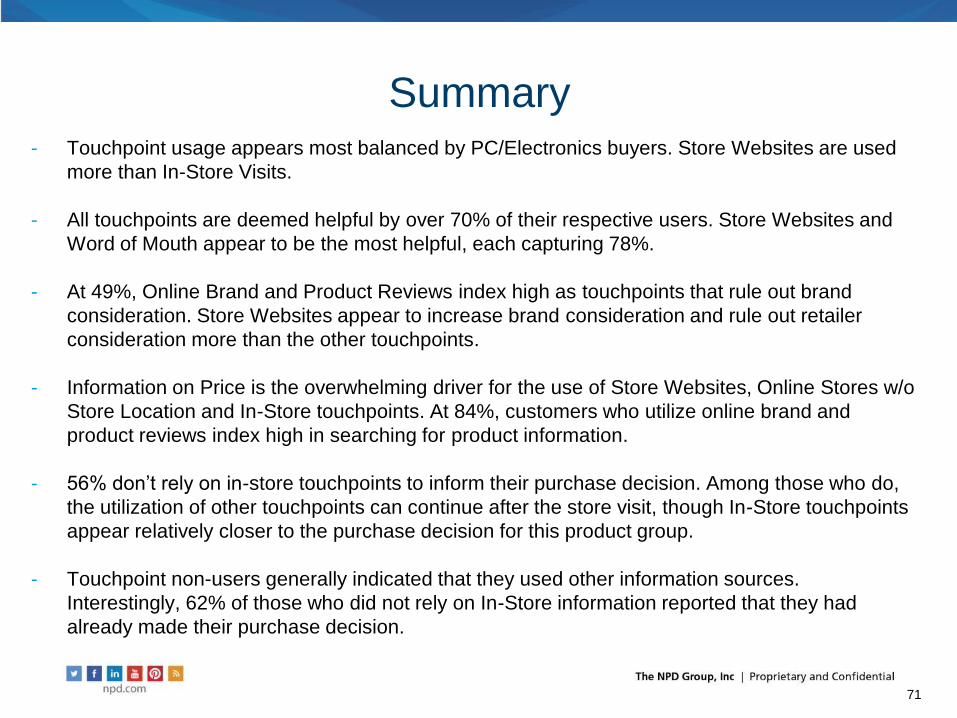
71
- Touchpoint usage appears most balanced by PC/Electronics buyers. Store Websites are used
more than In-Store Visits.
- All touchpoints are deemed helpful by over 70% of their respective users. Store Websites and
Word of Mouth appear to be the most helpful, each capturing 78%.
- At 49%, Online Brand and Product Reviews index high as touchpoints that rule out brand
consideration. Store Websites appear to increase brand consideration and rule out retailer
consideration more than the other touchpoints.
- Information on Price is the overwhelming driver for the use of Store Websites, Online Stores w/o
Store Location and In-Store touchpoints. At 84%, customers who utilize online brand and
product reviews index high in searching for product information.
- 56% don’t rely on in-store touchpoints to inform their purchase decision. Among those who do,
the utilization of other touchpoints can continue after the store visit, though In-Store touchpoints
appear relatively closer to the purchase decision for this product group.
- Touchpoint non-users generally indicated that they used other information sources.
Interestingly, 62% of those who did not rely on In-Store information reported that they had
already made their purchase decision.
Summary

The image should fill up the entire space of the gray box, no gray should be seen
Understanding the Touchpoints - Beverage DA
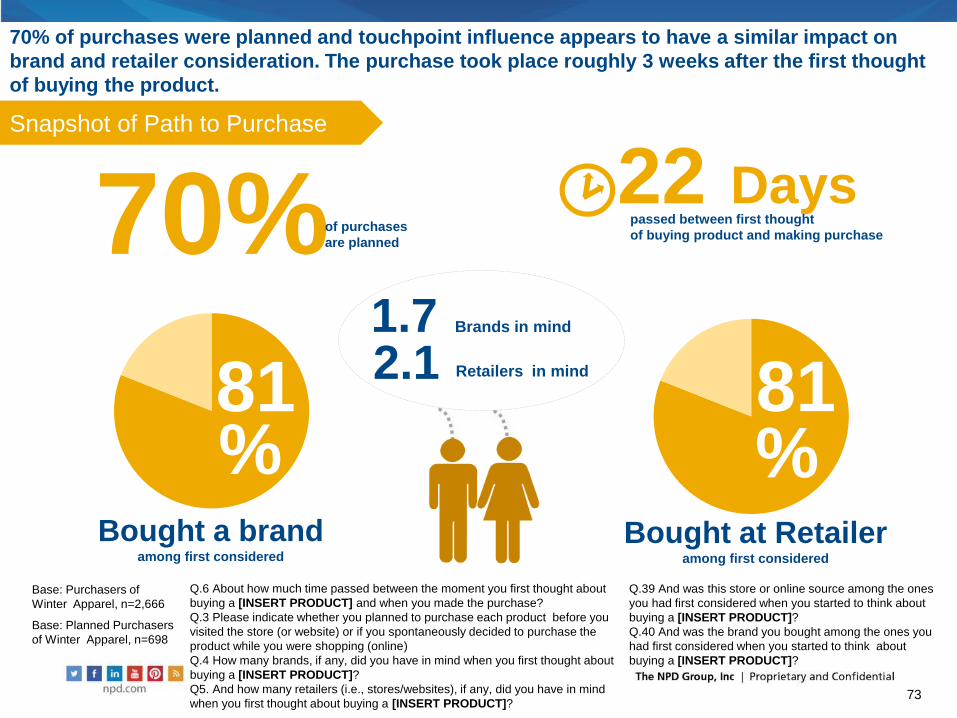
73
Bought a brand among first considered
70% of purchases
are planned
22 Days passed between first thought
of buying product and making purchase
81 81 1.7 2.1
Brands in mind
Retailers in mind
% %
70% of purchases were planned and touchpoint influence appears to have a similar impact on
brand and retailer consideration. The purchase took place roughly 3 weeks after the first thought
of buying the product.
Snapshot of Path to Purchase
Q.6 About how much time passed between the moment you first thought about
buying a [INSERT PRODUCT] and when you made the purchase?
Q.3 Please indicate whether you planned to purchase each product before you
visited the store (or website) or if you spontaneously decided to purchase the
product while you were shopping (online)
Q.4 How many brands, if any, did you have in mind when you first thought about
buying a [INSERT PRODUCT]?
Q5. And how many retailers (i.e., stores/websites), if any, did you have in mind
when you first thought about buying a [INSERT PRODUCT]?
Q.39 And was this store or online source among the ones
you had first considered when you started to think about
buying a [INSERT PRODUCT]?
Q.40 And was the brand you bought among the ones you
had first considered when you started to think about
buying a [INSERT PRODUCT]?
Base: Purchasers of
Winter Apparel, n=2,666
Base: Planned Purchasers
of Winter Apparel, n=698
Bought at Retailer among first considered

74
In-Store
Displays,
Product Info,
Store
Associates
Retail Flyers Store Websites Word of Mouth Brand or
Manufacturer
Websites
Online Brand or
Product
Reviews
Online Stores
w/o Store
Locations or
Auction Sites
None of the
Above
35 34 28
38
27 30
14
7
Touchpoints Usage
%
Word of Mouth is used as frequently as In-Store Visits (even slightly more) to inform the purchase
decision. Touchpoint usage is fairly balanced among Beverage DA buyers with the exception of
Online Stores w/o Store Location.
*Index high with
female respondents
*Index high with male
respondents
Base: Planned Purchasers, n=592
Q.7 Which of the following sources of information, if any, did you use to inform
your purchase decision (where to buy it or what brand to buy)?

75
Base: Touch point users
Q.10,14, 18, 23, 28, 33 How helpful was the information you found?
Word of
Mouth
(222)
Store
Websites
(166)
Brand or
Manufacturer
Websites
(162)
Online
w/o
Store
Location
(81*)
Online
Brand or
Product
Reviews
(176)
In-Store
(205)
*Caution: Low base size
Not Helpful At All
Not Very Helpful
Somewhat Helpful
Very Helpful
Extremely Helpful 59
51 54 60 60 55
28
26 24 15 19 21
12 22 21 21 21 21 2
1 2 3 2
1
Helpfulness
%
87 77 78 75 79
76
No Product Segment received higher levels of touchpoint satisfaction than Beverage DA. At 87%,
Word of Mouth appears to be the most helpful source of information, while no touchpoint was
deemed helpful by less than 3 quarters of their respective users.

76
37
31
39
32
35
33
36
49
34
44
34
42
39
33
39
36
44
38
Impact on Brand Consideration
%
Base: Touch point users
Q.11, 15, 19, 24, 29, 34 Did you identify any brands worth considering that you hadn't
already considered or rule out any brands that you had already been considering?
*Caution: Low base size
The addition of brands for consideration appears to be highest among Store Website Users. Online
Brand and Product Reviews index high for ruling out brands from consideration.
Identified additional brands Ruled out brands Didn’t learn anything new Total
Impact
67
65
68
61
69
63
Word of Mouth
(201)
Store Websites
(281)
Brand or Manufacturer
Websites
(205)
Online w/o Store
Location
(165)
Online Brand or
Product Reviews
(230)
In-Store
(238)

77
54
50
34
41
32
44
29
31
42
36
40
29
24
28
30
33
34
33
Impact on Store/Website Consideration
Base: Touch point users
Q.11, 15, 19, 24, 29, 34 Did you identify any stores or websites worth
considering that you hadn't already considered or rule out any stores or
websites that you had been considering already?
%
*Caution: Low base size
Store Websites and Online Stores w/o Store Locations over-indexed for ruling out retailers.
Identified additional Stores or websites
Ruled out stores/websites Didn’t learn anything new
Total
Impact
56
68
59
66
50
46
Word of Mouth
(201)
Store Websites
(281)
Brand or Manufacturer
Websites
(205)
Online w/o Store
Location
(165)
Online Brand or
Product Reviews
(230)
In-Store
(238)

78
79
64
52
48
41
Prices, sales,
promotions
Product information
Availability
User reviews
Brand information
67
54
50
48
32
79
55
47
44
33
Prices, sales,
promotions
Shipping costs
Product information
User Reviews
Brand information
% Store Websites
(166)
Brand or Manufacturer Websites
(162)
Online w/o Store Location
(81*)
Product information
Prices, sales,
promotions
User reviews
Brand information
Availability
Base: Touch point users
Q.13, 17, 22, 27, 31 What type of information did you look for on/in
[INSERT TOUCHPOINT]?
*Caution: Low base size
Information on Price indexes high as a reason for touchpoint utilization among users of Store
Websites, Online Stores w/o Store Location and In-Store touchpoints. Product information indexes
high with users of Brand and Manufacturing Websites and Online Brand and Product Reviews.
Types of Information Sought After (Top 5)

79
75
58
49
31
13
Product information
Prices, sales,
promotions
Brand information
Availability
Just shopping around/
looking for ideas
% Online Brand or Product Reviews
(176)
In-Store
(205)
Prices, sales,
promotions
Wanted to see/ touch
product
Product information
Return policy
Recommendations
74
50
49
28
24
Base: Touch point users
Q.13, 17, 22, 27, 31 What type of information did you look for on/in
[INSERT TOUCHPOINT]?
Continued from previous slide…
Types of Information Sought After (Top 5)

80
25 10
28 9
23 7
17 9
18 13
10 5
Pre In-Store Post In-Store
Store Websites
Retail Flyers
Word of Mouth
Brand or Manufacturing
Websites
Online Brand or Product
Reviews
Online w/o Store
Location
Q.7 Which of the following sources of information, if any, did you use to inform
your purchase decision (where to buy it or what brand to buy)?
Q.8 And in what order did you use these information sources?
58% don’t rely on in-store touchpoints to inform their purchase decision. Among those who do, the
utilization of other touchpoints can continue beyond the store visit, though In-Store touchpoints
appear relatively closer to the purchase decision for this product group. The impact of using In-
Store information on other touchpoints appears negligible.
In-Store Visit
33
37
43
28
33
15
35
37
30
26
31
15
Didn’t rely on In-store
Information (n=347)
The in-store
visit is not
always the
final step in
the path to
purchase
58% Relied on In-store
Information (n=205) 35%

81
89
19
8
5
4
2
1
7
Talked to friend, family or coworkers
Discussion Forums
Personal Blogs
Professional Blogs
All Other Sources
Base: Word of Mouth users, n=222
Q.9 Which of these sources did you use word-of-mouth recommendations
on [INSERT PRODUCT]?
Digital NET =
32
Word of Mouth Usage
Information received by speaking directly to friends, family or coworkers (89%) was the dominant
source among Word of Mouth users. Digital Word of Mouth sources were utilized by 32% of users,
clearly led by Facebook at 19%.

82
Word of Mouth
(329)
Store Websites
(386)
Brand or Manufacturer Websites
(390)
44
27
14
4
42
22
14
5
Relied on other types of
information
Just looked at the options
In-Store
Information not helpful
Don’t know how to use
Relied on other types of
information
Just looked at options
In-Store
Information not helpful
Don’t know how to use
%
Relied on other types of
information
Information not helpful
Just looked at options
In-Store
Don’t know how to use
46
20
16
7
Base: Touch point non-users
Q.12, 16, 20, 25, 30, 35 Why didn’t you review any [INSERT TOUCHPOINT]
before buying your [INSERT PRODUCT]?
The primary barrier to touchpoint use was that buyers used other information sources although
the majority of those who did not rely on In-Store touchpoints indicated that they had already
made their purchase decision.
Usage Barriers (Top 5)

83
33
28
17
13
6
Relied on other types on
information
Won’t purchase this
product online
Just looked at options
In-Store
Information not helpful
Don’t know how to use
39
21
14
13
8
69
32
7
Already knew what I was
going to buy
Relied on other types of
information
Didn’t visit any store
locations
% Online w/o Store Location
(471)
Online Brand or Product Reviews
(376)
In-Store
(347)
Relied on other types of
information
Just looked at options
In-Store
Information not helpful
Won’t purchase this
product online
Don’t know how to use
Base: Touch point non-users
Q.12, 16, 20, 25, 30, 35 Why didn’t you review any [INSERT TOUCHPOINT]
before buying your [INSERT PRODUCT]?
Usage Barriers (Top 5)
Continued from previous slide…

84
- Word of Mouth is used as frequently as In-Store Visits (even slightly more) to inform the
purchase decision. Touchpoint usage is fairly balanced among Beverage DA buyers with the
exception of Online Stores w/o Store Location.
- No product segment received higher endorsement of touchpoint helpfulness than Beverage DA,
led by Word of Mouth (87%).
- Store website usage was the most likely touchpoint to increase brand consideration and Online
Reviews appear the most likely to remove brands from consideration. Store Websites and
Online Stores w/o Store Location appear the most likely to rule out retailer consideration.
- Information on Price indexes high as a reason for touchpoint utilization among users of Store
Websites, Online Stores w/o Store Location and In-Store touchpoints. Product information
indexes high with users of Brand Websites and Online Reviews.
- 58% don’t rely on in-store touchpoints to inform their purchase decision. Among those who do,
the utilization of other touchpoints can continue beyond the store visit, though In-Store
touchpoints appear relatively closer to the purchase decision for this product group. The impact
of using In-Store information on other touchpoints appears negligible.
- The primary barrier to touchpoint use was that buyers used other information sources. The
majority of those who did not rely on In-Store touchpoints indicated that they had already made
their purchase decision.
Summary

The image should fill up the entire space of the gray box, no gray should be seen
Online Purchase, Consideration and In-Store Synergies

86
89
77
91
70
84
Winter Apparel (698)
Personal
Accessory (555)
Beauty (699)
PC/ Electronics (793)
Beverage DA (592)
17
83
19
81
8
92
31
69
26
74
Online In-Store
11
23
9
30
16
Base: Planned Purchasers, Floating Base
Q.38 Did you buy it in-store or online?
Q.41 Did you consider making your purchase online?
Considered Online?
No
No
No
No
No
Yes
Yes
Yes
Yes
Yes
Online Purchase
%
A clear majority of customers from all product segments made their purchase In-store, most
noticeably 91% of Beauty customers, of which only 8% even considered purchasing online.
Customers of PC/Electronics appear most likely to consider the online option.
*Online indexes
high with males
and In-Store
indexes high with
respondents aged
55-64.

87
% Winter Apparel Personal
Accessories Beauty PC/Electronics Beverage DA
Base: In-store purchasers (622) (425) (635) (556) (499)
Want to see and touch the product 60 50 25 36 34
Risk/inconvenience with return 45 25 13 21 23
Didn't want to wait for delivery 22 20 32 34 29
Don't like to shop online 18 18 18 16 15
Shipping and handling costs 16 18 24 21 26
Prefer to talk to the store associates 13 14 9 21 11
Using credit card doesn't feel safe 11 13 10 11 13
I don't own a credit card 9 8 5 8 8
Online pricing was higher 8 9 6 8 16
Risk of losing the product in the mail 7 8 6 10 8
Not available online 4 6 5 2 3
Don't deliver to my area 1 2 1 1 3
No particular reason 6 12 16 10 6
Across all categories, the most significant barrier for purchasing from online is the need to see
and touch the product, followed by risk/inconvenience with return especially for Winter Apparel
and Person Accessories. The preference to talk to the store associates appears to be a barrier
particularly for PC/Electronics while no particular reasons for Beauty

88
Interactive
Display
Order from
Store Website
Base: Touch point non-users
Q.43 Would you like to see more of the stores that you shop at offer interactive
digital displays in-store (e.g., touch screen computers or tablets) so you could
learn more about their brands and products?
Q.44 Would you like to see more of the stores that you shop at allow you to
purchase products from their website as part of your in-store transaction, if they
didn't have your item, model, size or preferred colour in stock at the store?
73
69
66
76
78
% of Yes
Winter Apparel
(698)
Personal
Accessory
(555)
Beauty
(699)
PC/ Electronics
(793)
Beverage DA
(592)
53
58
52
66
71
In-Store Synergies
Interest in Interactive Displays and the option to Order from Store Websites while in-store is highest
among customers of PC/ Electronics and Beverage DA. Interest in both of these ideas is greater than
current digital touchpoint usage for all product groups, suggesting room for digital growth.
41
48
22
62
59
Digital
Users

Industries
Automotive
Beauty
Entertainment
Fashion
Food / Foodservice
Home
Office Supplies
Sports
Technology
Toys
Video Games
Wireless
Countries
Australia
Austria
Belgium
Brazil
Canada
China
France
Germany
Italy
Japan
Mexico
Netherlands
New Zealand
Poland
Portugal
Russia
Spain
Sweden
United Kingdom
United States
Keep up with what’s new at The NPD Group.
Subscribe to our newsletter and other communications
by visiting npd.com and clicking “Subscribe.”
Thank You