consumer perceptions on quality attributes of liquid food products
TRANSCRIPT

May
1Dept. of Agribusiness Management, Faculty of Agriculture & Plantation Management, 85
Wayamba University of Sri Lanka, Makandura, Gonawila (NWP), 60170, Sri Lanka
CONSUMER PERCEPTIONS ON QUALITY ATTRIBUTES OF LIQUID FOOD
PRODUCTS: AN EMPIRICAL ANALYSIS BASED ON URBAN HOUSEHOLDS
W. G. M. Silva1, J. M. M. Udugama
1 and U. K. Jayasinghe-Mudalige
1
ABSTRACT
This study examined empirically the urban consumer perceptions on key food quality
attributes, including price, food safety, labeling and packaging for four liquid food products,
namely bottled water, pasteurized milk, ready-to-drink fruit juices and carbonated drinks.
Given the multidimensional nature of issue, the Perceptual Mapping Method explained in the
Multidimensional Scaling multivariate data analysis techniques was employed to estimate and
map the variations in consumers’ similarity judgments on the quality attributes. A structured
questionnaire was administrated with 300 households in the urban areas in the Colombo
district to collect data from May to July 2011. The outcome of analysis revealed that,
irrespective of the product, price plays the most significant role on consumer decision making
process followed by food safety. Nevertheless, consumers were judged differently on these
quality attributes as they decide on purchasing different product combinations and this
behavior is correlated with the socio-economic status of a consumer. The results imply that
manufacturers of these products shall pay attention to the food quality attributes in concern in
their attempt to cater into their client-base and penetrate into new food markets.
Keywords: Consumer perceptions, Food quality attributes, Liquid food products, Perceptual
mapping
INTRODUCTION
Liquid food product market is one of the
largest growing subsectors of food industry
in Sri Lanka with diverse products
available for sale (i.e. bottled water,
pasteurized milk, carbonated drinks, ready-
to-drink fruit juices and fruit cordials etc).
The recent statistics from the Department
of Census and Statistics of Sri Lanka
(2009) indicates that the average monthly
expenditure on consumption of liquid food
product per person in Sri Lanka has
substantially increased. For example, from
the year 2007 to 2009, it has increased by
114% for milk products (i.e. Rs. 0.94 to
Rs. 2.02); 202% for soft drinks (i.e. Rs.
1.86 to Rs. 5.62), and 182% for bottled
water (i.e. Rs. 0.35 to Rs. 0.99) and has
remained almost at the same level for fruit
based products (i.e. Rs. 3.19).
The facts above highlight that the markets
for liquid food products are enlarging, and
as a result, there exists an ample room for
food businesses to supply their products to
fulfill the choices of consumers. However,
those adverse incidents reported in food
markets, both locally and worldwide, with
respect to occurrences of human illness
and deaths due to poisoning caused by
food-borne microbial pathogens and other
agents have opened eyes of both
consumers and marketers that results in

The Journal of Agricultural Sciences, 2012, vol. 7, no 2
intervention of both food marketers and
government institutions to find solutions.
Abayasekara et al. (2007), on the context
of bottled water industry in Sri Lanka, has
implicated that those product available in
the market may act as a source of
outbreaks of cholera, typhoid fever and
other diseases as well.
In light of these, consumer concern on the
quality of food products have become one
of the major and increasing preoccupations
of food supply system in almost every
country (Henson and Caswell, 1999) and
there is no exception for Sri Lanka (Lakni
and Jayasinghe-Mudalige, 2009). This has
led to the fact that an ever growing number
of consumers require more, valid, relevant
and timely information on the quality of
products they consume. Food safety and
quality assurance has, therefore, become
an increasing focus for governments in
both developed and developing countries,
food processing firms, and international
trade and standardizing bodies. The more
importance given to certain food quality
attributes prompts implementation of
enhanced quality assurance systems by
food companies voluntarily apart from the
strict food safety and quality standards and
regulations put forward by the respective
governments to regulate the industry
(Buzby, 2003; Caswell, 1998).
Product quality itself is multidimensional.
As a result, there is no definitive list of all
attributes of quality, as the importance of
such characteristics varies across
circumstances and among customers
(Kariyawasam et al., 2007). A number of
conceptual frameworks and theoretical
models have, therefore, been developed to
categorize consumer behavior on attributes
of food quality based on different
dimensions.
In one such classification, these were
classified into three major categories to
explain how consumers learn about the
quality of commodities what they
purchase. Of which, the first category is
referred to as “search” attributes, where
the consumers can determine product
quality at the point of purchase by looking
at the product, examining and researching
it (e.g., price, color). The products that
belong to the second category possess
“experience” attribute, where consumers
are not in a position to determine product
quality unless and/or until they use it after
purchase (e.g., organoleptic qualities). The
third category is termed as “credence”
attributes, where consumers cannot judge
the quality of a product even after
consumption of it (e.g., pesticide residues,
hormones), and as a result, it warrants
more careful investigations and
involvement of many parties vis-à-vis
consumers, markets and governments to
decide on quality assurance (Nelson, 1970;
Darby and Karni, 1973). Another
commonly used classification on food
quality attributes in literature – Caswell
classification on food quality attributes –
incorporates such attributes into a number
of subsets as shown in Table 01.
The objective of this study was to assess
the similarities in consumer perceptions on
different liquid food products in terms of
various attributes of food quality as they
purchase them to satisfy their needs. A
number of key attributes of food quality
presented in the Caswell’s classification
were of interest, including the price, food
safety, labeling and packaging. The
empirical analysis was based on the
information gathered from a cross section
of urban consumers and the selected liquid
food products include: (i) Bottled water
(BW); (ii) Pasteurized milk (PM); (iii)
Ready-to-drink fruit juices (RTD), and (iv)
Carbonated drinks.
METHODOLOGY
Multidimensional Scaling Analysis
Given the liquid food products listed
above, a consumer, at a given point of
86

W. G. M. Silva, J. M. M. Udugama and U. K. Jayasinghe-Mudalige
time, may decide to purchase any of these
products individually or as a bundle.
Further, he/she would judge on the
importance of these attributes of quality
from various points of views (i.e. needs,
status maintenance, and constraints).
Moreover, the socio-economic and
demographic characteristics associated
with a consumer can play a significant role
in his/her decision to purchase these
products.
Table 01. Food quality attributes based on Caswell’s classification
Attribute of Quality Forms of the Attribute for the
Case of Milk Powder
Food Safety
1. Pathogens
Bacteria, Virus, Botulism, E-coli,
2. Food additives &
Preservatives
Added to the food , Not added to the food
Nutrition
3. Fat & Cholesterol Full cream ,Non fat, Molted Content
Full cream, Non fat, Malted
4. Calories Low, Medium, High
Sensory / Organoleptic
5. Taste
Vanilla, Chocolate, Strawberry, Malted,
Other flavor
6. Appearance Soft dry powder, Liquid, Cream, Small
granules
7. Smell Vanilla, Chocolate, Without, Other
Value / Functional
8. Size
75g, 250g, 400g, 500g, 1kg
9. Compositional
Integrity
Yes, No
10. Package Material Aluminum foil only, Aluminum foil with
cardboard packet, Tetra packet
11.Keepability (after opening) 1 week, 1-3 week, 3-5 week, >5 Week
Process
12. Place of Origin
Australia, New Zealand, India, Denmark,
Sri Lanka
Text / Measurement
13. Certification
SLS, ISO 9001, HACCP, GMP
14. Labeling Yes, No
Cues
15. Price
Rs. 50-100, Rs. 150-200, Rs. 250-300, >
Rs. 300
16. Brand Name Anchor, Nespray, Lakspray, Red Cow,
Highland, Raththi, Kothmale
17. Advertising Television, Radio, Newspapers, Others
18. Past Purchase
Experiences
Yes, No
Source: Lakni and Jayasinghe-Mudalige (2010)
87
The Journal of Agricultural Sciences, 2012, vol. 7, no 2
All these create this issue
multidimensional, and calls to employ
multivariate data analysis techniques to
explore the situation to a depth. The
Multidimensional Scaling (MDS) approach
– also known as a technique of Perceptual
Mapping – enables an analyst to determine
the perceived relative image of set of
objects; thus, to transform consumer
judgments of perceptual similarity into
distances represented in multidimensional
space (Hair et al., 1998). In light of that,
we have resolved to use MDS to analyze
this issue.
Practically, the first step towards carrying
out a MDS is to develop right amount of
combinations with the objects in hand. For
the purpose of this analysis, the 4 liquid
food products, namely (1) bottled water
(BW); (2) pasteurized milk (PM); (3)
ready-to-drink fruit juices (RTD), and (4)
carbonated drinks can be set as pairs of
objects as follows: (1&2) bottled water and
pasteurized milk [BW-PM]; (1&3) bottled
water and RTD fruit juice [BW-RTD];
(1&4) bottled water and carbonated drinks
[BW-CD]; (2&3) pasteurized milk and
RTD fruit juice [PM-RTD]; (2&4)
pasteurized milk and carbonated drinks
[PM-CD], and (3&4) RTD fruit juice and
carbonated drinks [RTD-CD]1.
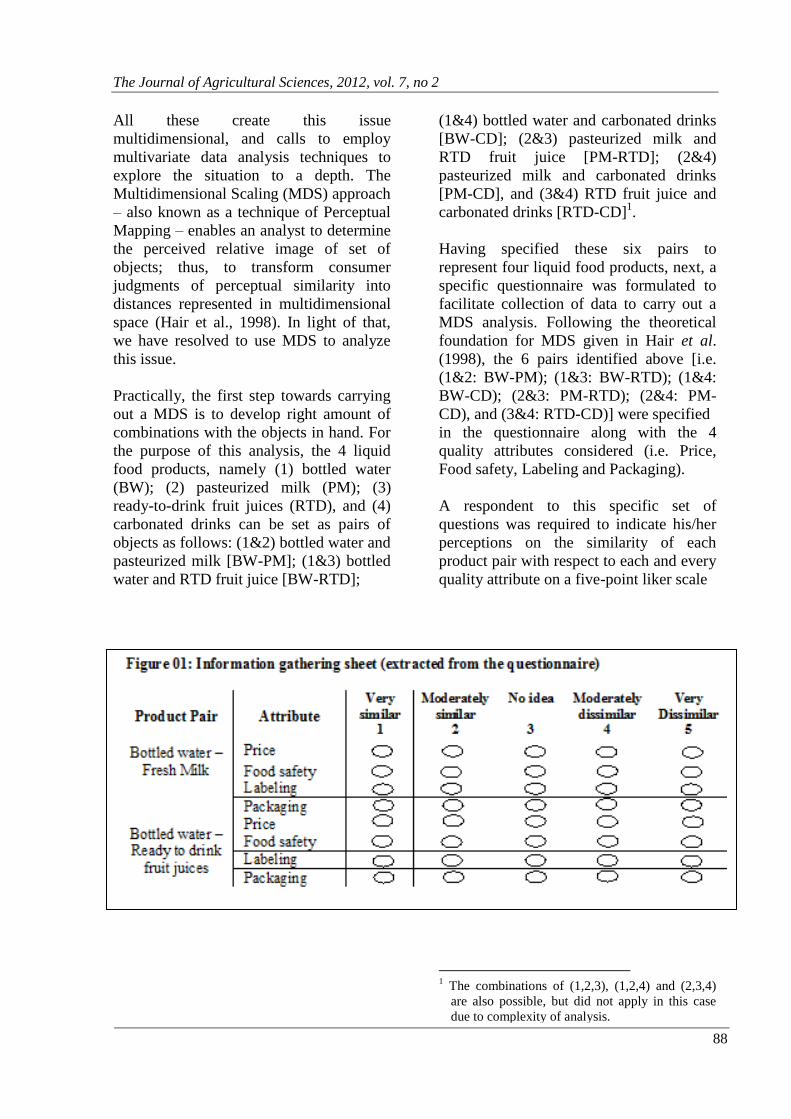
Having specified these six pairs to
represent four liquid food products, next, a
specific questionnaire was formulated to
facilitate collection of data to carry out a
MDS analysis. Following the theoretical
foundation for MDS given in Hair et al.
(1998), the 6 pairs identified above [i.e.
(1&2: BW-PM); (1&3: BW-RTD); (1&4:
BW-CD); (2&3: PM-RTD); (2&4: PM-
CD), and (3&4: RTD-CD)] were specified
in the questionnaire along with the 4
quality attributes considered (i.e. Price,
Food safety, Labeling and Packaging).
A respondent to this specific set of
questions was required to indicate his/her
perceptions on the similarity of each
product pair with respect to each and every
quality attribute on a five-point liker scale
1 The combinations of (1,2,3), (1,2,4) and (2,3,4)
are also possible, but did not apply in this case
due to complexity of analysis.
88

W. G. M. Silva, J. M. M. Udugama and U. K. Jayasinghe-Mudalige
with 1 being “very similar”, 2 being
“moderately similar”, 4 being “moderately
dissimilar”, 5 being “very dissimilar” and
3 being “ no idea ” (Figure 01).
As mentioned elsewhere, the perceptual
similarities among the four liquid food
products can vary with demographic and
social factors of consumers. The scores
provided on the likert-scale was then be
used to carry out the MDS that creates
perceptual maps for specific demographic
and social characteristics of consumers2.
Along with perceptual maps, the outcome
of MDS obtained through a statistical
package generates the Stress Measurement,
which reflects the proportion of variance of
disparities, i.e. differences in distances
between objects on the perceptual map and
the similarity judgments of the
respondents, not accounted for by the
MDS model (Hair et al., 1998). To
determine the Goodness-of-Fit of the
model, the Kruskal’s Stress (S) is used
commonly, which can be specified as
follows for each perceptual map:
𝑆 = ∑(𝒅𝒊𝒋−𝒅𝒊𝒋
′ )𝟐
∑(𝒅𝒊𝒋 − 𝒅𝒊𝒋")𝟐
where: S denotes the stress measure. The
right-hand side variables include: dij” =
Average distance between points i and j on
the map (∑dij/n; n= number of objects
mapped), dij’ = Derived distance from the
perceptual map, dij = Original distance
based on similarity judgments.
2 Both Sorting and Ranking methods can be used to
gather consumer personal constructs with respect
to different product attributes to investigate
consumer similarity perceptions (Santosa et al.,
2010). The Ranking method was, however,
selected in this particular analysis.
Data Collection and Analysis
The questionnaire and the entire MDS
approach to be used in this analysis was
pre-tested to make appropriate revisions to
which with the data collected from a
sample of 30 consumers showing different
demographic and social characteristics
(e.g. gender, education) and living in an
urban housing complex setting. Having
purified the questions and select the best
means and ways to use it with consumers
with different behavioral patterns, it was
administered with a sample of 300
consumers selected purposively from the
urban housing complexes and residential
areas located in the Homagama, Kesbawa
and Maharagama Pradeshiya Shaba (in the
Colombo district, Western Province)
during the May – July 2011.
This process was pre-designed to collect
data from equal number of males and
female respondents (i.e. 150 each) to
increase the precision of MDS analysis
based on gender. Every effort was made to
have nearly equal shares or at least
sufficient numbers to represent consumer
age groups preferred in the analysis. The
enumerators were provided with the
samples of liquid food products considered
in the analysis and were trained to show
each product pair before the question/s
related to that particular combination was
to be asked to make it convenient for the
respondent to perceive the attributes of
quality of concern in this study. A clear
explanation about the objective and
procedures to be used was given to each
respondent to make sure they respond all
questions without being ambiguous.
The Statistical Package for Social Sciences
(SPSS) [version 13] was used to obtain the
projection of similarity judgments of each
consumer group on to separate perceptual
map and the stress measures relevant to
equation. Following the Hair et al. (1998),
the solution was derived using MDS
analysis involving distance matrices from
89

The Journal of Agricultural Sciences, 2012, vol. 7, no 2
Euclidean distance and the Pearson
Correlation Analysis was carried out
between the separate distances values of
each and every product pairs with different
demographics groups.
RESULTS AND DISCUSSION
Descriptive statistics of the sample
Out of 300 urban consumers participated to
the survey, 70% completed schooling up to
the Advanced Level (i.e. Secondary level)
and others had a higher education and/or
specific subject specific/vocational training
(i.e. Tertiary level). As mentioned above,
nearly 50% of both male and female
respondents in the sample were aged below
45 years. Further, nearly 30% of
respondents were belonging to a household
that possess a monthly income greater than
Rs. 30, 000 (Table 02).
The consumers in the sample used to
purchase pasteurized milk in higher
frequency compared to other products
while bottled water showed the lowest
purchasing frequency (Figure 02).
Similarity perception of product attributes
Figure 03 depicts the percentage of
consumers who perceived a given product
combination (pair) with similarity with
respect to the four quality attributes of
concern.
The percentage of respondents those
perceived similarly about the importance
of taking into account of “price” as they
purchase anyone product over the other in
a given pair was highest (i.e. 79.6%) for
the pair of Pasteurized milk and RTD fruit
juices (PM-RTD). The results reveal that
almost 60% of respondents consider price
as the most critical quality attribute as they
purchase any of the product combinations
taken up in this analysis. This percentage
was above 75% for the (RTD-CD) and
(BW-PM) and close to 60% for other three
combinations.
Second to price, “food safety” becomes an
important quality attribute. About 76.6%
of respondents perceived food safety to be
similarly important quality attribute as they
decide on purchasing between bottled
water and pasteurized milk (BW-PM).
90

W. G. M. Silva, J. M. M. Udugama and U. K. Jayasinghe-Mudalige
In contrast, only about 40% of
respondents perceived similarly on food
safety attribute if they have to decide
between pasteurized milk and carbonated
drinks (PM-CD).
Figure 02: Frequency of use of liquid food products
Figure 03: Similarity perception of product attributes
Note:(BW-PM) = Bottled water and Pasteurized Milk, (BW-RTD) = Bottled water and
Ready to drink fruit juice, (BW-CD) = Bottlwd water and Carbonated drinks, (PM-RTD) =
Pasteurized Milk and Ready to drink fruit juice, (PM-CD) = Pasteurized Milk and
Carbonated Drinks and (RTD-CD) = RTD fruit juice and Carbonated Drinks
91

The Journal of Agricultural Sciences, 2012, vol. 7, no 2
With respect to “labeling”, a number of
inferences can be made. The similarity of
consumer perceptions on any product pair
with regard to this is highest (76.6%) for
Pasteurized milk and RTD fruit juices
(PM-RTD). This may be due to the fact
that given the relatively deteriorating
nature; the consumers are more concerned
of the label for information for these
products. Also, more than 60% of
respondents perceived similarly on it for
two other pairs, namely: (BW-PM) and
(BW-RTD). Further, out of four quality
attributes in concern, labeling shows the
greatest variation with respect to the
percentage of consumers perceived
similarly on any product pairs, i.e. ranging
from almost 80% in the highest (PM-RTD)
to nearly 30% in the lowest case of (BW-
CD). In fact, for the pairs of (PM-CD) and
(BW-CD), this value was recorded below
40%.
With respect to “packaging”, the number
of consumers showing similar perceptions
on any pair is low in compared to other
attributes. Even for the highest case, i.e.
PM-RTD, it was about 60%.
Unlike labeling, the variation for it was,
however, comparatively low as the lowest
end represent nearly 30% consumers that is
above the same for labeling attribute.
Outcome of Multidimensional Scaling
Analysis
Perceptual Maps were obtained to
represent the socio-economic variables of
gender and educational for all product
pairs (Figure 04).
The different combinations of quality
attributes considered in the analysis are
represented by a point in the map. The
distances between these points are
calculated to achieve an optimal
representation of similarity as captured by
the raw data. The two dimensional solution
represents items that are perceived close
together as subjectively similar and those
that were far apart to be subjectively
dissimilar. These show that for price and
food safety attributes as they were rated at
the highest level by respondents to this
particular analysis. The estimates of Stress
Value and distances between each product
pair were reported in Table 03.
92

W. G. M. Silva, J. M. M. Udugama and U. K. Jayasinghe-Mudalige
The results show that there is no
significant difference with respect to males
and females as they perceive on a given
object (Figure 04A and 04B). Further, it
shows that two levels of education (i.e.
Secondary and Tertiary) were correlated
highly (i.e. 0.991) at 95% significant level.
This highlights that similarity perceptions
amongst the consumers, irrespective of
their gender, was highest between
pasteurized milk and RTD fruit juices for
these two attributes, while it was the least
for pasteurized milk and carbonated drinks.
Both males and females were perceived
that the price plays a highly positive role as
they purchase carbonated drinks, but for
the same they did not care of food safety.
This may be explained as consumers prefer
a certain brand and they judged that it
solves their issues with respect to food
safety (i.e. credence characteristic of food
safety become an experience
characteristic).
However, this is otherwise as we consider
about the bottled water as consumers pay
more attention to food safety in compared
to price.
The reasons may be price of unit of a
bottled water, irrespective of brand, is
almost similar, but given credence
characteristic and a necessity good with
high sensitivity towards hygiene, they pay
more attention on food safety attribute.
The results revealed that education did not
have a significant impact in this respect
(Figure 04C and 04D).
Irrespective of the level of education,
consumers judged that both price and food
safety were highly important as they
decide on purchasing the pasteurized milk
and RTD fruit juices and the lowest
similarity perception was recorded
between the pasteurized milk and
carbonated drinks.
Figure 04A: Perceptual map on Food safety
and Price for males
Figure 04B: Perceptual map on Food safety
and Price for females
93

The Journal of Agricultural Sciences, 2012, vol. 7, no 2
Figure 04C: Perceptual map on Food safety and
Price for group with secondary education
Figure 04D: Perceptual map on Food safety
and Price for group with tertiary education
Figure 4E. Perceptual map on Packaging and
Labeling for males
Figure 4F. Perceptual map on Packaging and
Labeling for females
94
Figure 4D. Perceptual map on Food safety
and Price for group with tertiary education

W. G. M. Silva, J. M. M. Udugama and U. K. Jayasinghe-Mudalige
However, at 95% confidence level, there is
a significant difference between males and
females on their perception of similarity
between labeling and packaging of the four
products in concern (Figure 4E and 4F).
Interestingly, irrespective of the gender,
both groups indicated a high positive
importance on packaging for RTD fruit
juices while considering the labeling to be
most important for pasteurized milk.
Where carbonated drinks and bottled water
are of concern, the males perceive
relatively higher importance on packaging
of carbonated drinks while females did so
for bottle water. However, both groups
paid more attention on both packaging and
the product label during the purchase of
pasteurized milk for consumption in
relation to other products.
CONCLUSIONS
The results revealed that the respondents
perceived pasteurized milk and RTD fruit
juices to be relatively similar in terms of
price and food safety attributes irrespective
of their socio demographic characteristics
such as gender and educational level. The
results also suggest that the purchasing
behavior of RTD fruit juices and
pasteurized milk were very similar with
respect to the price, labeling and packaging
attributes. Consumers consider these
attributes to be more or less similar with
respect to these two products due to the
deteriorating nature of pasteurized milk
and RTD fruit juices. As consumers are
more concerned on and aware of food
quality standards (i.e. SLS) of bottled
water, and the knowledge of hazardous
chemical compounds in carbonated drinks,
the food safety attribute had a significant
impact on the buying behavior of bottled
water and carbonated drinks. Thus, bottled
water shows the nature of a credence good
as the true quality of the product is never
known even after purchase and
consumption where the quality of the other
three products could be experienced.
Consumers perceived the price factor to be
equally important in purchasing decisions
across all four products. Irrespective of the
socio-demographic characteristics
consumers paid more attention on both
labeling and packaging attributes during
purchase of pasteurized milk. To the extent
that these findings apply more generally, it
is evident that remaining liquid food
product producers and potential entrants
into the market should pay special
attention to the particular attributes in
catering their client-base. Attractive prices
should be applied to the all four products
as price plays an important factor specially
in marketing (i.e. segmentation and
pricing). It is important that the liquid food
producers always shed attention on food
quality attributes as well as the physical
and aesthetic characteristics of the liquid
food products in promoting these products
to the market.
REFERENCES
Abayasekara, C. L., Herath, W. H. M. A. T., Adikaram, C. R., Illapperuma, S. C., Sirisena, A.
D., and Rajapur, S. G. (2007). Microbiological quality of bottled water in Sri Lanka: A
preliminary survey. In: Proceeding of 12th
Research Sessions. 30 November, 2007.
University of Peradeniya, Sri Lanka.
Buzby, J. C. (2003). International trade and food safety: economic theory and case studies.
Agricultural Economic Report – No. 828. Economic Research Service, United States
Department of Agriculture.
Caswell, J. A. 1998. Valuing the Benefits and Costs of Improved Food Safety and Nutrition.
Australian Journal of Agriculture and Resource Economics, 42 (December):409-474.
95

The Journal of Agricultural Sciences, 2012, vol. 7, no 2
Darby, M. R., and Karni, E. (1973). Free Competition and the optimal amount of fraud.
Journal of Law and Economics, 16, 67-88.
Department of Census and Statistics (2009). Household Income and Expenditure Survey
(2009/2010), Department of Census and Statistics, Ministry of Finance and Planning,
Sri Lanka. Available at:
htpp://www.statistics.gov.lk/HIES/PreRepotHIES2009Eng.pdf.
Hair, J. F., Anderson, R. E., Tatham, R. L., and Black, W. C. (1998). Multivariate Data
Analysis. 5th
Ed. New Jersey. Prentice-Hall.
Henson, S. and Caswell, J. (1999). Food safety regulation: an overview of contemporary
issues. Food Policy 24: 589 - 603
Kariyawasam, S., Jayasinghe-Mudalige, U. K., and Weerahewa, J. (2007). Use of Caswell’s
classification on food quality attributes to assess consumer perceptions towards fresh
milk in tetra- packed containers. Journal of Agricultural Sciences, 3, 43-46.
Lakni, W. A. K. I., and Jayasinghe-Mudalige, U. K. (2009). Customer-defined quality of
food: An empirical investigation based on KANO Analytical methods for milk
powder. Journal of Agricultural Sciences, 4, 45-58.
Nelson, P. (1970). Information and consumer behavior. Journal of Political Economics, 78,
311-329.
96