consumer preferences for new foodservice chicken products survey results 2011 funding provided by...
TRANSCRIPT

Consumer Preferences For NewFoodservice Chicken Products
Survey Results 2011Funding Provided by
WATT Poultry USA andGivaudan Flavors
Chicken Marketing Seminar 2011
Tuesday, July 19, 2011Resort at Squaw CreekLake Tahoe, California

Purpose of Survey to Determine...
• Frequency and market penetration of eating chicken at-home, away-from-home, and combined.
• Frequency of eating chicken by light, medium, and heavy consumers of chicken.
• Consumer preferences for new foodservice chicken products.
• Consumer frequency of on-line inquiries about chicken.
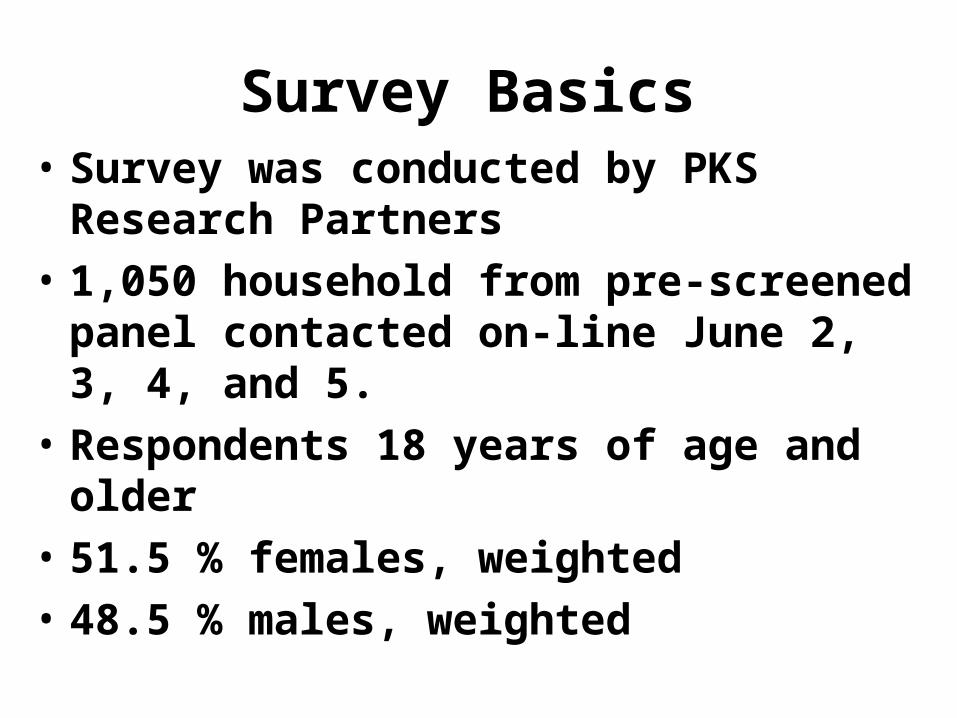
Survey Basics• Survey was conducted by PKS Research
Partners
• 1,050 household from pre-screened panel contacted on-line June 2, 3, 4, and 5.
• Respondents 18 years of age and older
• 51.5 % females, weighted
• 48.5 % males, weighted
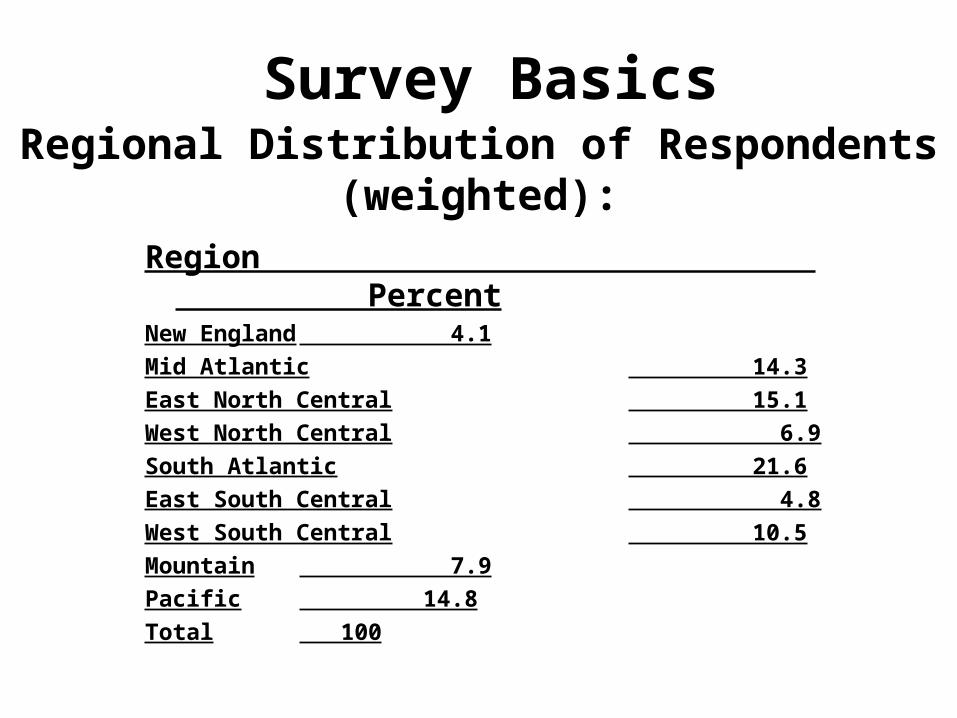
Region PercentNew England 4.1
Mid Atlantic 14.3
East North Central 15.1
West North Central 6.9
South Atlantic 21.6
East South Central 4.8
West South Central 10.5
Mountain 7.9
Pacific 14.8
Total 100
Regional Distribution of Respondents (weighted):
Survey Basics

Survey Basics
Race of Respondents (weighted)
Race Percent
White (non-Hispanic) 67
Hispanic 14
Black (non-Hispanic) 12
Other 7
Total 100

Question 1
• Thinking about the meals and snacks you’ve eaten in the past two weeks, how many times did you eat chicken that was purchased from a supermarket or other retail grocery store? (Fresh, frozen, or prepared chicken are included in the responses.)

Question 2
• Thinking about the meals and snacks you’ve eaten in the past two weeks, how many times did you eat chicken that was purchased at a restaurant, fast food store, carryout shop or employee cafeteria? (Prepared meals of chicken, chicken products/sandwiches, and similar foodservice chicken items are included in the responses.)

Note: Frequency includes all respondents whether they ate chicken or not during the two week time period.
Average Times During Two Week Time Period
2.4
3.1 2.9 3.1 3.1 3.3
2.73.2
3.6 3.6
00.5
11.5
22.5
33.5
4
Tim
es
Frequency of Eating ChickenPurchased From Retail Grocery

Note: Frequency includes all respondents whether they ate chicken or not during the two week time period.
Average Times During Two Week Time Period
1.71.8
2.0 2.0 2.01.9
1.82.0
2.1 2.1
0
0.5
1
1.5
2
2.5
2001 2002 2003 2004 2005 2006 2007 2008 2010 2011
Tim
esFrequency of Eating ChickenPurchased From Foodservice
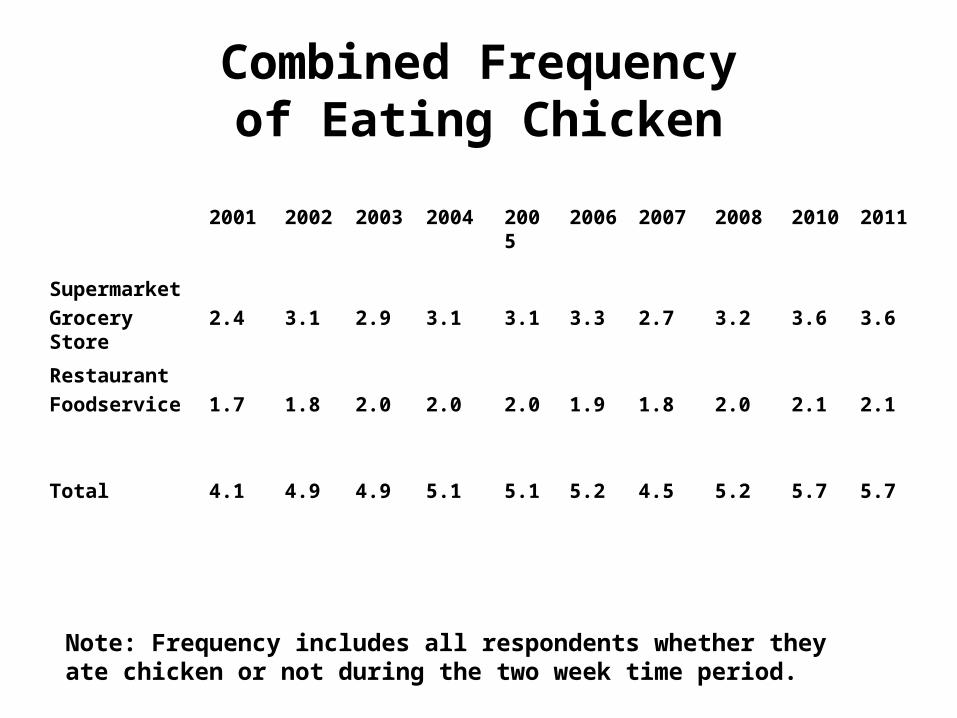
Combined Frequencyof Eating Chicken
2001 2002 2003 2004 2005 2006 2007 2008 2010 2011
Supermarket
Grocery Store 2.4 3.1 2.9 3.1 3.1 3.3 2.7 3.2 3.6 3.6
Restaurant
Foodservice 1.7 1.8 2.0 2.0 2.0 1.9 1.8 2.0 2.1 2.1
Total 4.1 4.9 4.9 5.1 5.1 5.2 4.5 5.2 5.7 5.7
Note: Frequency includes all respondents whether they ate chicken or not during the two week time period.

Note: Combined frequency includes all respondents whether they ate chicken or not during two week time period.
Combined Frequency of Eating Chicken PurchasedFrom Retail Grocery and Foodservice
4.14.94.9
5.15.15.2
4.55.2
5.75.7
0 2 4 6
2001200220032004200520062007200820102011
Average Times During Two Week Time Period

Share of Consumers EatingChicken Purchased From Retail
Grocery During Two Week Time Period
7481
7884
8287
8277
8587
0 20 40 60 80 100
2001200220032004200520062007200820102011
Percent

Share of Consumers EatingChicken Purchased From Foodservice
During Two Week Time Period
Percent
63
67
62
69
67
67
65
63
67
73
0 20 40 60 80
2001
2002
2003
2004
2005
2006
2007
2008
2010
2011

Share of Consumers Eating Chicken Purchased From Retail Grocery and Foodservice
(combined) During Two Week Time Period
Percent
86
90
87
92
90
92
91
85
90
93
0 20 40 60 80 100
2001
2002
2003
2004
2005
2006
2007
2008
2010
2011

Frequency of Eating Chicken by Generational Group During Two Week Time Period, 2010
Millennial
18-34
Generation X
35-44
Boomers
45-64
Greatest Generation
65+ All
Respondents
Year ---------------------------------------Times-----------------------------------------
(A) Chicken Purchased at Retail Grocery
2010
2011
4.6
4.2
3.6
3.5
3.2
3.4
2.6
3.1
3.6
3.6
(B) Chicken Purchased at Foodservice
2010
2011
3.1
2.8
2.2
2.3
1.6
1.7
1.1
1.6
2.1
2.1
Combined
A & B
2010
2011
7.7
6.9
5.8
5.8
4.8
5.1
3.7
4.8
5.7
5.7
Generation

Share of Generational Group Eating Chicken During Two Week Time Period, 2011
Millennial
18-34
Generation X
35-44Boomers
45-64
Greatest
Generation
65+
All
Respondents
Year
------------------------------------Percent---------------------------------------
(A) Chicken Purchased at Retail Grocery
2010
2011
90
88
86
90
83
86
79
88
85
87
(B) Chicken Purchased at Foodservice
2010
2011
80
80
71
74
61
69
50
65
67
73
Combined
A & B
2010
2011
92
93
91
92
88
94
88
92
90
93
Generation

Frequency of Eating Chicken by Demographic Group During Two Week Time Period, 2011
Any
Hispanic
Black Only (Non-
Hispanic)
White Only
(Non-Hispanic)
All
Others
All Respondents
Year ------------------------------------Times---------------------------------------
(A) Chicken Purchased at Retail Grocery
2010
2011
4.0
4.2
4.1
4.5
3.4
3.3
3.8
3.7
3.6
3.6
(B) Chicken Purchased at Foodservice
2010
2011
2.9
3.2
2.2
2.5
1.8
1.8
3.1
3.2
2.1
2.1
Combined
A & B
2010
2011
6.9
7.3
6.3
7.1
5.2
5.1
6.9
6.8
5.7
5.7
Demographic Group
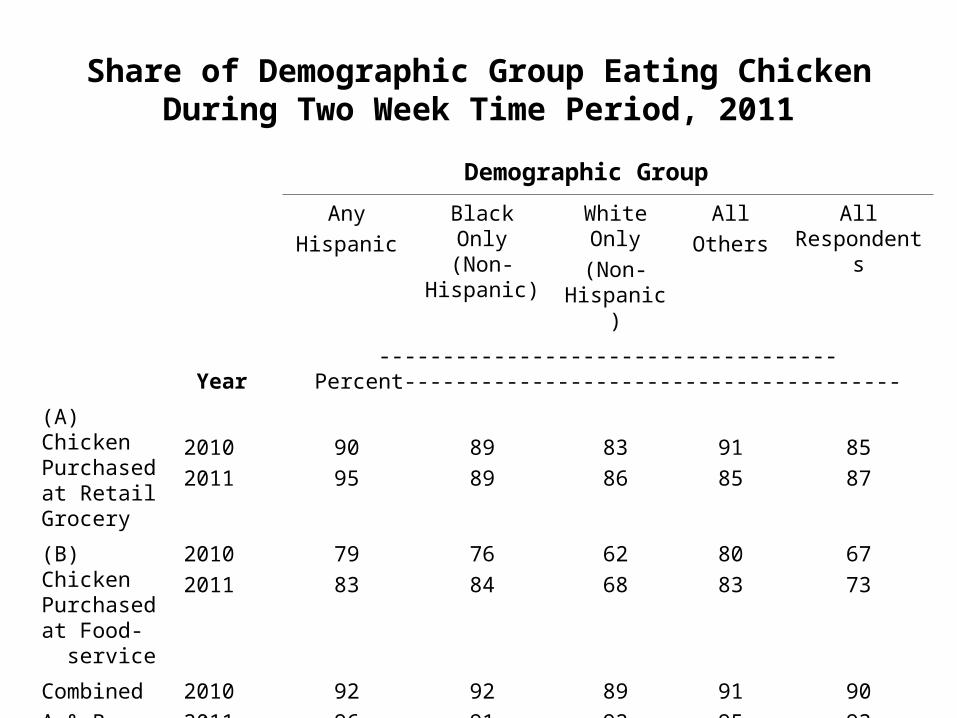
Share of Demographic Group Eating Chicken During Two Week Time Period, 2011
Any
Hispanic
Black Only (Non-
Hispanic)
White Only
(Non-Hispanic)
All
Others
All Respondents
Year
------------------------------------Percent---------------------------------------
(A) Chicken Purchased at Retail Grocery
2010
2011
90
95
89
89
83
86
91
85
85
87
(B) Chicken Purchased at Food- service
2010
2011
79
83
76
84
62
68
80
83
67
73
Combined
A & B
2010
2011
92
96
92
91
89
92
91
95
90
93
Demographic Group

Frequency of Eating ChickenPurchased at Supermarket/Retail Grocery (Times
During Past Two Weeks/2011)
13
11
1716
15
13
87
0
2
4
6
8
10
12
14
16
18
0 1 2 3 4 5 6-7 8->8
Frequency
--P
erc
en
t o
f C
on
su
me
rs--
Light
Medium
Heavy
None
Average times including none: 3.6Average times excluding none: 4.1

2723
21
9 812
0
5
10
15
20
25
30
35
40
0 1 2 3 4 5->5
--P
erc
en
t o
f C
on
su
me
rs--
Light
MediumHeavy
Frequency
Frequency of Eating ChickenPurchased from Foodservice
(Times During Two Weeks/2011)
None
Average times including none: 2.1Average times excluding none: 2.9
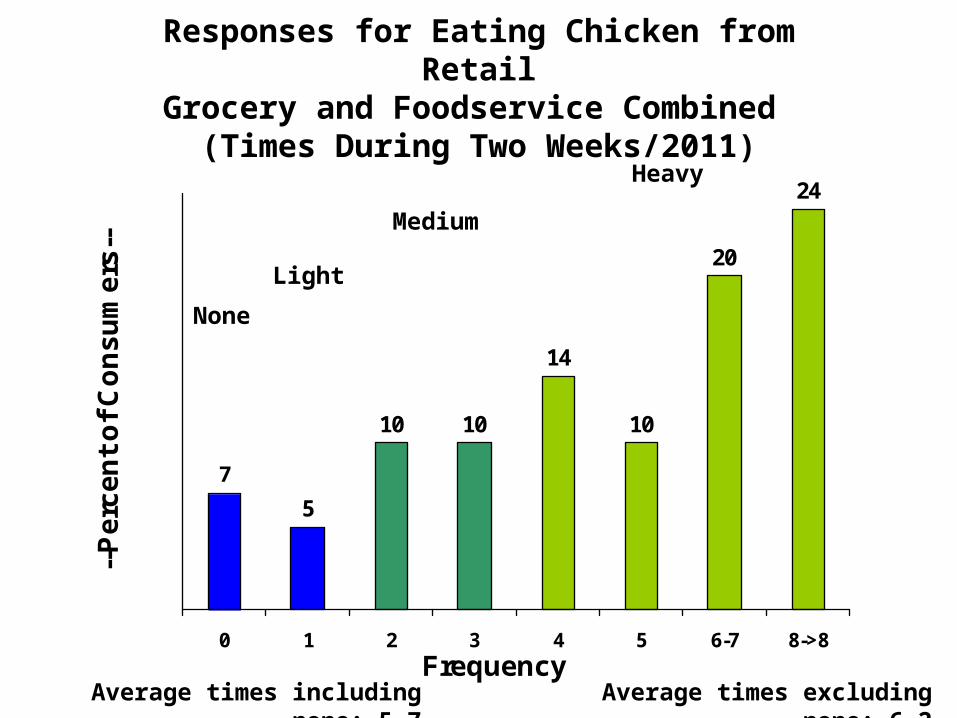
Responses for Eating Chicken from RetailGrocery and Foodservice Combined
(Times During Two Weeks/2011)
7
5
10 10
14
10
20
24
0
5
10
15
20
25
0 1 2 3 4 5 6-7 8->8Frequency
--P
erc
en
t o
f C
on
su
me
rs--
Light
Medium
Heavy
Average times excluding none: 6.2Average times including none: 5.7
None
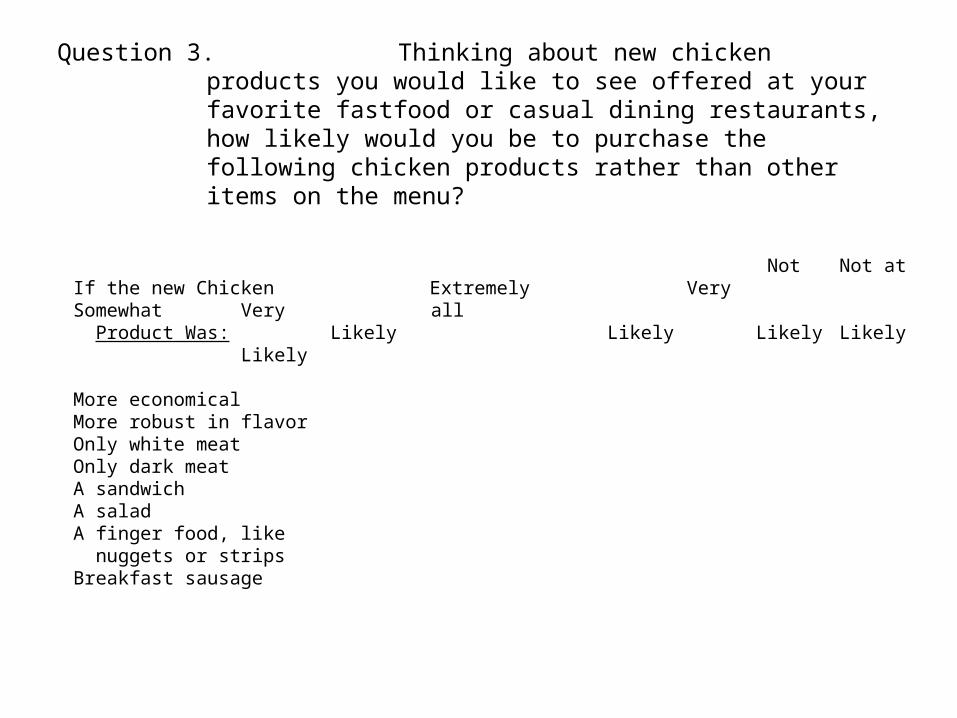
Not Not atIf the new Chicken Extremely Very Somewhat Very all Product Was: Likely Likely Likely Likely Likely
More economicalMore robust in flavorOnly white meatOnly dark meatA sandwichA saladA finger food, like nuggets or stripsBreakfast sausage
Question 3. Thinking about new chicken products you would like to see offered at your favorite fastfood or casual dining restaurants, how likely would you be to purchase the following chicken products rather than other items on the menu?
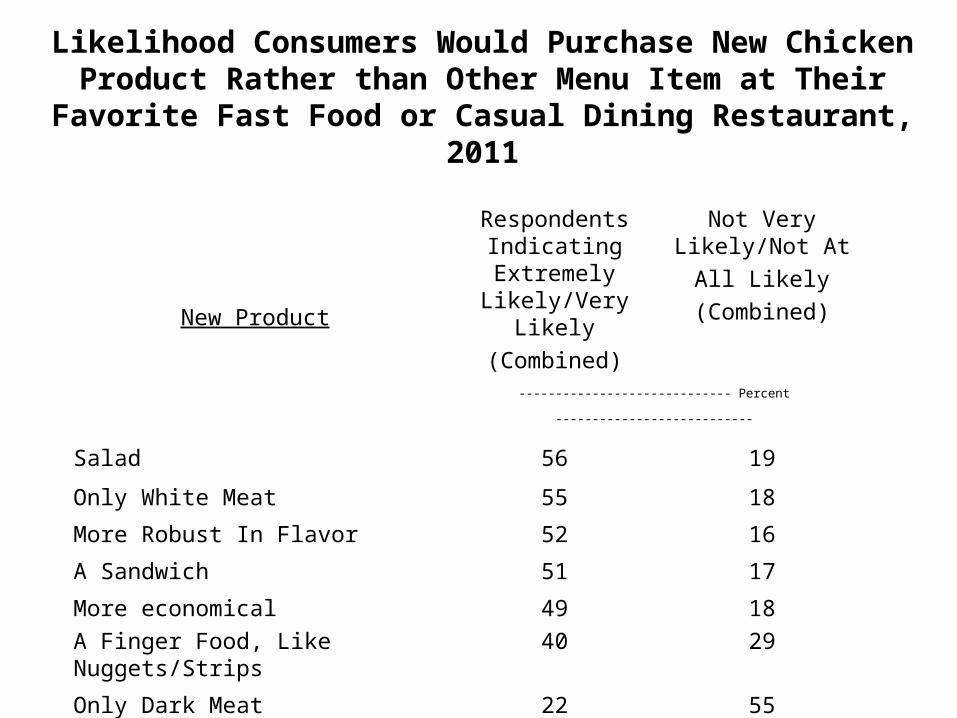
Likelihood Consumers Would Purchase New Chicken Product Rather than Other Menu Item at Their
Favorite Fast Food or Casual Dining Restaurant, 2011
New Product
Respondents Indicating Extremely
Likely/Very Likely
(Combined)
Not Very Likely/Not At
All Likely
(Combined)
----------------------------- Percent ---------------------------
Salad 56 19
Only White Meat 55 18
More Robust In Flavor 52 16
A Sandwich 51 17
More economical
A Finger Food, Like Nuggets/Strips
49
40
18
29
Only Dark Meat
Breakfast Sausage
22
19
55
56

Respondents Indicating Extremely Likely/Very Likely (Combined)
Years of Age
NewProduct 18-24 25-34 35-44 45-64 65+ Total
----------------------------------- Percent -----------------------------------
A salad 53 54 64 52 60 56
Only white meat 52 58 64 49 56 55
More robust flavor 55 55 60 49 46 52
A sandwich 63 56 60 44 43 51
More economical 48 46 62 44 48 49
A finger food, like nuggets or strips 47 52 49 30 32 40
Only dark meat 29 21 26 18 19 22
Breakfast sausage 31 25 25 11 15 19
Likelihood Consumers Would Purchase New Chicken Product Rather than Other Menu at their Favorite Fastfood or Casual Restaurant by Age, 2011
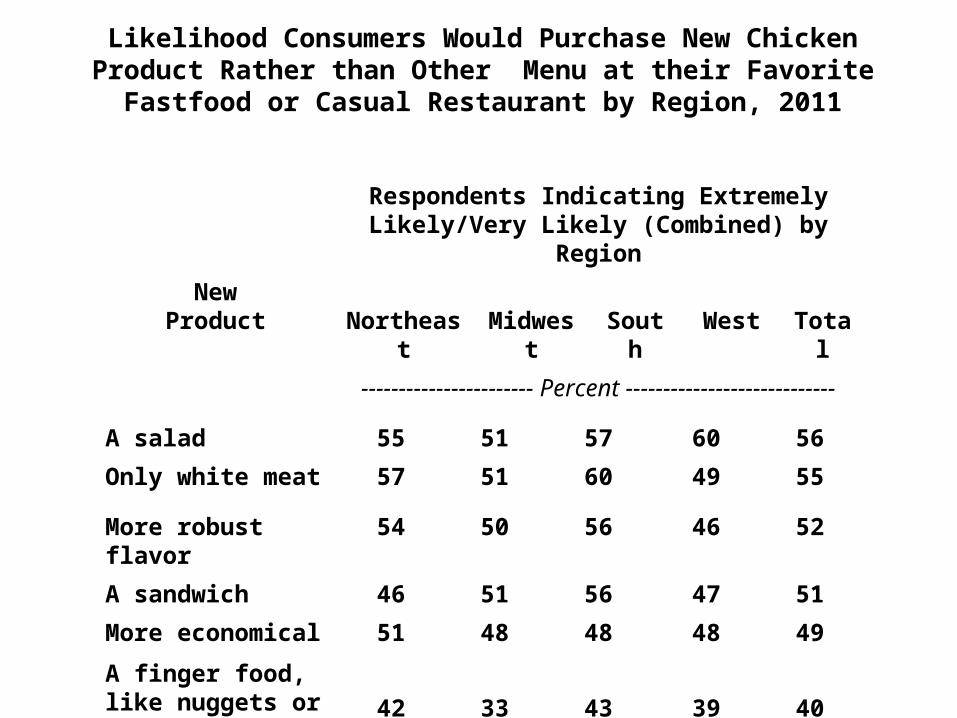
Respondents Indicating Extremely Likely/Very Likely (Combined) by Region
NewProduct Northeast Midwest South West Total
----------------------- Percent ----------------------------
A salad 55 51 57 60 56
Only white meat 57 51 60 49 55
More robust flavor 54 50 56 46 52
A sandwich 46 51 56 47 51
More economical 51 48 48 48 49
A finger food, like nuggets or strips 42 33 43 39 40
Only dark meat 25 17 22 24 22
Breakfast sausage 22 18 19 17 19
Likelihood Consumers Would Purchase New Chicken Product Rather than Other Menu at their Favorite Fastfood or Casual
Restaurant by Region, 2011
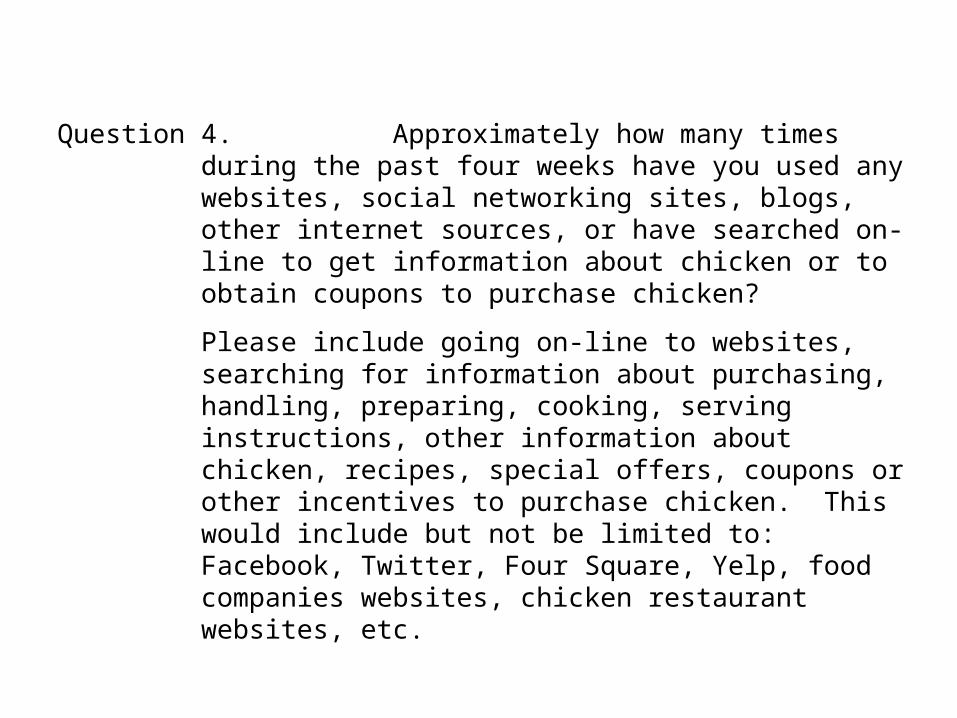
Question 4. Approximately how many times during the past four weeks have you used any websites, social networking sites, blogs, other internet sources, or have searched on-line to get information about chicken or to obtain coupons to purchase chicken?
Please include going on-line to websites, searching for information about purchasing, handling, preparing, cooking, serving instructions, other information about chicken, recipes, special offers, coupons or other incentives to purchase chicken. This would include but not be limited to: Facebook, Twitter, Four Square, Yelp, food companies websites, chicken restaurant websites, etc.
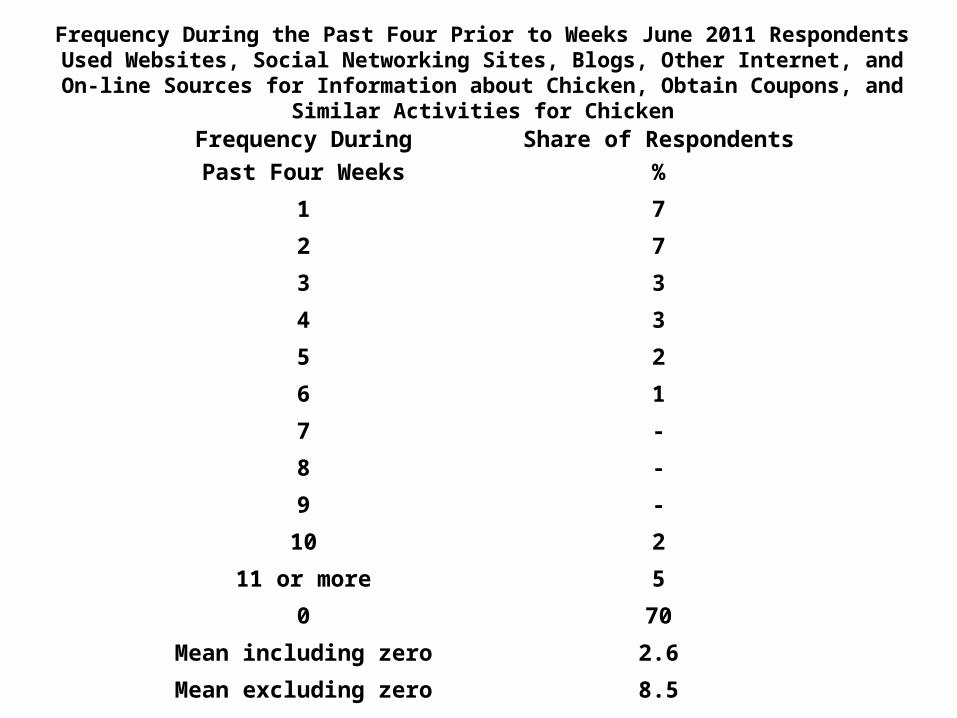
Frequency During
Past Four Weeks
Share of Respondents
%
1 7
2 7
3 3
4 3
5 2
6 1
7 -
8 -
9 -
10 2
11 or more 5
0 70
Mean including zero 2.6
Mean excluding zero 8.5
Frequency During the Past Four Prior to Weeks June 2011 Respondents Used Websites, Social Networking Sites, Blogs, Other Internet, and On-line Sources for
Information about Chicken, Obtain Coupons, and Similar Activities for Chicken
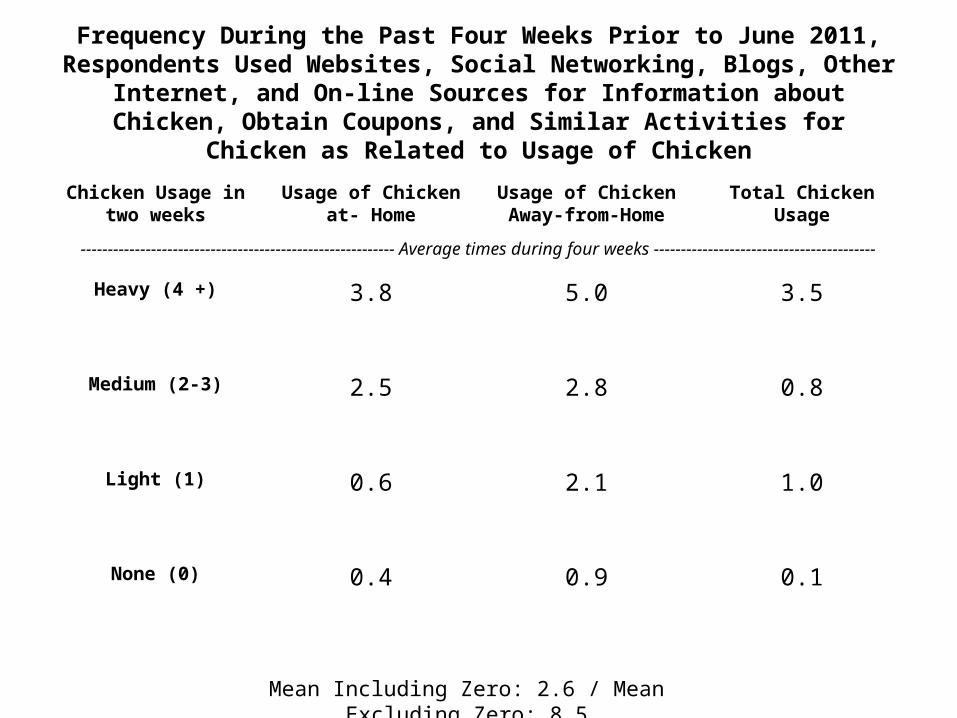
Frequency During the Past Four Weeks Prior to June 2011, Respondents Used Websites, Social Networking, Blogs, Other Internet, and On-line Sources for Information about Chicken, Obtain Coupons, and Similar
Activities for Chicken as Related to Usage of Chicken
Chicken Usage in two weeks
Usage of Chickenat- Home
Usage of Chicken Away-from-Home
Total Chicken Usage
---------------------------------------------------------- Average times during four weeks -----------------------------------------
Heavy (4 +) 3.8 5.0 3.5
Medium (2-3) 2.5 2.8 0.8
Light (1) 0.6 2.1 1.0
None (0) 0.4 0.9 0.1
Mean Including Zero: 2.6 / Mean Excluding Zero: 8.5
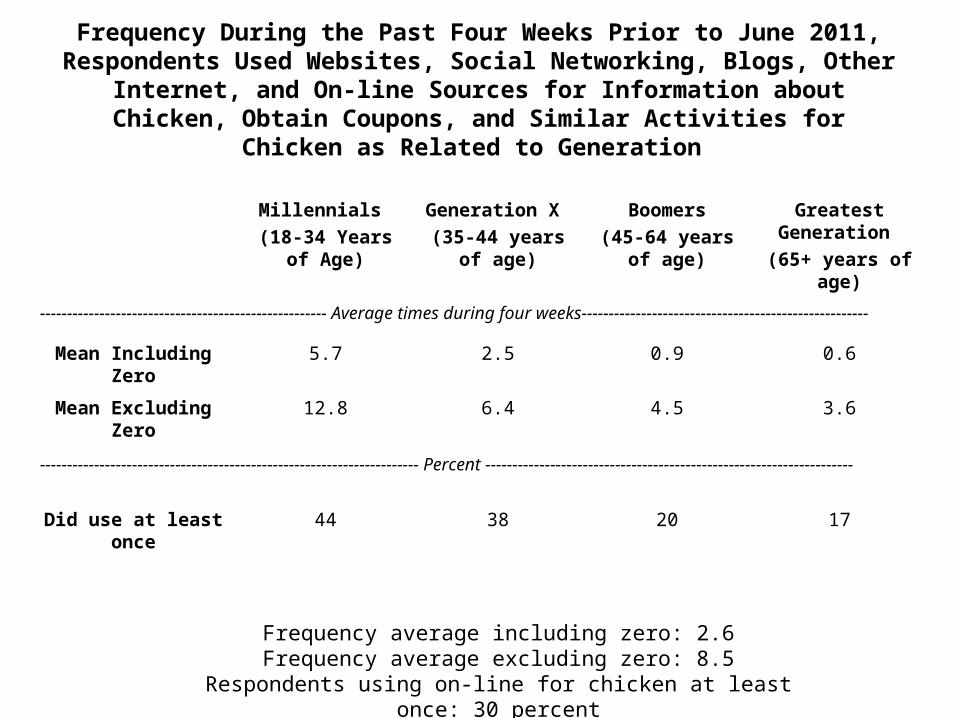
Frequency During the Past Four Weeks Prior to June 2011, Respondents Used Websites, Social Networking, Blogs, Other Internet, and On-line Sources for Information about Chicken, Obtain Coupons, and Similar
Activities for Chicken as Related to Generation
Millennials
(18-34 Years of Age)
Generation X
(35-44 years of age)
Boomers
(45-64 years of age)
Greatest Generation
(65+ years of age)
----------------------------------------------------- Average times during four weeks-----------------------------------------------------
Mean Including Zero 5.7 2.5 0.9 0.6
Mean Excluding Zero
12.8 6.4 4.5 3.6
---------------------------------------------------------------------- Percent --------------------------------------------------------------------
Did use at least once 44 38 20 17
Frequency average including zero: 2.6Frequency average excluding zero: 8.5
Respondents using on-line for chicken at least once: 30 percent
The Following Summary Was
Prepared by Paul Prekopa
President of PKS Research Partners
June, 2011
For more information about the 2011 survey results, contact the National Chicken Council. A print out of the survey data is available via e-mail upon request.
Contact Bill Roenigk at
[email protected] - (202) 296-2622 or
Debra Newman at
[email protected] - (202) 296-2622
National Chicken Council
1015 15th St NW, Suite 930Washington DC 20005
tel (202) 296-2622fax (202) 293-4005
www.nationalchickencouncil.com
Sponsors of the 2011 survey areGivaudan Flavors and Watt PoultryUSA Magazine.