consumer preferences for retail format choice · pdf fileconsumer preferences for retail...
TRANSCRIPT

CONSUMER PREFERENCES FOR RETAIL FORMAT CHOICE – CASE OF POLISH CONSUMERS
Radosław Mącik
Maria Curie-Skłodowska University, Poland [email protected]
Dorota Mącik
University of Finance and Management in Warsaw, Poland [email protected]
Monika Nalewajek
Maria Curie-Skłodowska University, Poland [email protected]
Abstract: Paper discusses on the background of literature on retail format choice Polish consumers behaviour and preferences for retail channel and format choice. Main results include comparison of perception maps created using multidimensional scaling with data coming from study conducted in 2009 and current research from 2012, giving possibility to assess changes at the economic slowdown time. During this period perception of discount stores substantially changed – previously perceived as similar to marketplace, now are treated as close to (larger) convenience stores. The second important change is differentiation between classical specialist stores and so called “category killers”. Still virtual channel formats are perceived as separate cluster in comparison to many physical retail formats, but online stores are connected with positive emotions even when are not used so frequently as physical shops. Additional data are provided to compare declared shopping frequency for 15 formats from both channels (5 for virtual and 10 for physical) with emotional attitudes toward them. Also multiple correspondence analysis (MCA) to find connections with shopping frequency and demographic variables has been performed, leading to conclusion that demographic factors other than age are not explaining format usage patterns, and consumer attitudes probably are more important factor in this case. Keywords: retail format choice, consumer preferences, change over time, economic slowdown, Poland
935

1. PREFERENCES FOR RETAIL CHANNEL AND FORMAT CHOICE Preferences for retail channel and format choice within particular channel depend on factors external to the consumer and internal ones. Those preferences are subject to change when important factors as changes in economy (like economic slowdown, fall in consumers income) and retail industry (development of new sales channels and/or formats) become visible for consumers. External factors among others include (Peter & Olson, 2002): perceived price level (for the format, and particular place), physical effort to buy (including commuting), amount of time needed to fulfill shopping task – most of external factor are creating perceived total cost of buying for the consumer. Among internal factors there are i.e.: consumer demographics, and – which is important from this paper aims – consumer personality manifesting in decision-making styles and perceived level of cognitive and emotional effort connected with shopping (mostly in terms of perceived risk and trust for retail format and particular shop). There should be noted that literature devoted to store choice issues has a long tradition, starting mainly in the 70’s of the 20th century. The authors of many of earlier studies - among others: Monroe & Guiltinan (1975), Arnold, Ma & Tigert (1978), Arnold, Oum & Tigert (1983), Mason, Durand & Taylor (1983), Keng & Ehrenberg (1984), Louviere & Gaeth (1987), Spiggle & Sewall (1987), Dawson, Bloch & Ridgway (1990), Burke et al. (1992), Arnold, Handelman & Tigert (1996) - have tried to rationalize store choice using different approaches, regarding external and internal factors to the consumer. For instance the store attributes and situational factors were studied, as well as shoppers and their households demographics, shopping patterns, attitudes toward stores, implied importance weights of factors like price level. Some more recent research examined i.e. the impact of task definition on store choice (Kenhove, Wulf & Waterschoot, 1999), but most of mentioned store choice studies have been restricted to the same format, i.e., supermarkets, discount stores. There also exist some studies examining the influence of retail pricing formats on shopping behavior (Bell, Ho & Tang, 1998), often assuming that one store format has in general higher prices than the other one. Bhatnagar, & Ratchford (2004) represent interesting approach, but limited to non-durable goods. Exploring fixed and variable costs of shopping, including assumption about consumers preferring to shop at minimum total cost, and different price levels between formats, they found conditions in which the store format choice would be optimal. Since e-commerce began play important role in retail industry shape, consumers are choosing not only store format but also channel of buying. In this paper choice between physical and virtual channel is considered, and as so called multichannel shopping behavior is very common, we do not assume, that channel is chosen first, and choice of store format is the next step in buying process. Authors qualitative investigation proved that channel choice is often situation driven, especially when there are no strong preferences to use particular channel. Also when seeking information is treated separately from actual buying, channel changes in both ways are occurring very often. Authors took approach of Mokhtarian and Tang (2009, 2011) in which perceived channel characteristics are influencing the choice of channel for both phases of consumer decision making: information search, and buying. Looking for factors influencing choice of physical or virtual channel and store format within it, we assumed that consumer mental characteristic should explain attitudes to particular store formats and chains/outlets. But because of character of this paper, we focused on measuring mostly declared shopping behavior, and revealed buying processes, dropping attitudes from deepened consideration. 2. SAMPLES AND MEASURES
Data presented in this paper are coming from two large nationwide samples, about 1100 subjects each. Data were collected by CAWI questionnaire in 2009 for first sample and at the end of 2012 for the second one. Because of collection method data are representative for population of Internet users in Poland regarding gender and age (between 18 and about 65 years old). Additional data used are coming from four focus groups (FGIs) – performed in January 2013 to deepen knowledge gathered from quantitative study. FGI participant (n=30) were differing in age (between 20 and 67yo) and gender.
936

Used measures include among others declared frequency of using particular formats within both channels (15 formats for 2012 and 12 formats for 2009) as well as emotional attitudes toward them. Data analysis relies on descriptive statistics and graphs. Multidimensional scaling procedures (MDS) as well as Multiple Correspondence Analysis (MCA) has been performed. There should be noted that presented analysis has an exploratory character. No exact hypotheses have been settled and tested in this case. Research has been founded from public funds through grant given by Polish National Center for Science to first author.
3. PERCEPTION OF STORE FORMATS BY POLISH CONSUMERS
For visual interpretation of perceived attributes of analyzed retail formats, one from typical algorithms for multidimensional scaling (namely ALSCAL procedure) has been performed. Picture 1 contains graphical representation of 2 main dimensions revealed from 2009 sample. Picture 2 presents results from 2012 sample. Dimensions on both pictures can be interpreted as:
- perceived level of personal interactions with the salespersons in particular retail format – dimension 1 – horizontal one on pictures 1 & 2 (alternative explanation is consumer familiarity with particular format),
- perceived total cost for consumer in sense described by Peter & Olson (2002, p. 459-461) – dimension 2 – vertical one on pictures 1 & 2.
This interpretation is more clear for 2009 data, and for new data set should be used more carefully, although there are no direct suggestions indicating that such approach is not appropriate. Picture 1: Perception map of retail formats on the base of declared shopping frequency (2009) – multidimensional scaling approach (ALSCAL procedure, Euclidean distances)
Source: authors own elaboration Two-dimensional solution for this case fits the data very well. Stress value is better or close than acceptable 0.1, and R2 statistic is very high, exceeding minimum of 0.6 (Borg & Gronen 2005, p. 48). In both cases virtual channel formats are forming group on the left side of dimension 1 – signalizing feeling of depersonalization of contact with customer. Also standard forms of internet shopping (online stores and online auctions) are similarly perceived – still having high perceived cost to the customer, despite lower than in physical retail perceived price level – this suggest that time of delivery, possible
Stress = 0,082R2 = 0,981
43210-1-2
Dimension 1
0,6
0,3
0,0
-0,3
-0,6
-0,9
Dim
ensi
on2 Internet auction
Internet store
cash &carry
marketplace
24/7 store
specialist store
discount store
convenience store
shopping mall
„category killer”
supermarkethypermarket
937
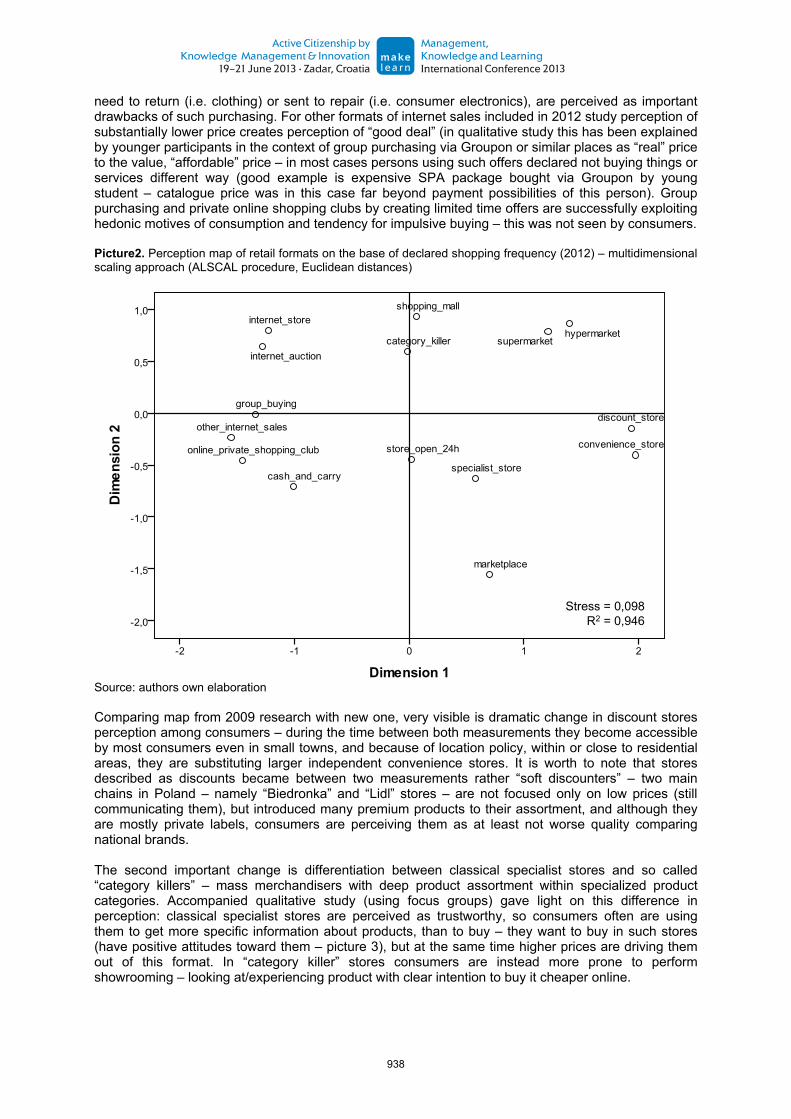
need to return (i.e. clothing) or sent to repair (i.e. consumer electronics), are perceived as important drawbacks of such purchasing. For other formats of internet sales included in 2012 study perception of substantially lower price creates perception of “good deal” (in qualitative study this has been explained by younger participants in the context of group purchasing via Groupon or similar places as “real” price to the value, “affordable” price – in most cases persons using such offers declared not buying things or services different way (good example is expensive SPA package bought via Groupon by young student – catalogue price was in this case far beyond payment possibilities of this person). Group purchasing and private online shopping clubs by creating limited time offers are successfully exploiting hedonic motives of consumption and tendency for impulsive buying – this was not seen by consumers. Picture2. Perception map of retail formats on the base of declared shopping frequency (2012) – multidimensional scaling approach (ALSCAL procedure, Euclidean distances)
Source: authors own elaboration Comparing map from 2009 research with new one, very visible is dramatic change in discount stores perception among consumers – during the time between both measurements they become accessible by most consumers even in small towns, and because of location policy, within or close to residential areas, they are substituting larger independent convenience stores. It is worth to note that stores described as discounts became between two measurements rather “soft discounters” – two main chains in Poland – namely “Biedronka” and “Lidl” stores – are not focused only on low prices (still communicating them), but introduced many premium products to their assortment, and although they are mostly private labels, consumers are perceiving them as at least not worse quality comparing national brands. The second important change is differentiation between classical specialist stores and so called “category killers” – mass merchandisers with deep product assortment within specialized product categories. Accompanied qualitative study (using focus groups) gave light on this difference in perception: classical specialist stores are perceived as trustworthy, so consumers often are using them to get more specific information about products, than to buy – they want to buy in such stores (have positive attitudes toward them – picture 3), but at the same time higher prices are driving them out of this format. In “category killer” stores consumers are instead more prone to perform showrooming – looking at/experiencing product with clear intention to buy it cheaper online.
Stress = 0,098R2 = 0,946
938
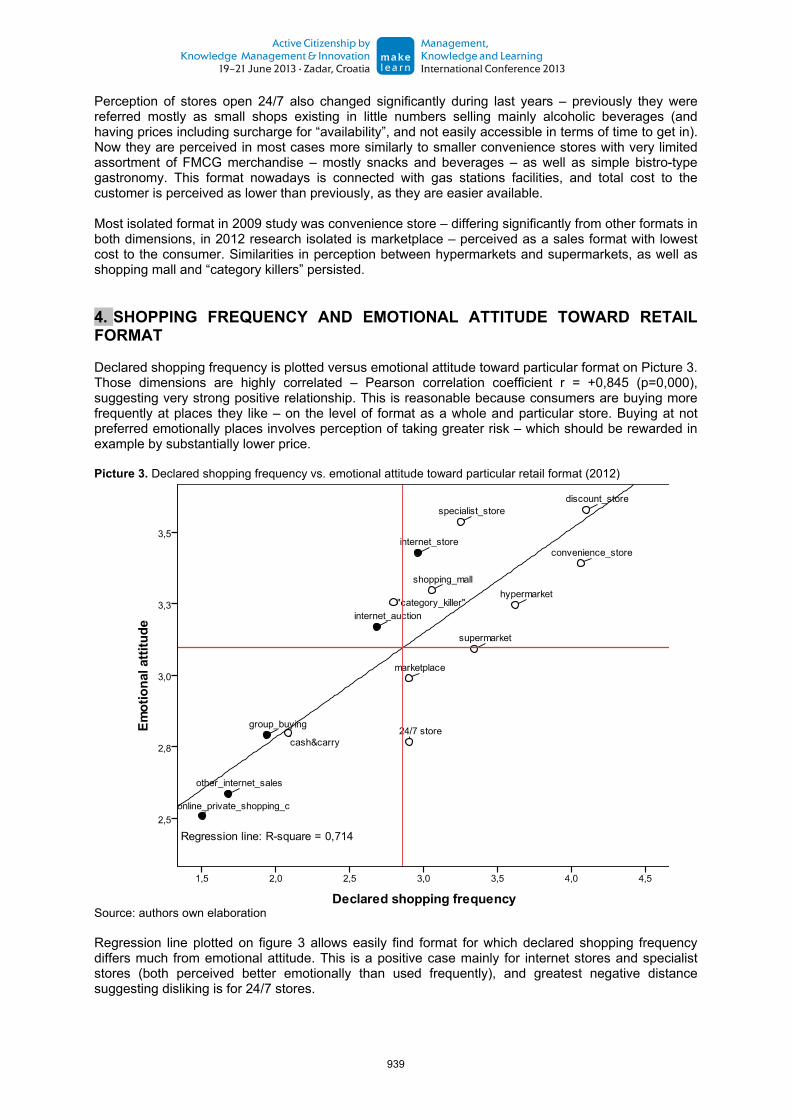
Perception of stores open 24/7 also changed significantly during last years – previously they were referred mostly as small shops existing in little numbers selling mainly alcoholic beverages (and having prices including surcharge for “availability”, and not easily accessible in terms of time to get in). Now they are perceived in most cases more similarly to smaller convenience stores with very limited assortment of FMCG merchandise – mostly snacks and beverages – as well as simple bistro-type gastronomy. This format nowadays is connected with gas stations facilities, and total cost to the customer is perceived as lower than previously, as they are easier available. Most isolated format in 2009 study was convenience store – differing significantly from other formats in both dimensions, in 2012 research isolated is marketplace – perceived as a sales format with lowest cost to the consumer. Similarities in perception between hypermarkets and supermarkets, as well as shopping mall and “category killers” persisted. 4. SHOPPING FREQUENCY AND EMOTIONAL ATTITUDE TOWARD RETAIL FORMAT Declared shopping frequency is plotted versus emotional attitude toward particular format on Picture 3. Those dimensions are highly correlated – Pearson correlation coefficient r = +0,845 (p=0,000), suggesting very strong positive relationship. This is reasonable because consumers are buying more frequently at places they like – on the level of format as a whole and particular store. Buying at not preferred emotionally places involves perception of taking greater risk – which should be rewarded in example by substantially lower price. Picture 3. Declared shopping frequency vs. emotional attitude toward particular retail format (2012)
Source: authors own elaboration Regression line plotted on figure 3 allows easily find format for which declared shopping frequency differs much from emotional attitude. This is a positive case mainly for internet stores and specialist stores (both perceived better emotionally than used frequently), and greatest negative distance suggesting disliking is for 24/7 stores.
939

Most positive attitudes are connected with discount stores – people think that buying at discounts is “smart” – saves money and time, gives access to interesting products perceived as having good value. Most negative attitudes (disliking) are for 2 relatively new internet sales formats: online private shopping clubs and informal internet sales (mostly C2C – not using auction platforms but rather social media tools). This comes from little knowledge about those forms – from cognitive perspective it is hard to like the unknown. More often used group buying is connected with more positive attitudes. Participants want to buy more often in internet stores – positive attitude toward them comes from availability of products not easily accessible in physical retail, and from ease to do comparison shopping – as expressed focus group participants – while main force prohibiting them to do so is still a risk, perceived mainly as possible delay with shipping and logistics, hidden costs or future problems after purchase. Consumers are also liking more specialist stores – they trust more the salespersons, appreciate their professional knowledge and advice, but think that price level is too high for them or they dislike purchasing things “on order” instead getting products immediately, so in effect much purchases is done outside this format, mainly over the Internet or through large store chains. Not liking but quite often buying in 24/7 stores is obviously connected by respondents with shopping by the way of fuel purchasing – perceived as overspending or with necessity to buy some FMCG over typical open hours. It is worth to note that in Poland there are very little restrictions of open days/hours for retail, but only in large cities exist larger stores are open 24/7 due to limited demand (for instance in Lublin having circa 350 thousand inhabitants only one Tesco hypermarket is open this way). 5. SHOPPING FREQUENCY AND SELECTED DEMOGRAPHIC VARIABLES To assess influence of demographic background of the consumer (in terms of such variables as gender, age group (6 groups), type of residential place (4 types) and also income – in 3 broad groups) on declared shopping frequency multiple correspondence analysis has been performed. Generally speaking, multiple correspondence analysis (MCA) is a data analysis technique for nominal categorical data, used to detect and represent underlying structures in a data set, by representing data as points in a low-dimensional Euclidean space – mostly in two dimensions (Le Roux and Rouanet, 2004, p. 180). Frequency of shopping has been divided into three groups: never, rare and often for each retail format, and next (for clarity) answers with most typical middle category were excluded from analysis. This led to graphical output seen on Picture 4. On the Picture 4 three types of colored markers has been used: solid dots for demographic variables, “empty” dots for physical retail formats, and diamond-shaped ones for virtual retail formats. Each marker has own description of represented category (often or never) for retail formats and specific group names for demographic variables. Dimension 1 on the Picture 1 represents most of variability in the data, dimension 2 in this case supplements dimension 1. As is visible on Picture 4 used demographic variables are weakly connected with buying at certain retail format more often or never. Most of points representing categories of those variables lies on the graph close to themselves, and close to position where excluded category of shopping frequency named “rare” (as buying not more frequently than some times a month – can be described) were positioned. This confirms weak influence of demographics on most typical shopping frequencies. Only higher age – particularly over 60yo is influencing declarations of never buying at many physical retail formats (such as shopping mall, “category killer” and hyper/supermarkets), and age over 45yo is connected with declarations of never buying using more recently introduced internet sales formats (group purchasing, online private shopping clubs or informal internet sales). Persons older than 65yo are also reluctant to buy over typical internet shopping formats: internet stores and auction platforms. Those results were confirmed during focus groups, where some persons over 60yo declared that they are not buying durable goods at all, are limiting such purchase form financial reasons and are using old appliances given by their children (for instance mobile phones). Their purchases are mostly local with neighboring stores (convenience, discounts or smaller supermarkets.
940

Men, persons with higher income and living in big cities are a little bit more likely to buy at internet stores and auction platforms as well as at “category killer” chain-stores. Picture 4. Multiple correspondence analysis (MCA) results for all investigated retail formats and selected demographic variables (2012)
Source: authors own elaboration Any used demographic variable is not clearly connected with often usage of new formats of internet retail (group buying, online private shopping clubs and informal internet sales) – even young age is not a predictor of often purchases at those formats. Also higher age not explains enough declaration of never using such physical retail formats as: discounts and hypermarkets (both highest on dimension 2), as well as convenience and specialist stores. Any other used demographic variable is not visually connected with such behavior. So high shopping frequency over the Internet and never buying at physical retail formats is caused by other factors than demographics. Probably the attitudes are playing the main role in this case, which suggestion has been supported by results of focus groups and earlier authors research (Mącik et al, 2012) 6. CONCLUSIONS AND LIMITATIONS Both performed studies shown relative similarities and differences in perception of investigated retail formats from both channels used by consumers: traditional – physical and more advanced – virtual one. Perceived differences between formats inside virtual channel are typically less pronounced, than between formats of physical retail. Also changes over time are greater in perception of physical retail formats than for virtual ones. This leads to conclusion, that physical channel changes itself more than virtual one, possibly because of feeling competition of virtual one. Biggest, positive change in
941

perception of discount stores shows that format as winning one today in Poland. At the same time internet retail increased its share in total sales but not changed its perception, still facing some problems like perceived risk of fraud and logistics failures. Declared shopping frequency is highly positively correlated with emotions toward particular format. Channel to which particular format belongs doesn’t play in this relationship important role. Generally positive emotions toward Internet stores are leading to conclusion that this format – when well managed – has great potential to growth, particularly when today’s consumer objections toward it will be overcome. Typical demographic variables are weakly connected with buying often or never at certain retail format. There is only one exception: older age when consumption is decreasing from many reasons, is connected mainly with not using some of internet retail formats, as well as many physical ones. Suggestion that consumer attitudes are stronger influencing frequency of particular format usage seems to be confirmed by MCA analysis. Presented analysis has several limitations. First – all data used were analyzed using exploratory techniques, so no exact hypotheses have been tested. This limitation is partly overcame by usage of large nationwide representative samples. Second – used measures are mostly consumer declarations not always true from several reasons, it will be interesting to compare real behavior traces in example by analyzing bank account and payment cards data over time in longitudinal study. Third – presented results were in this paper not compared directly with attitudes toward technology and consumption – this is planned in next publications, as necessary data have been collected. And last – fourth limitation is to present results gathered through CAWI questionnaire – not accessible for persons not using the Internet in any form, so their opinions and behaviors are not directly included in this paper. Only in focus groups were participants not using the Internet, but there is no possibility to treat them as enough complete sample to make conclusions about whole non-users group. REFERENCES 1. Arnold, S. J., Handelman, J., & Tigert, D. J. (1996). Organizational legitimacy and retail store
patronage. Journal of Business Research, 35(3), 229– 239. 2. Arnold, S. J., Ma, S., & Tigert, D. J. (1978). A comparative analysis of determinant attributes in
retail store selection. In H. K. Hunt (Ed.), Advances in Consumer Research, 5, 663–667. Ann Arbor, MI: Association for Consumer Research.
3. Arnold, S. J., Oum, T. H., & Tigert, D. J. (1983). Determinant attributes in retail patronage: Seasonal temporal, regional and international comparisons. Journal of Marketing Research, 20(2), 149–157.
4. Bell, D. R., Ho, T., & Tang, C. S. (1998). Determining where to shop: Fixed and variable costs of shopping. Journal of Marketing Research, 35(3), 352– 369.
5. Bhatnagar, A., Ratchford, B. T. (2004), A model of retail format competition for non-durable goods. International Journal of Research in Marketing, 21(1), 39-59.
6. Borg I., Groenen P.J.F. (2005), Modern Multidimensional Scaling: Theory and Applications, 2nd Ed., Springer.
7. Burke, R., Bari, R., Harlam, A., Kahn, B. E., & Lodish, L. M. (1992). Comparing dynamic consumer choice in real and computer- simulated environments. Journal of Consumer Research, 19(1), 71–82.
8. Dawson, S., Bloch, P. H., & Ridway, N. M. (1990). Shopping motives, emotional states and retail outcomes. Journal of Retailing, 66(4), 408–427.
9. Keng, K. A., & Ehrenberg, A. S. C. (1984). Patterns of store choice. Journal of Marketing Research, 21(4), 399–409.
10. Kenhove, P., Wulf, K., & Waterschoot, W. V. (1999). The impact of task definition on store-attribute saliences and store choice. Journal of Retailing, 75(1), 125–137.
11. Le Roux, B. and Rouanet H. (2004). Geometric Data Analysis, From Correspondence Analysis to Structured Data Analysis. Dordrecht: Kluwer
12. Louviere, J. J., & Gaeth, G. J. (1987). Decomposing the determinants of retail facility choice using the method of hierarchical and international comparisons. Journal of Marketing Research, 63(1), 149–157.
942

13. Mason, J. B., Durand, R. M., and Taylor, J. L. (1983). Retail patronage: A causal analysis of antecedent factors. In W. Darden, & R. Lusch (Eds.), Patronage behavior and retail management (pp. 339–352). New York: North-Holland.
14. Mącik R., Mazurek G, and Macik D. (2012). Channel characteristics influence on physical vs. virtual channel choice for information search and purchase - the case of Polish young consumers, International Journal of Cyber Society and Education, 5(1), 35–54.
15. Mokhtarian P.L. and Tang W. L. (2009), Accounting for Taste Heterogeneity in Purchase Channel Intention Modeling: An Example from Northern California for Book Purchases, Journal of Choice Modelling, 2(2), 148-172, 2009.
16. Mokhtarian P.L. and Tang W. L. (2011), Trivariate probit models of pre-purchase/purchase shopping channel choice: clothing purchases in northern California, paper presented at International Choice Modelling Conference 2011, Oulton Hall (UK) 4–6 July 2011, http://www.icmconference.org.uk/index.php/icmc/ICMC2011/paper/view/426/119
17. Peter J.P., Olson J.C. (2002), Consumer Behavior and Marketing Strategy, Homewood, IL: Irwin – McGrawHill,
18. Monroe, K. B., & Guiltinan, J. P. (1975). A path-analytic exploration of retail patronage influences. Journal of Consumer Research, 2(1), 19– 28.
19. Spiggle, S., & Sewall, M. A. (1987). A choice set model of retail selection. Journal of Marketing, 51(2), 97–111.
943