consumers’ use and understanding of food label information
TRANSCRIPT

Publisher: Asian Economic and Social Society ISSN (P) 2304-1455, ISSN (E) 2224-4433 Volume 2, No 3, September, 2012
Consumers’ Use and Understanding of Food Label
Information and Effect on their Purchasing Decision
in Ghana; A Case Study of Kumasi Metropolis
Osei Mensah J. (Lecturer, Department of Agricultural
Economics, Agribusiness and Extension, Kwame Nkrumah
University of Science and Technology, Kumasi-Ghana)
Lawer, D. R. (BSc. graduate, Department of Agricultural
Economics, Agribusiness and Extension, Kwame Nkrumah
University of Science and Technology, Kumasi-Ghana)
Aidoo, R. (Lecturer, Department of Agricultural Economics,
Agribusiness and Extension, Kwame Nkrumah University of Science and Technology, Kumasi-Ghana)
Citation: Osei Mensah J., Lawer Dede Rose and Aidoo, R. (2012) “Consumers‟ Use and
Understanding of Food Label Information and Effect on their Purchasing Decision in Ghana; a
Case Study of Kumasi Metropolis”, Asian Journal of Agriculture and Rural Development, Vol. 2,
No. 3, pp. 351-365.

Asian Journal of Agriculture and Rural Development, 2(3), pp. 351-365
351
Author(s)
Osei Mensah J. Lecturer, Department of
Agricultural Economics,
Agribusiness and Extension,
Kwame Nkrumah University of
Science and Technology,
Kumasi-Ghana
Email:[email protected]
Lawer D. R. BSc. graduate, Department of
Agricultural Economics,
Agribusiness and Extension,
Kwame Nkrumah University of
Science and Technology,
Kumasi-Ghana
Email:[email protected]
Aidoo R. Lecturer, Department of
Agricultural Economics,
Agribusiness and Extension,
Kwame Nkrumah University of
Science and Technology,
Kumasi-Ghana
Consumers’ Use and Understanding of Food Label
Information and Effect on their Purchasing Decision
in Ghana; a Case Study of Kumasi Metropolis
Abstract
This study explored consumers‟ use and understanding of food
label information and the effect on their purchasing decision in the Kumasi Metropolis. It also investigated the association
between socio-demographic factors and the use of food label,
the understanding of the information read as well as the type of
information sought. The study surveyed 250 consumers who
were conveniently selected from five different sub-metros in
the metropolis. Questionnaires were formulated to sample data
and information from consumers on their use and
understanding of Food Label Information. Results suggested
that the sample was gender sensitive (57.6% male) with a
modal aged group between 15-30 years (60.8%) who had never
been married (54.0%), with a greater number who had tertiary
education (36.4%) and earning low income between GH¢50-499 (61.6%). About 79.6% (n=199) of the respondents,
recounted accessing food label information before purchase
and they read the information occasionally (29.6%) during
initial purchase (37.2%). Majority of the respondent said
advertisement (31.6%) and price (31.2%) other than food label
(10.0%) were the central stimuli to purchase a canned food
product. Highly-educated, male consumers2( 17.602, , 0.007,df p ) were those more likely to use various
types of food label information than others. A positive relationship was observed between male, youthful (31-45)
consumers and consumer who were never been married and
their use and understanding of food label information.
Keywords: Food, Label, Information, Package, Consumers, Kumasi.
Introduction
With the improvement of living standards,
consumers have become increasingly concerned
about their health and general well-being since
natural food is increasingly being replaced with
conventional foods. To make a product unique
and distinctive, firms spend more money and
time on packaging more than advertisement because packaging is mostly the utmost
distinguished marketing element (Dickson,
1994). According to Héroux et al. (1988),
marketers as well as manufacturers spend
considerable time and substantial amount of money on packaging products in a manner that
will attract consumer attention and enhance the
product consumption. Food label has now
become a popular policy tool.
At present, there are many reasons why foods
are processed and packaged, some of which
include, adding value to a food, improving
visual appeal, and convenience. The act has
now developed far beyond its initial purpose of
Consumers’ Use and Understanding of Food Label ...
352
product protection. In Ghana, The Food and
Drugs Board (FDB) regulates food product
manufacturing, importation, exportation,
advertisement and distribution. In pursuance of
section 47(b) (ii) of the Food and Drugs Law,
1992 (P.N.D.C.L 305B) guidelines are made to regulate the use of health claims in food
labeling and advertisement in Ghana.
Research on food label and consumers have
gained much momentum in recent times. A
survey by the American Dietetic Association,
(1995) found that almost 50% of respondent
found nutritional label confusing. In India, it
was found out that consumers have an inability
to understand food label information because of
difficult terminology and small font sizes.
Therefore television, friends and magazines are commonly used for assessing the nutritional
information, (Manisha, 2008). A study
conducted by Allen et al. (2001) on patients
understanding and use of Snack and Package
Nutrition Labels, suggests majority of
consumers (patients) do not understand snack
food nutrition labels well enough to make
informed dietary choices. Study conducted in
Malawi by Kasapila and Shawa, (2011) showed
that among all label users (n=60), 7.3%
reported to understand well what they read on the nutrition panel, 18.9% understood it partly
and the rest (73.8%) did not understand the
numerical information and terminology used.
Moreover, the rural consumers were not
familiar with the English language (64.3%) on
food packages.
Food labels are of tremendous importance to
the consumer (provide them a means of evaluating the food before purchase), the firm
producing and selling the product (a means of
communicating to the potential consumer the
attributes and qualities of the product), and
regulatory bodies (a means of ensuring that
food produced and sold meet required standards
and a means of protecting the interest of the
general public). Despite these benefits of food
labels, there have been many reported instances
where non-certified, expired, illegal or fake
food products are sold to the public. Cases in point are sale of uncertified sachet water, the
sale of expired canned tomatoes and frozen
chickens, and the sale of uncertified imported
food products on the Ghanaian market.
From the above it can be confidently argued
that these instances and their frequency of
occurrence can be considerably alleviated if the
needed attention is paid to the food label
information by consumers, if the regulatory
bodies had enforced their constitutionally mandated responsibilities, and had all the
manufacturing companies complied with the act
of Ghana Standards Board (GSB) and Food and
Drugs Board (FDB) as stated above. In the
event that manufacturing firms and regulatory
bodies are unable to adequately carry out their
mandate, it is incumbent on consumers to
critically examine the food before purchase. An
important means of assessing food product is
through the labels. Against the backdrop of
alleged frequent sale of expired and uncertified
food products it can be asserted that consumers either do not refer to food labels when buying
or they do not understand what the information
contained on food labels mean. This might
either be due to ignorance or lack of awareness
and also an attitude of indifference.
An important issue worth addressing is
whether consumers refer to food labels for product information before and during purchase
and whether consumers really understand what
these information mean. Also, even if they do
refer to food label information, little is known
about the extent to which consumers‟ food
purchasing decision is affected by food label
information. Knowing whether or not
consumers understand food label information,
the type of information consumers look out for
and whether consumers‟ choice of food is
affected by food label information will help
manufacturers make informed decisions in this regard. Improvement on the part of these
manufacturing firms in turn will help
consumers make well-informed choice, reduce
the risk of food poisoning, buying fake products
etc.
The study therefore seeks to address the issue of
how consumers use food label information and the effect it has on the purchasing decision of
consumers.
The rest of the paper is organized as follows;
section two reviews literature relevant to this
study whilst the research methodology is
presented in section three. Section four presents

Asian Journal of Agriculture and Rural Development, 2(3), pp. 351-365
353
and discusses the results/findings of the study
whilst the conclusions and recommendations
are presented in the last section, five.
Literature Review
Hu et al. (2006) noted that consumers‟
behaviour in response to reading food labels
will depend upon the reference points from
which they came and the values that they bring
to food purchasing. Labels are one of the most
important features of product packaging, and
they are designed to communicate a message
(Héroux et al. 1988). But consumer behaviour
is complex, very often difficult to understand
and they differ across borders and also between and within regions, (DG SANCO, 2005).
Decision to purchase
A number of factors influence consumers‟
decision-making, but Prathiraja and
Ariyawardana (2003) anticipated nutritional
labelling to affect consumers‟ purchasing
behaviour significantly. Consumers‟ ability to
choose their diets depends partly on the
quantity as well as quality of information
available through a variety of sources, including
nutrition panel of food labels (Caswell and Padberg, 1999).
Underwood et al., (2001) and Silayoi and Speece
(2004), found out that packaging elements act as
a tool for differentiation. This helps consumers to choose the product from a wide range of similar
products and stimulates customers buying
behaviour. Thus food package performs an
important role in marketing communications and
could be treated as one of the most important
factors influencing consumer‟s purchasing
decision. The research findings of Rita (2009)
show that the impact of package elements on
consumers purchasing decisions can be stronger.
She concludes that a package could be treated as
one of most valuable tool in today‟s marketing communications, necessitating more detailed
analysis of its elements. The impact of package
and its elements on consumer‟s purchase
decision can be revealed by analysing the
importance of its separate elements for
consumer‟s choice.
The pre-purchase search of nutritional
information could be measured in terms of label
use (Nayga, 2003). Thus consumer‟s preference
and decision to purchase can have some
appreciable amount of link to the labels and
therefore suggest having an impact on the
choice behaviour. However, consumers‟
purchasing behaviour does not always reflect their stated preferences (Henneberry and
Armbruster, 2003). Unlike Malawi where price
is a major determinant of purchase (Kasapila
and Shawa, 2001), in Lesotho (Mahgoub et al.,
2007), it was clear that nutritional information
was the major factor that affects the decision of
participating in the studies to purchase the types
of food they buy.
Consumer demographic characters and
effect on purchasing decision
There are a lot of factors that influence choice and decision to buy or not to buy. Due to
increasing self-service and changing
consumers‟ lifestyle, the interest in package as a
tool of sales promotion and stimulator of
impulsive buying behaviour is growing
increasingly. Previous researches suggest that
the acquisition of information, and
consequently behaviour, are influenced by
various demographic factors such as age
(Nayga, 1997; Govindasamy and Italia, 1999);
sex (Mintel, 2006; Beus and Dunlap, 1992); household size (Nayga, 2003) and race (Katona
and Mueller, 1995; Putler and Frazao, 1994); by
the marketing environment, including
urbanization and region (Park et al., 1989); by
education (Schultz, 1975; Hu et al., 2006); by
factors that affect time constraints, such as
employment (Becker, 1977; Beatty and Smith,
1987); and by perception factors (Guthrie et al.,
1995).
Gellynck et al. (2006) also found that
responsiveness of Belgian consumers to
information about food traceability was
significantly associated with education, though
not with gender and age. A study by the
Ministry of Agriculture, Fisheries and Foods in
the UK (MAFF, 1994) found that the
educational level of UK consumers did not
affect their interpretation and responses to the
information provided on labels. Grossman, (1972) found that the rate of appreciation for
good health increases with age. Consequently,
older individuals might be more cautious about
what they eat for health reasons. Hence these

Consumers’ Use and Understanding of Food Label ...
354
factors may increase consumers desire to know
more about the nutritional aspects of the food
they eat.
Perception variables such as product safety,
nutrition, price, and taste when food shopping, as well as perceptions on healthfulness of one‟s
diet and degree of diet-disease belief are also
factor that promote the use of food label
information. The result of Rodolfo, (1996)
suggests that main meal planners who hold a
stronger belief that discernment in what is
consumed can help to reduce the risk of
developing a major health disorder such as
heart disease and cancer are more likely to use
nutritional information related to fibre, fat, and
sugar content on food packages.
Price can hide other aspects of the label, especially for lower income consumers. Those
with high income displayed different attitudes
to those with lower income in terms of the
perceived options available to them. Also, main
meal planners of higher-income households are
more likely to use nutritional information
concerning calories, sodium, fibre, fat, and
cholesterol content than main meal planners of
lower-income households, (Rodolfo, 1996).
In Lesotho, majority (71.2%) of the participants
claimed that they use a shopping list. And a positive relationship was seen between food
label usage and age, income family size and
education. Less than half of the participants
(40.5%) indicated that nutritional information
on food labels, rather than price, taste,
appearance, habit, convenience, or brand name,
was their main motivator to purchase foods
(Mahgoub et al., 2007).
Some food label information consumers
consider during purchase
The level and extent of information required is
often driven by specific dietary needs or underlying health conditions (MORI, 2010).
Food Safety
The labels that help consumers determine
whether food products are safe, hygienic and of
high quality are country of origin traceability
(of the origin, production process and product
information of food), quality assurance, and
use-by/best-before dates. The latter are seen as
good indicators of freshness, shelf-life and
general food safety, (Philip et al., 2010). Most
consumers are willing to pay the most for food
label. They believed the label denote food
safety and quality (Umberger et al., 2003).
Country of Origin
Country of origin labelling is basically for the traceability of food products and also to fulfil
the demand of Mandatory Labelling. There is
generally the belief that one‟s own country or
region produces safer and better food than other
countries or regions (Philip et al., 2010). This
was echoed by Wier et al. (2008), who found in
their survey of consumers in Britain and
Denmark that 72% of all respondents would
prefer to buy conventional domestic fruits and
vegetables rather than organic foreign produce.
Banterle and Stranieri (2008) have found that
country of origin is an important indicator for consumers of both the quality and safety of
food. Research by Umberger et al. (2003)
reveals that the surveyed consumers in Chicago
and Denver were willing to pay a premium for
Country-of-Origin Labelling. This reflects a
common belief that local, or near-local produce
is not only safer, better tasting, and of superior
quality, but that it is also easier to verify its
quality, (Philip et al., 2010).
Quality When consumers choose among competing products, they are faced with quality and
product performance uncertainty. Package is
one of the main elements of the product
appearance and as such is an important source
of information since consumers rely heavily on
labels for product information and also
packaging is a significant marketing
expenditure larger than advertising itself, (Pires
and Ricardo, 2008). Hoback (2008) found that,
“consumers see organic products as purer,
healthier and better tasting than conventional
food and other products”. Padel and Foster (2005), however concluded that “price remains
a barrier for many consumers, but it is possible
that its significance could be diminished if
consumers were made more aware of the
reasons for the higher price, and convinced that
organic food is a value for money choice
despite the premium”. Although consumers
look for date labels, there is evidence that many
misunderstood what terms like „best before‟ and
„use by‟ actually represent (MORI, 2010).

Asian Journal of Agriculture and Rural Development, 2(3), pp. 351-365
355
Health Claims
"Health claim" means any claim that states,
suggests or implies that a relationship exists
between a food category, a food or one of its
constituents and health, (FDB, 1992). Nutrition
and Health information help consumers make informed choices about health risks and how to
balance these risks. Generally, participants
tended to look out for reassurance of specific
qualities such as no electronic numbers, no
caffeine, and low fat (or most frequently „lite‟)
(MORI, 2010). Some consumers also look at
food label because of health consciousness
(Prathiraja and Ariyawardana, 2003).
Price Price is one of the most important labels for
most consumers, and one that influences their
food purchasing decisions. Price ranks alongside country of origin and expiry/use-by
dates as the most commonly sought information
on food labels, (Philip et al., 2010). Price can
eclipse other aspects of the label, especially for
lower income consumers. Those with high
income displayed different attitudes to those
with lower income in terms of the perceived
options available to them. Consumers in lower
paid jobs paid more attention to special price
offers, and thus respectively paid less attention
to food labelling directly, (MORI, 2010). Charles, (2002) released in his study that 70%
of purchasing decision is based on price, taste
and expiry date alone. „„For the lowest income
group, food price was the major determining
factor of the types of foods they buy‟‟
(Mahgoub et al., 2007).
Methods
Research Area
Kumasi is Ghana‟s second largest city and
capital of the Ashanti region found in southern
Ghana. Kumasi covers approximately 299
square kilometre size of land and is located in
the transitional forest zone and is about 270km
(by road) north of the national capital, Accra.
Sampling and data collection
The research concentrated on consumers (from 15 years and above) of canned/tinned foods in
the Kumasi metropolis because of its highly
concentrated cosmopolitan population. The
metropolis is divided into ten sub-metros out of
which five were selected by simple random
sampling. Fifty consumers were conveniently
selected (after attempts to use probability
sampling proved not feasible) from the five
sub-metros. Questionnaires were formulated and used to collect and sample data on
consumers‟ use, understanding of food label
and their demographics. This was administered
through personal interviews with consumers in
the selected areas. Data were collected through
the use of well-structured survey
questionnaires. Consumers, specifically
individuals from 15 years and above were
drawn based on convenience and asked if they
purchased any form of canned foods and were
enthusiastic to contribute to the study. These
consumers were considered old enough to make informed purchasing decision. Canned/tinned
food was chosen because it is one of the arrays
of food that fall under mandatory labelling.
These food groups are required to provide a
complete labelling on their packaging.
Consumers‟ buying behaviour was measured
through self-reported use and understanding of
food label information, when they read it and
any impact on purchasing decision. The socio-
demographic information of the respondents (age, sex, education, marital status and level of
income) was also obtained.
Method of data analysis Data entry and analysis was done using SPSS
computer package version 19. Descriptive and
inferential statistics were created and used to
define and explain the results.
A chi square (X2) statistic was used to
investigate whether distributions of categorical
variables differ from one another. It shows a quantitative measure used to determine whether
a relationship exists between two categorical
variables. The Pearson's chi-squared test was
used to assess whether the two paired
observations / variables were independent.
Results and Discussions
Socio-demographic Statistics of the Sample As displayed in table 1below, results showed
that the sample was gender sensitive (male =
57.6) with the modal age group being 15-30

Consumers’ Use and Understanding of Food Label ...
356
years (60.8%) who had never been married
(54.0%) and with a greater number who had
tertiary education (36.4%) earning between
GH¢50-499 (61.6%).
Table 1: Socio-demographics of the sample
Variable Frequency Percentage
Sex: Male
Female
144
106
57.6
42.4
Age groups: 15-30
36-45
46-60
< 60
152
74
15
9
60.8
29.6
6.0
3.6
Marital status: Single
Married
Divorced/ Separated
Widowed
135
86
15
14
54.0
34.4
6.0
5.6
Level of education: None
Basic Secondary
Tertiary
19
58 82
91
7.6
23.2 32.8
36.4
Income levels: (50-499)
(500-999)
(1000 and above)
154
72
24
61.6
28.8
9.6
Frequency and time of use of Food Label
Information
From table 2, most consumers reported reading
food labels occasionally (29.6%) with always
(22.8%), often (19.6%) and rarely (7.6%)
ranking 2nd, 3rd and 4th respectively during
initial purchase (37.2%). And 20.4% say that
they never read food labels.
Table 2: When and how often consumers refer to Food Label Information
When consumers read label Frequency Percentage (%)
Initial purchase 93 37.2
When comparing products 43 17.2
When buying some particular product 63 25.2
How often they refer to label Frequency Percentage (%)
Rarely 19 7.6
Occasionally 74 29.6
Often 49 19.6
Always 57 22.8
Total 199 79.6
Though the study indicated that, majority of the consumers use label information, they only do
this occasionally on initial purchase. This is
probable because consumers assumed they
know the product to have reached minimum
standard (MORI, 2001) or the search cost is
expensive as pointed out in the research done
by Gianfranco et al., (2006).
A cross tabulation of frequency of use of food
labels and when they are read revealed that,
consumers who report reading food labels do
that during initial purchases, always (n=31,
15.58%) These proportions are similar to the
findings from Mintel (2006) which suggest that
approximately half of food consumers from UK
read the labels on initial purchases, always‟
(32%) or usually (20%).
Consumers’ Use and Understanding of food
Labels
Results from table 3 show that about 79.6%
(n=199) of the respondents, recounted to access

Asian Journal of Agriculture and Rural Development, 2(3), pp. 351-365
357
food label information before purchase with 54.8% understanding the information somehow.
Table 3: Consumers’ use and understanding of food label information
Do you read food label? Frequency Percentage (%)
Yes 199 79.6
No 51 20.4
Do you understand what you read?
Very well 77 38.7
Somehow 109 54.8
Don‟t understand 13 6.5
Out of the 79.60% (n=199) respondent who
claimed to use label information during
purchasing any canned food, 93.3% said they
understood the information they read while
6.5% don‟t understand what even they read being it the terminology or technical terms used
or numerical gen. Among the label users
(n=186, 93.3%) who understand, 54.8% said
they understood the information somehow
while 38.7% understand it very well. This result
was different from the answers of Mahgoub et
al., (2007) that found out that majority (59.0%)
of consumers‟ in Lesotho understand food label
very well.
The kind of information consumers look out
for
Date label (99.5%) was found to be the
information consumers most seek on any
canned food. It recorded the highest score followed by ingredient (78.4%), health claim
(66.8%) and nutritional information (65.3%)
placing fourth. Information like net weight
(24.1%), producers or manufacturers (30.7%),
country of origin (47.7%) and net weight
(24.1%) were least considered.
Table 4: The kind of information consumers look out for
Multiple Response
Food Label Information Yes No
Freq. % Freq. %
Nutritional information 130 65.3 69 34.7
Health Claims 133 66.8 66 33.2
Ingredient 156 78.4 43 21.6
Expiry Date/ Use Before 198 99.5 1 0.4
Country of Origin 95 47.7 104 52.3
Net Weight 48 24.1 151 75.9
Producers /manufacturers 61 30.7 138 69.3
Instruction for use 99 49.7 100 50.3
From table 4 above, it was evident that
consumer were more interested in date label
than any other information on a labelled
package. This is mostly used to determine the
safety, freshness, wholesomeness and quality of
food products. Date label comes in the form of
manufacturing date which signifies the product was made, use by which specifies beyond
which food should not be consumed and best
before/expiry date gives an indication of quality
life span of the product. This result is similar to
the finding of Tessier et al, (2000) who reported
that date labels were the most commonly sought
information on food labels on a wide range of
food products amongst Scottish consumers. A
research by MORI 2010 also revealed that once
consumers are at home the only information
important to them is the date label. Sabbe et al., (2009) found that expiry date is commonly used
by consumers as an indication of freshness,
shelf life and food safety across a range of
foods.

Consumers’ Use and Understanding of Food Label ...
358
Other sets of general food label information that
consumers look out for during purchase are
ingredient (78.4%), health claim (66.8%) and
nutritional information (65.3%).
Results of Rodolfo 1996 also indicate that
consumers residing in Non-metro areas are
more likely to use nutritional information
concerning ingredients, sodium, vitamins/
minerals, and fibre content on food packages
than others in the sub-urban and urban areas.
Rather result from this study contrast his
findings where consumers in sub-urban and
urban areas are more concern with ingredient
and nutrition information. Net weight (24.1%) was least considered probable because similar
product might have same weight or volume but
at different prices. A research conducted by
Alice and Michelle (2006) found out that size
really does not matter to consumers.
Factors that influence consumers’ decision to
purchase a canned product
It was found out that advertisement (31.6%) and
price (31.2%) were the major factors that
influence most consumers decision to do
purchase of canned food, with food label
information ranking fourth (10.0%) after taste
(12.0%) of the product. Further details are
presented in table 5.
Table 5: Factors that influence sampled consumers decision to purchase a canned product
Determinants Frequency Percentage (%)
Price 78 31.2
Food label 25 10.0
Advertisement 79 31.6
Packaging 21 8.4
Taste 30 12.0
Product name 11 4.4
Convenience 6 2.4
Food label information is not the key informant
to consumer buying behaviour. Factors like
advertisement (31.6%) and price (31.2%) are
keys among the factors that influence consumer
decision. “Advertisement is commonly used for
judging the nutritional information”, Manisha,
(2008).
Though advertisement plays an important role
in conveying product massages, labels do much influencing consumer-decision since Labels
provide concise information. This research
finding has proved contrary to that. Many
consumers use television, screen and magazines
as a means of escape, a source of information
and as an intellectual stimulus (OCED, 2000).
Majority of the respondent were low income
earners. This could be the reason why price had
concealed other aspects of the food product,
especially food label. This however could not
be directly related to income earned by consumers but could be different consumer
perspectives and values.
Among the respondents (n=199, 79.6%) who
use food label information when making
purchasing, 37.2% were using it on initial
purchase, 17.2% when comparing products and
25.2% when buying certain kind of products.
This result suggests that food label information
is an important source of new knowledge that
aid consumers when doing some purchasing.
This shows a great tendency of consumers‟ use of food label and thus influence or change their
purchasing decision. Prathiraja and
Ariyawardana (2003) noticed that 77.8% of
their research respondent considered nutritional
information on food items as vital instrument
for purchasing decisions.
Consumer demographics and food label
information
It was hypothesized that male consumers were
less likely to use food label information during shopping than women. The guess was
precluded; since the result disclosed that male
consumers were more concerned with the use of
food label information2( 39.754, 1, 0.000)df p than their female

Asian Journal of Agriculture and Rural Development, 2(3), pp. 351-365
359
counterparts 2( 13.757, 1, 0.032)df p (details
in table 7 below). The Mintel (2006) survey
reports that women read food labels more than
men but this difference is much less when
women are compared with men who live by
themselves. This has been confirmed by the
results of the study since greater part of the male respondent were never married (39.6%)
and were living on their own.
Results from table 7 also revealed that youthful
(31- 45) consumers, ( 2 21.863, 6, 0.002df p )
and consumer who were had never been
married ( 2 20.238, 6, 0.006df p ) were also
apt to refer food label information before
purchase.
Findings from Nayga (2003), suggest that income and age are positively related to diet
quality regardless of label use, and that people
with at least some college education have a
higher Healthy Eating Index than people with
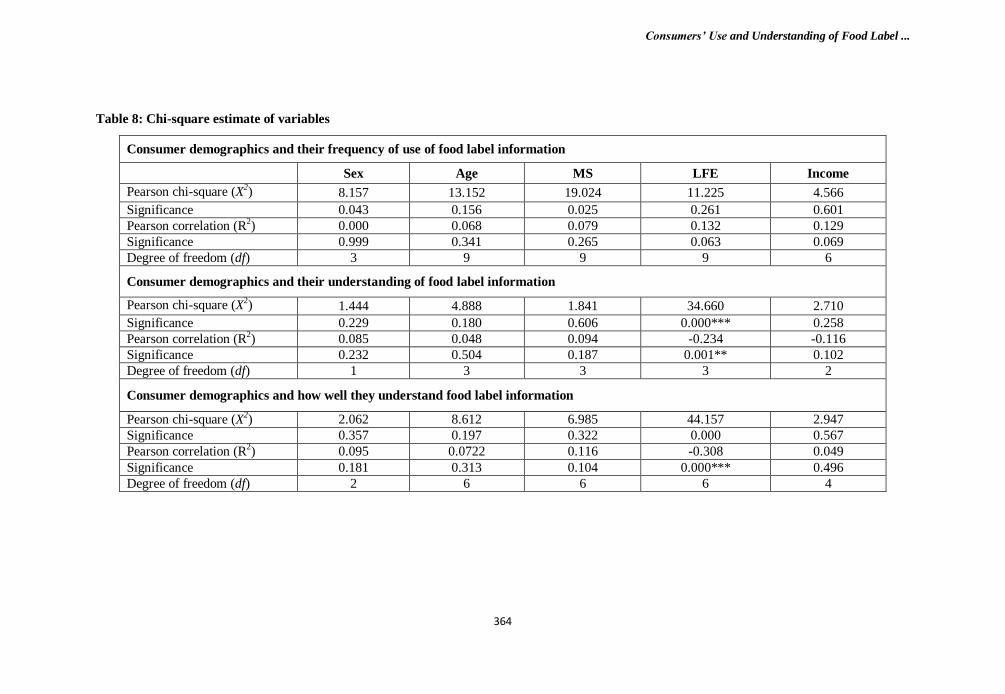
no college education. Contrarily, consumers‟
income levels has no significant influence on
their use ( 2 4.566, 6, 0.601df p ) or
understanding of food label (2 2.710, 2, 0.258df p ) neither does it have
any influence on their purchasing decision (2 10.017, 4, 0.040df p ) but level of formal
education 2( 29.870, 6, 0.000)df p ) has a
positive association with making better choices
(results presented in table 8).
Those with high income displayed different
attitudes to those with lower income in terms of
the perceived options available to them.
Consumers in lower paid jobs paid more
attention to special price offers, and thus
respectively paid less attention to food labeling
directly‟‟, MORI (2010).
Consumers with tertiary education (2 17.602, 6, 0.007df p ) as well as basic
education 2( 19.250, 6, 0.004)df p ) were more
disposed to turn to food label information
before purchase, (refer to table 7 for more
details).
Though highly educated consumers (34.0%)
were likely to refer to food label
2( 17.602, , 0.007,df p table 5.2.1) than
those with secondary (26.8%), basic (18%) and
no education (0.8), results has shown a negative
correlation with consumers use (R2=- 0.418,
p=0.000) and understanding of food label
information (R2=- 0.308, p=0.000) as well as
their purchasing decision (R2=- 0.275,
p=0.000), table 7.
The use and understanding of food label,
effect on purchasing decision
There a significant likelihood that when
consumer read food label, it will influence their decision to purchase a canned food product (
249.754, 3, 0.000LR df p ). Therefore
consumers‟ use of label has a significant
influence on purchasing decision2( 249.754, 3, 0.000)df p . Also a
positive relationship exist between understand
and how well they understood what information
they read (R2= 0.592, p = 0.000). Again there is
a positive relation between understanding and
choosing among alternatives or making better
choices (R2=0.215, p = 0.002). Furthermore the
level of understanding of food label has a
significant influence on consumer purchasing
decision ( 2 18.093, 4, 0.001df p ) and
positive correlation (R2=0.266, p = 0.000).
Details of results in table 7 and 8 at the
appendix.
Association between consumers’ use of food
label and their demographic variables and
the type of information sought
Both males (59.3%) and female (38.1%)
consumers aged between 31-45 years (47.2%)
whether married (33.2%) or not (66.3), have
high education (42.2%) or not (1.0%) earning
between GH¢50-999 (71.2%) were most
interested in date label. This contrast with those
aged from 46 years (75.9%) who were more
interest in the health claims on the label
provided on any canned food. Meanwhile those between 15-35 years (51.3%) were also
concerned with instructions on how the product
will be used. But those earning above GH¢1000
(21.6%) were much in involved in the origin of
the product.

Consumers’ Use and Understanding of Food Label ...
360
Table 6: consumers’ socio-demographics and the kind of information sought Consumer
demographics NI (%) HC (%) In (%) ED (%) CO (%) MC (%) NW (%) P/M (%) IU (%)
Y N Y N Y N Y N Y N Y N Y N Y N Y N
Sex Male
Female
44.7
20.6
18.1
17.1
42.2
24.6
13.6
19.6
46.7
31.7
6.5
15.1
59.3
38.1
-
0.5
29.1
18.6
32.7
21.1
16.1
8.0
45.7
30.1
19.6
11.1
42.2
27.1
34.7
15.1
27.1
23.1
48.2
31.6
13.6
6.0
Age 15-30
31-45
46-60
> 60
7.5
32.7
6.0
1.0
34.4
12.5
27.2
0.5
12.6
22.6
33.7
42.2
14.4
19.1
12.1
11.1
7.0
46.2
23.7
22.6
38.6
20.0
19.1
16.1
2.5
47.2
5.5
2.0
-
-
-
0.5
17.0
30.6
2.5
-
0.5
17.1
11.1
-
1.0
30.2
18.1
0.5
15.6
12.1
12.0
11.1
-
28.1
27.1
14.1
1.5
14.6
12.1
8.0
11.6
7.0
9.0
-
22.6
30.6
18.6
4.5
51.3
12.6
30.4
26.1
1.5
24.6
16.1
9.0
MS Single
Married
46.7
18.6
20.1
14.6
48.2
18.6
18.6
14.6
52.3
26.1
14.6
7.0
66.3
33.2
0.5
-
30.6
17.1
36.2
16.1
15.6
8.5
51.3
24.6
20.6
10.1
46.2
23.1
34.7
16.1
34.2
17.1
55.3
24.6
11.6
7.5
LFE none
Basic
Secondary
Tertiary
0.5
11.6
21.1
32.2
0.5
11.1
12.1
11.1
0.5
12.0
21.1
33.4
1.0
22.6
19.1
30.2
0.5
15.6
28.6
34.2
0.5
7.0
5.0
9.0
1.0
22.6
33.7
42.2
-
-
-
0.5
-
10.1
19.1
18.6
1.5
12.6
14.6
24.6
-
4.5
7.0
12.6
1.0
18.1
26.6
30.2
-
5.0
12.1
14.1
1.0
17.6
22.1
28.6
-
8.0
14.6
27.1
1.0
14.6
18.6
16.1
0.5
14.1
28.1
37.2
0.5
8.5
5.1
5.5
IL: 50-499
500-999
>1000
30.4
20.0
9.8
16.8
12.4
2.4
31.6
14.0
6.0
14.4
10.8
0.8
36.4
21.6
6.4
9.6
4.4
2.4
46.8
24.4
8.8
0.5
-
-
5.2
14.5
21.6
24.4
13.2
4.6
10.0
4.8
4.8
36.8
20.0
4.8
12.4
8.0
2.4
6.4
15.6
32.3
23.2
12.0
5.6
28.8
14.0
2.8
36.4
17.6
8.0
7.2
6.8
0.8
LFE = Level of Formal Education, IL = Income Level, NI= Nutritional Information, Y = Yes HC = Health Claims, In = Ingredient, ED = Expiry Date, CO= Country of Origin, NW = Net Weight N = No, MC = Minimum Concentration, P/M = Producers /manufacturers, IU = Instruction for Use
Though some relationships were observed on
consumer demographics and their use of food
label, it does not affect their buying behaviour.
Result from table showed that low income has a
significant 2( 13.937, 4, 0.007)df p
relationship with purchasing decision, table 9.
This could be as a result of majority of
consumers within the youthful years with high
education been in that category.
Studies have shown that aging consumers are
more interested in their health and well-being.
This could probable account for the result
pointing out that consumers aged from 46 years
(75.9%) were more interested in the health
claims than the other information provided.
Research by Umberger et al. (2003) reveals that
the surveyed consumers in Chicago and Denver
were willing to pay a premium for Country-of-Origin Labelling. This could be revealed in why
higher income earners would ascertain a
product by its country of origin.
„„Price can eclipse other aspects of the label,
especially for lower income consumers. Those
with high income displayed different attitudes
to those with lower income in terms of the
perceived options available to them. Consumers in lower paid jobs paid more attention to special
price offers, and thus respectively paid less
attention to food labelling directly”, MORI
(2010).
Conclusions and Recommendations
The aims of the study were to find out the use
and understanding of food label information
and its impact on purchasing decision among
consumers in the Kumasi metropolis. The
results showed there is some awareness food label usage among consumers. Though they
somehow understand what they read, it is not
the main determinant of purchasing decision.
Advertisement and prices were seen to the key
factors that influence purchasing decision. This
might be as a result of majority of the
respondent been among the low income earners.
Since firms spend considerable amount of
money on product labels, it important for them
to know the way labels influence purchasing
decision especially for young consumers. They
should therefore conduct research periodically to know how consumers perceive the label they
read and those of keen interest in order to
elaborate them.
It was also found out that most consumers are
not aware that information provided on food
packages are renewed periodically therefore
they only refer to labels occasionally during
initial purchase. This could make consumers
easily switch from one product to the other
since they might not be aware that an old product might have received value addition.
Therefore educating consumers about the
importance of food label.

Asian Journal of Agriculture and Rural Development, 2(3), pp. 351-365
361
It would be very useful to determine the use of
the label on a much wider scale among a bigger,
more demonstrative section of the Ashanti
Region that will compare the use of food label
information among rural and urban consumers.
Individual features of food label information
can be researched individually to find their
influence and impact on consumer purchasing
decision as well as how consumers the
information they read.
Implications for this study are that it will
manufacturers know what consumers are
interested in and therefore focus that information to attract consumers. Again
regulatory bodies being government agencies
can in turn inform the public on the importance
of food label knowing the percentage of the
population that read label information.
Furthermore, this study will prompt the
awareness of food label information among
consumers, thereby demanding more
information on the products they consume. This
will compel manufacturing firms to provide the
right information to meet the demand of consumers as well as enhancing the work of
regulatory bodies knowing that consumers are
much interested in product information. This
study will also add to knowledge by serving as
secondary information to studies revolving
around the same topic.
References
Alice, L. and Michelle, K. (2006) “The Power
of Packaging: The Customer Equity Company”, http://www.scribd.com/doc/91807833/The-
Power-of-Packaging (accessed on August 28,
2011). Allen L. P., Wayne W. C., John E. D. Jr. and
John W. M. (2001) “Patients‟ Understanding
and Use of Snack Food Package Nutrition
Labels”, Journal of the American of Family Medicine, Vol. 17(5). pp. 319-323.
American Dietetic association (1995) “Nutrition trend survey”, Executive summary
conducted by Wirthlin Group for the American
DieteticAssociation.
http://www.eatright.org/adapospb.html
(accessed on 29 January, 2012)
Banterle, A. and Stranieri, S. (2008) “Information, Labelling, and Vertical
Coordination: An Analysis of the Italian Meat
Supply Networks”, Agribusiness, Vol. 24(3),
pp. 320-31
Beatty, S. E. and Smith, S. M. (1987) “External Search Effort: An Investigation
across Several Product Categories”, Journal for Consumer Z/Es, Vol. 14, pp. 83–95.
Becker, G. S. (1977) “The Economic Approach
to Human Behaviour”. Chicago: University Of
Chicago Press.
Beus, C. and Dunlap R. (1992) “Understanding Public Concerns about
Pesticides: An Empirical Examination”,
Journal of Consumer Affairs, Vol. 25, pp. 260-
275.
Caswell, J. A. and Padberg D. I. (1999)
“Toward a More Comprehensive Theory of
Food Labels”, American Journal of Agricultural Economics, Vol. 74, pp. 460-468.
Charles, G. (2002) “Costs versus consciences.
Marketing Week”, London: 22-25
Constitution of Ghana (1992) L.I.1541. Ghana
Standards Board (Food, Drugs and other goods)
general labeling rules, subsection (1) of section
9
Constitution of Ghana (1992) P. N.D.C.L
305B section 47(b) (ii) of the Food and Drugs
Law.
Dickson, P. R. (1994) “Marketing Management”, Forth Worth (TX) The Dryden
Press.
European Commission, Directorate-General
for Health and Consumer Protection (2005) “The European Consumers‟ Attitude Regarding
Food Labelling”, Qualitative Study Regarding
28EuropeanCountries
http://ec.europa.eu/consumers/topics/labelling_r
eport_en.pdf (accessed on 2 July, 2011)
Gellynck, X., Verbeke, W. and Vermeire, B.
(2006) “Pathways to increase consumer trust in
meat as a safe and wholesome food”, Meat Science, Vol. 74(1), pp. 161-171.
Ghana Food and Drugs Board (2006) Guidelines for Making Health Claims on Food.
FDB GL05/HCF/01-2006.
www.fdbghana.gov.gh/pdf/downloads/guidelin
es-food/GUIDELINES FOR MAKING
HEALTH CLAIMS ON FOOD.pdf (accessed
on July 1, 2011)
Gianfranco W., Thorsten H-T, Vincent-
Wayne M. (2006) “Consumer Confusion
Proneness: Scale Development Validation and

Consumers’ Use and Understanding of Food Label ...
362
Application”, Journal of Marketing
Management. pp. 1-32.
Govindasamy, R. and Italia J. (1999) “Evaluating Consumer Usage of Nutritional
Labelling: The Influence of Socio-Economic
Characteristics”, Journal of Nutritional Education, Vol. 4, pp. 370-375.
Grossman, M. (1972) “On the Concept of
Health Capital and Demand for Health”,
Journal for Political Economics, Vol. 80, pp.
223-255.
Guthrie, J. F., Jonathan, J. F., Linda, E. C.
N., and Susan, W. (1995) “Who Uses
Nutritional Labelling, and What Effect Does
Label Use Have On Diet Quality?” Journal of
Nutritional Education, Vol. 27(4), pp. 163-172.
Henneberry, S. R., and Armbruster, W. A.
(2003) “Emerging Roles for Food Labels: Inform, Protect, Persuade” Journal of Food
Distribution Research, Vol. 34, pp. 62-69.
Héroux, L., Laroche, M. and McGown, K. L.
(1988) “Consumer Product Label Information
Processing: An Experiment Involving Time
Pressure and Distraction”, Journal of Economic
Psychology, Vol. 4, pp. 263-272.
Hoback, J. (2008) “Inside the mind of the
consumer”, Natural Foods Merchandiser, Vol.
29, pp. 5-18.
Hu, W., Adamowicz, W. L. and Veeman, M. M. (2006) “Labelling Context and Reference
Point Effects In Models Of Food Attribute
Demand”, American Journal of Agricultural
Economics, Vol. 88(4), pp. 1034-49
Jugger, S., (1999) “The Power of Packaging”,
Ad map Magazine.
Kasapila, W., and Shawa, P. (2011) “Use and
Understanding of Nutrition Labels among
Consumers in Lilongwe (Malawi)”, African
Journal Of Food, Agriculture, Nutrition and
Development, Vol. 11(5), pp. 5171-5186.
Katona, G. C. and Mueller, E. (1995) “A Study of Purchase Decisions” in Consumer
Behaviour: The Dynamics of Consumer
Reactions”, Cd., L.H. Clark, pp. 30–87. New
York: New York University Press.
Lunardo R. and Richard G. (2007) “The
Influence of Label on Wine Consumption: Its
Effects on Young Consumers‟ Perception Of
Authenticity And Purchasing Behaviour,
Bologna”, Italy. [email protected]
(accessed on 5 July, 2011)
Mahgoub S. E., Lesoli, P. P., and Gobotswang, K. (2007) “Awareness and Use
of Nutrition Information on Food Packages
among Consumers in Maseru” (Lesotho)
African Journal, Of Food, Agriculture,
Nutrition and Development, Vol. 7(6), pp. 1-16.
Manisha, S., (2008) “Usage and Understanding
of Food and Nutritional Labels among Indian Consumers”, Indian Institute of Management
Calcutta, Kolkata, India
www.emeraldinsight.com (accessed on 4
February, 2012)
Ministry of Agriculture, Food and Fisheries
(MAFF) (1994) “The Dietary and Nutritional
Survey of British Adults – Further Analysis”.
HMSO, London. http://www.food.gov.uk
(accessed on 15 September, 2011)
Mintel, (2006) “Food Packaging, UK, Mintel
International”, London. www.mintel.com
(accessed on 10 January, 2012) MORI (2010) “Qualitative Research to Explore
Peoples‟ Use of Food Labelling Information”
Executive Summary Social Science Research
Unit Food Standards Agency Unit Summary 5.
http://www.ipsos-mori.com (accessed on 4
October, 2011)
Nayga, R. M. (2003) “Nutritional Labels,
Health Claims and Consumers‟ Diets”, Paper
Presented At AAEA Food & Agricultural
Marketing Policy Section Conference Emerging
Roles For Food Labels: Inform, Protect, Persuade. Washington, D. C., March 20–21
Nayga, R. M. (1997) “Impact of Socio-
Demographic Factors on Perceived Importance
of Nutrition in Food Shopping”, Journal of
Consumer Affairs, Vol. 31(1), pp. 1-9.
OECD (2001) “Expect Workshop On
Information And Consumer Decision-Making
For Sustainable Consumption: Programme On
Sustainable Consumption”. OECD
Headquarters, Paris.
Padel, S. and Foster, C. (2005) “Exploring the
gap between attitudes and behaviour: Understanding why consumers buy or do not
buy organic food”, British Food Journal, Vol.
107(8), pp. 606-625.
Park, C. W., Iyer, E. S. and Smith, D. C.
(1989) “The Effects Of Situational Factors On
In-Store Grocery Shopping Behaviour: The
Role Of Store Environment And Time
Available For Shopping”, Journal Consumer
Resource, Vol. 15, pp. 422–433.
Philip D., Kristen M. and Emma F. (2010) “Public Attitudes Towards, And Use Of, General Food Labelling”, Social Science

Asian Journal of Agriculture and Rural Development, 2(3), pp. 351-365
363
Research Unit Food Standards Agency Unit
Report 4
Pires G. and Ricardo, C. (2008) “Product
Characteristics and Quality Perception,
University at Aut`Onoma De Barcelona”.
http://mpra.ub.uni-muenchen.de/11142/ (accessed on 1 August, 2011)
Prathiraja, P. H. K. and Ariyawardana, A.
(2003) “Impact of Nutritional Labelling On
Consumer Buying Behavior”, Sri Lankan
Journal of Agricultural Economics, Vol. 5(1),
pp. 35-46.
Putler, D. S. and Frazao, E. (1994) “Consumer Awareness of Diet-Disease
Relationships and Dietary Behaviour: The Case
of Dietary Fat”, Journal for Agricultural
Economics Resource, Vol. 45, pp. 3–17.
Rice B. J. and Hofmeyr R. (2000) “Commitment-led Marketing: The key to Brand
Profits is in the Consumer‟s mind”, Juta and
Company Ltd, pp 301
Rita K., Aistė D., and Laura N. (2009)
“Impact of Package Elements on Consumer
Purchase”, Economics and Management, Vol.
14, pp. 441-447.
Rodolfo, M. N. Jr. (1996) “Determinants of
Consumers‟ Use of Nutritional Information on
Food Packages”, Journal of Agricultural and
Applied Economics, Vol. 28(2), pp. 303–312. Rundh, B. (2005) “The Multi-Faceted
Dimension of Packaging”, British Food
Journal, Vol. 107(9), pp. 670-684.
Sabbe, S., Verbeke, W. and Van, D. (2009) “Perceived Motives, Barriers and Role of
Labelling Information on Tropical Fruit
Consumption: Exploratory Findings”, Journal
of Food Products Marketing, Vol. 15(2), pp.
119-138.
Schultz, T. W. (1975) “The Value of the
Ability to Deal with Disequilibria”, Journal for
Economics Literature, Vol. 13, pp. 827–846.
Silayoi, P., and Speece, M. (2004) “Packaging and purchase decisions: An exploratory
study on the impact of involvement level and
time pressure”, British Food Journal, Vol.
106(8), pp. 607-628.
Smith J. S. Hui H. Y. (2004) “Food
Processing; Principles And Applications”,
Blackwell Publishing 1st Ed.
Tessier S, Edwards, C.A., Morris, S.E. (2000) “Use and knowledge of food labels of shoppers
in a city a high proportion of heart disease”,
Consumer Studies & Home Economics, Vol.
24(1), pp. 35–40.
Umberger, W., Feuz, D. M., Calkins, C. R.
and Sitz, B. M. (2003) “Country-of-Origin
Labelling of Beef Products: U.S. Consumers‟
Perceptions”, Paper Presented at AAEA Food
and Agricultural Marketing Policy Section
Conference Emerging Roles for Food Labels:
Inform, Protect, Persuade. Washington, D. C.,
March 20–21
Underwood, R. L., Klein, N. M., & Burke, R.
B. (2001)”Packaging Communication:
Attentional Effects of Product Imagery”, The Journal of Product and Brand Management,
Vol. 10(7), pp. 1-19
Wier, M., O'Doherty Jensen, K., Andersen,
L. and Millock, K. (2008) “The Character of
Demand in Mature Organic Food Markets:
Great Britain and Denmark Compared”, Food
Policy, Vol. 33(5), pp. 406-421.


Asian Journal of Agriculture and Rural Development, 2(3), pp. 351-365
363
Appendix
Chi-square estimate of variables
Table 7: Chi-square estimate of variables
Measure of Consumers’ understanding and demographics
Level of
understanding Sex Age Marital Status Level of Formal Education Income Level
Male Female 15-30 31-45 46-
60 >60
Not
married Married Divorced widowed none Basic Sec. Ter. 50-499 500-999 <1000
Pearson chi-
square (x2)
123 76 132 56
118 66 9 6
45 67 85 115 62
Significance 0.000*** 0.000*** 0.000*** 0.000***
0.000*** 0.000*** 0.011 0.014
0.000*** 0.000*** 0.000*** 0.000*** 0.000***
Pearson
correlation
(R2)
0.54 0.653 0.5 0.707
0.547 0.62 0.746 1
0.73 0.441 0.497 0.648 0.531
Significance 0.000*** 0.000*** 0.000*** 0.000***
0.000*** 0.000*** 0.021 0.000***
0.000*** 0.000*** 0.000*** 0.000*** 0.000***
Degree of
freedom (df) 2 2 2 2
2 2 2 1
2 2 2 2 2
Frequency of use of food label information, level of understanding and consumer demographics
Pearson chi-
square (x2)
39.8 13.76 13 21.2 0.6 5 17.991 20.2 5.8 2.4
19.3 11.65 17.602 34.514 6.113 0.725
Significance 0.000*** 0.032 0 0.002** 0.7 0.08 0.082 0.006* 0.215 0.212
0.004** 0.07 0.007** 0.000*** 0.411 0.696
Pearson
correlation
(R2)
-0.27 -0.39 -0 -0.44 0 -0.2 -0.28 -0.4 -0.44 -0.63
-0.34 -0.26 -0.292 -0.393 -0.22 -
0.066
Significance 0.002** 0.000*** 0.002** 0.001*** 1 0.72 0.002** 0.003*** 0.241 0.178
0.02 0.033 0.007** 0.000*** 0.089 0.77
Degree of
freedom (df) 1 1 6 6 2 2 6 6 4 1
6 6 6 6 6 2
Consumers’ Use and Understanding of Food Label ...
364
Table 8: Chi-square estimate of variables
Consumer demographics and their frequency of use of food label information
Sex Age MS LFE Income
Pearson chi-square (X2) 8.157 13.152 19.024 11.225 4.566
Significance 0.043 0.156 0.025 0.261 0.601
Pearson correlation (R2) 0.000 0.068 0.079 0.132 0.129
Significance 0.999 0.341 0.265 0.063 0.069
Degree of freedom (df) 3 9 9 9 6
Consumer demographics and their understanding of food label information
Pearson chi-square (X2) 1.444 4.888 1.841 34.660 2.710
Significance 0.229 0.180 0.606 0.000*** 0.258
Pearson correlation (R2) 0.085 0.048 0.094 -0.234 -0.116
Significance 0.232 0.504 0.187 0.001** 0.102
Degree of freedom (df) 1 3 3 3 2
Consumer demographics and how well they understand food label information
Pearson chi-square (X2) 2.062 8.612 6.985 44.157 2.947
Significance 0.357 0.197 0.322 0.000 0.567
Pearson correlation (R2) 0.095 0.0722 0.116 -0.308 0.049
Significance 0.181 0.313 0.104 0.000*** 0.496
Degree of freedom (df) 2 6 6 6 4

Asian Journal of Agriculture and Rural Development, 2(3), pp. 351-365
365
Table 9: Chi-square estimate of variables
Consumers’ level of understanding and their demographics; effect on purchasing decision
Sex Age Marital Status Level of Formal Education Income Levels (GH¢)
Male
Female
15-30
31-45
46-
60
>60
Never
married
Married
Divorced/
separated
Widowed
None
Basic
Sec.
Ter.
50-499
500-
999
>1000
Pearson
chi-square
(X2)
10.324
7.775
9.51
10.431
0.240
0.139
9.993
6.025
4.371
0.600
-
5.618
4.973
6.438
13.937
2.957
3.454
Significance 0.035 0.100 0.060 0.034 0.624 0.709 0.041 0.197 0.112 0.439 - 0.230 0.290 0.169 0.007* 0.565 0.178
Pearson
correlation
(R2)
0.236
0.293
0.238
0.390
0.200
0.167
0.272
0.209
0.347
0.316
-
0.275
0.163
0.227
0.311
0.169
0.295
Significance 0.009* 0.010 0.006* 0.003** 0.704 0.789 0.003** 0.092 0.360 0.541 - 0.068 0.187 0.036 0.001*** 0.189 0.183
Likelihood
Ratio (LR)
12.476
10.382
11.267
13.030
0.403
0.138
12.236
8.109
4.531
0.908
-
7.876
5.691
7.427
17.820
4.087
4.541
Significance 0.014 0.034 0.024 0.011 0.526 0.710 0.016 0.088 0.104 0.341 - 0.096 0.223 0.115 0.001*** 0.394 0.103
Degree of
freedom
(df)
4
4
4
4
1
1
4
4
2
1
-
4
4
4
4
4
2