consumption-based accounting of global anthropogenic ch4
TRANSCRIPT

This article has been accepted for publication and undergone full peer review but has not been through the copyediting, typesetting, pagination and proofreading process which may lead to differences between this version and the Version of Record. Please cite this article as doi: 10.1029/2018EF000917
© 2018 American Geophysical Union. All rights reserved.
Consumption-based accounting of global anthropogenic CH4 emissions
Bo Zhang 1,2,3
, Xueli Zhao 1, Xiaofang Wu
4, Mengyao Han
5, ChengHe Guan
3,6, Shaojie
Song 3
1 School of Management, China University of Mining & Technology (Beijing), Beijing 100083, P.R. China
2 State Key Laboratory of Coal Resources and Safe Mining, China University of Mining & Technology (Beijing),
Beijing 100083, P.R. China
3 Harvard China Project, School of Engineering and Applied Sciences, Harvard University, MA 02138, United
States
4 Economics School, Zhongnan University of Economics and Law, Wuhan 430073, P.R. China
5 Institute of Geographic Sciences and Natural Resources Research, Chinese Academy of Sciences, Beijing
100101, PR China
6 Department of Urban Planning and Design, Graduate School of Design, Harvard University, MA 02138,
United States
Corresponding authors: Bo Zhang ([email protected]); ChengHe Guan
Key Points:
We identify the impacts of final demand and international trade on global anthropogenic
CH4 emissions.
We quantify consumption-based CH4 inventories of 181 countries/regions and 19
integrative economies.
49.5% of global CH4 emissions in 2012 were associated with international trade, of
which 77.8% were from intermediate trade.

© 2018 American Geophysical Union. All rights reserved.
Abstract
Global anthropogenic CH4 emissions have witnessed a rapid increase in the last decade.
However, how this increase is connected with its socioeconomic drivers has not yet been
explored. In this paper, we highlight the impacts of final demand and international trade on
global anthropogenic CH4 emissions based on the consumption-based accounting principle.
We find that household consumption was the largest final demand category, followed by fixed
capital formation and government consumption. The position and function of nations and
major economies to act on the structure and spatial patterns of global CH4 emissions were
systematically clarified. Substantial geographic shifts of CH4 emissions during 2000-2012
revealed the prominent impact of international trade. In 2012, about half of global CH4
emissions were embodied in international trade, of which 77.8% were from intermediate
trade and 22.2% from final trade. Mainland China was the largest exporter of embodied CH4
emissions, while the USA was the largest importer. Developed economies such as Western
Europe, the USA and Japan were major net receivers of embodied emission transfer, mainly
from developing countries. CH4 emission footprints of nations were closely related to their
human development indexes (HDIs) and per capita gross domestic products (GDPs). Our
findings could help to improve current understanding of global anthropogenic CH4 emission
increases, and to pinpoint regional and sectoral hotspots for possible emission mitigation in
the entire supply chains from production to consumption.
Keywords: Anthropogenic CH4 emissions; Consumption-based accounting; International
trade; Multi-regional input-output analysis; Global supply chains

© 2018 American Geophysical Union. All rights reserved.
1. Introduction
Methane (CH4), the second largest greenhouse gas (GHG), has a global warming potential
(GWP) 28 times greater than that of carbon dioxide (CO2) over a 100-year time horizon
(IPCC, 2014). Small changes in the atmospheric CH4 concentration could have significant
impacts on climate and environment (Saunois et al., 2016b). Over the past 250 years, CH4
concentration in the global atmosphere has more than doubled (1845±2 ppb in 2015),
responsible for about one fifth of global warming (WMO, 2016). The growth of CH4 levels in
the atmosphere is highly related with increasing emissions from human activities (Montzka et
al., 2011; Kirschke et al., 2013; Ghosh et al., 2015; Dalsøren et al., 2016; Hausmann et al.,
2016; Nisbet et al., 2016). Saunois et al. (2016a) reported that global total CH4 emissions
were estimated at 558 Tg/yr, of which about 60% were originated from anthropogenic
sources such as agricultural production and fossil fuel extraction. Recent bottom-up
inventories have shown the rapid rise in anthropogenic CH4 emissions since 2000 (Rice et al.,
2016; Saunois et al., 2016a; Höglund-Isaksson, 2017; Janssens-Maenhout et al., 2017; Olivier
et al., 2017), especially in some developing countries such as China. To reduce the
uncertainties in future climate projections, world-wide researchers have focused on the
inventories of CH4 emissions and corresponding mitigation strategies at various scales from
regional to global (e.g., Schaefer et al., 2016; Schwietzke et al., 2016; Crill and Thornton,
2017; Zhang et al., 2018).
Measuring a country’s CH4 emissions is critical to mitigate GHG emissions and combat
climate change. There are two accounting methods of measuring GHG emissions:
production-based or consumption-based (Peters, 2008). Production-based emission

© 2018 American Geophysical Union. All rights reserved.
accounting (PBA) represents the on-site emissions within national territory (sometimes
referred to as territorial-based) preferred by the UNFCCC. Existing studies whether regarding
national, regional and sectoral CH4 emissions are all in the scope of PBA circumstance (e.g.,
Zhang et al., 2014a; Hopkins et al., 2016; Höglund-Isaksson, 2017; Janssens-Maenhout et al.,
2017; Du et al., 2018). But GHG emissions from various industrial sectors are induced by
economic behaviors (Oliveira and Bourscheidt, 2017). Identification of production-side
characteristics alone is insufficient to comprehend the inducements of anthropogenic CH4
emissions and relevant mitigation potentials. Researches should examine how
production-side CH4 emissions from economic activities are influenced by the
consumption-side demands. For that reason, consumption-based emission accounting (CBA)
method re-attributes the emissions produced by industrial sectors to the final demand of
consumers as embodied emissions related to consumed goods, and therefore the final
consumers can be allocated corresponding emission responsibility. Consumption-based
national CH4 emissions, which represent the embodied CH4 emissions or CH4 footprint,
encompass those emissions from domestic final consumption and those emissions related to
the production of its imports in the exporting countries. Key advantages of CBA method
include but not limited to “incorporating embodied emissions, extending emission mitigation
options, covering more global emissions through increased participation, and inherently
encompassing policies such as the Clean Development Mechanism (CDM)” (Peters, 2008;
Poortinga et al., 2012; IPCC, 2014; Fan et al., 2016). Therefore, it is essential to understand
global anthropogenic CH4 emissions from a consumption perspective and quantify
consumption-based CH4 inventories.

© 2018 American Geophysical Union. All rights reserved.
Input-output analysis is an effective tool to reflect the quantitative dependency between all
production links in economic sectors. By using the input-output models, environmental
emissions caused by the intermediate production and final consumption throughout the
supply chain can be attributed to end users (Moran and Kanemoto, 2016; Wu et al., 2018).
While a multi-regional input-output (MRIO) model that interconnects multiple regions
reflects the interregional and intraregional economic connection (Zhang et al., 2014b, 2016),
the global MRIO modelling can provide a robust assessment on the demand-driven resource
use and environmental emissions in the production and trade network of the world economy.
Extensive studies have been conducted on the global MRIO analyses of resource and
emission requirements associated with production, consumption and international trade, such
as water (Feng et al., 2011; Chen and Chen, 2013; Lenzen et al., 2013a; Ali, 2017; Han et al.,
2018), energy (Chen and Wu, 2017; Chen et al., 2018b), materials (Wiedmann et al., 2013;
Tian et al., 2017), land (Chen and Han, 2015; Chen et al., 2018a; Wu et al., 2018),
biodiversity (Lenzen et al., 2012b), CO2 (Davis and Caldeira, 2010; Tian et al., 2015;
Andreoni and Galmarini, 2016; Fan et al., 2016; Malik et al., 2016; Jiang and Green, 2017;
Pablo-Romero and Sánchez-Braza, 2017; Liddle, 2018), air pollutants (Kanemoto et al., 2014;
Lin et al., 2014, 2016; Meng et al., 2016; Zhang et al., 2017), etc. At present, MRIO account
and analysis has become a popular approach to measure and assess consumption-based global
GHG emissions (e.g., Peters, 2008; Arto and Dietzenbacher, 2014; Caro et al., 2017).
Since international trade plays a key role in global geographic shifts of environmental
burdens such as carbon leakage, the environmental indicators most often examined are CO2
emissions and air pollutants embodied in international trade (e.g., Peters and Hertwich, 2008;

© 2018 American Geophysical Union. All rights reserved.
Hertwich and Peters, 2009; Deng and Xu, 2017; Jiang and Guan, 2017). For instance, Peters
et al. (2011) reported that the CO2 emissions from the production of traded goods and
services had increased from 20% of global emissions in 1990 (4.3 Gt) to 26% in 2008 (7.8
Gt). Lenzen et al. (2012b) discovered that about 30% of the biodiversity around the world
was caused by international trade. Liang et al. (2015) reported that 37% of the mercury
emissions in the atmosphere could be attributed to international trade. Oita et al. (2016) found
that approximately 1/4 of global nitrogen emissions was embodied in the products of
international trade. Previous studies have indicated that international trade has significantly
affected the reallocation of industrial distribution and related environmental impacts, and the
net embodied transfers of resources and emissions via international trade were identified from
developing to developed countries. However, consumption-based global CH4 accounting and
trade-related emission transfers attract little attention (Kanemoto et al., 2016), due to
inadequate CH4 inventories at the global scale. Some researchers calculated the CH4
emissions embodied in the international trade of agricultural products (e.g., meats) (Caro et
al., 2014), but failed to integrate a comprehensive trade relationships into the global MRIO
modeling. It necessitates further exploration of the embodied CH4 emissions associated with
goods exchange among nations, including the mechanism whereby the final demand acts on
the production and trade distribution across the world.
To fill this gap, this paper makes the first attempt to perform a consumption-based
accounting of global anthropogenic CH4 emissions, based on the latest emission inventories
from the Emissions Database for Global Atmospheric Research (EDGAR) and the available
global MRIO tables from the EORA database. By linking CH4 emissions to the economic

© 2018 American Geophysical Union. All rights reserved.
production, trade and final consumption along the supply chains, the characteristics of global
consumption-side CH4 emissions in the socio-economic context are explored. We identify
how the spatial distribution of CH4 emissions around the world could be affected by
intermediate trade and final trade activities. Critical industrial sectors and regions in global
consumption and trade are revealed for emission mitigation. The results probe into the impact
of final demand and international trade on the structure of global CH4 emissions.
The remainder of this paper is organized as follows. In Section 2, the global MRIO table,
algorithms for MRIO analysis and data sources are introduced. In Section 3, the results of
embodied CH4 emissions in final demand and international trade in 2012 are presented. We
also analyze the evolution of consumption-based emission inventories over 2000-2012 in this
section. Implications of consumption-based emission accounting are further discussed in
Section 4. Concluding remarks will be made in the ending section.
2. Methodology and data
2.1. Global MRIO table
The global MRIO tables describe the economic relationships between producers and
consumers within the globalized world economy (Lenzen et al., 2012a). Multiple
organizations have prepared the global MRIO tables covering multiple regions of the world.
These include the Global Trade Analysis Project (GTAP) database by Purdue University, the
input-output database by the Organization for Economic Co-operation and Development
(OECD), the EXIOPOL database by the European Union, the WIOD database by University
of Groningen, and the EORA database by University of Sydney (Malik et al., 2016). Among

© 2018 American Geophysical Union. All rights reserved.
these databases, the EORA MRIO table covers the most regions and the longest time spans
(Lenzen et al., 2012a, 2013b). A large number of studies have been conducted on embodied
resources and emissions in international trade based on the global MRIO table from the
EORA database (e.g., Malik et al., 2016; Oita et al., 2016; Li et al., 2017; Xia et al., 2017;
Chen et al., 2018a,b; Wu and Chen, 2018). In this study, the EORA database is also adopted
to build the global MRIO tables for 2000-2012, which cover 189 countries/regions.
Figure 1 displays the basic framework of a global MRIO table. The economic linkage
along supply chains refers to the input (intermediate input and value-added) and the output
(intermediate production/use and final consumption/use). The total input of a production
sector is equal to its total output. In the input-output accounts, the principal measure of
economic output is the total output, which refers to the value of intermediate production plus
final consumption. The intermediate production represents the processing of intermediate
goods, including primary and other raw materials, for final consumption. The final
consumption or final demands include household consumption, non-profit consumption,
government consumption, fixed capital formation, inventory increase and acquisitions of
valuables (Lenzen et al., 2012a).
The trade of goods and services for intermediate production (intermediate trade) and for
final consumption (final trade) are two basic components of international trade in the global
MRIO table. The intermediate trade between both sectors and regions is to satisfy the purpose
of intermediate production (Johnson and Noguera, 2012), which occupies a considerable
share in global trading activities. As displayed in Fig. 1, to illustrate the trade of region 1 with
other regions for intermediate production and final demand, the yellow segments indicate the

© 2018 American Geophysical Union. All rights reserved.
exports in region 1 for intermediate and final trade, and the red segments represent the
imports in region 1 from other regions for intermediate production and final consumption.
[Place Figure 1 here]
2.2. MRIO analysis and emission embodiment
The global MRIO model, incorporating direct emission inventories, reveals the emissions
induced by final demand and international trade. Assuming regional- and industry-specific
data for emissions per unit of output are available, the total amount of emissions for
production, consumption and trade can be calculated. The global total production-side
emission is equal to the total consumption-side emission. According to the emission balance
of global MRIO model, the basic linear equation can be expressed as,
m nR S SR R R
i j ji i i
S=1 j=1
e + (ε Z )=ε X (1)
m n mR RS RS
i ij i
S=1 j=1 S=1
X = Z + f (2)
where R
ie is the direct CH4 emissions (Production-based CH4 emissions, PBM) by sector i
in region R; S
jε and R
iε are termed as embodied emission intensities of the output from
sector j in region S and sector i in region R, respectively; SR
jiZ represents the intermediate
input from sector j in region S to sector i in region R; R
iX is the total output vector of
sector i in region R; RS
ijZ is the intermediate production from sector i in region R to sector
j in region S; and RS
if stands for the final consumption of goods or services from sector i
in region R to region S.
Introduce
X as the matrix diagonalization of X , the MRIO model can be further
expressed as

© 2018 American Geophysical Union. All rights reserved.
E ε Z = εX (3)
Then with the condition that ( )
X Z is reversible, the embodied CH4 emission intensities
can be obtained by
1( )
ε E X Z (4)
Based on the embodied emission intensity matrix, the CH4 emissions embodied in regional
final consumption can be acquired by
m nR S SR
j j
S=1 j=1
CBM = (ε f ) (5)
where RCBM represents the embodied CH4 emissions (Consumption-based CH4 emissions,
CBM) induced by the final demand of regional R.
To calculate the emissions embodied in international trade, this study pays equal attention
to the intermediate trade and final trade, which is consistent with the traditional accounting of
monetary trade (Chen and Wu, 2017). Embodied emission transfers via intermediate trade
and final trade are considered as intermediate producers’ production-driven and final users’
consumption-driven trading fluxes, respectively. According to the systems input-output
model illustrated by Wu and Chen (2017, 2018), the flows of embodied resources or
emissions in both intermediate and final trades can be quantified. The CH4 emissions
embodied in international import (MEIM, the sum of intermediate import
and final import)
and export (MEEX, the sum of intermediate export and final export) are expressed as
n m nR S SR S SR
j ji j j
i=1 S=1(S R) j=1
MEIM = ( ε Z + ε f )
(6)
n m nR R RS R RS
i ij i i
i=1 S=1(S R) j=1
MEEX = ( ε Z + ε f )
(7)
R R RMEEB = MEIM -MEEX (8)

© 2018 American Geophysical Union. All rights reserved.
where R
MEIM is the total emissions imported to region R from other regions, while
RMEEX is the total emissions embodied in exports to all other regions from region R. The
embodied CH4 emissions in international trade balance (MEEB) can be obtained as the
difference of import (MEIM) and export (MEEX). An economy with positive value of MEEB
is a net importer of embodied CH4 emissions, while that with negative MEEB is a net
exporter.
2.3. Emission data collection and preparation
Most global inventories of anthropogenic CH4 emissions are “bottom-up” (Chai et al.,
2016), based on summing individual source-category estimates. A well-developed bottom-up
inventory can be used to reveal the emission source and composition. Unlike CO2 emissions,
the estimation of anthropogenic CH4 emissions at the Country level is extremely challenging,
due to the fact that large amount of activity-level data and emission factors are hard to obtain.
The global GHG emission inventories in the EDGAR database have been widely adopted for
related environmental and climate research. This database has updated the bottom-up
inventories of anthropogenic GHG emissions of nations to the year of 2012 (EDGAR, 2017;
Janssens-Maenhout et al., 2017). Specifically, the most recently available anthropogenic CH4
emission inventories at the Country level can be obtained from the EDGAR4.3.2 emission
database, which make it possible for a more systematic study on time-series
consumption-based accountings of global CH4 emissions during 2000-2012. Based on the
emission data availability, all the 189 countries/regions in the MRIO model are merged into
181 economies (see Table S1) with 26 sectors (see Table S2) included for each economy. The
population and gross domestic product (GDP) data of the economies are available from the

© 2018 American Geophysical Union. All rights reserved.
statistical database of the World Bank (World Bank, 2017).
To perform the MRIO modeling, we should extract the direct emission data that are related
to economic activities and reallocate these data to each industrial sector of different
economies. Direct CH4 emission sources refer to enteric fermentation, manure management,
rice cultivation, fugitive emissions from solid fuels, fugitive emissions from oil & gas, solid
waste disposal on land, wastewater handling, fossil fuel combustion and others, which are
further divided into detailed emission categories in the EDGAR database. For instance, 82
emission categories are covered for the sources of anthropogenic CH4 emissions in China.
Since global inventories do not specify for distinguishing the emission categories considered
here, mixed methods are used to prepare the sectoral emission inventories and obtain concrete
emission data for different economic sectors. Most production-side emissions can be
allocated into a concrete industrial sector. For instance, the emissions from agricultural
activities, and fugitive emissions from solid fuels and oil & gas can be directly categorized
into corresponding economic sectors of Agriculture and Mining and quarrying, respectively.
If the emission category is related to multiple departments, we reallocate the emission data to
industrial sectors. In addition, several minor emission sources are neglected, mainly referring
to the fuel combustion of commercial and public services and non-specified industrial
sectors.
3. Results
3.1. Production- versus consumption-based CH4 emissions in 2012
The world economy generated 348.5 Tg CH4 emissions into the atmosphere in 2012.

© 2018 American Geophysical Union. All rights reserved.
Figure 2 shows the production-side CH4 emissions (PBMs) and the consumption-side CH4
emissions (CBMs) of the 181 economies. For the accounting results of national emission
inventories, there was a great difference between the PBM and the CBM for most economies.
With respect to regional distribution, Mainland China had the largest PBM value of 63.8 Tg,
which was two times as large as that of India (32.3 Tg, ranked 2nd), followed by the USA
(25.5 Tg), Brazil (19.2 Tg) and Russia (17.4 Tg).
From the consumption-based perspective, Mainland China was also the largest emitter of
CBM (65.0 Tg), accounting for 18.6% of the global total. The USA had the second largest
CBM (38.4 Tg), which was 50.6% larger than its PBM. India (30.9 Tg), Brazil (19.2 Tg) and
Japan (12.1 Tg) were important embodied emission contributors. These top five economies
together contributed 47.5% of global total CBM. In addition, Germany possessed relatively
high value of CBM (7.2 Tg), approximately 2.6 times that of its PBM. The economies with
large consumption-based emissions were mostly those with large population and
consumption volumes. By contrast, the CBM (8.9 Tg) in Russia was only half of its PBM.
Therefore, both production- and consumption-based accounting methods of CH4 emissions
should be considered in identifying mitigation opportunities.
[Place Figure 2 here]
The world economy can be further divided into 19 integrative economies (see the regional
information in Table S3). China was the largest direct CH4 emitter, followed by Sub-Saharan
Africa, India, Southeastern Asia and the USA. Agriculture, energy and waste related emission
sources were the three main contributors to the global production-side CH4 emissions (see
Figure 3a). As one of the most important emission categories, agricultural activities

© 2018 American Geophysical Union. All rights reserved.
accounted for 45.9% of the global total PBMs, followed by energy (30.0%) and waste
(19.6%). As to agriculture-related PBMs, China’s contribution amounted to 25.9 Tg, followed
by India of 20.3 Tg, Sub-Saharan Africa of 19.1 Tg, Southeastern Asia of 17.4 Tg and Brazil
of 14.7 Tg. For energy-related PBMs, China (21.8 Tg), Middle East (15.5 Tg) and Russia
(11.4 Tg) ranked the top three of the integrated economies. Particularly, the PBMs of Middle
East and Russia were both dominated by energy activities, due to their large-scale oil & gas
exploitations.
As to final demand category (see Figure 3b), household consumption accounted for 65.6%
(228.5 Tg) of the global total CBM, followed by fixed capital formation (53.6 Tg),
government consumption (44.1 Tg), non-profit consumption (13.0 Tg), inventory increase
(6.7 Tg) and acquisitions of valuables (2.7 Tg). China’s household consumption took up the
largest share of 51.8% in its CBM, while fixed capital formation also contributed a
comparable share. Western Europe ranked second in terms of the CBM, which was 1.2 times
larger than that of the PBM. Like Western Europe, the USA, Rest Europe and Japan had
higher CBMs than their PBMs.
[Place Figure 3 here]
Figure 4 shows the compositions of the PBM and the CBM by industrial sector (also see
Table S4). The sector of Agriculture (S1, 160.1 Tg) was the largest emitter of PBM, followed
by Mining and quarrying (S3, 104.6 Tg) and Education, health and other services (S23, 68.4
Tg). The above-mentioned three sectors together accounted for 95.6% of the global total
PBM. China’s Agriculture, Mining and quarrying, and Education, health and other services
each took the share of 16.2%, 20.8% and 16.6% of the world-wide sectoral total, respectively.

© 2018 American Geophysical Union. All rights reserved.
[Place Figure 4 here]
From the consumption-based perspective, the CBM of Education, health and other
services amounted to 74.7 Tg, followed by Agriculture (64.7 Tg),Food and beverages (S4,
57.0 Tg), Construction (S14, 30.8 Tg) and Petroleum, chemical and non-metallic mineral (S7,
17.5 Tg). Agriculture and Food and beverages contributed massive agriculture-related CBMs.
Notably, Construction contributed large proportions in the CBMs of some developing
countries. Particularly, China contributed 46.9% of the global total CBM of the Construction
sector.
3.2. Embodied CH4 emissions in global trade network in 2012
Trade globalization has led to close economic connection. A region’s consumption can
cause CH4 emissions in other regions through the import trade of commodities. In 2012, the
CH4 emissions embodied in international trade (total MEIM or MEEX, 172.4 Tg) were
equivalent to 49.5% of the global total PBM. Figure 5 displays the top 20 economies for the
MEIM, MEEX and MEEB. 58.9% of global total MEIM and 39.8% of global total MEEX
can be attributed to the top 10 economies, respectively. Mainland China ranked first in terms
of the MEEX (14.4 Tg), which was equal to 22.2% of its CBM. Meanwhile, the USA had the
largest value of MEIM (21.0 Tg), which was equal to 54.6% of its CBM. Detailed data are
listed in Tables S5 and S6.
The embodied emission in international trade balance (MEEB) is an important indicator to
reflect the profit or loss of environmental pressure from international trade (Peters, 2008;
Peters et al., 2011). The top 20 net importers and net exporters accounted for 90.8% and
69.9% of the total MEEB (62.5 Tg, the total net import or export), respectively. Mainland

© 2018 American Geophysical Union. All rights reserved.
China had high volume of MEEX and MEIM, but its MEEB was relatively small. The USA,
Japan, Germany, South Korea, the UK and other Western European countries were significant
net importers of embodied CH4 emissions. Russia, Ethiopia, Nigeria, Iran and Qatar were the
top five net exporters. Russia, Nigeria, Iran and Qatar were prominent net exporters of
embodied energy-related CH4 emissions, due to the dominating export of energy
commodities. By contrast, Ethiopia was a net exporter, mainly associated with
agriculture-related emissions induced by international trade.
[Place Figure 5 here]
Among the emissions embodied in international trade, intermediate trade and final trade
contributed to 77.8% (134.1 Tg) and 22.2% (38.4 Tg) of the total, respectively. Figure 6
displays the major fluxes of embodied CH4 emissions in the intermediate trade and final trade
among the 19 integrative economies (excluding intraregional trade within the economy). As
shown in Fig. 6(a), Western Europe, China, the USA and Japan were the major destinations
for trading embodied emission flows. Prominently, Western Europe occupied the largest
portion in intermediate trade with an import volume of 30.2 Tg. In Russia, Sub-Saharan
Africa, Middle East, Northern Africa and Rest Europe, 17.9%, 15.7%, 14.0%, 11.0% and
10.0% of their intermediate trade-related CH4 emissions could be linked to the production of
exported goods for the consumption of Western Europe, respectively. Middle East was the
largest exporters of embodied emissions in intermediate trade, followed by Sub-Saharan
Africa and Russia, which accounted for 12.9%, 11.6% and 10.8% of the global total,
respectively. The largest bilateral trading flow in the intermediate trade was related to the
exports from Russia to Western Europe (5.4 Tg), which was equal to 30.9% of Russia’s PBM,

© 2018 American Geophysical Union. All rights reserved.
followed by the trading flow from Sub-Saharan Africa to Western Europe (4.7 Tg).
As to the final trade, China turned to the leading exporter by exporting products to the
USA (1.4 Tg), Western Europe (1.0 Tg), Japan (0.7 Tg) and other economies. Western Europe
was the largest importer of embodied emissions (5.8 Tg), followed by the USA (5.5 Tg).
Russia had relatively low embodied CH4 emissions in the final trade. The largest bilateral
trading flows through final trade were from China to the USA and from China to Western
Europe. As shown in Fig. 6(b), China, Southeastern Asia, India, Sub-Saharan Africa and
Other Southern Asia were the important source regions, while Western Europe, the USA and
Japan were the major destinations for trading embodied emissions flows in the final trade.
[Place Figure 6 here]
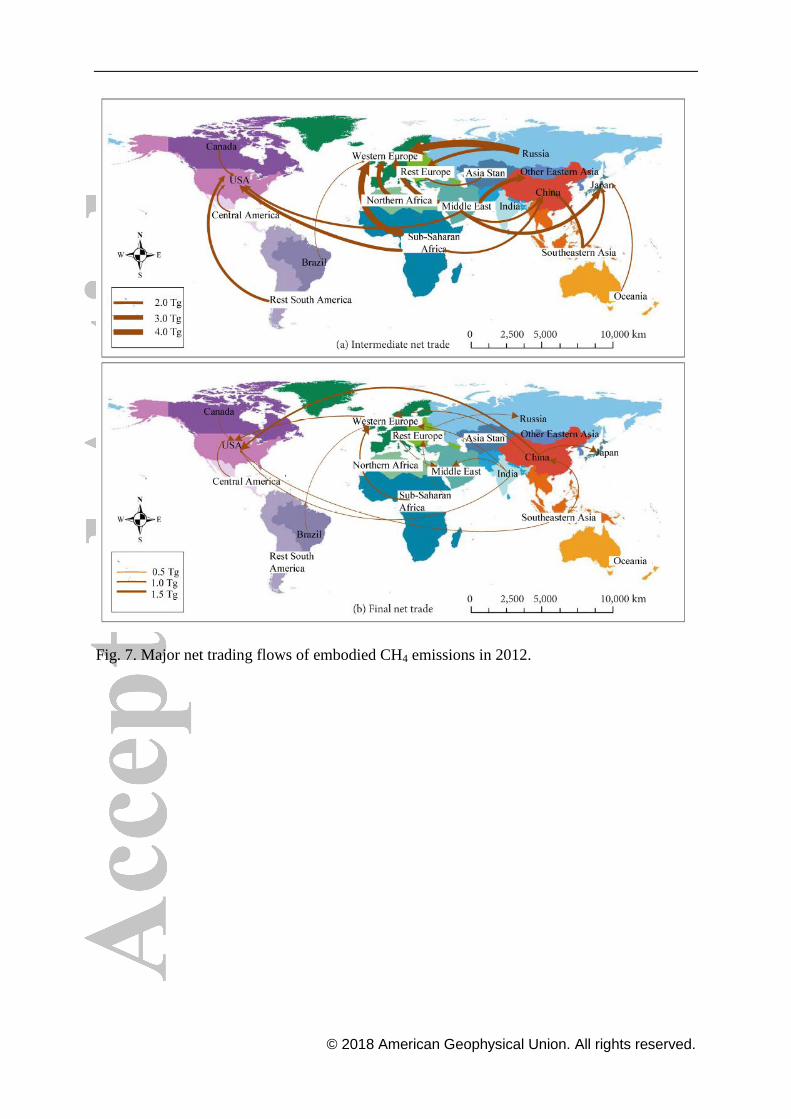
Figure 7 highlights the net transfer of embodied CH4 emissions in terms of intermediate net
trade and final net trade. Russia (5.0 Tg) accounted for one fourth of the total net embodied
CH4 inflows in the intermediate trade of Western Europe, followed by Sub-Saharan Africa
(4.4 Tg), Middle East (3.1 Tg) and Northern Africa. The main exporting regions of net
embodied CH4 inflow into the USA were Sub-Saharan Africa, Rest South America, Middle
East and Canada, together accounting for 67.9% of its total net inflows through intermediate
trade. China was also an important net importer. In the final net trade, Western Europe and
the USA were net importers, but China turned into a net exporter. Sub-Saharan Africa,
Southeastern Asia, India and Asia Stan were important net exporters of embodied CH4
emissions. Middle East, Japan, Russia, Rest Europe and Northern Africa were net importers
of embodied emission transfer in the final net trade.
[Place Figure 7 here]

© 2018 American Geophysical Union. All rights reserved.
3.3. Evolution of consumption-based CH4 inventories over 2000-2012
The total CH4 emissions by the world economy increased by 20.5%, from 289.3 Tg in
2000 to 348.5 Tg in 2012. Table 1 presents a comparison of production- and
consumption-based CH4 inventories of 19 integrative economies in 2000 and 2012. China,
Western Europe and the USA had the largest CBM values among all the 19 economies during
2000-2012 (see Table S7). Meanwhile, the CBMs of the USA, Western Europe and Japan
were much higher than their PBMs, but the values of CBM in the USA, Western Europe,
Japan and Oceania decreased from 2000 to 2012. For instance, the PBM and the CBM of
Japan decreased by 20.4% and 12.6%, respectively. As the largest emitter in the world, the
evolution of China’s CH4 emission inventories revealed increasing larger gap between its
PBM and CBM over the same period. Significant increases of CBMs can be observed in most
developing regions during 2000-2012. In addition, there were remarkable disparities on the
growth rate of CH4 emissions among selected economies. Asia Stan was the area with the
fastest growing PBM of 71.5%, while Sub-Saharan Africa had the fastest growing CBM of
64.5% over 2000–2012. China and Middle East also witnessed rapid growth in PBMs, though
their CBMs grew more prominently. Overall, the CH4 inventory changes of 19 integrative
economies from a consumption perspective were quite different from those from a production
perspective.
[Place Table 1 here]
Economic globalization led to the growth of international trade and corresponding
emission leakage during 2000-2012. The gross scale of embodied emissions in international
trade was only 132.9 Tg (45.9% of the total PBM) in 2000, compared to 172.4 Tg (49.5% of

© 2018 American Geophysical Union. All rights reserved.
the total PBM) in 2012. Displayed in Table 2 are the trade-related CH4 emission changes
between 2000 and 2012. After comparing the change of trade structure, a large share of the
CH4 emissions generated in the production of certain exported products in many economies
were transferred to the consumers in developed countries and large developing countries over
2000-2012. It is worth noting that intermediate trade change contributed the major shares to
the trade-related CH4 emission changes of most economies. Global total intermediate trade
increased from 103.4 Tg in 2000 to 134.1 Tg in 2012, while final trade increased from 29.6
Tg to 38.4 Tg. Most economies such as China and Western Europe showed a rapid growth of
trade-induced CH4 emissions over this period. Particularly, the MEEBs of China and Rest
Europe increased by 5.7 and 2.9 Tg over this period, respectively. Developed economies such
as Western Europe, the USA and Japan were the major net receivers of embodied emission
transfer in international trade, mainly from developing countries. However, the USA and
Japan had a negative growth of embodied emissions in both intermediate and final imports.
Detailed results of the embodied CH4 emissions in international exports and imports of the 19
integrative economies during 2000–2012 are listed in Tables S8 and S9, respectively.
[Place Table 2 here]
4. Discussion
In the context of accelerated globalization, the production-side environmental emission
within one country’s territory is not anymore a suitable indicator for measuring its real
emission requirements. Several studies have claimed that embodied energy, carbon and water
footprints can give a more accurate picture of resources and emissions associated with the

© 2018 American Geophysical Union. All rights reserved.
degree of development of a country (e.g., Steinberger et al., 2012; Lamb et al., 2014; Arto et
al., 2016; Prell, 2016; Hubacek et al., 2017). Unlike CO2 emissions, the studies estimating
consumption-based CH4 inventories or CH4 footprints of nations are scarce and, to date, no
one has focused on the development issues. CBM or CBM per capita can also be used as an
important indicator for more in-depth studies of the global environmental patterns and human
development.
Figure 8 shows the relationships between per capita gross domestic product (GDP) and per
capita CBM as well as human development index (HDI) and per capita CBM among major
economies (see Table S10 for details). The world-average per capita CBM was calculated as
49.2 kg/cap in 2012. The economies with higher per capita CBM were mainly in the
developed regions with larger GDP values, such as Singapore, Hong Kong, the USA and
Canada. Most of the economies with high HDIs were grouped at larger per capita CBMs.
Importantly, most of the developing countries with lower HDIs had low per capita CBMs or
embodied CH4 emission requirements, such as India, Pakistan, Indonesia and Nigeria. The
per capita CBM or household consumption-driven CBM of Mainland China, the largest CH4
emitter, was still much lower than those of the developed world. Thereafter, the per capita
CBM reflects the environmental inequality among different economies to a certain extent.
[Place Figure 8 here]
In view of the importance of international trade for understanding global CBM inventories,
the transfers of embodied CH4 emissions in an economy were found to be determined by its
industrial position in the global supply chain. Figure 9 presents the net trade pattern of
embodied CH4 emissions for major economies in 2012, by revealing the emission imbalance

© 2018 American Geophysical Union. All rights reserved.
of intermediate trade and final trade. Prominently, embodied CH4 emission transfers via
international trade were mainly related to intermediate production rather than final
consumption. For example, Mainland China was an intermediate net importer but a final net
exporter. As a “world factory’, Mainland China imported a large number of agricultural
products and industrial raw materials such as fossil fuels via intermediate trade and then
produced manufactured goods to meet demands of both local consumption and foreign
countries via export trade. Totally, 83.5% of its direct emissions in 2012 were used to satisfy
local final demand, and the other 16.5% was used for the final demand of foreign regions. By
contrast, Russia was an intermediate net exporter, due to its vast volume of intermediate
exports. 65.6% of its CH4 emissions were generated by production to meet the trade demand
of global market. This can be explained by the fact that the exports of Russia were dominated
by energy and industrial raw materials, mostly used for intermediate production in Western
Europe and other large economies. Meanwhile, Russia was a final net importer as a result of
the import trade of manufactured goods and consumer goods for its final consumption.
Embodied CH4 emissions in the intermediate and final imbalances of the USA exceeded
those of any other regions. The trade patterns were similar in Japan and Western European
Countries (e.g., the UK, Germany and France) with substantial embodied emissions in goods
imports to meet the demand for final consumption. Japan had extremely low CH4 emissions
from local production, but its embodied emissions to support its final demand amounted to
12.1 Tg in 2012, of which 16.6% from Middle East, 13.0% from Sub-Saharan Africa, 12.9%
from Southeastern Asia, 11.6% from China, 9.9% from Russia and 21.6% from other foreign
countries. Over the period of 2000-2012, the top net importers in both intermediate and final

© 2018 American Geophysical Union. All rights reserved.
trade were all concentrated in developed economies, while the leading net exporters in the
third quadrant were underdeveloped or developing economies such as Ethiopia and India. It is
clear that by consumption-based accounting principle, many developed countries should take
a greater share of CH4 emissions.
[Place Figure 9 here]
Globally, economic driving forces, such as household consumption increase, accelerated
fixed investment and international trade expansion play important roles in determining the
structure of anthropogenic CH4 emission requirements. As major emission sources of
production-side CH4, industrial activities of energy, agriculture and waste sectors are induced
by final consumption demands of local and foreign consumers. In 2012, household
consumption contributed 65.6% (228.5 Tg) of the global total CBMs, followed by fixed
capital formation (53.6 Tg) and government consumption (44.1 Tg). As the largest final
demand category for the CBMs, household consumption is closely related to residents’ daily
life such as Agriculture and Food and beverages. In fact, rural and urban household
consumption were agricultural-CH4 intensive. The energy-related CBMs were predominantly
driven by investment demand or gross capital formation, especially in some developing
countries. For instance, the energy-related CBMs of China’s Construction sector were
remarkable. In addition, the waste-related CH4 emissions were largely driven by local
consumption, living standards of people and waste management levels. At present, reduction
of CH4 emissions on the consumption side has been far less attended to by policy makers and
researchers than that of CO2 emissions (Zhang et al., 2016, 2018). Consumption-based
accounting conducted in this study provides new insights on where to focus policy responses

© 2018 American Geophysical Union. All rights reserved.
to reduce global anthropogenic CH4 emissions and pinpoints the regional and sectoral
hotspots for possible emission mitigation associated with production, consumption and
international trade.
5. Concluding remarks
Reducing CH4 emissions has become an important global agenda in energy, environmental
and climate fields. The generation and increase of anthropogenic CH4 emissions are related
with regional economic development, industrial structure, population, people’s diets and
living standard, energy mix, technological advance, etc. Consumption-based accountings
thereafter are more suitable for the illustration of real CH4 footprint for an economy. In order
to better understand how final demand and international trade influence production as well as
related CH4 emissions, a systematic accounting for global CH4 emissions from the
consumption-based perspective is conducted in this study. We not only identified the spatial
separation of production and consumption, but also how the virtual transfer of CH4 emissions
along global supply chains was associated with the intermediate trade and final trade. The
position and function of 181 economies to act on the structure and spatial patterns of global
CH4 emissions were revealed. Substantial geographic shifts of CH4 emissions during
2000-2012 revealed the significant impact of international trade on national CH4 emissions.
Owing to the increasing embodied emission transfers via international trade, there were
remarkable regional disparities on the growth rate of consumption-side CH4 emissions among
the 19 integrative economies over 2000-2012. Consumption-based accounting of global
anthropogenic CH4 emissions in this study reveals the CH4 footprints of nations and major

© 2018 American Geophysical Union. All rights reserved.
economies, and helps to identify corresponding emission responsibilities along global supply
chains for climate change mitigation.
Acknowledgements
See Tables S1-10 in Supplementary information associated with this article. All the CH4
emission data can be available from the EDGAR database at
http://edgar.jrc.ec.europa.eu/overview.php?v=432_GHG&SECURE=123. This study has
been supported by the National Natural Science Foundation of China (Grant no. 71774161),
the Foundation of State Key Laboratory of Coal Resources and Safe Mining (Grant no.
SKLCRSM16KFC06), and the Yue Qi Young Scholar Project, China University of Mining &
Technology (Beijing). Very helpful comments by the editor Michael Ellis and the anonymous
reviewer are highly appreciated.
Nomenclature
GHG Greenhouse gas emissions
PBA Production-based emission accounting
CBA Consumption-based emission accounting
PBM Production-based methane emission
CBM Consumption-based methane emission
MRIO Multiregional input-output model
MEIM Methane emission embodied in international import
MEEX Methane emission embodied in international export

© 2018 American Geophysical Union. All rights reserved.
MEEB Embodied methane emission in international trade balance
EDGAR Emissions Database for Global Atmospheric Research
UNFCCC United Nations Framework Convention on Climate Change
HDI Human development index
GDP Gross domestic product
References
Ali, Y. (2017). Carbon, water and land use accounting: Consumption vs. production perspectives. Renew.
Sustain. Energy Rev. 67, 921-934.
Andreoni, V., Galmarini, S. (2016). Drivers in CO2 emissions variation: A decomposition analysis for 33 world
countries. Energy 103, 27-37.
Arto, I., Capellán-Pérez, I., Lago, R., Bueno, G., Bermejo R. (2016). The energy requirements of a developed
world. Energy Sustain. Dev. 33, 1-13.
Arto, I., Dietzenbacher, E. (2014). Drivers of the growth in global greenhouse gas emissions. Environ. Sci.
Technol. 48 (10), 5388-5394.
Caro, D., LoPresti, A., Davis, S.J., Bastianoni, S., Caldeira, K. (2014). CH4 and N2O emissions embodied in
international trade of meat. Environ. Res. Lett. 9, 114005.
Caro, D., Pulselli, F.M., Borghesi, S., Bastianoni, S. (2017). Mapping the international flows of GHG emissions
within a more feasible consumption-based framework. J. Clean Prod. 147, 142-151.
Chai, X., Tonjes, D.J., Mahajan, D. (2016). Methane emissions as energy reservoir: Context, scope, causes and
mitigation strategies. Progr. Energy Combust. 56, 33-70.
Chen B, Han, M.Y., Peng, K., Zhou, S.L., Shao, L., Wu, X.F., et al. (2018a). Global land-water nexus:

© 2018 American Geophysical Union. All rights reserved.
Agricultural land and freshwater use embodied in worldwide supply chains. Sci Total Environ 613-614,
931-943.
Chen, B., Li, J.S., Wu, X.F., Han, M.Y., Zeng, L., Li, Z., et al. (2018b). Global energy flows embodied in
international trade: A combination of environmentally extended input–output analysis and complex network
analysis. Appl. Energy 210, 98-107.
Chen, G.Q., Han, M.Y. (2015). Global supply chain of arable land use: Production-based and consumption-based
trade imbalance. Land Use Policy 49, 118-130.
Chen, G.Q., Wu, X.F. (2017). Energy overview for globalized world economy: Source, supply chain and sink.
Renew. Sustain. Energy Rev. 69, 735-749.
Chen, Z.M., Chen, G.Q. (2013). Virtual water accounting for the globalized world economy: National water
footprint and international virtual water trade. Ecol. Indic. 28, 142-149.
Crill, P.M., Thornton, B.F. (2017). Whither methane in the IPCC process? Nat. Clim. Change 7, 678-680.
Dalsøren, S.B., Myhre, C.L., Myhre, G., Gomez-Pelaez, A.J., Søvde, O.A., Isaksen, I.S.A., et al. (2016).
Atmospheric methane evolution the last 40 years. Atmos. Chem. Phys. 16, 3099-3126.
Davis, S.J., Caldeira, K. (2010). Consumption-based accounting of CO2 emissions. P. Natl. Acad. Sci. USA 107,
5687-5692.
Deng, G., Xu, Y. (2017). Accounting and structure decomposition analysis of embodied carbon trade: A global
perspective. Energy 137, 140-151.
Du, M., Zhu, Q., Wang, X., Li, P., Yang, B., Chen, H., et al. (2018). Estimates and predictions of methane
emissions from wastewater in China from 2000 to 2020. Earth’s Future 6, 252-263.
EDGAR, Emission Database for Global Atmospheric Research (EDGAR), 2017. Release version 4.3. European
Commission, Joint Research Centre (JRC)/ PBL Netherlands Environmental Assessment Agency.

© 2018 American Geophysical Union. All rights reserved.
http://edgar.jrc.ec.europe.eu/index.php/.
Fan, J.L., Hou, Y.B., Wang, Q., Wang, C., Wei, Y.M. (2016). Exploring the characteristics of production-based
and consumption-based carbon emissions of major economies: A multiple-dimension comparison. Appl.
Energy 184, 790-799.
Feng, K., Chapagain, A., Suh, S., Pfister, S., Hubacek, K. (2011). Comparison of bottom-up and top-down
approaches to calculating the water footprints of nations. Econ. Syst. Res. 23 (4), 371-385.
Ghosh, A., Patra, P. K., Ishijima, K., Umezawa, T., Ito, A., Etheridge, D. M., Nakazawa, T.et al. (2015).
Variations in global methane sources and sinks during 1910–2010. Atmos. Chem. Phys. 15, 2595-2612.
Han, M.Y. Chen, G.Q. Li, Y.L. (2018). Global water transfers embodied in international trade: Tracking
imbalanced and inefficient flows. J. Clean. Prod. http://doi:10.1016/j.jclepro.2018.02.195.
Hausmann, P., Sussmann, R., Smale, D. (2016). Contribution of oil and natural gas production to renewed
increase in atmospheric methane (2007–2014): top-down estimate from ethane and methane column
observations. Atmos. Chem. Phys. 16, 3227-3244.
Hertwich, E.G., Peters, G.P. (2009). Carbon footprint of nations: A global, trade-linked analysis. Environ. Sci.
Technol. 43, 6414-6420.
Hopkins, F.M., Ehleringer, J.R., Bush, S.E., Duren, R.M., Miller, C.E., Lai, C.T., et al. (2016). Mitigation of
methane emissions in cities: How new measurements and partnerships can contribute to emissions reduction
strategies. Earth’s Future 4, 408-425.
Höglund-Isaksson, L. (2017). Bottom-up simulations of methane and ethane emissions from global oil and gas
systems 1980 to 2012. Environ. Res. Lett. 12, 024007.
Hubacek, K., Baiocchi, G., Feng, K., Patwardhan, A. (2017). Poverty eradication in a carbon constrained world.
Nat. Commun. 8(1), 912, http://doi:10.1038/s41467-017-00919-4.

© 2018 American Geophysical Union. All rights reserved.
IPCC, Intergovernmental Panel on Climate Change (2014). IPCC fifth assessment report: climate change 2013
(AR5). http: //www.ipcc.ch/index.htm.
Janssens-Maenhout, G., Crippa, M., Guizzardi, D., Muntean, M., Schaaf, E., Dentener, F., et al. (2017). EDGAR
v4.3.2 Global Atlas of the three major Greenhouse Gas Emissions for the period 1970–2012. Earth Syst. Sci.
Data Discuss., https://doi.org/10.5194/essd-2017-79.
Jiang, X., Green, C. (2017). The impact on global greenhouse gas emissions of geographic shifts in global
supply chains. Ecol. Econ. 139, 102-114.
Jiang, X., Guan, D. (2017). The global CO2 emissions growth after international crisis and the role of
international trade. Energy Policy 109, 734-746.
Johnson, R.C., Noguera, G. (2012). Accounting for intermediates: production sharing and trade in value added. J.
Int. Econ. 86 (2), 224-236.
Kanemoto, K., Moran, D., Hertwich, E. (2016). Mapping the carbon footprint of nations. Environ. Sci.
Technol. 50 (19), 10512-10517.
Kanemoto, K., Moran, D., Lenzen, M., Geschke, A. (2014). International trade undermines national emission
reduction targets: New evidence from air pollution. Glob. Environ. Change 24, 52-59.
Kirschke, S., Bousquet, P., Ciais, P., Saunois, M., Canadell, J.G., Dlugokencky, E.J., et al. (2013). Three decades
of global methane sources and sinks. Nat. Geosci. 6, 813-823.
Lamb, W.F, Steinberger, J.K, Bows-Larkin, A., Peters, G.P, Roberts, J.T, Wood, F.R. (2014). Transitions in
pathways of human development and carbon emissions. Environ. Res. Lett. 9 (1), 014011.
Lenzen, M., Kanemoto, K., Moran, D., Geschke, A. (2012a). Mapping the structure of the world economy.
Environ. Sci. Technol. 46, 8374-8381.
Lenzen, M., Moran, D., Bhaduri, A., Kanemoto, K., Bekchanov, M., Geschke, A., et al. (2013a). International

© 2018 American Geophysical Union. All rights reserved.
trade of scarce water. Ecol. Econ. 94, 78-85.
Lenzen, M., Moran, D., Kanemoto, K., Foran, B., Lobefaro, L., Geschke, A. (2012b). International trade drives
biodiversity threats in developing nations. Nature 486 (7401), 109-112.
Lenzen, M., Moran, D., Kanemoto, K., Geschke, A. (2013b). Building Eora: A global multi-region input-output
database at high country and sector resolution. Econ. Syst. Res. 25 (1), 20-49.
Li, J.S., Chen, B., Chen, G.Q., Wei, W.D., Wang, X.B., Ge, J.P., et al. (2017). Tracking mercury emission flows
in the global supply chains: A multi-regional input-output analysis. J. Clean. Prod. 140, Part 3, 1470-1492.
Liang, S., Wang, Y., Cinnirella, S., Pirrone, N. (2015). Atmospheric mercury footprints of nations Environ. Sci.
Technol. 49 (6), 3566-3574.
Liddle, B. (2018). Consumption-based accounting and the trade-carbon emissions nexus. Energ. Econ. 69,
71-78.
Lin, J., Pan, D., Davis, S.J., Zhang, Q., He, K., Wang, C., et al. (2014). China’s international trade and air
pollution in the United States. Proc. Natl. Acad. Sci. USA 111 (5), 1736-1741.
Lin, J.T., Tong, D., Davis, S., Ni, R., Tan, X.X., Pan, D.,et al. (2016). Global climate forcing of aerosols
embodied in international trade. Nat. Geosci. 9 (10), 790-794.
Malik, A., Lan, J., Lenzen, M. (2016). Trends in global greenhouse gas emissions from 1990 to 2010. Environ.
Sci. Technol. 50 (9), 4722-4730.
Meng, J., Liu, J., Xu, Y., Guan, D., Liu, Z., Huang, Y., et al. (2016). Globalization and pollution:
Tele-connecting local primary PM2.5 emissions to global consumption. P. Royal Soc. A. 472, 20160380.
Montzka, S.A., Dlugokencky, E.J., Butler, J.H. (2011). Non-CO2 greenhouse gases and climate change. Nature
476, 43-50.
Moran, D., Kanemoto, K. (2016). Tracing global supply chains to air pollution hotspots. Environ. Res.Lett. 11

© 2018 American Geophysical Union. All rights reserved.
(9), 094017.
Nisbet, E.G., Dlugokencky, E.J., Manning, M.R., Lowry, D., Fisher, R.E., France, J.L., et al. (2016). Rising
atmospheric methane: 2007-2014 growth and isotopic shift. Global Biogeochem. Cycles 30, 1356-1370.
Oita, A., Malik, A., Kanemoto, K., Geschke, A., Nishijima, S., Lenzen, M. (2016). Substantial nitrogen pollution
embedded in international trade. Nat. Geosci. 9 (2), 111-115.
Oliveira, G., Bourscheidt, D.M. (2017). Multi-sectorial convergence in greenhouse gas emissions. J. Environ.
Manage. 196, 402-410.
Olivier, J.G.J., Schure, K.M., Peters, J.A.H.W. (2017). Trends in global CO2 and total greenhouse gas emissions
Summary of the 2017 report. PBL Netherlands Environmental Assessment Agency, The Hague.
Pablo-Romero, M.P., Sánchez-Braza, A. (2017). The changing of the relationships between carbon footprints
and final demand: Panel data evidence for 40 major countries. Energ. Econ. 61, 8-20.
Peters, G.P., Minx, J.C., Weber, C.L., Edenhofer, O. (2011). Growth in emission transfers via international trade
from 1990 to 2008. Proc. Nat. Acad. Sci. USA 108 (21), 8903-8908.
Peters, G.P. (2008). From production-based to consumption-based national emission inventories. Ecol. Econ. 65
(1), 13-23.
Peters, G.P., Hertwich, E.G. (2008). CO2 embodied in international trade with implications for global climate
policy. Environ. Sci. Technol. 42, 1401-1407.
Poortinga, W., Spence, A., Demski, C., Pidgeon, N.F. (2012). Individual-motivational factors in the acceptability
of demand-side and supply-side measures to reduce carbon emissions. Energ. Policy 48, 812-819.
Prell, C. (2016). Wealth and pollution inequalities of global trade: A network and input-output approach. Soc.
Sci. J. 53 (1), 111-121.
Rice, A.L., Butenhoff, C.L., Teama, D.G.,Röger, F.H., Khalil, M.A.K., Rasmussen, R.A. (2016). Atmospheric

© 2018 American Geophysical Union. All rights reserved.
methane isotopic record favors fossil sources flat in 1980s and 1990s with recent increase. Proc. Natl. Acad.
Sci. USA 113, 10791-10796.
Saunois, M., Bousquet, P., Poulter, B., Peregon, A., Ciais, P., Canadell, J.G., et al. (2016a). The global methane
budget: 2000–2012. Earth System Science Data 8, 697-751.
Saunois, M., Jackson, R.B., Bousquet, P., Poulter, B., Canadell, J.G. (2016b). The growing role of methane in
anthropogenic climate change. Environ. Res. Lett. 11 (12), 120207.
Schaefer, H., Fletcher, S.E., Veidt, C., Lassey, K.R., Brailsford, G.W., Bromley, T.M., et al. (2016). A 21st
century shift from fossil-fuel to biogenic methane emissions indicated by 13
CH4. Science 352 (6281), 80-84.
Schwietzke, S., Sherwood, O.A., Bruhwiler, L.M., Miller, J.B., Etiope, G., Dlugokencky, E.J., et al. (2016).
Upward revision of global fossil fuel methane emissions based on isotope database. Nature 538, 88-91.
Steinberger, J.K., Roberts, J.T., Peters, G.P., Baiocchi, G. (2012). Pathways of human development and carbon
emissions embodied in trade. Nat. Clim. Change 2 (2), 81-85.
Tian, J., Liao, H., Wang, C. (2015). Spatial–temporal variations of embodied carbon emission in global trade
flows: 41 economies and 35 sectors. Nat. Hazards 78 (2), 1125-1144.
Tian, X., Wu, R., Geng, Y., Bleischwitz, R., Chen, Y. (2017). Environmental and resources footprints between
China and EU countries. J. Clean Prod. 168, 322-330.
Wiedmann, T.O., Schandl, H., Lenzen, M., Moran, D., Suh, S., West, J., et al. (2013). The material footprint of
nations. Proc. Natl. Acad. Sci. USA 201220362.
WMO. (2016). The state of greenhouse gases in the atmosphere based on global observations through 2015.
WMO Greenhouse Gas Bulletin.
World Bank. (2017). World Bank Open Data, http://data.worldbank.org.
Wu, X.D., Guo, J.L., Han, M.Y., Chen, G.Q. (2018). An overview of arable land use for the world economy:

© 2018 American Geophysical Union. All rights reserved.
From source to sink via the global supply chain. Land Use Policy 76, 201-214.
Wu, X.F., Chen, G.Q. (2017). Global primary energy use associated with production, consumption and
international trade. Energ. Policy 111, 85-94.
Wu, X.F., Chen, G.Q. (2018). Coal use embodied in globalized world economy: From source to sink through
supply chain. Renew. Sustain. Energy Rev. 81, Part 1, 978-993.
Xia, X.H., Chen, B., Wu, X.D., Hu, Y., Liu, D.H., Hu, C.Y. (2017). Coal use for world economy: Provision and
transfer network by multi-region input-output analysis. J. Clean Prod. 143, 125-144.
Zhang, B., Chen, G.Q., Li, J.S., Tao, L. (2014a). Methane emissions of energy activities in China 1980–2007.
Renew. Sustain. Energy Rev. 29, 11-21.
Zhang, B., Li, J.S., Peng, B. (2014b). Multi-regional input-output analysis for China’s regional CH4 emissions.
Front. Earth Sci. 8 (1), 163-180.
Zhang, B., Yang, T.R., Chen, B., Sun, X.D. (2016). China’s regional CH4 emissions: Characteristics,
interregional transfer and mitigation policies. Appl. Energy 184, 11841195.
Zhang, B., Zhang, Y., Zhao, X., Meng, J. (2018). Non-CO2 greenhouse gas emissions in China 2012: Inventory
and supply chain analysis. Earth’s Future 6, 103-116.
Zhang, Q., Jiang, X.J., Tong, D., Davis, S.J., Zhao, H.Y., Geng, G.N., et al. (2017). Transboundary health
impacts of transported global air pollution and international trade. Nature 543 (7647), 705-709.

© 2018 American Geophysical Union. All rights reserved.
Fig. 1. The structure of MRIO table for the world economy. Revised from Wu and Chen
(2017).

© 2018 American Geophysical Union. All rights reserved.
Fig. 2. The PBMs and CBMs of the top 20 economies in 2012.

© 2018 American Geophysical Union. All rights reserved.
Fig. 3. The PBMs and CBMs of 19 integrative economies in 2012.

© 2018 American Geophysical Union. All rights reserved.
Fig. 4. Sectoral production- and consumption-based CH4 emissions by the world economy in
2012.

© 2018 American Geophysical Union. All rights reserved.
Fig. 5. The MEIMs, MEEXs and MEEBs of the top 20 economies in 2012.

© 2018 American Geophysical Union. All rights reserved.
Fig. 6. Embodied CH4 emissions in international trade among 19 integrative economies in
2012. The connection between economies represents the transfer of embodied emissions, and
the color of the connecting line is consistent with the exporter. The width of the connecting
line represents the size of trade volume.
© 2018 American Geophysical Union. All rights reserved.
Fig. 7. Major net trading flows of embodied CH4 emissions in 2012.

© 2018 American Geophysical Union. All rights reserved.
Fig. 8. The relationship between the HDI, per capita GDP and per capita CBM by
country/region in 2012. Note: Guyana is excluded, due to its per capita CBM amounting to
470.2 kg (higher than 450). Luxembourg is also excluded due to its per capita GDP larger
than 102,404.6 USD.

© 2018 American Geophysical Union. All rights reserved.
Fig. 9. Trade imbalances of embodied CH4 emissions of major economies in 2012. Note: The
size of the sphere represents the total trade volume of embodied CH4 emissions (the total
import or export). Regions closer to the vertical axis tend to be final consumption-oriented,
while those closer to the horizontal axis tend to be intermediate production-oriented. Regions
have positive values are net importers, and vice versa.

© 2018 American Geophysical Union. All rights reserved.
Table 1
Production- and consumption-based CH4 inventories of 19 integrative economies in 2000 and 2012
Economy
PBM (Tg)
Changes (%)
CBM (Tg)
Changes (%)
2000 2012 2000 2012
Canada 5.0 4.7 -6.3 3.8 4.5 19.4
USA 24.6 25.5 3.6 40.2 38.4 -4.5
Central America 7.4 8.7 17.7 7.0 7.7 9.8
Brazil 15.6 19.2 23.5 15.3 19.2 25.5
Rest South America 14.7 16.2 9.9 12.4 12.9 4.4
Northern Africa 6.7 7.2 6.4 2.7 3.4 27.5
Sub-Saharan Africa 28.7 35.1 22.1 12.9 21.3 64.5
Western Europe 21.9 18.2 -16.7 44.1 40.3 -8.7
Russia 13.6 17.4 28.0 6.7 8.9 33.0
Rest Europe 10.6 10.8 2.0 10.3 13.5 30.2

© 2018 American Geophysical Union. All rights reserved.
Middle East 17.8 24.2 36.2 11.2 16.1 44.1
Asia Stan 4.5 7.7 71.5 2.8 4.1 47.1
India 26.7 32.3 21.0 25.4 30.9 21.4
Other Southern Asia 11.2 14.4 28.8 7.8 10.4 32.3
China 45.7 64.3 40.7 44.2 68.5 54.9
Japan 2.3 1.8 -20.4 13.8 12.1 -12.6
Other Eastern Asia 2.7 3.1 13.8 5.0 5.9 18.6
Southeastern Asia 23.2 31.3 34.9 18.9 26.1 37.9
Oceania 6.4 6.4 0.5 4.8 4.5 -5.3
Total 289.3 348.5 20.5 289.3 348.5 20.5

© 2018 American Geophysical Union. All rights reserved.
Table 2
Trade-related CH4 emission changes of 19 integrative economies between 2000 and 2012 (Tg)
Economy
Intermediate trade change Final trade change Change of net trade
(MEEB) MEIM MEEX MEIM MEEX
Canada 0.5 -0.2 0.2 -0.1 1.0
USA -0.6 0.8 -1.0 0.4 -2.7
Central America 0.2 0.9 0.2 0.1 -0.6
Brazil 0.9 0.5 0.2 0.3 0.3
Rest South America 0.6 1.6 0.5 0.3 -0.9
Northern Africa 0.2 0.0 0.2 0.1 0.3
Sub-Saharan Africa 0.2 -1.7 0.4 0.2 2.0
Western Europe 6.4 6.2 1.6 1.8 -0.2
Russia 1.1 3.3 0.6 0.0 -1.6
Rest Europe 4.3 1.9 1.2 0.6 2.9

© 2018 American Geophysical Union. All rights reserved.
Middle East 2.0 4.3 1.1 0.3 -1.5
Asia Stan 0.2 1.8 0.2 0.5 -1.9
India 1.3 1.3 0.6 0.8 -0.2
Other Southern Asia 0.1 0.5 0.1 0.4 -0.7
China 9.1 3.5 2.0 1.9 5.7
Japan -0.2 0.8 -0.2 0.1 -1.3
Other Eastern Asia 2.6 2.2 0.3 0.3 0.5
Southeastern Asia 1.9 2.5 0.4 0.6 -0.9
Oceania 0.0 0.4 0.3 0.2 -0.3