container monitoring and management - ca.com · management/orchestration ... container architects...
TRANSCRIPT

vol.5
EDITED & CURATED BY ALEX WILLIAMS
MONITORING
MANAGEMENT
CONTAINER
&
The New Stack:Container Monitoring & Management
Alex Williams, Founder & Editor-in-Chief
Benjamin Ball, Technical Editor & Producer
Gabriel H. Dinh, Creative Director
Lawrence Hecht, Data Research Director
Contributors: Scott M. Fulton, III, Ebooks Editor
Judy Williams, Copy Editor
Luke Lefler, Audio EngineerNorris Deajon, Audio Engineer

3Ĵ CONTAINER MONITORING & MANAGEMENT
TABLE OF CONTENTSSponsor .......................................................................................................................................... 4
Introduction .................................................................................................................................. 5
CONTAINER MONITORING & MANAGEMENT
Monitoring Reset for Containers................................................................................................ 9
Classes of Container Monitoring .............................................................................................24
CA Technologies: Future-Proof Docker with Modern Monitoring .....................................40
Identifying and Collecting Container Data ............................................................................41
The Right Tool for the Job: Picking a Monitoring Solution ................................................55
Managing Intentional Chaos: Succeeding with Containerized Apps ...............................62
CONTAINER MONITORING DIRECTORY
Container-Related Monitoring .................................................................................................70
Components/Classes of Monitoring Systems ......................................................................74
Management/Orchestration ...................................................................................................78
Miscellaneous .............................................................................................................................80
Disclosures ...................................................................................................................................83
4Ĵ CONTAINER MONITORING & MANAGEMENT
SPONSORWe are grateful for the support of CA Technologies.
5Ĵ CONTAINER MONITORING & MANAGEMENT
INTRODUCTIONIn time, containers will be the means by which all workloads are deployed
on server platforms. It makes too much sense. Constructing fake machines around virtual workloads, just to make them portable across
servers, was not the architecturally rational thing to do. It was the expedient thing to do, because cloud platforms had not yet evolved to where they needed to be.
Today, enterprises are leasing dedicated connections to commercial data center providers, with bandwidths greater than when their servers were kept in the downstairs broom closet. Storage is becoming so practical to own and operate that even massive data lakes are years away from
spilling over their borders. Random-access memory has stretched its boundaries so greatly that the speed of database operations has catapulted by several orders of magnitude in just a few years’ time.
For us to populate this new reality with countless instances of first generation virtual machines seems entirely silly. The only reason we’d want to do that is if we had no other choice but to continue running older software. And that, as the bard said, is the rub. The software that provides business logic for a great many organizations is too young to amortize. Though methods and techniques have changed over the last decade, the impetus to keep existing software running remains constant. In any data center we build today, the old and the new software must coexist.
This fact renders any single technique or methodology for maintenance and monitoring extremely difficult to fathom.
How We Got HereThe very first software was written specifically for the systems it ran on. The second generation used a machine-independent language, which was

6Ĵ CONTAINER MONITORING & MANAGEMENT
INTRODUCTION
compiled for the systems it would eventually run on. Over time, the complete history of software evolution, up until today, has boiled down to the introduction of more and more of these layers of abstraction, all of
which lead inevitably to the same point: machine code for consumption by processors. Containerization is a very clever way to introduce more convenience to this consumption chain, by trading off some of the natural barricade between VMs and their host systems, and with a much simpler
system of namespaces and process separation.
The real problem with containers, as it turns out, deals with containment.
We should be capable of deducing what’s in a container and how it runs, container architects first told us, simply by looking at the build file for how the engine constructs it (with Docker, this is the Dockerfile). In practice, it’s not that simple. Containerized systems are, by design, distributed. Their distribution takes place over servers whose configurations not only vary but are individually subject to change without notice. As a result, we cannot look at any pre-produced manifest for a container image and be accurately certain about what an active container image will include or how it will run.
We need to see what’s going on inside the packaging designed intentionally to obscure what’s going on. It’s a tricky request, because creating lines of visibility could conceivably create avenues for vulnerability. And for many organizations, there’s not only a precise definition of monitoring, but a standard sequence of events that must take place to remain compliant — a sequence created for the era of virtual machines and hypervisors.
The objective of monitoring containers is to assess the status and health of their workloads. By stark contrast, the objective of monitoring virtual machines is to assess the performance of the virtualized systems within which workloads are emulated. We can’t just pick up the former art and

7Ĵ CONTAINER MONITORING & MANAGEMENT
INTRODUCTION
move it to the new skill set.
This book presents a snapshot of the emerging approaches to container monitoring and distributed systems management that engineers and their customers are building together.
Where Do We Begin?Containers are designed to be short lived. This raises a few questions, which are even now largely unresolved: What should we be monitoring in a containerized environment, specifically? What metrics should we use in the process? Some vendors have asserted that the final measure of the value of a cloud-based service is how fast it responds to the user, whether
through a browser or a mobile app framework. If that is indeed the case, then how can the measurements of response intervals be used to show us
how to improve them?
On the opposite side of the aisle are engineers who assert that each scaled-out, distributed system becomes so unique that the only reliable mechanism for monitoring its performance is one created specifically for it. Theoretically, if the variables that comprise the operating characteristics of a distributed service can be quantified, then the creation of such a monitoring system may indeed be automated. After all, a container engine produces an image from a build file; why can’t a monitoring engine produce a measurement scheme from a set of characteristics?
This book presents the different classes of monitoring techniques and schemes, both in discussion and as a table for direct comparison. You will
see the choices of metrics made by various platforms — choices which
may yield dissimilar, though still revealing, results. We’ll compare monitoring products you’ve heard of and several that may be completely

8Ĵ CONTAINER MONITORING & MANAGEMENT
INTRODUCTION
new to you. And with the accompanying podcast, you’ll hear a leading point of view in the container monitoring field, and find out how they interpret the current state of Docker and container monitoring.
Our sponsor for this ebook is CA Technologies. CA has been a definitive voice in workload monitoring, management and security, long before the rise of containers and distributed systems. We appreciate CA’s commitment in this area, their contributions to the insight we offer here, and to our efforts in providing a balanced, accurate perspective of how state of containerization management and monitoring impacts you and your organization.
Scott M. Fulton, III
Ebooks Editor
The New Stack
9Ĵ CONTAINER MONITORING & MANAGEMENT
MONITORING RESET FOR CONTAINERSby LAWRENCE HECHT
Monitoring is not a new concept, but a lot has changed about the systems that need monitoring and which teams are responsible for it. In the past, monitoring used to be as simple as checking if
a computer was still running. Cobe Chief Technical Officer (CTO) Dave Charles remembers monitoring as simple instrumentation that came
alongside a product.
As James Turnbull explains in The Art of Monitoring, most small
organizations didn’t have automated monitoring — they instead focused on minimizing downtime and managing physical assets. At companies that actually had IT staff, operations teams used simple tools to check on disk, central processing unit (CPU) and memory usage, but focused mostly on dealing with emergencies related to availability. Larger organizations eventually replaced the manual approach with automated monitoring systems that utilized dashboards.
Even without the introduction of containers, recent thought leaders have advocated that monitoring should more proactively look at ways to improve performance. To get a better view of the monitoring environment,

10Ĵ CONTAINER MONITORING & MANAGEMENT
MONITORING RESET FOR CONTAINERS
we reviewed a survey James Turnbull conducted in 2015. Although it is a snapshot of people that are already inclined to care about monitoring, it provides many relevant insights.
Expectations of time and effort needed for monitoring is changing. With the current prevalence of automated systems, users often want to reduce the time needed to setup a monitoring tool and trying to find the problem in their stack. While monitoring may always been relatively time consuming, there are approaches that can improve the overall experience.
What’s Different With ContainersTo understand how to monitor containers and their related infrastructure,
you need to understand what is different about containers. There are aspects of containerized environments that change previously established monitoring practices and the efficiency of traditional monitoring solutions. Understanding these changes will help explain how vendors are shifting to create new products to address changing metrics and a new, varied team of users involved in monitoring. The monitoring changes that come with containers can be explained in five points:
1. The ephemeral nature of containers.
2. The proliferation of objects, services and metrics to track.
3. Services are the new focal point of monitoring.
4. A more diverse group of monitoring end-users.
5. New mindsets are resulting in new methods.
Ephemerality and Scale of ContainersCloud-native architectures have risen to present new challenges. The temporary nature of containers and virtual machine instances presents

11Ĵ CONTAINER MONITORING & MANAGEMENT
MONITORING RESET FOR CONTAINERS
tracking challenges. As containers operate together to provide microservices, they are in effect a distributed system. While distributed systems are not necessarily transitory at larger scales, they require targeting of many moving parts. This requires new methods of monitoring to make observations about their health. Due to their ephemeral nature and growing scale, it doesn’t make sense to track the the health of individual containers; instead, you should track clusters of containers and services.
Traditional approaches to monitoring are based on introducing data collectors, agents or remote access hooks into the systems for monitoring. They do not scale out for containers due to the additional complexity they introduce to the thin, application-centric encapsulation
of containers. Neither can they catch up to the provisioning and dynamic scaling speed of containers.
In the past, people would look at a server to make sure it was running. They would look at its CPU utilization and allocated memory, and track network bottlenecks with I/O operations. The IT operator would be able to know where the machine was, and easily be able to do one of two
things. First, they could point an instrument to that specific location and collect data. In monitoring language, this is called polling a machine. Alternatively, an agent can be installed on the server, which then pushes data to a monitoring tool.
This push approach has achieved popularity because the ephemeral
nature of containers and virtual instances makes it difficult to instrument tools to find and poll them. It also reduces the amount of intrusion or tainting of applications. This monitoring approach benefits from the key observability characteristics of containers, and enables
solutions that operate efficiently, seamlessly and without intrusion to container execution.

12Ĵ CONTAINER MONITORING & MANAGEMENT
MONITORING RESET FOR CONTAINERS
Proliferation of Objects, Services and MetricsThe explosion of data being generated is a well known phenomenon. Ten years ago, people cared about how to store all that data. More recently, the focus has been on how to best utilize that data without storing it all. With the rise of Internet of Things (IoT) sensors and container adoption, there are now more and more objects than ever to monitor. While there is
an instinct to try to corral all these objects into a monitoring system, others are attempting to identify new units of measurement that can be more actionable and easily tracked.
The abundance of data points, metrics and objects that need to be
tracked is a serious problem. Streaming data presents many opportunities for real-time analytics, but it still has to be processed and stored. There
are technical solutions that can handle the scale, but at significant cost to both finance and performance. While NoSQL and other next-generation databases have established their place in the IT ecosystem, they are not
optimized for this use case; time series databases is a potential solution for storage. However, companies can’t just store their log data indefinitely; much of the data is never used. Some older log files are never looked at, motivating users to focus less on log management tools and more on metrics, which is data collected in aggregate or at regular intervals.
Per Host Metrics ExplosionComponent # of Metrics for a
Traditional Stackfor 10 Container Cluster with 1 Underlying Host
for 100 Container Cluster with 2 Underlying Hosts
Operating System 100 100 200
Orchestrator n/a 50 50
Container n/a 500 (50 per container) 5,000 (50 per container)
Application 50 500 (50 per container) 5,000 (50 per container)
Total # of Metrics 150 1,150 10,250
TABLE 2: Containers means more metrics than traditional stacks.

13Ĵ CONTAINER MONITORING & MANAGEMENT
MONITORING RESET FOR CONTAINERS
Containers present two problems in terms of data proliferation. Compared
to traditional stacks, there are more containers per host to monitor and
the number of metrics per host has increased. As CoScale CEO Stijn Polfliet describes it, there would traditionally be 150 metrics to track per host: 100 about the operating system and 50 about an application. With containers, you’re adding an additional 50 metrics per container and 50 metrics per orchestrator on the host. Considering a scenario where there a cluster is running 100 containers on top of two underlying hosts, there would be over 10,000 metrics to track (Table 2).
With so much potential data to collect, users focus on metrics. As
Honeycomb co-founder and engineer Charity Majors wrote, “Metrics are usually bucketed by rollups over intervals, which sacrifices precious detail about individual events in exchange for cheap storage. Most companies are drowning in metrics, most of which never get looked at again. You cannot track down complex intersectional root causes without context,
and metrics lack context.” Even though metrics solve many operations problems, there’s still too many of them, and they’re only useful if they’re actually utilized.
Services Are the New Focal PointWith a renewed focus on what actually needs to be monitored, there are
three areas of focus: the health of container clusters; microservices; and applications.
Assessing clusters of containers — rather than single containers — is a better way for infrastructure managers to understand the impact services will have. While it’s true that application managers can kill and restart individual containers, they are more interested in understanding which clusters are healthy. Having this information means they can deploy the cluster to a different infrastructure or add additional resources to support its optimal operation. Container orchestration solutions help by allowing

14Ĵ CONTAINER MONITORING & MANAGEMENT
MONITORING RESET FOR CONTAINERS
for efficient scheduling of containers on clusters of hosts.
Many microservices are composed of multiple containers. A common
example is a microservice composed of five different containers, each running a different process. If one goes down, another can pop up in its place. However, if this failure is a consistent pattern in the long-term, there will be a degradation of the service. Looking at the microservice as a unit can provide insight into how an entire application is running.
According to CA Technologies SVP Product Management Sushil Kumar, in an interview with The New Stack on modern application monitoring considerations, “cross-functional DevOps teams and Site Reliability Engineers need insight into the services running within and across containers. An aggregated view of performance across microservices, apps and containers is key to ensuring a flawless customer experience.
Critical to this is massively scalable metric capture, including API communication and latency, traffic, errors and utilization as they relate to specific applications; analytics to remove noise and correlate information across the highly dynamic container and application fabric; and visually tracking services and the dependencies between containerized microservices.”
More Diverse Group of Monitoring End-UsersThe focus on monitoring applications instead of just infrastructure is happening for two reasons. First, a new group of people is involved in the monitoring. Second, applications are more relevant to overall business performance.
Monitoring is still generally reactive, despite progress in recent years. It’s focused on the objectives of the IT team managing the actual infrastructure. This mindset does a disservice to developers because they
generally receive data secondhand. Developers are increasingly being held

15Ĵ CONTAINER MONITORING & MANAGEMENT
MONITORING RESET FOR CONTAINERS
accountable for applications once they have been put into production. As
Todd DeCapua and Shane Evans’s Effective Performance Engineering
notes, developers are being asked to “deliver the highest quality and performing product, and provide continuous feedback and optimization recommendations, so other teams can deliver quickly and in fully automated ways.”
The DevOps movement has risen, at least in part, as a response to developers’ desire for increased visibility throughout the full application life cycle. Now, DevOps roles are often the full stack managers and operators of applications.
Different roles care about different parts of the monitoring process. Our analysis of the aforementioned Turnbull survey of IT professionals that
care about monitoring shows that beyond servers, their areas of interest vary significantly. The data shows a break between the developer and DevOps roles. Based on the survey, 48 percent of developers monitor cloud infrastructure, which is significantly below the 65 percent reported by DevOps roles.
The biggest differences are between DevOps and other IT staff. The data showed that 72 percent of system admins and IT Ops roles monitor networking infrastructure, which is about 20 percentage points higher than the developers and DevOps groups. On the reverse side, 70 percent of developers and 75 percent of DevOps roles monitor application logic, compared to only 59 percent of the IT operations- oriented respondents.
DevOps roles care as much about applications as they do infrastructure, but they care more about performance than availability. As James
Turnbull writes in The Art of Monitoring:

16Ĵ CONTAINER MONITORING & MANAGEMENT
MONITORING RESET FOR CONTAINERSMonitored Environments Differ Per Role
Source: The New Stack Analysis of a 2015 James Turnbull survey. Which of the following best describes your IT job role? What parts of your
environment do you monitor? Please select all the apply. Developers, n=94; DevOps, n=278; Sysadmin/Operations/SRE, n=419.
0 20% 40% 60% 80% 100%
Developer
DevOps
Sysadmin/Operations/SRE
Business Logic
Application Logic
Network Infrastructure
Cloud Infrastructure
Server Infrastructure87%89%
94%
48%65%
53%
50%56%
72%
70%75%
59%
38%38%
27%
FIG 1: DevOps care more about monitoring cloud infrastructure (65 percent) and ap-
plication logic (75 percent) as compared to their IT operations-focused peers.
“Orienting your focus toward availability, rather than quality and
service, treats IT assets as pure capital and operational expenditure.
They aren’t assets that deliver value, they are just assets that need to
be managed. Organizations that view IT as a cost center tend to be
happy to limit or cut budgets, outsource services, and not invest in
new programs because they only see cost and not value.”
Luckily, we’ve seen a trend over the last few years where IT is less of a cost center and more of a revenue center. Increased focus on
performance pertains to both IT and the business itself. Regarding IT, utilization of storage or CPU resources is relevant because of their associated costs. From the perspective of the business itself, IT used to
only care about availability and mean time to resolve (MTTR). While

17Ĵ CONTAINER MONITORING & MANAGEMENT
MONITORING RESET FOR CONTAINERS
availability and resolvability are still critical, new customer-facing metrics are also important.
Along with DevOps, the practice of site reliability engineering (SRE) will affect how monitoring tools are used. From this perspective, monitoring will still largely be managed by an operations team, but responsibility for ensuring new applications and services are monitored may be delegated to application developers. Shariq Rizvi, co-founder of Netsil, said in an interview with The New Stack that SREs and DevOps engineers are different from software engineers. He believes SRE teams should split up the management of services, thus creating more specialization. Dan Turchin, co-founder and chief product officer of Neva, said in an interview with The New Stack that he believes DevOps positions are replacing network operations center (NOC) engineers, who were traditionally looking at things from a data center perspective. If the old-school networking stats are being displaced by cloud infrastructure metrics, then this may be true.
The market is responding to this changing landscape. CA Technologies added the “perspectives” functionality to their solution, which allows
teams to view and administer using any combination of grouping attributes. A major monitoring benefit of this approach is that it significantly simplifies and distills the data into views that are customizable by roles, tasks or services — essentially allowing data to be presented in context. Another example of role-based monitoring is playing out in the Kubernetes world, where the project has been redesigning its dashboard based on the differing needs of application developers, application operators and cluster operators.
New Mindset, New MethodsAlthough monitoring is changing to meet the needs of different job roles, it is also moving to a more holistic approach. As Majors wrote on her blog,

18Ĵ CONTAINER MONITORING & MANAGEMENT
MONITORING RESET FOR CONTAINERS
instead of relying on a fixed set of questions and checks, people should move towards the “observability” of systems. This has to happen because those fixed data points will not provide the needed insights alone. New tools are needed to keep pace and provide the ability to predict what’s going to break. Many of these tools use machine learning and analytics.
Observability recognizes that testing won’t always identify the problem. Thus, Majors believes that “instrumentation is just as important as unit tests. Running complex systems means you can’t model the whole thing in your head.” Besides changes in instrumentation, she suggests focusing on making monitoring systems consistently understandable. This means actually defining what the data represents and using the same definitions as your peers do both within and outside the organization. Furthermore, there is a frustration with the need to scroll through multiple, static dashboards. In response, vendors like CA Technologies are making more intuitive, interactive dashboards. Companies are even using artificial intelligence to determine what information displays when for each service.
Approaches to Address the New RealityIncreasing automation and predictive capabilities are common approaches to address new monitoring challenges.
Increasing automation centers around reducing the amount of time it takes to deploy and operate a monitoring solution. According to Steven Acreman, founder and Chief Technical Officer of Dataloop.IO, in an interview with The New Stack, the larger the organization, the more likely it will require customized solutions that can collect and integrate data from all their inputs and applications. Vendors are trying to reduce the number of steps required in the setup process. This might mean that once a monitoring agent is installed on a host, you don’t have to think about it. More likely, it means that the tools have the ability to auto-discover new
19Ĵ CONTAINER MONITORING & MANAGEMENT
MONITORING RESET FOR CONTAINERS
applications or containers.
You also want to automate how you respond to problems. For now, there
is a difference between automating certain tasks and automation that takes humans entirely out of the equation. Monitoring systems continue to create automated alerts, but now the alerts are more sophisticated. As
James Turnbull notes, alerting will be annotated with context and recommendations for escalations. Systems can reduce the amount of
unimportant alerts, which mitigates alert fatigue and increases the likelihood that the important alerts will be addressed. For now, the focus
is getting the alerts to become even more intelligent. Thus, when someone gets an alert, systems display actionable information and workflows needed to quickly pinpoint problems and assist triage efforts.
Automating the container deployment process is also related to how you monitor it. It is important to be able to track the setting generated by your configuration management. This is where container orchestrators can help. Kubernetes, Mesos and Cloud Foundry all enable auto-scaling.
Just as auto-scaling is supposed to save time, so is automating the recognition of patterns. Big Panda, CA Technologies, CoScale, Dynatrace,
Elastic Prelert, IBM Bluemix, Netsil and SignalFx are just a few of the
companies that use artificial intelligence to identify patterns and detect anomalies. A common result is that much of the noise created by older
monitoring approaches gets suppressed. In an interview with The New Stack, Peter Arjis of CoScale says anomaly detection means you don’t have to watch the dashboards as much. The system is supposed to
provide early warnings by identifying patterns of behavior among how different services, applications and infrastructure behave.
For example, CA Technologies APM solution uses analytics and machine learning to detect anomalies, identify the root cause of problems and
20Ĵ CONTAINER MONITORING & MANAGEMENT
MONITORING RESET FOR CONTAINERS
build automated triage workflows. By employing proven statistical techniques, CA APM dynamically builds performance baselines across groups of microservices. If a threshold is surpassed or anomaly detected, then engineers get both alerted and presented with an assisted triage dashboard. This approach eliminates the traditional practice of manually
predicting acceptable performance baselines — which are unsustainable in microservice environments and often result in “event storms.”
Finding the Most Relevant MetricsThe number of container-related metrics that can be tracked has increased
dramatically. Since the systems are more complex and decoupled, there is
more to track in order to understand the entire system. This dramatically
changes the approach in monitoring and troubleshooting systems. Traditionally, availability and utilization of hosts is measured for CPUs, memory, I/O and network traffic. Although these are still important for managing IT infrastructure, they do not provide the best frame of reference for evaluating what metrics to collect.
Although there are many different layers in this IT environment, services are a key unit of observation. Service health and performance is directly
related to application performance. Services can be defined with common names, with their health and performance benchmarked over
time. Services, including microservices running in containers, can be tracked across clusters. Observing clusters of services is similar to looking at the components of an application.
Google’s book on Site Reliability Engineering claims there are four key
signals to look at when measuring the health and performance of services: latency, traffic, errors and saturation. Latency describes the time it takes to service requests. Within a container, it can be helpful to look at how slowly API calls are handled. Traffic and errors are both commonly

21Ĵ CONTAINER MONITORING & MANAGEMENT
MONITORING RESET FOR CONTAINERS
tracked, and refer to the communicating and networking of services and the frequency of errors. Saturation describes how “full” the service is and emphasizes the most constrained resources. It is becoming a more popular way to measure system utilization because service performance degrades as they approach high saturation.
Using this viewpoint, we can see what types of metrics are most important throughout the IT environment. Information about containers is not an end unto itself. Instead, container activity is relevant to tracking infrastructure utilization as well as the performance of applications and infrastructure. Metrics about the saturation and latency of requests within a container are most relevant. Metrics about the health of
individual containers will continue to be relevant. However, in terms of
managing containers, measuring the health of clusters of containers will become more important.
It’s important to remember that you’re not just monitoring containers, but also the hosts they run on. Utilization levels for the host CPU and memory can help optimize resources.
As Sematext DevOps Evangelist Stephan Thies wrote, “when the resource usage is optimized, a high CPU utilization might actually be expected and even desired, and alerts might make sense only for when CPU utilization drops (service outages) or increases for a longer period over some max limit (e.g., 85%).”
In the past, it was possible to benchmark host performance based on
the number of applications running on it. If environments weren’t dynamic, with virtual instances being spun up and down, then it would be possible to count the number of containers running and compare it to historical performance. Alas, in dynamic environments, cluster managers are automatically scheduling workloads, so this approach is not possible.

22Ĵ CONTAINER MONITORING & MANAGEMENT
MONITORING RESET FOR CONTAINERS
Questions to Ask When Deciding What Metrics to MonitorQuestions Sample Metrics
MicroserviceIn general, there is one process to track per container.
Where are new services deployed?
What percentage of time is the service reachable?
How many requests are enqueued?
Average percentage of time a request-servicing thread is busy.
Number of enqueued requests.
Percentage of time a service is reachable.
ApplicationMultiple microservices running simultaneously constitute an application.
Do the databases respond quickly?
Are the message queues fast enough?
How does heap memory usage change over time?
Are my application services responsive?
Query execution frequency, response time and failure rate.
Response time, failure rate.
ContainerSeparate from the underlying process being run within it, containers are also monitored.
How responsive are the processes withinthe container?
Which images have been deployed?
Are specific containers associated with over-utilization of hosts?
CPU throttle time.
Container disk I/O.
Memory usage.
Network (volume, dropped packets).
Container ClusterMultiple containers deployed to run as a group. Many of the metrics for individual containers can also be summarized.
Are your clusters healthy and properly sized?
Can applications be effectively run using fewer nodes?
Percentage of clusters remaining operational compared to those originally deployed.
HostAlso called a node, multiple hosts can support a cluster of containers.
Do changes in utilization indicate a problem with a process or application?
Percentage of total memory capacity in use.
Percentage of time CPUs are utilized.
InfrastructureBroadly speaking, this is the cloud in which the hosts are running.
How much does it cost to run each service or deployment?
What is the ratio of microservices and/or containers per instance?
Network traffic.
Utilization of databases, storage, and other shared services.
End UserThe end goal of the entire system is to serve this group.
What is the average web response time experienced by users per region?
Response time.
Number and percentage of user actions that failed.
TABLE 3: Saturation and latency related metrics are the most relevant when monitor-
ing microservices-based applications. Instead of looking at individual services and
containers, dashboards and alerts should focus on their operation in aggregate.

23Ĵ CONTAINER MONITORING & MANAGEMENT
MONITORING RESET FOR CONTAINERS
Instead, observing the larger IT environment for anomalies is becoming a way to detect problems.
The Next StepsThe biggest changes in IT monitoring are the new groups involved and the new metrics they are using. IT operations still care about availability and cost optimization. DevOps and application developers focus on the performance of services. Everyone, especially the chief information
officer, cares about the impact on business operations and customer interactions.
Of course, there are new metrics that have to be monitored. The Identifying and Collecting Container Data chapter provides an overview of
how to collect this data. All of these metrics can be collected in different ways. Classes of Container Monitoring details the different components of an effective monitoring stack. From collection to logging to visualization, there are unique technical challenges to monitoring containers and microservices. Looking at next steps, The Right Tool for the Job: Picking a Monitoring Solution provides important criteria to think about.

24Ĵ CONTAINER MONITORING & MANAGEMENT
CLASSES OF CONTAINER MONITORINGby BRIAN BRAZIL
Before we talk about container monitoring, we need to talk about the word “monitoring.” There are a wide array of practices consid-
ered to be monitoring between users, developers and sysadmins in different industries. Monitoring — in an operational, container and cloud-based context — has four main use cases:
• Knowing when something is wrong.
• Having the information to debug a problem.
• Trending and reporting.
• Plumbing.
Let’s look at each of these use cases and how each obstacle is best approached.
Knowing When Something is WrongAlerting is one of the most critical parts of monitoring, but an important question to ask is: What problem is worth waking up an engineer in the middle of the night to look at? It’s tempting to create alerts for anything
25Ĵ CONTAINER MONITORING & MANAGEMENT
CLASSES OF CONTAINER MONITORING
that’s a red flag or even slightly troublesome, but this can quickly lead to alert fatigue.
Let’s say you’re running a set of user-facing microservices, and you care about the latency of requests. Would central processing unit (CPU) usage on each machine be useful to alert on? The alert will likely flag you that you’re running out of CPU capacity on the machine. It will also have false positives when background processes take a little longer than usual, and false negatives for deadlocks or not having enough threads to use all CPUs.
The CPU is the potential cause of the problem, and high latency is the symptom you are trying to detect. In My Philosophy on Alerting, Rob
Ewaschuk points out that there are many potential causes, and it’s difficult to enumerate all of them. It’s better to alert on the symptoms instead, as it results in fewer pages that are more likely to present a real problem worth waking someone up over. In a dynamic container environment where machines are merely a computing substrate, alerting on symptoms rather than causes goes from being a good idea to being essential.
Having the Information to Debug a ProblemYour monitoring system now alerts you to the fact that latency is high. Now what do you do? You could go login to each of your machines, run the top command, check syslog and start tailing application logs. That’s not going to get you anywhere fast though, and it will lose effectiveness as your traffic and infrastructure grows. What your monitoring needs to provide is a way for you to approach problems methodically, giving you the tools you need to narrow down issues.
Microservices can typically be viewed as a tree, with remote procedure
calls (RPCs) flowing from the top to the bottom. A problem of high latency in a service is usually caused by a delay in that service or one of its
backends. Rather than trying to get inspiration from hundreds of graphs

26Ĵ CONTAINER MONITORING & MANAGEMENT
CLASSES OF CONTAINER MONITORING
FIG 1: Component routing in a microservice.
Database
AuthenticationServer
Frontend
HTTPRouting
AuthorizationLibrary
BusinessLogic
DatabaseLibrary
Microservice Routing
Source: Brian Brazil
Middleware
on a dashboard, you can go to the dashboard for the root service and check for signs of overload and delay in its backends. If the delay is in a backend, you repeat the process until you find the service responsible.
That process can be taken a step further. Just like how your microservices
compose a tree, the subsystems, libraries and middleware inside a single microservice can also be expressed as a tree. The same symptom
identification technique can then be applied to further narrow down the issue. To continue debugging from here, you’ll likely use a variety of tools to dig into the process internals, investigate patterns in request logs and cross-correlate requests across machines.
Trending and ReportingAlerting and debugging tend to be on the timescale of minutes to days. Trending and reporting care about the weeks-to-years timeframe.

27Ĵ CONTAINER MONITORING & MANAGEMENT
CLASSES OF CONTAINER MONITORING
A well-used monitoring system collects all sorts of information, from raw hardware utilization and counts of API requests to high-level business metrics. There are the obvious use cases, such as provisioning and capacity planning to be able to meet future demand, but beyond that there’s a wide selection of ways that data can help make engineering and business decisions.
Knowing how similar requests are to each other might point to the benefit of a cache, or it might help argue for removing a cache for simplicity. Knowing how each request uses your limited resources can help determine your pricing model. Cross-service and cross-machine statistics can help you spend your time on the best potential optimizations. Your monitoring systems should empower you to make these analyses possible.
PlumbingWhen you have a hammer, everything starts to look like a nail.
Plumbing is different from the other use cases, as it’s about getting data from system A to system B, rather than directly supporting responsive decision making. An example might be sending data on the number of sales made per hour to a business intelligence dashboard. Plumbing is about facilitating that pipeline, rather than what actions are taken from the end result. It’s not necessarily monitoring; however, it’s often convenient to use your monitoring system to move some data around to where it needs to go.
If building a tailored solution from scratch could take weeks, and it’s effectively free to use your monitoring system for the same thing, then why not? When evaluating a monitoring system, don’t just look at its ability to do graphing and alerting, but also how easy it is to add custom data sources and extract your captured data later.
28Ĵ CONTAINER MONITORING & MANAGEMENT
CLASSES OF CONTAINER MONITORING
Classes of MonitoringNow that we’ve established some of what monitoring is about, let’s talk about the data being inserted into our monitoring systems. At their core, most monitoring systems work with the same data: events. Events are all activities that happen between observation points. An event could be an
instruction being executed, a function call being made, a request being routed, a remote call procedure (RPC) being received or a response being returned. Events have contextual information, such as what triggered them and what data they’re working with.
We’re going to look at four different ways to use events; each approach makes different tradeoffs and gives you a different view of the system. A complete monitoring system will have aspects of each approach.
MetricsMetrics, sometimes called time series, are concerned with events
aggregated across time. They count how often each type of event happens, how long each type of event takes and how much data was processed by the event type.
Metrics largely don’t care about the context of the event. You can add context, such as breaking out latency by HTTP endpoint, but then you need to spend resources on a metric for each endpoint. In this case, the
number of endpoints would need to be relatively small. This limits the
ability to analyze individual occurrences of events; however, in exchange, it allows for tens of thousands of event types to be tracked inside a single service. This means that you can gain insight into how code is performing throughout your application. We’re going to dig a bit deeper into the constituent parts of metrics-based monitoring. If you’re only used to one or two systems, you may not be aware of the possibilities and tradeoffs that can be made.

29Ĵ CONTAINER MONITORING & MANAGEMENT
CLASSES OF CONTAINER MONITORING
FIG 2: The architecture of gathering, storing and visualizing metrics.
VisualizationCollection Ingestion
Processingand/or
Alerting
Storage
Monitoring Metrics Pipeline
Source: Brian Brazil
PULL
CollectionCollection is the process of converting the system state and events into metrics, which can later be gathered by the monitoring system. Collection can happen in several ways:
1. Completely inside one process. The Prometheus and Dropwizard
instrumentation libraries are examples; they keep all state in memory of the process.
2. By converting data from another process into a usable format. collectd and Agentless System Crawler do this by pulling data from the proc filesystem.
3. By two processes working in concert: one to capture the events and the other to convert them into metrics. StatsD is an example,
where each event is sent from an application over the network to StatsD.
IngestionIngestion takes metrics from collection and feeds them into the monitoring system. This can be a multi-stage process involving a queueing system, such as Apache Kafka, or a simple data transfer directly from collection. It’s at this point that the push versus pull debate must be mentioned. Both

30Ĵ CONTAINER MONITORING & MANAGEMENT
CLASSES OF CONTAINER MONITORING
approaches have advantages and disadvantages. We can’t cover the extent of this debate in these pages, but the short version is that both approaches can be scaled and both can work in a containerized environment.
StorageOnce data is ingested, it’s usually stored. It may be short-term storage of only the latest results, but it could be any amount of minutes, hours or
days worth of data storage.
Once stored data goes beyond what easily fits in memory on one machine, there’s operational and reliability tradeoffs to be made, and again there are pros and cons based on what the organization requires from their monitoring data. Persisting data beyond the lifetime of a process on disk implies either a need for backups or a willingness to lose data on machine failure.
Spreading the data among multiple machines brings with it the fundamental challenges of distributed systems. It’s not difficult to end up with a system where existing data is safe, but new data cannot be ingested and processed.
Processing and AlertingData isn’t of much use if you don’t do anything with it. Most metrics systems offer some way to do math on ingested data, and usually also offer a way to alert humans of anomalous conditions. This may happen as the data is ingested or as a separate asynchronous process.
The sophistication of processing between solutions varies greatly. On one end, Graphite has no native processing or alerting capability without third-party tools; however, there’s basic aggregation and arithmetic possible when graphing. On the other end, there are solutions like Prometheus or Sysdig with not only a fully-fledged processing and alerting systems, but also an additional aggregation and deduplication system for alerts.

31Ĵ CONTAINER MONITORING & MANAGEMENT
CLASSES OF CONTAINER MONITORING
VisualizationAlerts arriving at your pager is fine, but for debugging, reporting and analysis you want dashboards to visualize that data.
Visualization tools tend to fall into three categories. At the low end, you have built-in ways to produce ad-hoc graphs in the monitoring system itself. In the middle, you have built-in dashboards with limited or no
customization. This is common with systems designed for monitoring only one class of system, and where someone else has chosen the dashboards
you’re allowed to have. Finally, there’s fully customizable dashboards where you can create almost anything you like.
How They Fit TogetherNow that you have an idea of the components involved in a metrics
monitoring system, let’s look at some concrete examples of the tradeoffs made by each.
Nagios
The Nagios server usually calls out to scripts on hosts — called checks —
and records if they work according to their exit code. If a check is failing, it sends out an alert. Visualization is typically offered by a separate built-in dashboard. It can ingest 1KB of data, including metrics (called “perfdata”), from the script and pass it on to another monitoring system.
COLLECTION INGESTION ALERTING VISUALIZATION
MultisiteOn-HostChecks Nagios
Nagios Architecture
Source: Brian Brazil
PULLPULL
ALERT
FIG 3: Metrics handling with Nagios.

32Ĵ CONTAINER MONITORING & MANAGEMENT
CLASSES OF CONTAINER MONITORING
Nagios is designed for static setups, which requires a restart to load a new configuration. Its limited processing, focus on host-based monitoring, and ability to only handle small amounts of metrics data makes it unsuitable
for monitoring in a container environment. However, it remains useful for basic blackbox monitoring.
collectd, Graphite and Grafana
Many common monitoring stacks combine several components together. A collectd, Graphite and Grafana combination is an example of such.
collectd is the collector, pulling data from the kernel and third-party applications such as MySQL. To collect custom metrics from your own applications, you’d use the StatsD protocol, which sends user data protocol (UDP) packets to collectd for individual events. collectd sends metrics to Carbon, which uses a Whisper database for storage. Finally, both Graphite and Grafana themselves can be used for visualization.
The StatsD approach to collection is limiting in terms of scale; it’s not unusual to choose to drop some events in order to gain performance. The collectd per-machine approach is also limiting in a containerized environment. For example, if there are MySQL containers dynamically deployed, then the per-machine collectd needs its configuration updated each time.
COLLECTION INGESTION STORAGE VISUALIZATION
PULLSTATSD
PROTOCOL
PULL
Carbon-Relay
Whisperdatabase
Graphite-Web GrafanaApp collectd
Example Monitoring Architecture
Source: Brian Brazil
FIG 4: An example monitoring stack composed of collectd, Graphite, Grafana.

33Ĵ CONTAINER MONITORING & MANAGEMENT
CLASSES OF CONTAINER MONITORING
As alerting is not included, one approach is to have a Nagios check for each individual alert you want. The storage for Graphite can also be challenging to scale, which means your alerting is dependent on your storage being up.
Prometheus
Prometheus takes a different approach than our previous examples. Collection happens where possible inside the application. For third-party
applications where that’s not possible, rather than having one collector per machine, there’s one exporter per application. This approach can be easier to manage, at the cost of increased resource usage. In containerized environments like Kubernetes, the exporter would be managed as a sidecar container of the main container. The Prometheus server handles
ingestion, processing, alerting and storage. However, to avoid tying a distributed system into critical monitoring, the local Prometheus storage
COLLECTION INGESTION
STORAGE,
PROCESSING &
ALERTING VISUALIZATION
GrafanaApplication Prometheus
Alertmanager
Prometheus Architecture
Source: Brian Brazil
PULL PULL
ALERT
NOTIFICATIONS
TO DEVICES/USERS
FIG 5: Metrics handling in Prometheus.

34Ĵ CONTAINER MONITORING & MANAGEMENT
CLASSES OF CONTAINER MONITORING
is more like a cache. A separate, non-critical distributed storage system handles longer term storage. This approach offers both monitoring reliability and durability for long-term data.
While Prometheus decides what alerts to fire, it does not send emails or pages to users. Alerts are, instead, sent to an Alertmanager, which deduplicates and aggregates alerts from multiple Prometheus servers, and sends notifications.
CA Application Performance Management
The previous sections show how some open source solutions are
architected. For a comparison, this section describes the architecture of
CA Application Performance Management (CA APM), a leading commercial solution. CA APM is tailored to handle the ephemeral nature and telemetry
monitoring challenges associated with next generation container environments. By combining agentless metric collection at a cluster level with a Docker flow mapping service, which leverages TCP dump analysis,
CA Application Performance Management Architecture
Source: CA Technologies
COLLECTION INGESTION STORAGE, PROCESSING & ALERTING VISUALIZATION
AppContainer
AppContainer
Agentless Instrumentation
Host / Kernel
Agent Instrumentation CA Application Performance Management
API
APM Database
CA APMTeam CenterDashboards
VISUALIZE
lo De enden ies Metri s lerts r es n l ti s rends imelines
FIG 6: Taking a look at CA Technologies’ commercial architecture.

35Ĵ CONTAINER MONITORING & MANAGEMENT
CLASSES OF CONTAINER MONITORING
CA APM surfaces important service-level metrics in the context of dynamic
microservice relationships and container dependencies that typify
distributed application architectures.
In cases where instrumentation is required within containerized applications, CA APM also provides a comprehensive agent to capture detailed application-specific metrics and transaction trace information. By seamlessly working with the agentless service, deeper instrumentation automatically enriches discovered Docker topology views with granular information and analytics services, including: differential analysis (for automated baselining and anomaly detection), assisted triage (automated root-cause analysis and remediation workflows), and dynamic visualization using Docker environmental attributes.
Using RESTful APIs, CA APM can ingest monitoring data from other sources, including, but not limited to, infrastructure and network monitoring. Additionally, CA APM’s open and flexible data model enables these data sources to be correlated and presented in context of Docker
application service views and metrics.
CA APM is available on-premise and as a component of CA’s Digital Experience Insights—a SaaS-based digital experience monitoring and “cross-tier” analytics solution. It offers an integrated set of mobile and web end-user (app experience analytics), application performance, and infrastructure management services to provide a holistic view into user experience, business transactions, and quality of service across digital and modern infrastructure, including Docker.
LogsLogs, sometimes called event logs, are all about the context of individual events. How many requests went to an endpoint? Which users are using or calling an endpoint?

36Ĵ CONTAINER MONITORING & MANAGEMENT
CLASSES OF CONTAINER MONITORING
Logs make the opposite tradeoff to metrics. They don’t do any aggregation over time. This limits them to tracking around fifty to a hundred pieces of information per event before bandwidth and storage costs tend to become an issue. Even with this limitation, logs usually allow you to find patterns in individual requests, such as if particular users are hitting expensive code paths.
It’s important to distinguish the type of logs you are working with, as they have a variety of different uses and reliability requirements:
• Business and transaction logs: These are logs you must keep safe at all costs. Anything involved with billing is a good example of a business or transaction log.
• Request logs: These are logs of every request that comes through your system. They’re often used in other parts of the system for optimization and other processing. It’s bad to lose some, but not the end of the world.
• Application logs: These are logs from the application regarding general system state. For example, they’ll indicate when garbage collection or some other background task is completed. Typically, you’d want only a few of these log messages per minute, as the idea is that a human will directly read the logs. They’re usually only needed when debugging.
• Debug logs: These are very detailed logs to be used for debugging. As these are expensive and only needed in specialized circumstances, they have lower reliability requirements than application logs.
The next time someone talks to you about logs, think about which type of logs they’re talking about in order to properly frame the conversation.
37Ĵ CONTAINER MONITORING & MANAGEMENT
CLASSES OF CONTAINER MONITORING
ProfilingProfiling has the same advantages of metrics and logs. It lets you see data about individual events throughout the entire application. The disadvantage is that this tends to be very expensive to do, so it can only be applied tactically.
For example, logs have told you that a user is hitting an expensive code path, and metrics have let you narrow down which subsystem is the likely
culprit. Your next step is to profile that subsystem and see in which exact lines of code the CPU is being spent.
There are a variety of Linux profiling tools, including eBPF, gdb, iotop,
strace, tcpdump and top. There are also commercial options, like Sysdig,
which combine functionality of several of these tools into one package. You can use some of these tools on an ongoing basis, in which case it would fall under metric or logs.
Distributed TracingLet’s say you have a system with a frontend running at 310ms latency in the 95th percentile. You receive an alert saying the frontend 95th percentile latency has increased to 510ms! What do you think you’ll see in the 95th percentile latency of the culprit backend?
The answer is that you might see an increase of the same size as on the frontend, but you might not. There could be no change, or even a decrease in latency. It all depends on the correlations of the latencies.
Remember, the 95th percentile is effectively throwing 95 percent of data away, so you won’t notice changes outside of that 5 percent.
What’s going on here isn’t obvious from the latency graphs, and that’s where distributed tracing comes in. It’s a form of logging and profiling. It is particularly useful in environments such as those using containers and

38Ĵ CONTAINER MONITORING & MANAGEMENT
CLASSES OF CONTAINER MONITORING
Backend 1300ms latency
Backend 2600ms latency
Frontend310ms latency
System Latency (at 95th Percentile) Mapping
Source: Brian Brazil
FIG 7: An example system’s latency mapping.
microservices with a lot of inter-service communication.
How it works is that each individual incoming request gets a unique identifier. As the request passes through different services on different machines, that information is logged with the identifier. Each request is then stitched back together from the logs to see exactly where time was spent for each request. Due to cost of the logging, it’s sometimes only possible to trace a subset of incoming requests.
The result is a visualization of when each backend in your tree of services was called, allowing you to see where time is spent, what order requests are made in and which RPCs are on the critical path. Applied to the example in Figure 7, you’d notice that all the fast requests only hit Backend 1, while the slow requests are hitting both backends. This would tip you off that it’s the logic about communicating with Backend 2 that you need evaluate.
Many vendors are extending the capabilities of their tracing services to better support distributed application environments. One example is CA Technologies Precision API Monitoring, which traces transactions traversing gateways, across all monitored services, with correlation to

39Ĵ CONTAINER MONITORING & MANAGEMENT
CLASSES OF CONTAINER MONITORING
related back-end systems, including containers.
ConclusionIn this article, we’ve covered the use cases for monitoring, which should help you understand the problems that can be solved with monitoring. We learned about the four different ways for using events: metrics, logs, profiling and distributed tracing. In breaking down the metrics-based approach, we looked at how data is collected, ingested, stored, processed, alerted and visualized.
Now that you have a better feel for the types of monitoring systems and the problems they solve, you will be able to thoroughly evaluate many different solutions. There are many approaches to designing a monitoring system, and each have their own advantages and disadvantages. When looking to evaluate a monitoring solution, first assess whether it’s primarily based on metrics, logs, profiling or distributed tracing. From there, see what features it has that’ll fit into your overall monitoring strategy, in terms of alerts requiring intelligent human action, the information you need to debug, and to integrate with your systems.
Each solution has its pros and cons, and you’ll almost certainly need more than one tool to create a comprehensive solution for monitoring containers.
40Ĵ CONTAINER MONITORING & MANAGEMENT 40
FUTURE-PROOF DOCKER WITH MODERN MONITORING
Listen on SoundCloud. In this podcast, we
discuss the complexities of monitoring microservice architectures and applications
deployed to Docker. Sushil describes the
importance of employing an open, flexible monitoring data model for Docker. Sushil discusses modern monitoring best practices and techniques, including:
• Correlating agentless Docker monitoring with deep application
instrumentation for richer performance insights.
• Analytics-driven monitoring and machine learning to detect anomalies, predict problems and prevent alert storms.
• Shift-left monitoring techniques for optimizing performance and automating feedback loops in high-performance DevOps teams.
Trial Digital Experience Insights free for 30 days and gain access to full stack monitoring for containers and microservices, including: App Experience Analytics, Application Performance Management and Infrastructure Management.
Sushil Kumar is Senior Vice President at CA Technologies responsible
for driving product strategy and business development for CA’s Agile
Operations portfolio. Sushil defines the overall product vision and roadmap for CA’s end user monitoring, application performance management
(APM), and infrastructure management products.

41Ĵ CONTAINER MONITORING & MANAGEMENT
IDENTIFYING AND
COLLECTING CONTAINER DATAby RUSS MCKENDRICK
With the introduction of containers and microservices, moni-
toring solutions have to handle more ephemeral services and server instances than ever before. And while the infrastruc-
ture landscape has changed, operations teams still need to monitor the same information on the central processing unit (CPU), random access memory (RAM), hard disk drive (HDD), network utilization, and the avail-ability of application endpoints.
While you can use an older tool or existing monitoring service for traditional infrastructures, there are newer cloud-based offerings that can ensure monitoring solutions are as scalable as the services being built and monitored. Many of these cloud-based and self-hosted tools are
purpose-built for containers. No matter what solution or service you use,
you still need to know how you’re going to collect the metrics you’re looking to monitor.
There are quite a few options when it comes to collecting metrics from your containers. This article overviews some of the the services available
for container monitoring. We’ve included a mixture of self-hosted open

42Ĵ CONTAINER MONITORING & MANAGEMENT
IDENTIFYING AND COLLECTING CONTAINER DATA
source solutions and commercial cloud-based services to reflect the current landscape.
However, it’s important to keep in mind that we’ve included a relatively small amount of examples compared to the wide variety of solutions
available. These examples are meant to be illustrative of a few different ways to approach the problem of collecting metrics.
DockerThe Docker engine itself provides access to most of the core metrics we’re looking to collect as part of its native monitoring functions. Running the docker stats command will give you access to CPU, memory, network
FIG 1: Running the docker stats command.
and disk utilization for all of the containers running on your host.
The data streams automatically and is useful if you need to get a quick overview of your containers at any given moment. There are a few flags you can add, for example:
• The flag --all shows you stopped containers, though you won’t see any metrics for them.
• The flag --no-stream displays the output of the first run and then stops the stream of metrics.
There are some disadvantages. For one, the data isn’t stored anywhere — you can’t go back and review the metrics. It can also be tedious watching a constantly refreshing terminal with no points of reference. It’s

43Ĵ CONTAINER MONITORING & MANAGEMENT
IDENTIFYING AND COLLECTING CONTAINER DATA
hard to spot what’s going on in the data.Luckily, the docker stats
command is actually an interface to the stats API endpoint. The stats API
exposes all of the information in the stats command and more. To view for
yourself, run the following command:
curl --unix-socket /var/run/docker.sock...
http:/containers/container_name/stats
As you’ll be able to see from the output, there is a lot more information being returned, all wrapped in a JavaScript Object Notation (JSON) array, which is ready to be ingested by third-party tools.
cAdvisorcAdvisor is a container monitoring tool from Google with native support for Docker containers. It is a daemon that collects, aggregates, processes, and exports information about running containers.
The best way to think of cAdvisor is that it’s a graphical version of what you get if you were to run the docker stats --all command.
docker run \
--volume=/:/rootfs:ro \
--volume=/var/run:/var/run:rw \
--volume=/sys:/sys:ro \
--volume=/var/lib/docker/:/var/lib/docker:ro \
--publish=8080:8080 \
--detach=true \
--name=cadvisor \
google/cadvisor:latest

44Ĵ CONTAINER MONITORING & MANAGEMENT
IDENTIFYING AND COLLECTING CONTAINER DATA
cAdvisor is easy to get up and running, as it is shipped in a single container. All you have to do is run the above command to launch a
cAdvisor container and expose the web interface on port 8080.
Once launched, cAdvisor will hook itself into the Docker daemon running on your host machine and start gathering metrics for all of your running containers, including the cAdvisor container itself. Opening http://localhost:8080/ in a browser will take you straight to the web interface.
FIG 2: Accessing the localhost web interface.
As you can see from Figure 2, there is a minute’s worth of data being streamed in real time; however, you can’t view any metrics further back with just a standard installation of cAdvisor. Luckily, Google has you covered by including options to export the data from cAdvisor into time series databases such as Elasticsearch, InfluxDB, BigQuery and Prometheus.

45Ĵ CONTAINER MONITORING & MANAGEMENT
IDENTIFYING AND COLLECTING CONTAINER DATA
To sum up, cAdvisor is a great tool for getting quick insight into what’s happening with your running containers. It is simple to install and gives you more granular metrics than Docker does out of the box. It can also act as a monitoring agent for other tools in the same way that Zabbix or Nagios agents were used in the past.
PrometheusPrometheus is an open source monitoring system and time series database originally built by SoundCloud. It is currently hosted by the Cloud Native Computing Foundation (CNCF), alongside other projects such as Kubernetes and OpenTracing. Upon reading the description of the service, it may sound like quite a traditional server and agent setup; however, Prometheus works differently. Rather than having its own agent, it scrapes data from the data points on hosts, storing it in its own time series database.
At the end of October 2016, a pull request to expose a metrics endpoint in
the Docker Engine itself was merged. This likely means that an upcoming release of Docker will have support for Prometheus to scrape your
container metrics out of the box; however, until that release, you need to use an intermediary service such as cAdvisor. As of 1.13, the Docker engine supports an optional “/metrics” Prometheus endpoint. It’s important to note that this currently exposes internal Docker Engine metrics versus container metrics. There is ongoing discussion about expanding this to cover container metrics, and possibly replacing the Stats API altogether.
Prometheus’s biggest strength is as a data source. You can front the data being scraped by Prometheus with Grafana, which has supported
Prometheus since mid-2015, and is now the recommended frontend for
Prometheus. Like most of the tools we are looking at, Grafana can also be launched as a container.

46Ĵ CONTAINER MONITORING & MANAGEMENT
IDENTIFYING AND COLLECTING CONTAINER DATA
Once up and running, the only configuration needed is to add your Prometheus URL as a data source, then import one of the predefined Prometheus dashboards.
FIG 3: Metrics stored in Prometheus and displayed with Grafana.
The dashboard in Figure 3 displays over an hour of metrics from cAdvisor, which are stored in Prometheus and rendered in Grafana. As Prometheus

47Ĵ CONTAINER MONITORING & MANAGEMENT
IDENTIFYING AND COLLECTING CONTAINER DATA
is essentially taking snapshots of the current cAdvisor state, it’s are also recording metrics for containers long since removed.
Prometheus also has alerting capabilities. By using the inbuilt reporting language, you can create alerts such as the following:
ALERT InstanceDown
IF up == 0
FOR 5m
LABELS { severity = “page” }
ANNOTATIONS {
summary = “Instance {{ $labels.instance }} down”,
description = “{{ $labels.instance }} of job {{
$labels.job }} has been down for more than 5 minutes.”,
}
Once your alert has been written and deployed on the Prometheus server, you can use the Prometheus Alertmanager to route your alerts. In the
example above, we have assigned a label of severity = “page”.
Alertmanager will intercept the alert and forward it to a service such as PagerDuty, OpsGenie, a Slack or HipChat channel, or any number of
different endpoints.
Prometheus is a powerful platform and works brilliantly as a middleman
between different technologies. It is easy to start off with a basic installation, like the one described above, then expand it, giving a single pane of glass view of both your container and host instances.
Agentless System CrawlerAgentless System Crawler (ASC) is a cloud monitoring tool from IBM with support for containers. It collects monitoring information from running
48Ĵ CONTAINER MONITORING & MANAGEMENT
IDENTIFYING AND COLLECTING CONTAINER DATA
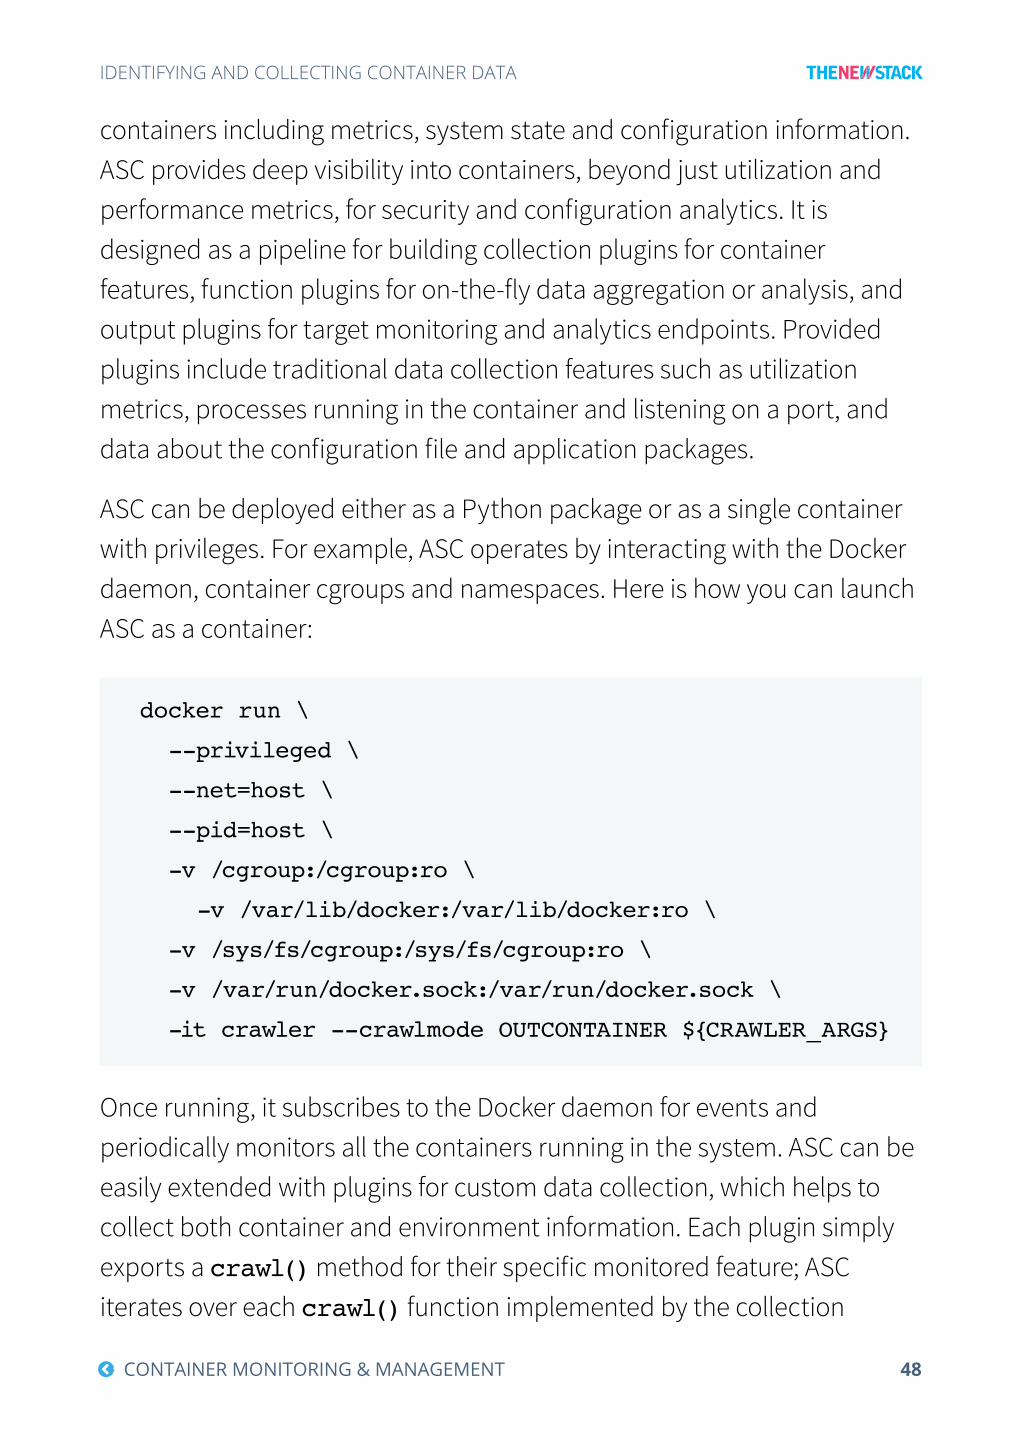
containers including metrics, system state and configuration information. ASC provides deep visibility into containers, beyond just utilization and performance metrics, for security and configuration analytics. It is designed as a pipeline for building collection plugins for container features, function plugins for on-the-fly data aggregation or analysis, and output plugins for target monitoring and analytics endpoints. Provided plugins include traditional data collection features such as utilization metrics, processes running in the container and listening on a port, and data about the configuration file and application packages.
ASC can be deployed either as a Python package or as a single container with privileges. For example, ASC operates by interacting with the Docker daemon, container cgroups and namespaces. Here is how you can launch ASC as a container:
docker run \
--privileged \
--net=host \
--pid=host \
-v /cgroup:/cgroup:ro \
-v /var/lib/docker:/var/lib/docker:ro \
-v /sys/fs/cgroup:/sys/fs/cgroup:ro \
-v /var/run/docker.sock:/var/run/docker.sock \
-it crawler --crawlmode OUTCONTAINER ${CRAWLER_ARGS}
Once running, it subscribes to the Docker daemon for events and periodically monitors all the containers running in the system. ASC can be easily extended with plugins for custom data collection, which helps to collect both container and environment information. Each plugin simply exports a crawl() method for their specific monitored feature; ASC iterates over each crawl() function implemented by the collection

49Ĵ CONTAINER MONITORING & MANAGEMENT
IDENTIFYING AND COLLECTING CONTAINER DATA
plugins enabled in its deployed configuration. ASC can be currently configured to emit data to Kafka, Graphite, filesystem and the console as endpoints, and allows for additional output plugins. Figure 4 shows an example view from an ASC configuration, emitting container data to a Graphite/Grafana endpoint.
One use case of ASC monitoring is to gain deeper insight into container execution. The following example shows the basic output frame of ASC when configured to collect the process and connection features of a container in addition to base metrics. Based on this frame, we can see
that this is a container running at 100 percent CPU utilization, with a single Python process listening on port 5000.
metadata “metadata” {“id”:”ef0fc187dc0a4b85a3cb”, …}
cpu “cpu-0” {… ,”cpu_util”:100.0}
process “python/1” {“cmd”:”python web.py”,
“python”,”pid”:74, …}
connection “74/127.0.0.1/5000” {“pid”:74,…,”connstatus”:”LISTEN”}
This enables users to couple monitoring with system state for better understanding of container behavior and to drive additional analytics. For
FIG 4: View of ASC Container Monitoring with Graphite/Grafana Endpoint.
50Ĵ CONTAINER MONITORING & MANAGEMENT
IDENTIFYING AND COLLECTING CONTAINER DATA
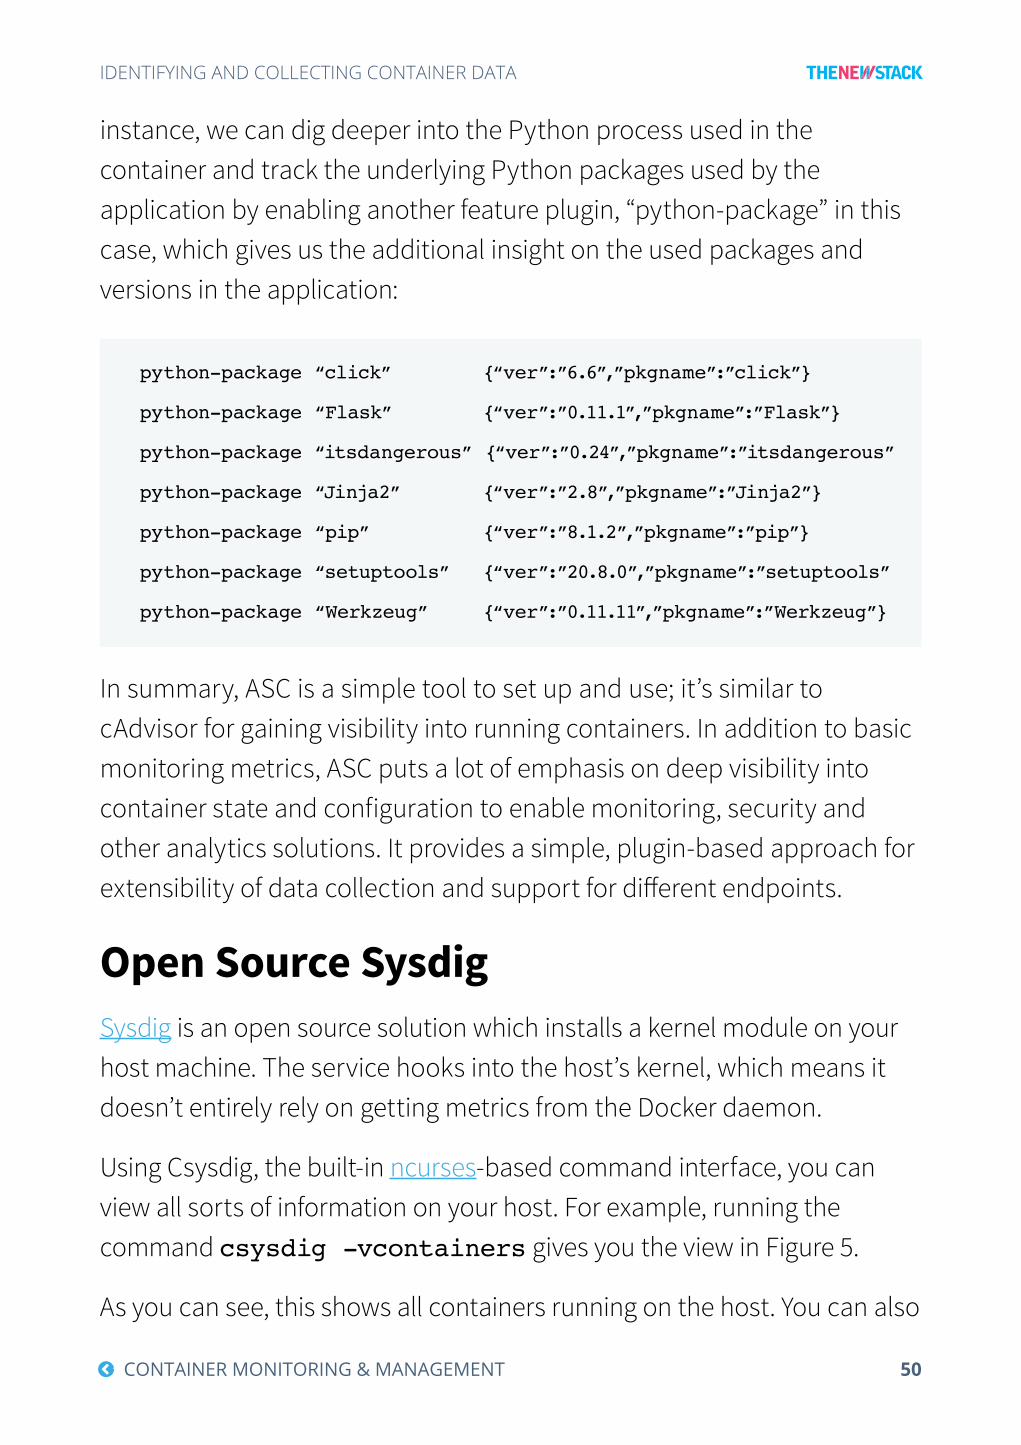
instance, we can dig deeper into the Python process used in the container and track the underlying Python packages used by the application by enabling another feature plugin, “python-package” in this case, which gives us the additional insight on the used packages and versions in the application:
python-package “click” {“ver”:”6.6”,”pkgname”:”click”}
python-package “Flask” {“ver”:”0.11.1”,”pkgname”:”Flask”}
python-package “itsdangerous” {“ver”:”0.24”,”pkgname”:”itsdangerous”
python-package “Jinja2” {“ver”:”2.8”,”pkgname”:”Jinja2”}
python-package “pip” {“ver”:”8.1.2”,”pkgname”:”pip”}
python-package “setuptools” {“ver”:”20.8.0”,”pkgname”:”setuptools”
python-package “Werkzeug” {“ver”:”0.11.11”,”pkgname”:”Werkzeug”}
In summary, ASC is a simple tool to set up and use; it’s similar to cAdvisor for gaining visibility into running containers. In addition to basic monitoring metrics, ASC puts a lot of emphasis on deep visibility into container state and configuration to enable monitoring, security and other analytics solutions. It provides a simple, plugin-based approach for extensibility of data collection and support for different endpoints.
Open Source SysdigSysdig is an open source solution which installs a kernel module on your
host machine. The service hooks into the host’s kernel, which means it doesn’t entirely rely on getting metrics from the Docker daemon.
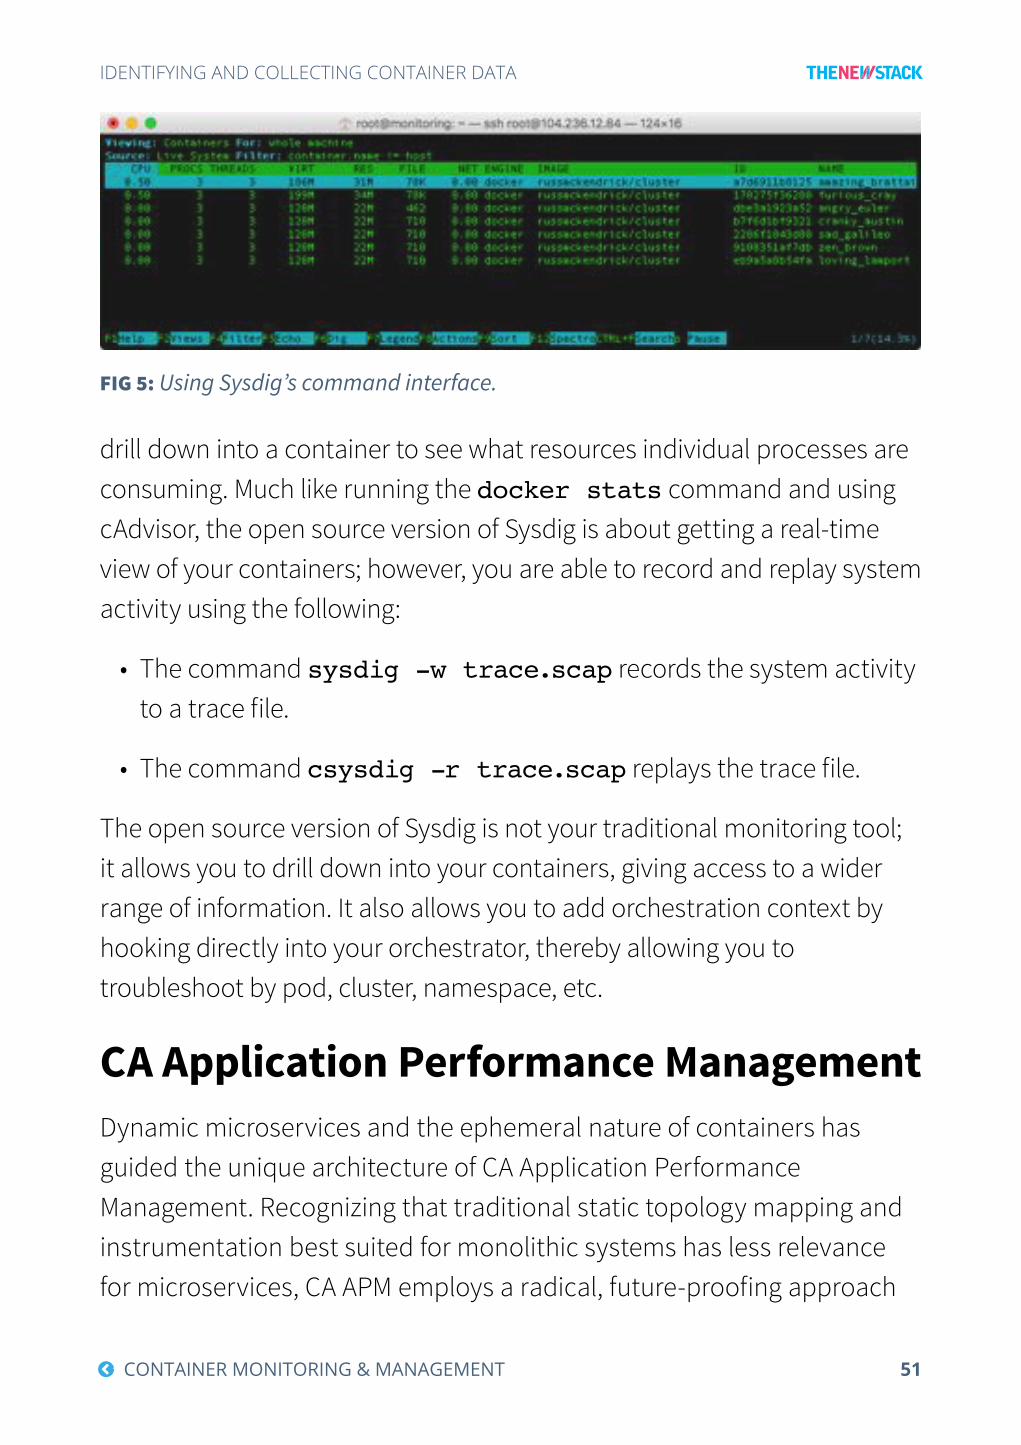
Using Csysdig, the built-in ncurses-based command interface, you can
view all sorts of information on your host. For example, running the command csysdig -vcontainers gives you the view in Figure 5.
As you can see, this shows all containers running on the host. You can also
51Ĵ CONTAINER MONITORING & MANAGEMENT
IDENTIFYING AND COLLECTING CONTAINER DATA
FIG 5: Using Sysdig’s command interface.
drill down into a container to see what resources individual processes are
consuming. Much like running the docker stats command and using cAdvisor, the open source version of Sysdig is about getting a real-time view of your containers; however, you are able to record and replay system activity using the following:
• The command sysdig -w trace.scap records the system activity
to a trace file.
• The command csysdig -r trace.scap replays the trace file.
The open source version of Sysdig is not your traditional monitoring tool; it allows you to drill down into your containers, giving access to a wider range of information. It also allows you to add orchestration context by hooking directly into your orchestrator, thereby allowing you to troubleshoot by pod, cluster, namespace, etc.
CA Application Performance ManagementDynamic microservices and the ephemeral nature of containers has
guided the unique architecture of CA Application Performance Management. Recognizing that traditional static topology mapping and instrumentation best suited for monolithic systems has less relevance
for microservices, CA APM employs a radical, future-proofing approach
52Ĵ CONTAINER MONITORING & MANAGEMENT
IDENTIFYING AND COLLECTING CONTAINER DATA
to managing containerized systems. Fundamental to this approach is fast, simplified configuration and visibility into modern system complexity, especially microservice interdependencies and
communication flows.
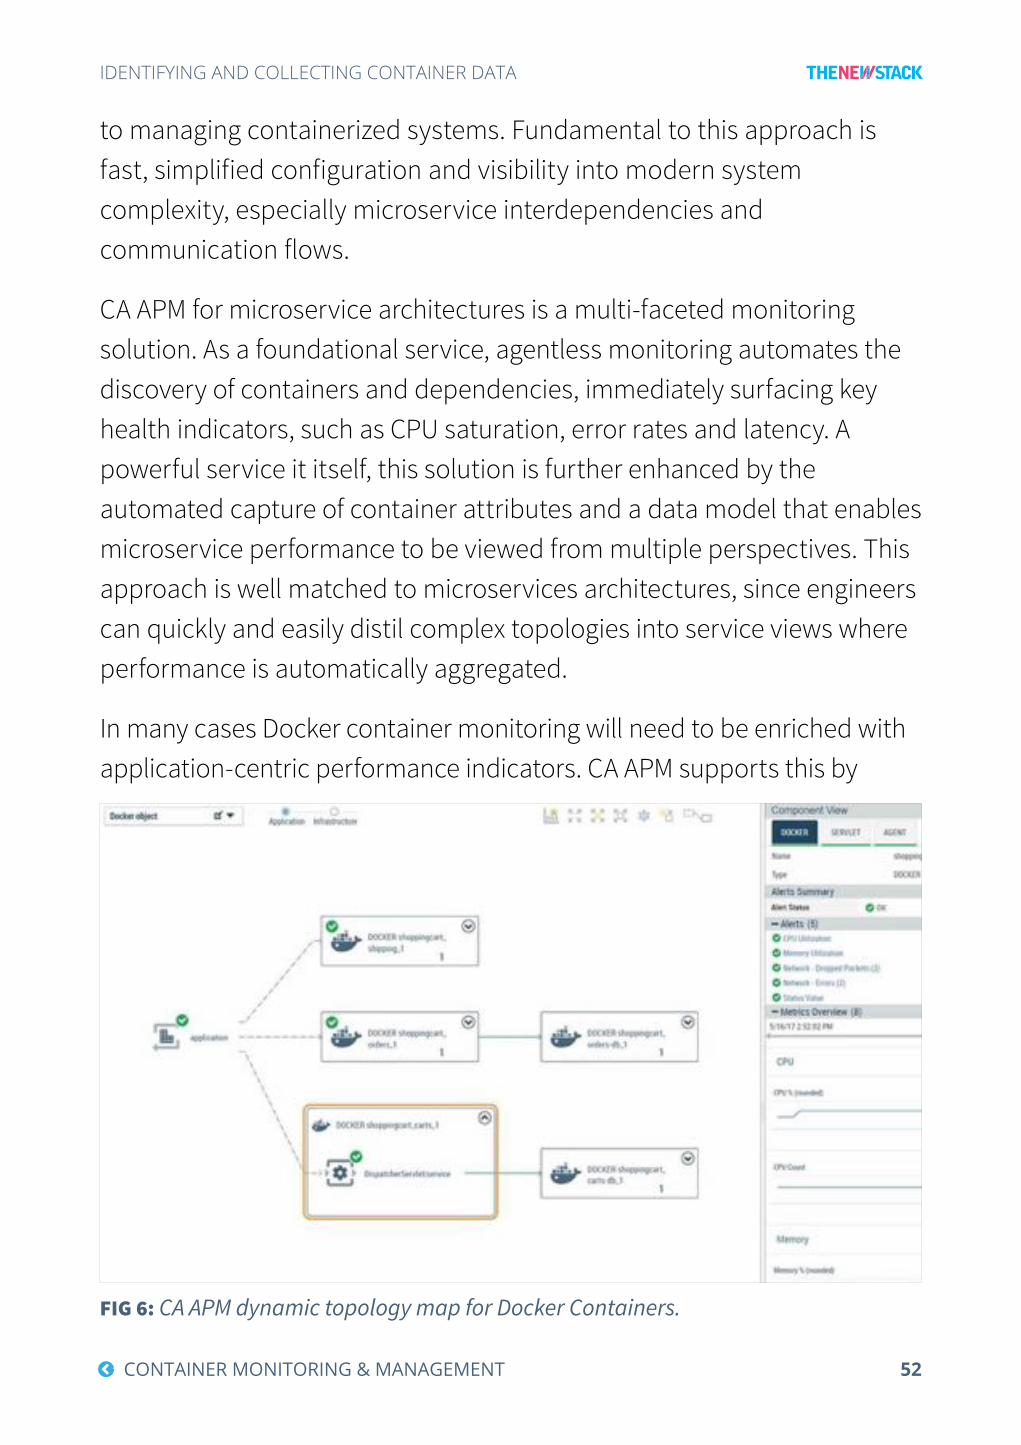
CA APM for microservice architectures is a multi-faceted monitoring solution. As a foundational service, agentless monitoring automates the discovery of containers and dependencies, immediately surfacing key health indicators, such as CPU saturation, error rates and latency. A powerful service it itself, this solution is further enhanced by the
automated capture of container attributes and a data model that enables
microservice performance to be viewed from multiple perspectives. This
approach is well matched to microservices architectures, since engineers can quickly and easily distil complex topologies into service views where performance is automatically aggregated.
In many cases Docker container monitoring will need to be enriched with application-centric performance indicators. CA APM supports this by
FIG 6: CA APM dynamic topology map for Docker Containers.

53Ĵ CONTAINER MONITORING & MANAGEMENT
IDENTIFYING AND COLLECTING CONTAINER DATA
enabling application instrumentation within containers. This allows access to advanced application performance services in context of
supporting microservice architectures. For example, statistical techniques can manage performance baselining and reduce alert noise, while transaction tracing and assisted triage can gather detailed evidence and builds remediation workflows.
Agentless container-centric monitoring and deeper application instrumentation are valuable services in themselves, but CA APM
combines the information they expose to deliver higher level insights. By automatically correlating application performance to container health, CA APM not only provides DevOps teams with exact problem root cause indicators, but also details which container-application configurations deliver the best possible performance.
Other Tools for Collecting DataThere are services that can collect, collate and report on metrics from
your containers and host instances. Here’s an overview of other tools available. There are many more in the Container Monitoring Directory.
Other Tools for Collecting DataVendor Solution Description
CoScale CoScale is a full-stack monitoring cloud service that monitors the responsiveness of applications. It combines server and container resource metrics with application-specific performance metrics. Its lightweight agents have little overhead.
Datadog Datadog is a full-stack cloud-based monitoring and alerting service for IT operations and development teams. It has containerized agents that can monitor container environments.
Dynatrace Dynatrace has a new suite of monitoring tools, based on its Ruxit technology, for container monitoring and alerting. Its agent is injected into a container, where it can then auto-discover new services running on a host and fetch data from the Docker API. Dynatrace is also developing artificial intelligence technology to help with root cause analysis.
Elastic Beats are single-purpose data shippers that install as lightweight agents and send data from machines to Logstash or Elasticsearch. Dockbeat is the shipper for Docker containers.

54Ĵ CONTAINER MONITORING & MANAGEMENT
IDENTIFYING AND COLLECTING CONTAINER DATA
ConclusionAll of the tools we’ve covered will be able to get you started with container visibility and monitoring. It’s up to you to decide what combination of tools is needed to collect the information that will help you monitor and
optimize your applications and systems. We covered the basics that everyone needs to know, which includes using the native functionality of Docker’s Stats API and cAdvisor. That will go a long way towards introducing users to the basic necessities of monitoring containers.
There are many ways to monitor containers, and solution vendors have
opinionated ways of solving these problems. You might see this as a choice between open source and SaaS solutions, but it has more to do
with finding the combination of solutions that fits your workload. No matter how you ultimately build your monitoring stack, you still need to know how to collect the metrics you’re looking to monitor.
TABLE 1: There are a variety of other tools and solutions that can be used for identify-
ing and collecting container data.
Other Tools for Collecting DataVendor Solution Description
InfluxData Telegraf is an open source agent that collects metrics with a Docker plugin; it’s part of the stack that n D t is creating to collect and analyze metrics. The metrics are sent to InfluxDB or a variety of outputs.
New Relic New Relic has updated its suite of products around their Digital Intelligence Platform for application and infrastructure performance. Its agent-based approach is particularly good for troubleshooting code-related application performance issues.
Sematext Sematext has a Docker-native monitoring and log collection agent that collects and processes Docker metrics, events and logs for all cluster nodes and all auto-discovered containers. It has its own log management solution as well as performance monitoring service.
SignalFx SignalFX has a collectd-docker plugin that captures metrics about CPU, memory, network, and disk using Docker’s stats API. SignalFx has built-in Docker monitoring dashboards, which let you add dimensions (tags) metadata to aggregate, filter, and group metrics by property.

55Ĵ CONTAINER MONITORING & MANAGEMENT
THE RIGHT TOOL FOR THE JOB: PICKING A MONITORING SOLUTIONby BRIAN CHRISTNER
Monitoring is the hidden hero inside container infrastructure. Much like driving a car, we don’t think about what’s happening under the hood until something goes wrong. We want to pivot
away from being reactive with our infrastructure and container problems, and move to a more proactive state of operation using monitoring insights to keep us up and running.
Gone are the days of just monitoring physical servers and their resources. We now need to know which containers are running and where they’re running, monitor applications and containers, and provide alerting and metrics information to operations teams. The following sections will assist you in navigating the business decisions required to find the right monitoring tool for the job.
Build vs. BuyWhen considering new software, the decision to build or buy your solution should be at the top of the list. This argument is very similar to building a house from scratch versus buying an existing, finished house.

56Ĵ CONTAINER MONITORING & MANAGEMENT
THE RIGHT TOOL FOR THE JOB: PICKING A MONITORING SOLUTION
Building a house allows you to make changes and improvements as you perform the build, compared to buying a house where the decisions have mostly been made for you. Building is resource intensive, as it requires testing different components, trial and error experiences and learning how to handle new tools.
Buying a monitoring solution offers a finished product that’s ready to run. This approach can save time and money, but there can also be
drawbacks. You need to consider the anticipated growth of your organization. A rapidly changing environment with many new services being added can require significant additional time and effort to calibrate the monitoring solution. If many more people are expected to need access to the monitoring solution, then difficulties with identity management could be costly if the vendor charges for seat licenses.
Many monitoring solutions charge per agent. A solution’s pricing model can be a deal-breaker depending on the size of your current or future deployment. For example, some systems charge per agent, while we have seen a few that actually charge per container monitored. Others are usage pricing based; for example, based on the data ingest rate of the agent.
Whether you are building or buying, vetting is required. While a mature product will have reduced risk, rapidly changing ones often have the latest features. An active community of users is important, whether you are
going the vendor route or building something based on open source projects. The community is often responsible for keeping documentation and code updated.
Buying an off-the-shelf solution alleviates a lot of these questions, but a comparison between solutions should be performed to see exactly what
the support provides, what service-level agreements (SLAs) are available and if professional services can assist with installation and customization.
57Ĵ CONTAINER MONITORING & MANAGEMENT
THE RIGHT TOOL FOR THE JOB: PICKING A MONITORING SOLUTION
Support and SLAs Support is a critical component to any monitoring system. Self-hosted solutions require maintenance, but you may not have the in-house operational capacity to build and manage a monitoring system on your own. But more to the point: who is responsible for supporting the monitoring solution? It is also important to ensure your company SLA and IT governance are adhered to when vetting a monitoring solution.
Flexibility and CustomizationHaving the ability to customize a monitoring stack exactly to your requirements is an enormous advantage, but it comes at a price, and that price is the time required to make these customizations.
The build approach offers more flexibility and customization as you are working with open source software (OSS) that allows you to make your own changes. Buying offers some flexibility and customization dependant on the vendor’s offering, but is relatively more restrictive compared to OSS alternatives.
Cloud-Based vs Hosted On-PremisesMany monitoring solutions can run either in the cloud or be hosted on-premises. Each offers their own advantages and disadvantages, as well as several considerations based on your workload. Cloud generally means less control of your workload, whereas on-premises offers more fine-grained control. You should also consider if your monitoring needs have to adhere to regulatory or data storing requirements.
Generally, on-premises costs more because of the higher operational and support costs associated with running a datacenter, whereas cloud-based providers handle this for you when deciding for a cloud solution.

58Ĵ CONTAINER MONITORING & MANAGEMENT
THE RIGHT TOOL FOR THE JOB: PICKING A MONITORING SOLUTION
CloudMoving to the cloud from on-premises is a business case in itself. Cloud
offerings enable reduced costs by sharing resources with other cloud customers. The ability to quickly scale demand and the need for fewer specialized employees are all benefits related to cloud-based services. Central management of your infrastructure, including monitoring, is made easier with cloud vendors like Amazon Web Services (AWS), Google Cloud Platform (GCP), IBM Bluemix and Microsoft Azure.
Several cloud vendors also offer one-click deployment of monitoring solutions, which allows you to get quickly up and running with a Software as a Service (SaaS) or open source solution. However, you must consider where the cloud is located compared to the your workload. Some users
will want to have their monitoring stack located as close to their container workload as possible.
Hosted On-PremisesNot everything can run in the cloud for a variety of reasons, including data privacy, licensing, internet connectivity and performance. On-premises solutions allow you to be in complete control of your environment. You’re able to add more bandwidth and use custom hardware configurations. On-premises is sometimes combined with cloud services to offer hybrid solutions, which offer the best of both worlds. Additionally, not all SaaS monitoring solutions offer an on-premises solution, so ask about it when vetting different vendors.
There are other valid reasons for looking at hosting your own monitoring solution. The golden rule of going down the self-hosted route is that, if you are relying on alerting from your monitoring solution to notify you of critical incidents, then never host it in or on the same infrastructure as
your application. That may seem obvious, but you will be surprised at the

59Ĵ CONTAINER MONITORING & MANAGEMENT
THE RIGHT TOOL FOR THE JOB: PICKING A MONITORING SOLUTION
amount of times it happens. If you take the cloud route, then that
shouldn’t be a problem.
The on-premises route offers a lot of flexibility and configuration possibilities, but will be more challenging to install and configure. The time it will take to have a monitoring solution up and running will take considerably more time compared to a SaaS solution that could be
deployed instantly. These are all considerations that should be made
when considering an on-premises solution.
Compliance and Data ProtectionSomething that is often overlooked when considering a monitoring solution is the regulatory implications of data handling. Can data be stored outside of your data center, city, region or country? In some cases, depending on what industry you are working in, the government may also have regulations on how the data is handled.
If you install a cloud monitoring agent on a host machine that is shipping both metrics and information on what processes are running, then data ownership can become an issue. If your metrics include customer data,
make sure your cloud provider can remove user data from the
transactions it captures.
IntegrationIt’s important to fully understand what is currently running in your environment. Based on what you’re running, you can start answering questions like what programming languages, applications and tools are currently or planned to run in your containers. This information will help
you build a requirements list. This list will assist you in choosing what client libraries and integrations are important to your company now and in the future.

60Ĵ CONTAINER MONITORING & MANAGEMENT
THE RIGHT TOOL FOR THE JOB: PICKING A MONITORING SOLUTION
OrchestratorsIt is important to consider how orchestrators are monitored and to what
extent. Consider the discovery of new services as they are brought online and what configurations are required in order to monitor these new services. Some monitoring tools will auto-discover new services or orchestrator nodes as they go online or offline, while other tools require configuration or integration with each service or node. The more auto-discovery capabilities available within the monitoring system, the less operation support required.
Client Libraries and IntegrationsClient libraries allow developers to write internal metrics within an
application and expose them directly to a monitoring solution. Monitoring systems also integrate directly to the more common applications like databases and proxies. These integrations allow you to easily implement your monitoring solution and gather application-specific information. For example, HAProxy can be integrated to pull all the HTTP traffic statistics and display this information in monitoring dashboards. However, some integrations require additional agents, containers or sensors to collect metrics from the different integrations. Depending on the integration, this could range from easy to very complicated, and may require additional configuration and testing.
Metric ConsolidationIf you are currently using a cloud provider or Platform as a Service (PaaS), chances are they’re already exposing monitoring metrics. Find out what is available within your current Containers as a Service (CaaS), PaaS or Infrastructure as a Service (IaaS) stack that you can leverage. Can you integrate metrics from the cloud service stack into your monitoring solution to create a single view of infrastructure and containers? You many want to centralize metrics into a single solution rather than using many

61Ĵ CONTAINER MONITORING & MANAGEMENT
THE RIGHT TOOL FOR THE JOB: PICKING A MONITORING SOLUTION
different tools without integrations. Be sure to find out which of your current services can be repurposed into your new monitoring solution.
ConclusionWe have explained the use cases for build versus buy, cloud versus
on-premises, integrations and native functionality for monitoring solutions. Based on this information, you can start building a matrix of information and make a comparison between the different monitoring solutions currently available on the market, both open source and SaaS
solutions. Do your homework and gather information internally first to understand your requirements. This requirements list will be your key to choosing the right monitoring tool for the job.

62Ĵ CONTAINER MONITORING & MANAGEMENT
MANAGING
INTENTIONAL CHAOS: SUCCEEDING WITH
CONTAINERIZED APPSby VIVEK JUNEJA
While building applications that use containers has become an established practice, some organizations are facing chal-lenges with managing containers. It’s no longer rare for engi-
neering teams to have working knowledge of using containers in their routine development workflow. However, managing containers in produc-
tion environments requires an even greater understanding of container technology, along with unlearning habits and practices that no longer work. These practices span across the different life cycle aspects of container management: logging, monitoring, notifications, remediation and metrics. Missing out on any one of them could shake a team or orga-
nization’s confidence in containers.
Containerized applications have to be designed with consideration for the various nonfunctional and container-native patterns that have emerged over time. For example, the twelve-factor application style has been
widely advocated and adopted by microservices enthusiasts and
developers. The twelve-factor principles requires the application to be operation-ready, including design for fast startups and graceful

63Ĵ CONTAINER MONITORING & MANAGEMENT
MANAGING INTENTIONAL CHAOS: SUCCEEDING WITH CONTAINERIZED APPS
shutdowns, but it misses out on handling the software entropy that such
container-based systems acquire over time.
Containers Add Complexity to the Overall SystemAdopting containers, especially in a microservices-based architecture, leads to increased entropy in the system. When we say entropy, what we
mean is the system becomes immensely more complex, and that
complexity needs to be managed. The complexity is due to the increase in moving parts in a container-based environment. Moreover, the disposable and immutable nature of containers can encourage some teams to create more rapid delivery pipelines. This propensity towards
change further fuels the overall system complexity. If not managed, it can create opportunities for burnout, downtime, and disappointment in
adopted technologies.
Container adoption has led to the development of new practices from
web-scale organizations. The major lesson from public cloud providers — advocating the need to design for failure and redundancy at all levels — is finally going mainstream. Another important lesson is to have applications that are designed to handle the complexity from containers, a lesson that might remind many of the antifragile movement.
Understanding New Design Goals In order to address these challenges with containerized applications, there are ways to create containerized applications in a way that makes them operation-ready. Making changes to the development process will enable better monitoring and management of containers in production environments. These lessons translate into some high-level design goals for containerized application development.
64Ĵ CONTAINER MONITORING & MANAGEMENT
MANAGING INTENTIONAL CHAOS: SUCCEEDING WITH CONTAINERIZED APPS
1. Applications running as containers should acknowledge that services could be interrupted at any time. Interruption could be triggered by a variety of situations. In the case of Docker, a stop command sends the SIGTERM signal to the application, indicating the request to shut down. This may require applications to perform cleaning-up activity before the container dies. Taking a hint from the twelve-factor principles, the application must gracefully shutdown. For example, if there is a state that is being manipulated by the container, that would require being checkpointed. The checkpoint
would be persisted onto external storage, where other container workers could access it.
2. An application should expose an interface to allow for health checks that can be used by the container platform. The accuracy of the health check implementation is critical to the
functioning of this setup. Usually, an application emits health check information that indicates it can correctly connect to third party or
external interfaces. A failed health check is a good indicator for the platform to remove the instance from the configuration. Platforms also use this to decide remediation activities that need to be
performed due to an error in the container. This remediation could
involve launching the same container image on a different host.
3. There should be a mechanism to reliably identify a faulty instance and its root cause. Diagnosing application issues in a containerized environment is an open invitation to chaos. The problem occurs when there is a need to
identify the exact container instance that caused the issue. Using a common identification artifact that spans across the notification, monitoring and logging infrastructure is one way to solve this problem. A common approach is to use a business-specific identity, configured

65Ĵ CONTAINER MONITORING & MANAGEMENT
MANAGING INTENTIONAL CHAOS: SUCCEEDING WITH CONTAINERIZED APPS
to be emitted as a notification, that can be captured by the logging system. The log should then provide mapping between the identifier and the container name that caused the issue.
4. The log format must provide full context to an operator. Logging remains an important element in the arsenal for debugging issues in the production environment. With container environments,
the log format must include some context like container ID, container image and container host. The container runtime injects a HOST environment variable that can be used by the application in its logs. Container platforms use metadata in their log stream, which helps identification and remediation activities.
Making Agile Decisions with ContainersA fast and agile environment provides the ability to make quick decisions and iterate as needed. One of the cornerstones of the DevOps movement is the adoption of ideas around the observe, orient, decide and act
(OODA) loop, a widely-used principle to take action in a constantly
changing environment. Mapping the OODA practice to a containerized production environment would lead to the following inferences:
• Observe: This pertains to alerts and notifications that filter out the useful signals from the noise. This is possible through tools that receive events from the monitoring system when something goes wrong. Having a good signal-to-noise ratio at this stage is critical to the overall success of the process.
• Orient: Once access to the information is sorted, it is used to identify the symptoms causing an issue. Getting information from the logging and monitoring system is the basis of orientation. You must be able to identify the exact source of information with minimal noise.

66Ĵ CONTAINER MONITORING & MANAGEMENT
MANAGING INTENTIONAL CHAOS: SUCCEEDING WITH CONTAINERIZED APPS
• Decide: Based on the symptoms identified during the orientation phase, you must decide what action to take to resolve the situation. An
example action would be changing the group configuration or relocating to a new set of hosts. If the issue identified is related to the application logic, then rolling back to the previous configuration could be a possible fix.
• Act: The container platform and tools must allow for fast action once
they’re decided upon. Having access and permission to the container management tools is useful.
Container implementations in the enterprise must allow the OODA loop to be implemented and have fast transitions. The merit of any container
management and monitoring system is measured by the accuracy of the information it provides and the speed with which actions can be taken.
Tools for Taming ComplexityThe art of managing the chaos in a container-based environment has led to the creation of new tools and services that embrace the dynamic and
autonomous nature of container management. Tools like StackStorm and
Netflix Winston have inspired implementations to trigger automated workflows in the case of events, especially events that involve an issue with the environment. Tying this to your container platform can allow operation runbooks to execute in case of a fault with a container. This
reduces manual intervention and engineering team burnout, which increases productivity.
One of the concepts we discussed earlier was to monitor groups of containers instead of focusing on individual instances. The use of container labels and environment variables can be used to implement this
practice. A tool like cAdvisor can capture the labels provided to any

67Ĵ CONTAINER MONITORING & MANAGEMENT
MANAGING INTENTIONAL CHAOS: SUCCEEDING WITH CONTAINERIZED APPS
container on a host. If environment variables are used, cAdvisor also
allows them to be captured using the --docker-env-metadata-whitelist runtime parameter.
Tracing calls between self-contained services in an architecture is difficult with traditional practices. Improving practices around tracing is an important part of continued success with microservices. Tracing platforms like OpenTracing will become commonplace in all container based
environments going forward.
The Cloud Native Computing Foundation has adopted OpenTracing as a hosted project. There are also tools like Zipkin, an open source tracer for
microservices, first developed by Twitter to track web requests as they bounced around different servers. There’s also Sysdig tracers, which
allows for open source tracing of everything from microservices down to system resource access time.
Taking actions iteratively in an OODA loop is an important part of container implementation. Platforms like Vamp allow workflows to be implemented for making canary release decisions based on containerized application metrics. Tools like this could act as a method of implementing the OODA loop and applying it to release and testing practices.
If you are running containers with process isolation, then finding a flagged process running among a set of containers across hosts is a challenging feat. Identifying the host that runs the flagged container is one part of the problem. Usually, this is solved through a host monitoring tool like Prometheus. Once you identify the host, you can perform process ID mapping between the host and the container. This requires identifying the root process ID and correlating it with the running container. Tools like Sysdig solve this problem and much more with little or no overhead on
the container performance.

68Ĵ CONTAINER MONITORING & MANAGEMENT
MANAGING INTENTIONAL CHAOS: SUCCEEDING WITH CONTAINERIZED APPS
Cloud Foundry has a unique approach to solving container management and monitoring difficulties. It provides an abstraction of the containerized infrastructure in the form of well-designed APIs, a solid development environment, and by providing logs and metrics for each application. These features make it easy for developers to adopt agile practices and leverage visibility into their containerized production applications.
ConclusionOrganizations working in a hybrid setup, involving both containerized and traditional workloads, will have a hard time embracing this shift. The challenge is maintaining systems that revolve around different schools of thoughts. Legacy systems are usually long running and non-disposable; they demand per instance, granular approaches to monitoring and management.
Some organizations will want to experiment with a team that is independent and has few traditional system monitoring needs. However, the OODA loop is still a valuable approach to containerized applications, and establishes common ground rules for both traditional and container-based environments.
Developers need to be more aware of new practices in monitoring, logging and service management in order to create containerized applications that will thrive. The changes needed to successfully adopt containers will result in cloud-native systems that are able to accomplish
the goals of agile IT.

69Ĵ CONTAINER MONITORING & MANAGEMENT
CHAPTER #: CHAPTER TITLE GOES HERE, IF TOO LONG THEN...
CONTAINER MONITORING DIRECTORYAlthough this directory has over a hundred entries, it is not meant to be comprehensive. Instead, it lists many of the projects and vendor offerings that are used to monitor containers. Listings are divided into four sections to make it easier for the reader to quickly review. Since most of the products ac-
tually provide a range of functionality listed, please use the categorization as a starting point when reviewing solutions you may want to use or consider.

70Ĵ CONTAINER MONITORING & MANAGEMENT
CONTAINER-RELATED MONITORING
Product/Project (Company or Supporting Org.) Functionality Includes:
AppDynamics (Cisco) » Performance Monitoring
Application and business performance software that collects data from agents installed on the host. It provides an extension to collect data from the Docker API.
AppFormix (Juniper Networks)
Cloud infrastructure monitoring and analysis software that runs in any public, private, multi-tenant, or hybrid environment. It includes ContainerFlow, which utilizes Intel Resource Director technology to enforce isolation between workloads and deliver better performance for container workloads. The company is focused on analytics for operators of OpenStack and Kubernetes.
Bluemix Container Monitoring and Logging (IBM)
Monitoring and logging is a built-in service for Bluemix Containers, integrated to the cloud offering. Users receive monitoring information and logging capabilities for any container they deploy on Bluemix without having to configure or install anything. This service is based on Agentless System Crawler for data collection; it can utilize Logstash, Graphite, Elasticsearch, Kibana and Grafana for data ingestion, analysis and visualization.
CA Application Performance Management (CA Technologies)
Agentless service for monitoring the performance of Docker environments with deep instrumentation of applications and microservices. Delivers fully automated dependency mapping with an open flexible data model supporting multiple views based on user requirements and service context. Performance impact of Docker changes can be viewed across time, with analytics-based alert management, anomaly detection and problem triage.
Open Source Cabin (Bitnami) » Management/Orchestration
An iOS application for managing Kubernetes applications. An Android application is being developed.
Open Source cAdvisor (Google)
cAdvisor (Container Advisor) is a Google-supported project that analyzes resource usage and performance characteristics of running containers.
This section includes tools that are purpose-built to monitor containers. In addition, it
includes commonly used monitoring tools that have extensions or plugins to collect
and monitor container data.

71Ĵ CONTAINER MONITORING & MANAGEMENT
CONT’D: CONTAINER-RELATED MONITORING
Product/Project (Company or Supporting Org.) Functionality Includes:
Cobe.io (Cobe.io)
Provides a live topology of heterogeneous infrastructure, on top of which model performance metrics and alerts are overlaid.
CoScale (CoScale) » Anomaly Detection
Combines server and container resource metrics with application-specific performance metrics. Its lightweight agents have little overhead.
Digital Experience Insights from CA (CA Technologies)
A SaaS-based digital experience monitoring and analytics solution, offering an integrated set of app experience analytics, application performance management and infrastructure management capabilities. Built on top of a powerful analytics engine that leverages open technologies such as Elasticsearch, Kibana and Hadoop, Digital Experience Insights provides comprehensive monitoring and analytics across modern cloud and container stacks. Trial Digital Experience Insights free for 30 days and gain access to full stack monitoring for containers and microservices, including: App Experience Analytics, Application Performance Management and Infrastructure Management.
Open Source DC/OS Metrics (Mesosphere)
An experimental project to make metrics more accessible. It is expected to be incorporated in a future release of DC/OS 1.10.
Open Source Docker Engine (Docker) A lightweight runtime and tooling that builds and runs your Docker containers. The Docker Stats API in Docker Engine is the source of most information collected by tools that monitor containers. CS Docker Engine is the commercially supported version. Docker Content Trust is a feature that makes it possible to verify the publisher of Docker images.
Docker Enterprise Edition (Docker) » Management/Orchestration
An application-centric platform, Docker EE integrates container management, image management, Docker Datacenter and security services into an enteprise solution.
Dynatrace (Dynatrace) » Performance Monitoring
Dynatrace's new suite of monitoring tools is based on its Ruxit technology. Its agent is injected into a container, which then autodiscovers new services running on a host and can fetch data from the Docker API. Dynatrace is also developing artificial intelligence technology to help with root cause analysis.
Open Source Falco (Sysdig) » Anomaly DetectionA behavioral activity monitor designed to detect anomalous activity in your applications. Powered by Sysdig’s system call capture infrastructure, Falco lets you continuously monitor and detect container, application, host and network activity.
Open Source Heapster (Cloud Native Computing Foundation)
Enables analysis of compute resource usage and monitoring of container clusters. Heapster currently supports Kubernetes and CoreOS natively.

72Ĵ CONTAINER MONITORING & MANAGEMENT
CONT’D: CONTAINER-RELATED MONITORING
Product/Project (Company or Supporting Org.) Functionality Includes:
HPE SiteScope (Hewlett-Packard Enterprise)
Agentless monitoring software for monitoring the availability and performance of distributed applications and IT infrastructure. The dynamic Docker monitor of SiteScope monitors the health and performance from the cluster manager level through the Docker daemon layer to the container level, including the applications running inside the containers.
Open Source Kubernetes Dashboard (Cloud Native Computing Foundation)
A general purpose, web-based UI for Kubernetes clusters. It allows users to manage applications running in the cluster and troubleshoot them, as well as manage the cluster itself.
Operations Management Suite (Microsoft)
Created as a management and security tool for hybrid clouds. It also provides a simplified view of containers’ usage and diagnoses issues.
Open Source Prometheus (Cloud Native Computing Foundation) » Time Series Database
An open source, service monitoring system and time series database.
Scout (Scout) » Performance Monitoring
A Docker monitoring partner, Scout provides application and server monitoring, especially for Rails applications. It has plugins to monitor both Docker and LXC containers.
Open Source Sematext Docker Agent (Sematext)
It collects and processes Docker metrics, events and logs for all cluster nodes and all auto-discovered containers. It works with Docker Swarm, Docker Datacenter, Docker Cloud, as well as Amazon EC2, Google Container Engine, Kubernetes, Mesos, RancherOS and CoreOS.
SignalFx (SignalFx) » Time Series Database
Its collectd-docker plugin capture metrics about CPU, memory, network, and disk using Docker’s stats API. SignalFx has built-in Docker monitoring dashboards, which let you add dimensions (tags) metadata to aggregate, filter, and group metrics by property.
SPM Performance Monitoring (Sematext) » Anomaly Detection» Performance Monitoring
On-premises performance monitoring, alerting and anomaly detection. An agent is used to monitor Docker containers and host metrics about CPU, memory, network, disk and events.
Open Source Sysdig (Sysdig) Linux system exploration and troubleshooting tool with first class support for containers. This is the open source project that Sysdig Cloud is based on.
Sysdig Cloud (Sysdig)
Based on open source Sysdig technology, Sysdig Cloud monitors, troubleshoots and alerts on containerized environments. Sysdig Cloud can be used as a cloud service or deployed as hosted software in your private cloud.
Open Source Weave Cortext (Weaveworks)
API-compatible Prometheus implementation that natively supports multitenancy and horizontal scale-out clustering.

73Ĵ CONTAINER MONITORING & MANAGEMENT
CONT’D: CONTAINER-RELATED MONITORING
Product/Project (Company or Supporting Org.) Functionality Includes:
Weave Scope (Weaveworks) Weave Scope offers a real-time monitoring solution for containers.
Open Source Zenoss Control Center (Zenoss)
Zenoss Control Center is an application management and orchestration system. It works with the Zenoss platform and other Docker applications. Serviced is a popular repository in this project that provides a PaaS runtime.

74Ĵ CONTAINER MONITORING & MANAGEMENT
COMPONENTS/CLASSES OF MONITORING SYSTEMS
Product/Project (Company or Supporting Org.) Functionality Includes:
Open Source Agentless System Crawler (IBM) » Collect/IngestA unified cloud monitoring and analytics framework that enables deep visibility into all types of cloud platforms and runtimes. It is used as the data collection framework for Bluemix Containers and Vulnerability Advisor.
Beats (Elastic) » Collect/Ingest A platform for single-purpose data shippers. They install as lightweight agents and send data from machines
to Logstash or Elasticsearch.
Bosun (Stack Exchange) » Alerting and Event Processing A time series alerting framework developed by Stack Exchange. Scollector, a metric collection agent, is used
with it.
Circonus (Circonus) » Alerting and Event Processing» Time Series Database
Collects any data from any system, and then provides customizable visualization, analysis and alerting tools.
Open Source collectd (N/A) » Collect/Ingest A small daemon which periodically collects system information and provides mechanisms to store and monitor
the values in a variety of ways.
Open Source Fluentd (Cloud Native Computing Foundation) » Log Management Fluentd is an open source data collector for unified logging layers.
Google Stackdriver (Google) » Log Management» Performance Monitoring
Monitoring, logging and diagnostics for applications on Google Cloud Platform and AWS.
Open Source Grafana (Grafana Labs) » Visualization Grafana is a metrics dashboard and graph editor for Graphite, InfluxDB and OpenTSDB.
A full stack monitoring system has many different components. This section includes tools that collect and ingest, process and store data and metrics. It also includes the
processing of events and the creation of alerts. Other important parts of a monitoring
system are the visualization and tools to help with tracing, error tracking and
debugging.

75Ĵ CONTAINER MONITORING & MANAGEMENT
CONT’D: COMPONENTS/CLASSES OF MONITORING SYSTEMS
Product/Project (Company or Supporting Org.) Functionality Includes:
Open Source Graphite Carbon (N/A) » Collect/Ingest Component of the Graphite project that is responsible for receiving metrics over the network and writing them
down to disk using a storage backend.
Open Source Graphite-Web (N/A) » Visualization Graphite-Web is a Django-based web application that renders real-time graphs and dashboards.
Open Source Graylog (Graylog) » Log Management Graylog is a fully integrated platform for collecting, indexing, and analyzing both structured and unstructured
data from almost any source.
Open Source Hawkular (Red Hat) » Performance Monitoring Hawkular is a modular systems monitoring suite that consists of several subprojects for storing metrics,
alerting on incoming events and more.
Honeycomb.io (Honeycomb.io) » Tracing/Error Tracking/Debugging Honeycomb is an event-driven observability tool for debugging systems, application code and databases.
Honeycomb uses structured data and real-time query aggregationto support ultra-rich datasets without indexes or schemas, and a fast, interactive interface.
Open Source n D n D t » Time Series Database An open source database written in Go specifically to handle time series data with high availability and high-
performance requirements. It is one of the more commonly used databases in the stacks used to monitor containers.
Open Source Kapacitor n D t » Alerting and Event Processing Open source framework for processing, monitoring, and alerting on time series data.
Open Source Kibana (Elastic) » Visualization Kibana is a flexible analytics and visualization platform.
Librato (SolarWinds) » Alerting and Event Processing» Time Series Database
Librato Agent is used to collect Docker metrics. Librato itself manages time series data, alerting and visualization.
Lightstep (Lightstep) » Tracing/Error Tracking/Debugging A distributed tracing system built on top of the OpenTracing standard. LightStep collects, analyzes and presents
high-fidelity end-to-end traces for the requests having the largest impact on your business, and the user experience of your system.
Logentries (Rapid7) » Log Management Logentries provides analytics tools to monitor Docker environments.
Loggly (Loggly) » Log Management Loggly collects log data using existing open standards like syslog and HTTP.
76Ĵ CONTAINER MONITORING & MANAGEMENT
CONT’D: COMPONENTS/CLASSES OF MONITORING SYSTEMS
Product/Project (Company or Supporting Org.) Functionality Includes:
Logsense (Sematext) » Log Management Logsense replaces Logstash in the ELK stack and is provided as a hosted solution.
Open Source Logspout (Glider Labs) » Log Management A log router for Docker containers that runs inside Docker. It attaches to all containers on a host, then routes
their logs wherever you want. It also has an extensible module system. It's a mostly stateless log appliance. It's not meant for managing log files or looking at history. It is just a means to get your logs out to live somewhere else, where they belong.
Open Source Logstash (Elastic) » Log Management Logstash is a tool for managing events and logs.
logz.io (logz.io) » Analytics» Log Management
Log analytics data with hosted ELK as a service.
Meros (Meros) » Log Management Meros offers a GUI that provides monitoring, management, log aggregation and alerts for Docker.
Moogsoft AIOps (Moogsoft) » Alerting and Event Processing Event management driven by real-time machine learning to detect anomalies across your production stack of
applications, infrastructure and monitoring tools.
NetViz (BanyanOps) » Visualization A platform to discover, visualize and analyze microservices and their interactions. Using lightweight, on-host,
deep packet inspection technology, NetViz autodiscovers services and application resources and provides real-time network analysis and insights. Operations and security teams use NetViz to improve the performance, availability and security of their infrastructure.
Open Source OpenTracing API (Cloud Native Computing Foundation)
» Tracing/Error Tracking/Debugging
Consistent, expressive, vendor-neutral APIs for distributed tracing and context propagation.
Open Source Riemann (N/A) » Alerting and Event Processing A network event stream-processing system in Clojure that aggregates events from servers and applications.
Open Source RRDtool (N/A) » Log Management» Time Series Database
A high performance data logging and graphing system for time series data. RRDtool can be easily integrated in shell scripts, Perl, Python, Ruby, Lua or Tcl applications.
Open Source Sentry (Functional Software, Inc.) » Log Management» Tracing/Error Tracking/Debugging
Cross-platform error logging and aggregation.

77Ĵ CONTAINER MONITORING & MANAGEMENT
CONT’D: COMPONENTS/CLASSES OF MONITORING SYSTEMS
Product/Project (Company or Supporting Org.) Functionality Includes:
Open Source Snap (Intel) » Collect/Ingest An open telemetry framework designed to simplify the collection, processing and publishing of system data
through a single API.
Splunk Enterprise (Splunk) » Log Management Simplifies the collection and analysis of data-generated technology infrastructure, security systems and
business applications. Splunk offers a "solution" that focuses on container monitoring and application delivery. A cloud offering is also available.
Stackify (Stackify) » Log Management» Performance Monitoring» Tracing/Error Tracking/Debugging
Provides software developer tools that fully integrate error and log management with application performance monitoring and management for server and developer workstations.
Sumo Logic App for Docker (Sumo Logic) » Log Management The Sumo Logic app for Docker uses a container that includes a collector and a script source to gather
statistics and events from the Docker Remote API on each host. The app wraps events into JSON messages, then enumerates over all running containers and listens to the event stream. This essentially creates a log for container events. In addition to configuration information obtained using Docker’s Inspect API, the app collects host and daemon logs. All this data is integrated into Sumo Logic's monitoring dashboard, which specializes in handling machine data analytics.
Open Source Telegraf n D t » Collect/Ingest An agent written in Go for collecting metrics from the system it's running on, or from other services, and
writing them into InfluxDB or other outputs.
Open Source Trace (RisingStack) » Tracing/Error Tracking/Debugging A visualized stack-trace platform designed for microservices monitoring.
Wavefront (Wavefront) » Analytics» Collect/Ingest
Uses cAdvisor to collect container metrics, which are analyzed along with metrics from other systems and applications.
Open Source Whisper (N/A) » Time Series Database A file-based time series database format for the Graphite project.

78Ĵ CONTAINER MONITORING & MANAGEMENT
MANAGEMENT/ORCHESTRATION
Product/Project (Company or Supporting Org.) Functionality Includes:
Apcera Platform (Apcera) » Management/Orchestration Apcera manages access to compute resources across a cluster of servers. By focusing on managing policies
across multiple environments, it aims to secure workloads and containers in enterprise production environments. It provides cluster monitoring with Zabbix, which is preconfigured for monitoring Apcera Platform components.
Azure Container Service (Microsoft) » Management/Orchestration Azure Container Service simplifies the creation and configuration of a cluster. The default configuration includes
Docker and Docker Swarm for code portability, and Marathon, Chronos and Apache Mesos to ensure scalability.
Cloudsoft Application Management Platform (Cloudsoft) » Management/Orchestration Cloudsoft's application management platform, based on the open source Apache Brooklyn project,
orchestrates services, platforms and infrastructure, including deployment to containers.
ContainerShip (ContainerShip) » Management/Orchestration ContainerShip is a self-hosted container management platform, capable of running on any cloud, and used to
manage containers from development to production.
Open Source Contiv (Cisco) » Management/OrchestrationUnifies containers, VMs, and bare metal with a single networking fabric, allowing container networks to It is be addressable from VM and bare-metal networks.
EC2 Container Service (Amazon Web Services) » Management/Orchestration Amazon EC2 Container Service helps companies manage clusters of containers on AWS infrastructure.
Elastic Cloud (Elastic) » Management/Orchestration An Elasticsearch as a Service offering. It can be used by the Docker community for search and discovery.
Enterprise DC/OS (Mesosphere) » Management/Orchestration Mesosphere's DC/OS is a commercial version of the Mesos OS for managing data centers. It supports both
Kubernetes and Docker.
Most container management platforms include dashboards that let operators
monitor at least some metrics, often to enable the intelligent orchestration of services. This section includes only a sampling of available options.

79Ĵ CONTAINER MONITORING & MANAGEMENT
CONT’D: MANAGEMENT/ORCHESTRATION
Product/Project (Company or Supporting Org.) Functionality Includes:
Joyent Triton (Joyent) » Management/Orchestration A Containers as a Service offering, Triton comes with ContainerPilot, DataCenter and SmartOS functionality
built-in.
Open Source Kubernetes (Cloud Native Computing Foundation) » Management/Orchestration Kubernetes is an open source Docker orchestration tool. Google initially developed Kubernetes to help
manage its own LXC containers. Stateful support is done through a new object called Pet Set. In addition, there are many networking and data volume plugins available.
Nirmata (Nirmata) » Management/Orchestration A cloud-based platform for managing microservices.
OpenShift Online (Red Hat) » Management/Orchestration Red Hat's hosted version of OpenShift, a container application platform that can span across multiple
infrastructure footprints. It is built using Docker and Kubernetes technology.
Platform9 Managed Kubernetes for Docker (Platform9) » Management/Orchestration Kubernetes offered as a managed service. Customers can utilize Platform9's single pane of glass, allowing
users to orchestrate and manage containers alongside virtual machines. In other words, you can orchestrate VMs using OpenStack and/or Kubernetes.
StackPointCloud (StackPointCloud) » Management/Orchestration Allows users to easily create, scale and manage Kubernetes clusters of any size with the cloud provider of their
choice. Its goal is to be a universal control plane for Kubernetes clouds.
Open Source SwarmKit (Docker) » Management/OrchestrationA toolkit for orchestrating distributed systems at any scale. It includes primitives for node discovery, raft-based consensus, task scheduling and more.
Tectonic (CoreOS) » Management/Orchestration A commercial distribution of combined Kubernetes and CoreOS stacks. Tectonic is a Kubernetes-based, end-
to-end commercial container orchestration engine for the enterprise, with an added focus on security.

80Ĵ CONTAINER MONITORING & MANAGEMENT
MISCELLANEOUS
Product/Project (Company or Supporting Org.) Functionality Includes:
Amazon CloudWatch (Amazon Web Services) » Performance Monitoring A monitoring service for AWS cloud resources and the applications that are run on AWS.
Bluemix App Monitoring and Analytics (IBM) » Analytics This component provides health and availability information about applications running in Bluemix. Features
include log analytics, alerting and diagnostics for root cause analysis.
Bluemix Availability Monitoring (IBM) » Performance Monitoring Bluemix Availability Monitoring is integrated into the DevOps toolchain. It runs synthetic tests from locations
around the world, around the clock, to proactively detect and fix performance issues before they impact users.
C ni ed n r str t re M n ement or lo d Monitoring (CA Technologies)
CA Unified Infrastructure Management (CA UIM) for cloud monitoring enables you to proactively and efficiently optimize performance across private or public cloud environments. It’s a comprehensive, unified solution that provides on-premises infrastructure and cloud monitoring through a single view and backend architecture. For customers, this translates into faster mean time to repair and cloud adoption as well as the reduced cost and complexity of managing multiple monitoring tools.
Datadog (Datadog) » Performance Monitoring Datadog is a monitoring and analytics service for IT operations and development teams. It has containerized
agents that can monitor container environments.
Elasticsearch (Elastic) » Analytics Elasticsearch is a search and analytics engine based on Lucene.
Infrastructure Monitoring and Reporting for Bluemix Infrastructure (IBM)
This is the cloud monitoring solution that previously came with the Softlayer offering. It is based on CA Nimsoft, which is now called CA Unified Infrastructure Management for Cloud Monitoring.
Instana (Instana) » Performance Monitoring Application performance management to automatically monitor dynamic modern applications.
Many tools are harder to group into a specific category. The majority of the remaining listings are for performance monitoring of applications and infrastructure.

81Ĵ CONTAINER MONITORING & MANAGEMENT
CONT’D: MISCELLANEOUS
Product/Project (Company or Supporting Org.) Functionality Includes:
Open Source Nagios Core (Nagios Enterprises) » Performance Monitoring Nagios Core serves as the basic event scheduler, event processor, and alert manager for elements that
are monitored. It features several APIs that are used to extend its capabilities to perform additional tasks, implemented as a daemon written in C (for performance), and designed to run natively on Linux/*nix systems.
Netsil (Netsil) » Performance Monitoring Netsil's Application Operations Center (AOC) helps site reliability engineers (SREs) and DevOps overcome
complexity and collaboration issues in API and microservices-driven production applications. At the heart of the AOC is an auto-discovered service topology rendered from live interaction analysis. It allows practitioners to visualize their service dependencies and operational metrics, and work collaboratively across teams. This enables effective application monitoring, capacity planning, incident response, and deploy management.
New Relic APM (New Relic) » Performance Monitoring Application performance monitoring is at the heart of New Relic's suite of products, which it starting to call
Digital Intelligence Platform. Its agent-based approach is particularly good for troubleshooting code-related application performance issues.
Opsclarity (Lightbend) » Performance Monitoring Monitors the health of data frameworks and associated streaming applications.
Outlyer (Outlyer) » Performance Monitoring A systems metrics monitoring service that is meant to be used by both DevOps and operations teams.
OverOps (OverOps) » Performance Monitoring Formerly known at Takipi, OverOps provides monitoring for Java-based applications.
Project Shipped (Cisco)
Cisco's Project Shipped is a model for deploying microservices to the cloud. To reduce environmental inconsistencies, Project Shipped also emulates the cloud environment on your development workstation. Vagrant, Consul and Cisco Microservices Infrastructure are components. It displays metrics such as total containers versus running containers, CPU and memory utilization, and network activity of Docker containers and the applications running in them.
Open Source Sensu (Sensu) » Performance Monitoring A monitoring framework for self-hosted, centralized metrics services.
Sensu Enterprise (Sensu) » Performance Monitoring Sensu Enterprise is the commercial version of Sensu, a monitoring framework for self-hosted, centralized
metrics services.
Open Source VAMP (Magnetic.io) Vamp stands for Very Awesome Microservices Platform. It helps developers build, deploy and manage
microservices. Vamp's core features include a platform-agnostic microservices DSL, powerful A/B testing, canary releasing, autoscaling and an integrated metrics/event engine.
X-Pack (Elastic) A full stack monitoring solution that adds additional functionality to the Elastic Stack (formerly ELK).
82Ĵ CONTAINER MONITORING & MANAGEMENT
CONT’D: MISCELLANEOUS
Product/Project (Company or Supporting Org.) Functionality Includes:
Open Source Zabbix (Zabbix) » Performance Monitoring An open source, enterprise-class monitoring solution.

83Ĵ CONTAINER MONITORING & MANAGEMENT
DISCLOSURESThe following companies mentioned in this ebook are sponsors of The New Stack: Apcera, Aporeto, Arcadia Data, Bitnami, Cloud Foundry, CloudMunch, Cloudsoft, CNCF, Codenvy, CoreOS, DigitalOcean, GoDaddy, HPE, Intel, Iron.io, Macaw, Mesosphere, Nuage Networks, Red Hat OpenShift, Twistlock and Wercker.