content-based image retrieval (cbir) -...
TRANSCRIPT

1
1
Content-based Image Retrieval (CBIR)
Searching a large database for images that match a query:
What kinds of databases?What kinds of queries?What constitutes a match?How do we make such searches efficient?
2
Applications
Art Collections e.g. Fine Arts Museum of San FranciscoMedical Image DatabasesCT, MRI, Ultrasound, The Visible HumanScientific Databasese.g. Earth SciencesGeneral Image Collections for LicensingCorbis, Getty ImagesThe World Wide Web

2
3
What is a query?
an image you already have
a rough sketch you draw
a symbolic description of what you wante.g. an image of a man and a woman ona beach
4
SYSTEMS

3
5
Some Systems You Can Try
Corbis Stock Photography and Pictures
http://www.corbis.com/
• Corbis sells high-quality images for use in advertising,marketing, illustrating, etc.
• Search is entirely by keywords.
• Human indexers look at each new image and enter keywords.
• A thesaurus constructed from user queries is used.
6
QBICIBM’s QBIC (Query by Image Content)
http://wwwqbic.almaden.ibm.com
• The first commercial system.
• Uses or has-used color percentages, color layout,texture, shape, location, and keywords.

4
7
BlobworldUC Berkeley’s Blobworld
http://elib.cs.berkeley.edu/photos/blobworld
•Images are segmented on color plus texture
• User selects a region of the query image
• System returns images with similar regions
• Works really well for tigers and zebras
8
DittoDitto: See the Web
http://www.ditto.com
• Small company
• Allows you to search for pictures from web pages
5
9
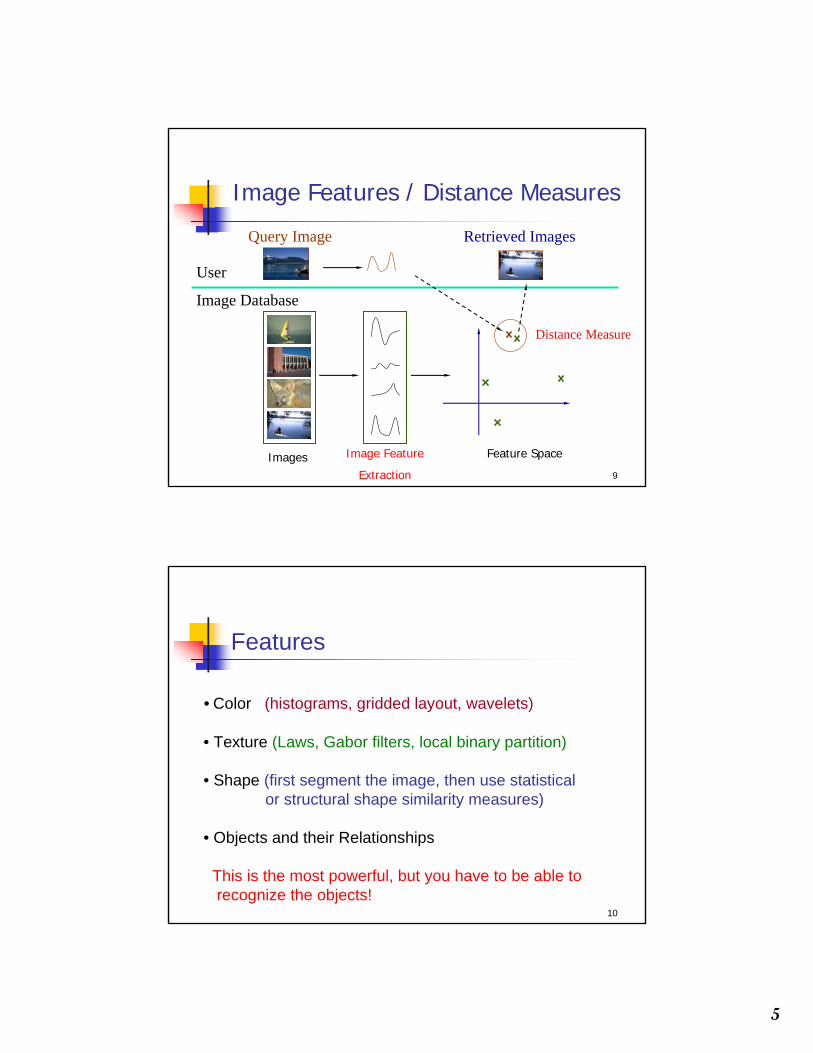
Image Features / Distance Measures
Image Database
Query Image
Distance Measure
Retrieved Images
Image Feature
Extraction
User
Feature SpaceImages
10
Features
• Color (histograms, gridded layout, wavelets)
• Texture (Laws, Gabor filters, local binary partition)
• Shape (first segment the image, then use statisticalor structural shape similarity measures)
• Objects and their Relationships
This is the most powerful, but you have to be able torecognize the objects!

6
11
Color Histograms
12
QBIC’s Histogram Similarity
The QBIC color histogram distance is:
dhist(I,Q) = (h(I) - h(Q)) A (h(I) - h(Q))T
• h(I) is a K-bin histogram of a database image
• h(Q) is a K-bin histogram of the query image
• A is a K x K similarity matrix
7
13
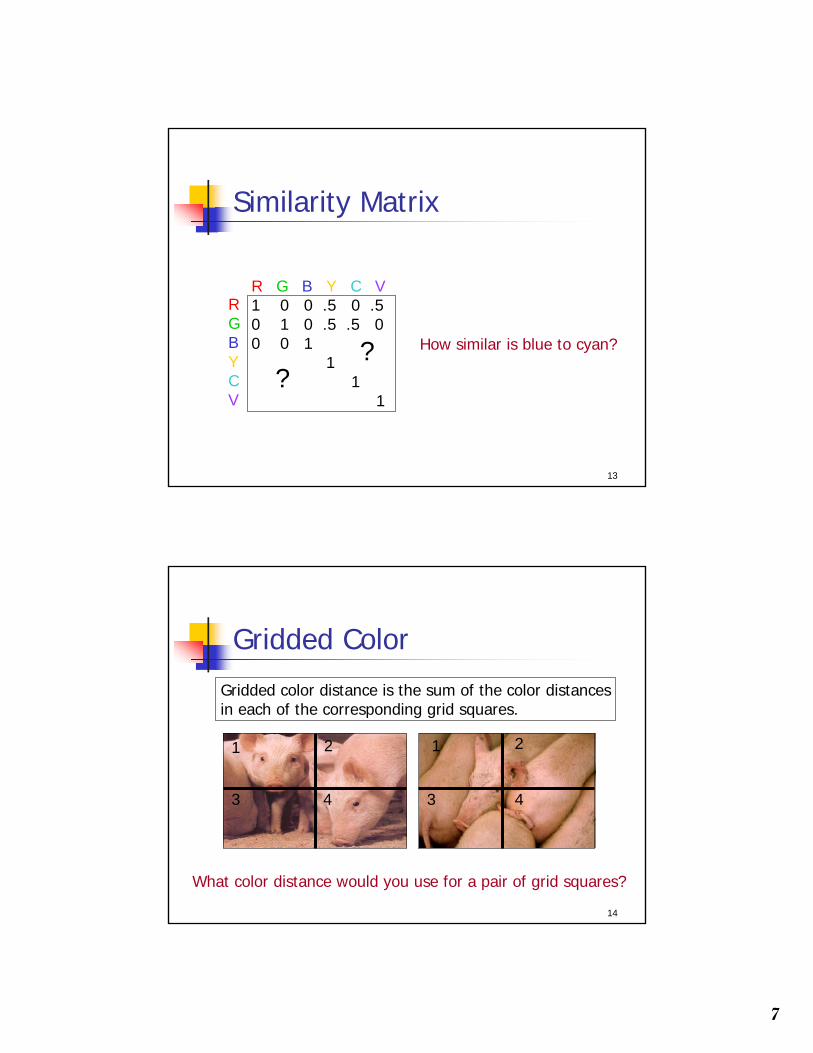
Similarity Matrix
R G B Y C V1 0 0 .5 0 .50 1 0 .5 .5 00 0 1
11
1
RGBYCV
How similar is blue to cyan?
??
14
Gridded Color
Gridded color distance is the sum of the color distancesin each of the corresponding grid squares.
What color distance would you use for a pair of grid squares?
1 12 2
3 34 4

8
15
Color Layout (IBM’s Gridded Color)
16
Texture Distances
• Pick and Click (user clicks on a pixel and systemretrieves images that have in them a region withsimilar texture to the region surrounding it.
• Gridded (just like gridded color, but use texture).
• Histogram-based (e.g. compare the LBP histograms).

9
17
Laws Texture
18
Shape Distances
• Shape goes one step further than color and texture.
• It requires identification of regions to compare.
• There have been many shape similarity measuressuggested for pattern recognition that can be usedto construct shape distance measures.
10
19
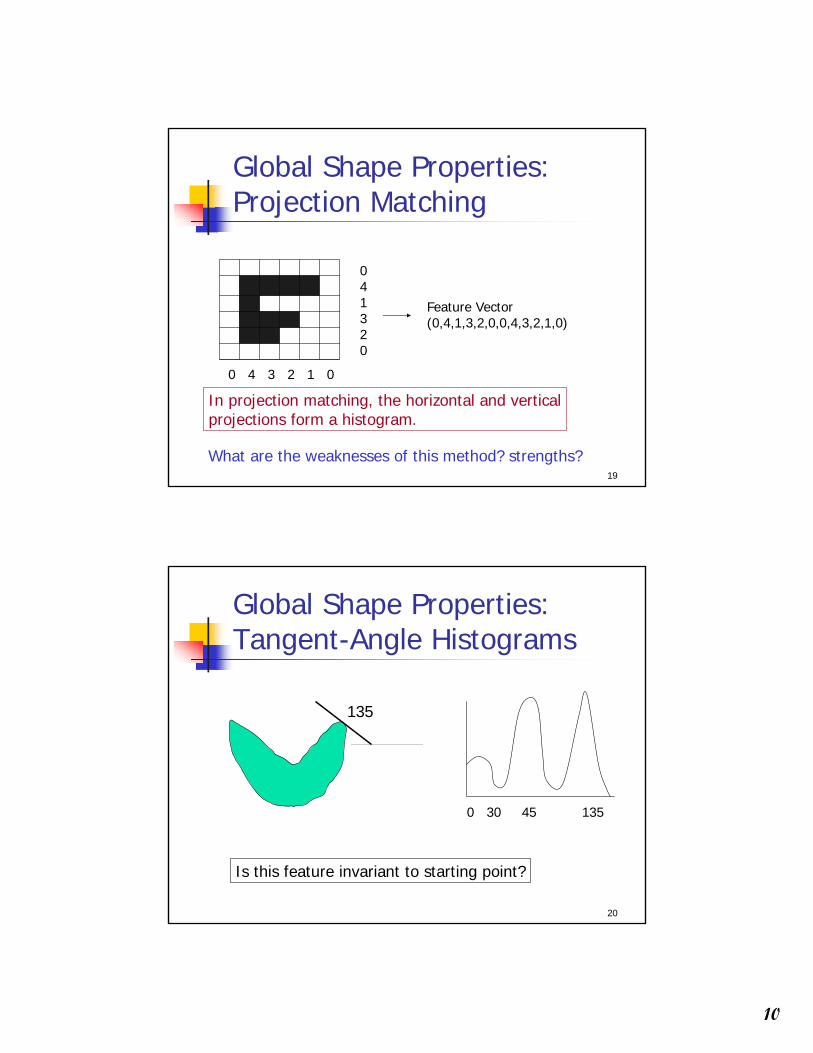
Global Shape Properties:Projection Matching
041320
0 4 3 2 1 0
In projection matching, the horizontal and verticalprojections form a histogram.
Feature Vector(0,4,1,3,2,0,0,4,3,2,1,0)
What are the weaknesses of this method? strengths?
20
Global Shape Properties:Tangent-Angle Histograms
135
0 30 45 135
Is this feature invariant to starting point?

11
21
Boundary Matching• Fourier Descriptors
• Sides and Angles
• Elastic Matching
The distance between query shape and image shapehas two components:
1. energy required to deform the query shape intoone that best matches the image shape
2. a measure of how well the deformed query matchesthe image
22
Del Bimbo Elastic Shape Matching
query retrieved images

12
23
Regions and Relationships
• Segment the image into regions
• Find their properties and interrelationships
• Construct a graph representation withnodes for regions and edges for spatial relationships
• Use graph matching to compare images
Like what?
24
Tiger Image as a Graph
sky
sand
tiger grass
aboveadjacent
above
inside
above aboveadjacent
image
abstract regions
13
25
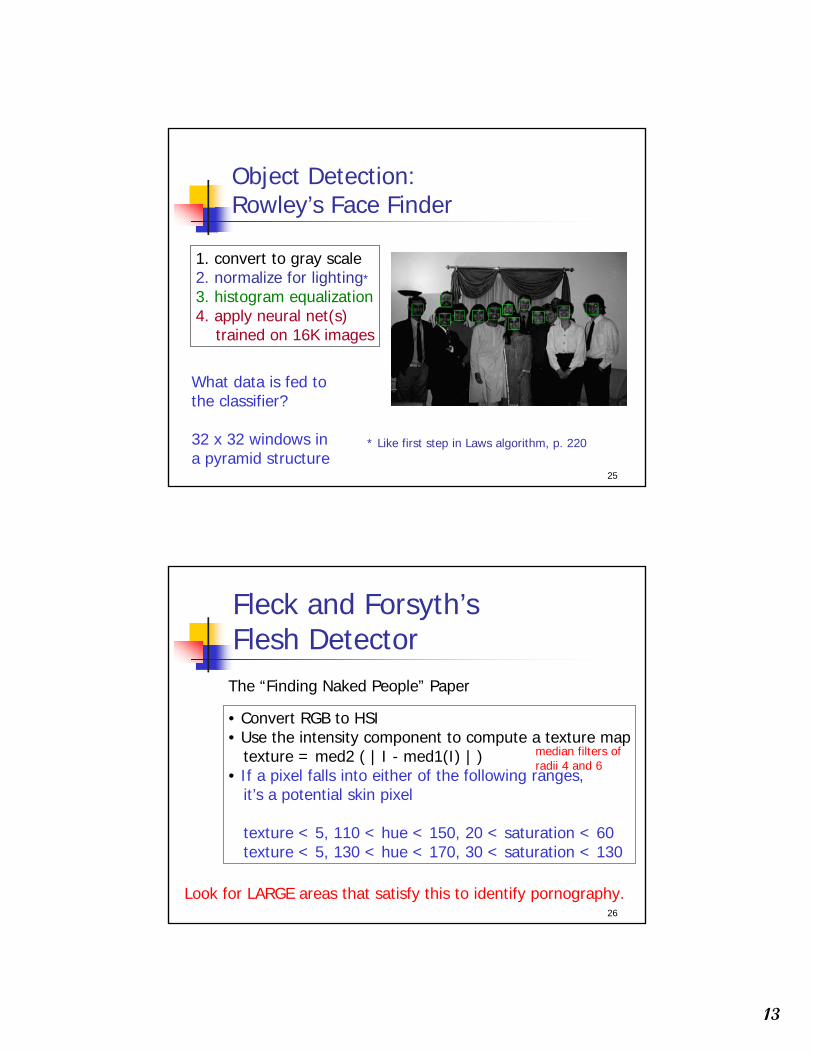
Object Detection:Rowley’s Face Finder
1. convert to gray scale2. normalize for lighting*
3. histogram equalization4. apply neural net(s)
trained on 16K images
What data is fed tothe classifier?
32 x 32 windows ina pyramid structure
* Like first step in Laws algorithm, p. 220
26
Fleck and Forsyth’s Flesh DetectorThe “Finding Naked People” Paper
• Convert RGB to HSI• Use the intensity component to compute a texture map
texture = med2 ( | I - med1(I) | )• If a pixel falls into either of the following ranges,
it’s a potential skin pixel
texture < 5, 110 < hue < 150, 20 < saturation < 60texture < 5, 130 < hue < 170, 30 < saturation < 130
median filters of radii 4 and 6
Look for LARGE areas that satisfy this to identify pornography.
14
27
Wavelet Approach
Idea: use a wavelet decomposition to representimages
What are wavelets?
• compression scheme
• uses a set of 2D basis functions
• representation is a set of coefficients, one foreach basis function
28
Jacobs, Finkelstein, Salesin Methodfor Image Retrieval (1995)
1. Use YIQ color space
2. Use Haar wavelets
3. 128 x 128 images yield 16,384 coefficients x 3 color channels
4. Truncate by keeping the 40-60 largest coefficients(make the rest 0)
5. Quantize to 2 values (+1 for positive, -1 for negative)

15
29
JFS Distance Metric
d(I,Q) = w00 | Q[0,0] - I[0,0] | + ∑ wij | Q’[i,j] - I’[i,j] |ij
where the w’s are weights,
Q[0,0] and I[0,0] are scaling coefficients relatedto average image intensity,
Q’[i,j] and I’[i,j] are the truncated, quantized coefficients.
30
Experiments
20,558 image database of paintings
20 coefficients used
User “paints” a rough version of the paintinghe /she wants on the screen.

16
31
Relevance Feedback
In real interactive CBIR systems, the user shouldbe allowed to interact with the system to “refine”the results of a query until he/she is satisfied.
Relevance feedback work has been done by a number of research groups, e.g.
• The Photobook Project (Media Lab, MIT)• The Leiden Portrait Retrieval Project• The MARS Project (Tom Huang’s group at Illinois)
32
Information Retrieval Model*
An IR model consists of:a document modela query modela model for computing similarity between documents and the queries
Term (keyword) weighting
Relevance Feedback
*from Rui, Huang, and Mehrotra’s work

17
33
Term weighting
Term weightassigning different weights for different keyword(terms) according their relative importance to the document
define to be the weight for term ,k=1,2,…,N, in the document idocument i can be represented as a weight vector in the term space
ikwkt
[ ]iNiii wwwD ;...;; 21=
34
Term weighting
The query Q also is a weight vector in the term space
The similarity between D and Q
QDQDQDSim
),( =
[ ]qNqq wwwQ ;...;; 21=
.
18
35
Using Relevance Feedback
The CBIR system should automatically adjust the weight that were given by the user for the relevance of previously retrieved documents
Most systems use a statistical method for adjusting the weights.
36
The Idea of Gaussian Normalization
If all the relevant images have similar values for component j
the component j is relevant to the query
If all the relevant images have very different values for component j
the component j is not relevant to the query
the inverse of the standard deviation of the related image sequence is a good measure of the weight for component jthe smaller the variance, the larger the weight

19
37
Leiden Portrait System
The Leiden Portrait Retrieval System is anexample of the use of relevance feedback.
38
Andy Berman’s FIDS Systemmultiple distance measuresBoolean and linear combinationsefficient indexing using images as keys

20
39
Andy Berman’s FIDS System:
Use of key images and the triangle inequalityfor efficient retrieval.
40
Andy Berman’s FIDS System:
Bare-Bones Triangle Inequality Algorithm
Offline
1. Choose a small set of key images
2. Store distances from database images to keys
Online (given query Q)
1. Compute the distance from Q to each key
2. Obtain lower bounds on distances to database images
3. Threshold or return all images in order of lower bounds

21
41
Andy Berman’s FIDS System:
42
Andy Berman’s FIDS System:
Bare-Bones Algorithm with Multiple Distance Measures
Offline
1. Choose key images for each measure
2. Store distances from database images to keys for all measures
Online (given query Q)
1. Calculate lower bounds for each measure
2. Combine to form lower bounds for composite measures
3. Continue as in single measure algorithm

22
43
Andy Berman’s FIDS System:
Triangle Tries
A triangle trie is a tree structure that stores the distances from database images to each of the keys, one key per tree level.
root
3 4
1 9 8
W,Z X Y
Distance to key 1
Distance to key 2
44
Andy Berman’s FIDS System:
Triangle Tries and Two-Stage Pruning
• First Stage: Use a short triangle trie.
• Second Stage: Bare-bones algorithm on the imagesreturned from the triangle-trie stage.
The quality of the output is the same as with the bare-bones algorithm itself, but execution is faster.

23
45
Andy Berman’s FIDS System:
46
Andy Berman’s FIDS System:

24
47
Andy Berman’s FIDS System:
Performance on a Pentium Pro 200-mHz
Step 1. Extract features from query image. (.02s ≤ t ≤ .25s)
Step 2. Calculate distance from query to key images.(1μs ≤ t ≤ .8ms)
Step 3. Calculate lower bound distances.(t ≈ 4ms per 1000 images using 35 keys, which is about 250,000 images per second.)
Step 4. Return the images with smallest lower bound distances.
48
Andy Berman’s FIDS System:

25
49
Weakness of Low-level Features
Can’t capture the high-level concepts
50
Current Research Objective
Image Database
Query Image Retrieved Images
ImagesObject-oriented
FeatureExtraction
User
…
Animals
Buildings
Office Buildings
Houses
Transportation
•Boats
•Vehicles
…
boat
Categories
26
51
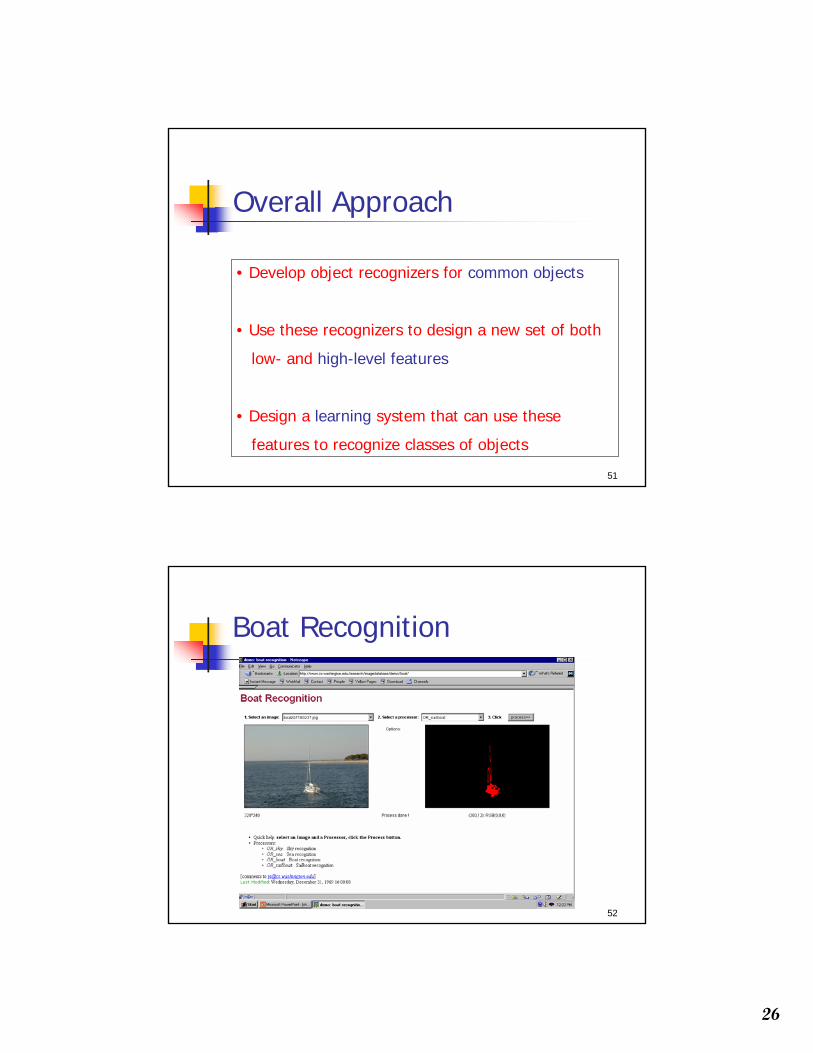
Overall Approach
• Develop object recognizers for common objects
• Use these recognizers to design a new set of both
low- and high-level features
• Design a learning system that can use these
features to recognize classes of objects
52
Boat Recognition

27
53
Vehicle Recognition
54
Building Recognition

28
55
Building Features: Consistent Line Clusters (CLC)A Consistent Line Cluster is a set of lines that are homogeneous in terms of some line features.
Color-CLC: The lines have the same color feature.
Orientation-CLC: The lines are parallel to each other or converge to a common vanishing point.
Spatially-CLC: The lines are in close proximity to each other.
56
Color-CLCColor feature of lines: color pair (c1,c2)Color pair space: RGB (2563*2563) Too big!Dominant colors (20*20)
Finding the color pairs:One line → Several color pairs
Constructing Color-CLC: use clustering

29
57
Color-CLC
58
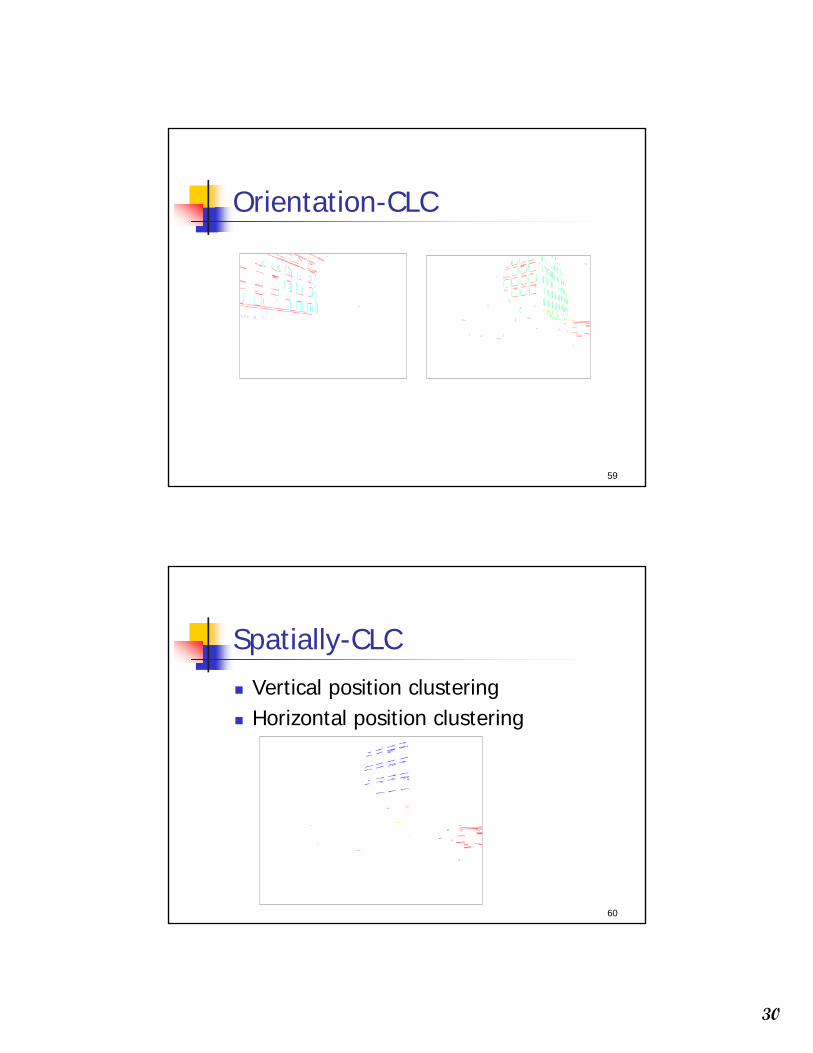
Orientation-CLCThe lines in an Orientation-CLC are parallel to each other in the 3D worldThe parallel lines of an object in a 2D image can be:
Parallel in 2DConverging to a vanishing point (perspective)
30
59
Orientation-CLC
60
Spatially-CLCVertical position clusteringHorizontal position clustering

31
61
Building Recognition by CLCTwo types of buildings → Two criteria
Inter-relationship criterionIntra-relationship criterion
62
Inter-relationship criterion(Nc1>Ti1 or Nc2>Ti1) and (Nc1+Nc2)>Ti2
Nc1 = number of intersecting lines in cluster 1
Nc2 = number of intersecting lines in cluster 2

32
63
Intra-relationship criterion|So| > Tj1 or w(So) > Tj2
S0 = set of heavily overlapping lines in a cluster
64
Experimental EvaluationObject Recognition
97 well-patterned buildings (bp): 97/9744 not well-patterned buildings (bnp): 42/4416 not patterned non-buildings (nbnp): 15/16 (one false positive)25 patterned non-buildings (nbp): 0/25
CBIR

33
65
Experimental EvaluationWell-Patterned Buildings
66
Experimental EvaluationNon-Well-Patterned Buildings

34
67
Experimental EvaluationNon-Well-Patterned Non-Buildings
68
Experimental EvaluationWell-Patterned Non-Buildings (false positives)

35
69
Experimental Evaluation (CBIR)
91.7
87.5
89.6
100
Accuracy(%)
04444Yellowstone
601830Cannonbeach
5 02127Campusinfall
00470Arborgreens
False negative
(#)
False positive
(#)
Total Negative
Classification(#)
Total Positive Classification
(#)
70
Experimental Evaluation (CBIR)False positives from Yellowstone

36
71
Future WorkFuture Work
Constructing hierarchically structured clustersUsing CLC on other objectsCombining CLC with other featuresDeveloping a learning approach usinghierarchical, multiple classifiers (Chou 2000)