content€¦ · content chairman’s message ... factoring locasom rm experts rma rma capital core...
TRANSCRIPT


ContentChairman’s Message ......................................................................................................................4
Presenting BMCE Bank GroupA Member of FinanceCom Group ................................................................................6Composition of the Board of Directors ...................................................................8BMCE Bank Group around the World .................................................................... 10Group Profile ............................................................................................................. 12BMCE Bank’s Shareholders ...................................................................................... 13BMCE Bank Group’s Strategy.................................................................................... 142016-2017 Highlights .................................................................................................. 15Financial Performance ............................................................................................. 16
BMCE Bank in Morocco............................................................................................................. 18Personal and Professional Banking ....................................................................... 18Corporate Banking.....................................................................................................22Investment Banking ....................................................................................................24Resources and Means ................................................................................................28Specialised Financial Subsidiaries ............................................................................32
BMCE Bank in Sub-Saharan Africa .......................................................................................34Bank of Africa Group ................................................................................................34Other African Subsidiaries .......................................................................................65
BMCE Bank in Europe ................................................................................................................68BMCE Bank in Asia and in North America .........................................................................70
BMCE Bank and its Environment .........................................................................................72Global economy ..........................................................................................................72Moroccan economy ....................................................................................................74
BMCE Bank and its Governance ...............................................................................77Work of the Board of Directors .............................................................................78Board of Directors ....................................................................................................82Senior Management ...................................................................................................96Management of Overseas Operations ................................................................... 100Corporate Governance ........................................................................................... 102
BMCE Bank and its Shareholders ......................................................................................113BMCE Bank Shares ....................................................................................................114Investor Relations ....................................................................................................118BMCE Bank’s rating ...................................................................................................119Financial Communications Agenda 2017 ................................................................ 120
Risk Management Organisation ...............................................................................121
Group Compliance ....................................................................................................................139
Social and Environmental Responsibility ....................................................................144BMCE Bank Foundation ........................................................................................... 145Sustainable Development........................................................................................ 147Human Capital ........................................................................................................... 150Public Relations ....................................................................................................... 152African Entrepreneurship Award ......................................................................... 154
Financial Report........................................................................................................................155Management Report ................................................................................................ 156Resolutions ................................................................................................................161Statutory Auditors’ Audit Report on the Consolidated Financial Statements ........................163 Consolidated Financial Statements ....................................................................... 164Statutory Auditors’ General Report on the Parent Financial Statements ..... 196Statutory Auditors’ Special Report ....................................................................... 197Fundamental Accounting Principles ......................................................................211Parent Financial Statements .................................................................................. 214Moroccan Operations .............................................................................................234
BMCE Bank’s Overseas Network ........................................................................................238BMCE Bank Group’s Subsidiaries ........................................................................................239BMCE Bank’s History ............................................................................................................... 240

Chairman’s Message
O U R W O R L D I S C A P I TA L

PAGE
4/5
Completing the first year of its Strategic Development Plan 2016-2020, BMCE Bank of Africa Group’s net income attributable to shareholders of the parent company breached the MAD 2 billion mark for the first time, reaching another record high and highligh-ting the Group’s strong growth dynamic both in its domestic market and overseas. Another record was achieved in terms of the size of the balance sheet, which surpassed the MAD 305 billion threshold.
Performance indicators registered double-digit growth such as consolidated net banking income (+10%) and gross operating income (+15%), demonstrating the underlining health of the Group’s core business.
This performance was also due to the Group’s clear willingness to play a supporting role in Africa’s deve-lopment; the Group, which has one of the most exten-sive branch networks, has forever shown its determi-nation to place Africa at the heart of its international strategy, promoting African development projects on behalf of Africans.
The Group’s leadership can also be seen in its strategy of accelerating the development of inclusive and sustainable finance at the Group level. The recogni-tion bestowed on our institution, domestically and internationally, is derived from our resolute approach, adopted more than 20 years ago, culminating in our noteworthy presence at the COP22 held in Marrakesh. The pioneering and exemplary commitment shown by BMCE Bank of Africa Group and its Foundation is regularly recognised by renowned international chari-table organisations in their international rankings.
With the backing of it 14,000-strong workforce and its diverse business lines, BMCE Bank of Africa Group remains committed, as a pan-African financial insti-tution of Moroccan origin, to being a torch-bearer for Africa, a continent which is a genuine ‘new frontier’ of development for the world in this third millennium. Our Group also continues to fly the flag for Morocco as a bridge head and reliable agent for the continent’s development.
Othman BenjellounChairman & Chief Executive Officer
t
BMCE
BANK
OF
AFRICA

CORE BUSINESS
F BMCE Bank: A universal bank that is Morocco’s third private sector bank with a 14.9% share of both the loan and deposit markets
F RMA: One of Morocco’s leading insurance companies with a 16.7% total market share
F RMA Capital Holding: RMA’s asset management company
GROWTH DRIVERS
F Meditelecom-Orange: Morocco’s second telecommunications operator with 13.7 million subscribers
F Agribusiness: Adarouch Ranch, Africa’s largest bovine and organic beef producer and Morocco’s largest red meat slaughtering, cutting and processing operation
REAL ESTATE F CAP ESTATE: The Group’s real estate subsidiary with MAD 225 million of share capital
F REVLY’S: A joint venture between FinanceCom Group and Aman Resort, specialising in financing tourism projects
F Argan Capital: A real estate investment management company
INTERNATIONAL
F FinanceCom International: A subsidiary overseeing the Group’s asset management and real estate companies around the world
PRIVATE EQUITY
F Finatech: A group of companies specialising in new information technologies structured around two main business lines: the Energy & Infrastructure Division and the Systems Technologies Division
F Other investments: CTM, Air Arabia Maroc, Casablanca Jeemo Cars and Brico Invest
A Member of FinanceCom Group
O U R W O R L D I S C A P I TA L

PAGE
6/7
t
PRIVATEEQUITY
FINATECH
AIR ARABIA
BRICO INVEST
CASABLANCAJEEMEO CARS
FINANCECOMINTERNATIONAL
MEDITELECOM -ORANGE-
CTM
AGROINDUSTRIE
REAL ESTATE
CAP ESTATE
RISMA
AMANJENA
VILLAJANA
ARGAN INVEST
O TOWER
INTERNATIONAL GROWTHDRIVERS
BMCE BANK OF AFRICA
BANK OF AFRICA
BMCE CAPITAL
BMCE BANKINTERNATIONAL
MAGHREBAIL
SALAFIN
MAROCFACTORING
LOCASOM
RM EXPERTS
RMA
RMA CAPITAL
COREBUSINESS
ACTIF INVEST
COLLIERS INTERNATIONAL MAROC
CTM MESSAGERIE
BIO BEEF
RANCH ADAROUCH
BMCE
BANK
OF
AFRICA

from left to rightOthman BENJELLOUNMichel LUCASAbdellatif ZAGHNOUNAzeddine GUESSOUSZouheir BENSAÏDHicham EL AMRANIFrançois HENROTBrian C. McK. HENDERSONPhilippe DE FONTAINE VIVEChristian de BOISSIEUHadeel IBRAHIMBrahim BENJELLOUN-TOUIMI
Hadeel IBRAHIM
O U R W O R L D I S C A P I TA L
Composition of the Board of Directors

PAGE
8/9
Othman BENJELLOUNChairman & Chief Executive OfficerDate initially appointed: 1995* Current term of office: 2013-2019
BANQUE FEDERATIVE DU CREDIT MUTUEL CM-CIC Group Represented by Michel LUCAS Date initially appointed: 2005 Current term of office: 2014-2020
CAISSE DE DEPOT ET DE GESTION Represented by Abdellatif ZAGHNOUN Date initially appointed**: 1966 Current term of office: 2016-2022
RMARepresented by Zouheir BENSAIDDate initially appointed: 1994 Current term of office: 2013-2019
FINANCECOMRepresented by Hicham EL AMRANI Date initially appointed: 2001 Current term of office: 2015-2021
Azeddine GUESSOUSIntuitu PersonaeDate initially appointed: 2017 Current term of office: 2017-2023
François HENROTIndependent DirectorDate initially appointed: 2016Current term of office: 2016-2022
Brian C. McK. HENDERSONIndependent DirectorDate initially appointed: 2016Current term of office: 2016-2022
Philippe DE FONTAINE-VIVEIndependent DirectorDate initially appointed: 2016Current term of office: 2016-2022
Christian de BOISSIEUIndependent DirectorDate initially appointed: 2016Current term of office: 2016-2022
Hadeel IBRAHIM Independent DirectorDate initially appointed: 2017Current term of office: 2017-2023
Brahim BENJELLOUN-TOUIMIGroup Executive Managing DirectorDate initially appointed: 2004Current term of office: 2016-2022
BMCE Bank Group’s Board of Directors comprises twelve directors, five of whom are Independent
Directors including one female director.
(*) Each term of office shall take effect from the date on which the Annual General Meeting
is convened to rule on the previous year’s financial statements.
(**) CDG had a seat on BMCE Bank’s Board of Directors from 1966 to 1997 and was then
reappointed at the Annual General Meeting of 26 May 2010.
t
BMCE
BANK
OF
AFRICA

More than 55 Years of Growth and Development in Morocco and Overseas
t
RWANDA
CANADA
PORTUGALSPAIN
TUNISIAMOROCCO
NIGER
BENINTOGOGHANA
CONGO BRAZZAVILLE
DRC
MALI
SENEGAL
CÔTE D’IVOIRE
BURKINA FASO
MADAGASCAR
DJIBOUTIETHIOPIA
KENYA
TANZANIA
UGANDA
BURUNDI
FRANCEGERMANY
ITALY
NETHERLANDSBELGIUM
UNITED KINGDOM
CHINA
UNITED ARAB EMIRATES
CAMEROON*
(*) in progress
Operations in 32 countriesMore than 1,600 points of saleMore than 5,500,000 customersMore than 14,800 employees

PAGE
10/1
1
O U R W O R L D I S C A P I TA L Namib Desert, Namibia
F 1st bank to establish international operations when it opened a branch office in paris in 1972F 1st bank to establish operations in sub-saharan africa after cleaning up banque de
développement du mali in 1989 F 1st moroccan bank to issue gdrs in 1996F 1st corporate in morocco to issue a eurobond in 2013F 1st moroccan bank to be listed on 3 stock markets – casablanca, london and luxemburg F 1st moroccan bank to have operations in east africa and southern africa
F 1st moroccan bank to open a representative office in beijing, china in 2000
BMCE
BANK
OF
AFRICA

A Multi-Business, Multi-Brand and Multi-National Banking Group
O U R W O R L D I S C A P I TA L
INTERNATIONAL
EUROPE
F BMCE International Holding 100%
F BMCE Euroservices 100%
AFRICA
F Bank of Africa 72.85%F La Congolaise de Banque 37%F Banque de Développement du Mali 32.4%
MOROCCO
SPECIALISED FINANCIAL SERVICES
F Maroc Factoring 100%F Maghrébail 52.5% F Salafin 74.8%F RM experts 100%
COMMERCIALBANKING
F BMCE BANK SA
INVESTMENT BANKING
F BMCE Capital 100% F BMCE Capital Gestion 100% F BMCE Capital Bourse 100%
OTHERS
F Locasom 97.4%F Acmar 20%F Eurafric Information 41% F Conseil Ingénierie et
Développement 38.9%

PAGE
12/1
3
t
FinanceCom
FinanceCom, a leading private sector Mo-roccan Group with pan-African coverage, has operations in a variety of high growth sectors including banking, insurance, tele-coms and media.
CDG Group
CDG Group is Morocco’s leading institu-tional investor and a benchmark domestic institution with interests in businesses such as public investment finance and investment management.
BFCM-CM-CIC Group BFCM-CM-CIC Group, which is France’s 2nd retail bank with more than 13 mil-lion customers and the country’s leading bank-insurer, is market leader in the elec-tronic banking segment and a major player in banking for professionals.
RMA A key player in the insurance and bank-in-surance market, RMA Watanya is one of North Africa’s leading companies with an extensive and solid distribution network.
BMCE BANK’S SHAREHOLDERSAT END-MAY 2017
36.30%FINANCECOM GROUP
19.36% FREE-FLOAT
9.55%CDG
GROUP
3.19%MAMDAMCMA
4.09%CIMR
1.30% BMCE BANKEMPLOYEES
26.21%BANQUE FEDERATIVEDU CREDIT MUTUEL
CM-CIC GROUP
29.82%RMA
5.97%FINANCECOM
0.51%SFCM
BMCE
BANK
OF
AFRICA

As a leading pan-African financial Group, BMCE Bank of Africa, which is a universal bank with a diversity of business lines, is pursuing an organic as well as acquisition-led growth strategy. It intends to expand its operations overseas – in Africa via Bank Of Africa Group, Banque de Développement du Mali and La Congolaise de Banque, in Europe via BMCE International Holding, which brings together the Group’s two European-based subsidiaries in London and Madrid and BMCE EuroServices, a payment institution for Moroccan and African migrants and via representative offices in Asia, North America and the United Arab Emirates.
The Group’s corporate strategy 2016-2020 involves bolstering its Retail Banking and Corporate Banking operations, developing the SME market segment and accelerating implementation of the Convergence Programme aimed at structuring the Group, with an emphasis on the Risks, Ad Hoc and Permanent Control, Compliance, IT and Human Capital functions.
In addition, the Group is continuing to bolster its corporate governance by appointing independent directors who, given their experience and background, reflect the Group’s increasingly diverse and international operations.
BMCE Bank of Africa is also increasing intra-Group commercial and operational synergies across business lines and geographical regions while remaining firmly committed to multi-channel banking, CSR and sustainable development. The Group has taken its first steps in inclusive and sustainable finance at the continental level in line with a proactive approach to sustainable development, adopted ever since the Bank was privatised.
O U R W O R L D I S C A P I TA L
BMCE Bank Group’s Strategy

PAGE
14/1
5
n Contributed to Morocco’s alliance with China, assuming the role of investor and banker as part of the Cité Mohammed VI Tanger-Tech project, presided over by His Majesty the King, following the signing of a partnership agreement with HAITE Group, a Chinese group and the region of Tangier Tétouan-Al Hoceima;
n Participated in the official launch of ‘Principles for positive impact finance’, organised by Europlace and UNEP FI; this is a common global framework to help the finance community assess the sustainability of their assets;
n ‘Let’s Dream of a New World’, an advertising film, won the award for Best Film in the Corporate category at the US International Film & Video Festival, Gold Camera awards for Cinematography and Direction and a Silver Screen award for Music;
n More recognition for ‘Let’s Dream of a New World’, the advertising film, at the Mobius Awards for Advertising in Los Angeles in the ‘Visual Effects’ and ‘Art Direction’ categories. It was also nominated in the Best Film category at the American Advertising Festival.
n ‘Top Performer, CSR Morocco’, awarded by Vigeo-Eiris, a non-financial ratings agency, for the 4th consecutive year in the ‘Environment’ category
n BMCE Bank of Africa became the first Moroccan bank to issue green bonds by public offering to help finance eco-responsible projects at home and abroad and support private and public sector initiatives aimed at preserving natural resources.
n First Moroccan bank to sign up to the United Nations Global Compact, underlining its commitment and support for the ten principles relating to human rights, labour standards, environmental protection and anti-corruption.
n Signed up to the ‘Mainstreaming Climate Action within Financial Institutions’ initiative in conjunction with the EIB, the AfDB, the EBRD, HSBC, Yes Bank and others financial institutions.
n BMCE Bank Of Africa included in the Eiris‐Vigeo Emerging 70 Index specialising in emerging countries in recognition of best practice in CSR
n BMCE Capital Gestion Privée became the first financial institution in Morocco to obtain ISO 9001:2008 certification for its private portfolio management operations;
n BMCE Capital Gestion obtained Service Commitments and ISO 9001: 2015 certifications in May 2016;
n BMCE Bank Of Africa an award winner for the 3rd consecutive year at the CSR Arabia Awards 2016
n First bank in the MENA region to obtain ISO 50001 certification for its Energy Management System
n First Moroccan bank and the second in Africa to be awarded HEQ certification from Cerway International Certification for the new BMCE Bank Of Africa Academy head office – design and implementation phases
n MOU signed with the AfDB and the EIB for Africa’s first ever credit facility totalling EUR 20 million for financing Climate Change Adaptation.
2016-2017 Highlights
t
BMCE
BANK
OF
AFRICA

Net income attributable to shareholders of the parent company
Net income attributable to shareholders of the parent company rose by +4% to MAD 2,036 million in 2016 versus MAD 1,956 million in 2015, breaching the MAD 2 billion mark. Consolidated ROE was 12.6%.
Net banking income
Consolidated net banking income was MAD 12,990 million in 2016 versus MAD 11,817 million in 2015, an increase of +10% on the previous year. This was due to a strong performance by market operations (+86%) as well as net interest income and fee income which were both up 8%.
Total assets
BMCE Bank Group’s total assets stood at MAD 306 billion at 31 December 2016, up +9.5% compared to 2015. Total assets breached the MAD 300 billion mark for the first time.
Shareholders’ equity attributable to shareholders of the parent company
BMCE Bank Group’s shareholders’ equity rose by +7% to MAD 18.3 billion in 2016 versus MAD 17 billion in 2015.
CONSOLIDATED FINANCIAL STATEMENTS
2015 2016 2015 2016 2015 20162015 2016
Financial performance
NET INCOME ATTRIBU-TABLE TO SHAREHOLDERS OF THE PARENT COMPANY
NET BANKING INCOME
SHAREHOLDERS’ EQUITY ATTRIBUTABLE TO SHAREHOLDERS OF THE PARENT COMPANY
TOTAL ASSETS
+4% +10% +9% +7%
IN B
ILLI
ON
MA
D
IN B
ILLI
ON
MA
D
IN B
ILLI
ON
MA
D
IN B
ILLI
ON
MA
D
1,9 12 17
2 13 18
279
306

PAGE
16/1
7
Parent Net Income
BMCE BANK S.A’s net income rose by +1.6% to MAD 1,325 million in 2016 versus MAD 1,304 million in 2015.
Parent Net Banking Income
The Bank’s net banking income rose by +14.2% from MAD 5,374 million in 2015 to MAD 6,136 million in 2016 due to a combination of factors:n A steep rise in income from market operations (+68%) compared to 2015 due to the performance of the bond portfolio;n Growth of almost +5% in net interest income;n A +21% increase (+MAD 89 million) in dividends to MAD 512 million in 2016 versus MAD 423 million in 2015;n A +8.5% increase in fee income.
Loans and Deposits
The Bank’s loans registered growth of +9.7% versus +4% at the industry level to MAD 119 billion in 2016 versus MAD 108 billion in 2015. The Bank’s share of the loan market improved by 66 basis points from 14.28% at 31 December 2015 to 14.94% at 31 December 2016.
Customer deposits increased by +8.1% to MAD 122 billion while the Bank’s share of the deposit market increased by 48 basis points share of the deposit market to 14.94% at 31 December 2016.
PARENT FINANCIAL STATEMENTS
MARKET SHARES - DEPOSITS 2015 2016TOTAL DEPOSITS 14.23% 14.94%Cheque accounts 13.48% 13.62%Current accounts 11.45% 12.80%Savings book accounts 14.62% 14.60%Term deposits 16.38% 18.29%Deposits from Moroccans living abroad 10.37% 10.63%
2015 2016TOTAL LOANS 14.28% 14.94%Loans to finance companies 20.23% 18.78%Operating loans 16.13% 17.99%Equipment loans 9.23% 10.59%Consumer loans 20.35% 20.13%Loans to real estate developers 15.63% 15.66%Mortgage loans 15.00% 15.14%
MARKET SHARES - LOANS
2015 2016 2015 2016
NET INCOME NET BANKING INCOME
IN M
ILLI
ON
MA
D
IN M
ILLI
ON
MA
D
+2% +4%
1 304 5 374
1 3256 136
BMCE
BANK
OF
AFRICA

PERSONAL BANKING Developing the Young Persons market segment
In 2016, the BMCE Bank bolstered its position in the Young Persons segment by adding new customers and increasing product penetration of this customer segment.
The product range was enhanced with the launch of a number of new products such as Enseignement+ and Enseignement+ Complémentaire, the Pack Premium specialist banking service, Crédit Joker and a capped variable rate mortgage. The Jeune et merta7 communi-cations campaign was also carried out.
A number of agreements were signed with higher educa-tional establishments highlighting the range of financing options available to students intending to pursue their studies and a partnership agreement was also signed with Booking.com.
PROFESSIONAL BANKING At the heart of retail banking strategy
Sales and marketing initiatives organised in 2016 resulted in the Bank attracting more than 300,000 new customers, up +15.3% compared to 2015, with the penetration rate also improving among healthcare professionals, tradesmen and small retailers.
As a follow-up to the ‘Pro-Actif’ project carried out in 2014, a new strategy focusing on small businesses – ‘Entrepreneurial approach: growth strategy for small businesses’ – was launched in 2016 to enable BMCE Bank to make inroads into this high value-added seg-ment.
In conjunction with the Bank’s Economic Intelligence Centre, ‘Business Edge’, a customised training pro-gramme developed by IFC was introduced, aimed at improving the skills set of entrepreneurs in a number of areas. The training cycle, programmed for all 8 regions within BMCE Bank’s coverage, was already unveiled in 3 regions in 2016.
In addition, the Professional Banking segment also saw its pool of payment terminals enhanced with the introduction of mobile points of sale (MPOS). These are mobile devices connected via Bluetooth to retailers’ smartphones and used when payment on delivery is required.
Consistent with the government’s strategy aimed at supporting small business development in Morocco, BMCE Bank helped launch the 2nd ISTITMAR Crois-sance programme, a competition for small businesses with up to MAD 2 million awarded to the prize-winners.
In 2016, BMCE Bank of Africa participated in the 4th International Forum for Small Businesses and Auto-En-trepreneurs as national sponsor, underlining its reputa-tion as a bank that supports entrepreneurs.
BMCE Bank also participated, alongside other bu-sinesses in the Small Business Regional Committees initiated by Bank Al Maghrib. BMCE Bank’s Regional Divisions, by attending these committees, were able to gain a more in-depth understanding of the context and the challenges currently facing small businesses in Mo-rocco and get to familiarise themselves with the various options that exist for promoting small businesses.
Personal and Professional Banking
BMCE BANK IN MOROCCO
O U R W O R L D I S C A P I TA L

PAGE
18/1
9
With the introduction of auto-entrepreneur status and, as part of initiatives aimed in developing this new customer segment, awareness raising seminars were organised across the entire Kingdom condition of the Regional division Local Authorities and Associations.
PRIVATE BANKINGA very high value-added market segment
In 2016, Private Banking saw its portfolio grow by +35% compared to 2015.
New products launched included BMCE Asset Facility, a leveraged loan facility, in conjunction with Salafin. This is a credit facility for customers with a securities portfolio that may be used as collateral to raise capital.
Private Banking participated in a promotional campaign with Mastercard aimed at boosting overseas payment transactions using Mastercard.
Subsequent to a number of agreements being signed between BMCE Bank of Africa and prestigious real estate developers, marketing initiatives were organised targeting the Bank’s high wealth and private banking customers to provide them with better real estate opportunities.
In the context of the passing of Act 63-14 relating to assets and cash held by Moroccans living abroad who wish to transfer their tax residence to Morocco, assistance was provided to support and advise these customers.
MIGRANT BANKINGDedicated to Moroccans living abroad
The deposits of BMCE Bank’s Moroccan customers living abroad rose by +8.2% year-on-year to MAD 18.3 billion versus +5.6% at the industry level. The steepest increase was seen in cheque accounts (+11.2%) which helped improve the composition of deposits of Moroc-cans living abroad.
For the 3rd consecutive year, BMCE Bank’s share of the deposit market continued to trend higher, reaching 10.63%, up 28 basis points compared to 2015.
Similarly, transfers handled by BMCE Bank rose by +2.1% to MAD 3.4 billion versus MAD 3.3 billion in 2015.
BMCE EuroServices continued to bolster its position, registering a +21% year-on-year increase in transfers, with the best performance coming from those coun-tries in which the Bank has only recently established operations – the Netherlands and Belgium.
France and Spain were, as usual, the main countries of residence of Moroccan customers living abroad accounting for 42% and 23% respectively of this cus-tomer category. It is worth noting, however, that those
countries in which the Bank has recently established operations registered the strongest growth – Belgium (+24%), Canada (+21%) and the Netherlands (+19%).
Responding to a tender by MoneyGram International to launch a Cash to Account transfer service in Morocco, BMCE Bank of Africa was selected to handle all Mo-neyGram International’s cash transactions for Moroc-can bank accounts.
As part of the global partnership with MoneyGram International, the Bank has become, since March 2016, a platform for centralising MoneyGram International’s entire transfer flows to bank accounts in Morocco as well as acting as a payer network for MoneyGram Inter-national’s cash disbursements.
The partnership with CM-CIC Group has also gone from strength to strength. Three new desks were ope-ned in Bastia, Cannes and Nice in 2016, taking the total number of desks to 33.
Migrant Banking provides its customers with a varied range of products and services. Pack Dawli registe-red growth of +16% and BMCE Salama +12% while subscriptions to BMCE Direct increased by +19%.
In 2016, the overseas network participated in the participated in the 6th SMAP Immo expo in Brussels, renamed the Moroccan Property Expo, as well as the 13th SMAP Paris. Both expos are very popular with the Moroccan diaspora. These events enabled the network to market the Bank’s products and services to this cus-tomer segment and expand its database of prospective customers.
Another event which had a positive impact on the Bank’s expat business was the 4th tour by mobile branches across France, Spain and Italy intended to reach out to Moroccans living in Europe.
Similarly, as part of a process of diversifying the different types of Moroccan customer living abroad, seminars were organised in Barcelona and Paris for Moroccans living abroad who wish to invest in their home country.
In conjunction with these overseas seminars, a series of regional seminars was organised during summer 2016 in Beni Mellal, Tangier, Meknès, Al Hoceima, Nador, Oujda and Kénitra.
BMCE
BANK
OF
AFRICA

Likouala-aux-Herbes near Bouanila and Mongouma Moké, Republic of Congo (Congo-Brazzaville)
O U R W O R L D I S C A P I TA L
BMCE BANK IN MOROCCO

PAGE
20/
21
During summer 2016, nearly 2.6 million Moroccans living abroad returned to Morocco, an increase of +6.5% on 2015. A large-scale summer marketing campaign was conducted to foster closer relations with Moroccans living abroad during their stay in Morocco, assist Moroccan investors and highlight online banking channels for Moroccans living abroad.
DIGITAL BANKINGAn enhanced range
New customer pathways were introduced for personal as well as professional customers aimed at meeting the growing needs of an increasingly digitalised customer base more effectively. Seven high-impact customer pathways were prioritised.
The digital banking range was enhanced with the intro-duction of new functionality for BMCE Direct and ATMs e.g. paying invoices, booking meetings online.
2016 saw the ongoing expansion of the Bank’s branch network with 26 new branch openings, taking the total number of Personal/Professional branches to 690 units.
As far as off-site ATMs were concerned, BMCE Bank won a tender offer launched by ONCF to install ATMs in 11 stations. All 60 ATMs installed in stations will bear the Bank’s colours and will have digital screens broadcasting institutional messages, thereby enabling the Bank to promote its products.
In 2016, Agence Directe was launched with three goals: (i) win market share in the Migrant Banking customer segment in those countries in which BMCE Bank does not have a branch or if there is no BMCE EuroServices’ branch close by (ii) serve and market products to Migrant Banking customers more effectively and (iii) tele-sales.
Since launch until the end of 2016, the Agence Directe website has received nearly 66,000 visitors. It has also enabled the Bank to build a database of more than 1,000 prospective Moroccan customers living abroad.
BANK-INSURANCEConstantly expanding business
At 31 December 2016, bank-insurance revenue rose by +1.42% year-on-year to MAD 2.11 billion with the number of pension policies sold up +30.43% and property & casualty policies up +17.91%. The number of outstanding bank-insurance contracts rose across all segments and by +7.7% on a year-on-year basis.The Assistance business enjoyed an exceptional year in 2016 with revenue growing by +30% versus 2015.
Similarly, RMA, a FinanceCom Group subsidiary, signed a global strategic partnership with SAHAM Assistance on 1st January 2016. This new partnership is aimed at marketing RMA Assistance products in the domestic and migrant banking markets, replacing the previous AXA Assistance range.
PAYMENT CARDSMarket share gains
In 2016, payment cards in circulation rose by +7.4% year-on-year to 1.13 million cards.As a result of a trend towards democratising Premium card usage, the number of payment cards has in-creased tenfold in just two years.
Similarly, the stock of international cards grew by almost 115,000 cards in 2016, primarily due to the com-mercial success of the Premium payment card range, which enables customers to make overseas payments and withdrawals in foreign currencies.
This, together with card activation campaigns, saw the average monthly number of payment cards in circula-tion rise to 119,000 cards in 2016.
While the Bank’s volume of e-commerce transactions outpaced that of the industry, its average inter-change fees were 0.8% of transactions on average. The Bank also made market share gains, registering growth of +36.4% compared to 2015.
As far as foreign currency-denominated transactions were concerned, the use of payment cards grew by as much as +32% compared to 2015. The Bank saw its market share in this segment rise to 21.44% in 2016, generating international inter-change fees.
The volume of domestic e-commerce flows rose by 14.8% in 2016, resulting in a market share of 14.64% in 2016 versus 12.94% in 2013.
OVER-THE-COUNTER CURRENCY EXCHANGEIndicators on the up
In 2016, the overall over-the-counter currency exchange transaction volumes rose sharply (+12.1% compared to 2015). This was primarily due to the high numbers of tourists and Moroccans living abroad using ATMs at ports and airports as well as new bureau de change outlets under franchise.
In 2016, off-site currency exchange outlets were opened in Marrakesh airport and the Sheraton Hotel, Casablanca as well as on-site in the Marrakesh Gueliz branch. Similarly, foreign exchange outlets in the Oujda downtown branch and those in Fez airport – before and after customs clearance – were redesigned.
BMCE
BANK
OF
AFRICA

Corporate Banking
CORPORATE BANKINGGenuine sales clout
Corporate Banking loans excluding Finex rose by +12.3% to MAD 70.9 billion in 2016 versus MAD 63.1 billion in 2015, growing more rapidly than the +4.3% growth recorded by the industry. BMCE Bank was ranked third with a 14.6% share of the market at 31 December 2016, up +82 basis points.
Similarly, Corporate Banking deposits rose by +16.4% to MAD 32.2 billion in 2016 versus MAD 27.7 billion in 2015 and -1% at the industry level. BMCE was ranked third with a 17.4% share of the market at 31 December 2016, up +246 basis points.
FOREIGN TRADEHealthy business activity
Foreign trade flows reached MAD 145.6 billion in 2016, a steep increase of +13.7% year-on-year versus +6.9% at the industry level. This performance was due to healthy import flows (+14.4% versus +9.5% at the industry level) and export flows (+12.8% versus +2.5% at the industry level).
2016 highlights included redesigning the Foreign Trade department’s information systems, which involved im-plementing guarantees and introducing a pilot site for import-export documentary remittances and incoming and outgoing transfers.
In addition, BMCE Bank’s customers may access two different websites – BMCE Trade and Trade Maroc – if they wish to carry out foreign trade transactions. At 31 December 2016, 87,000 visitors had visited BMCE Trade with 315 profiles approved. As far as the Trade Maroc website was concerned, 1,035 profiles had been approved at 31 December 2016 from 1,380 subscrip-tion applications.
A partnership agreement was also signed in May 2016 between BMCE Bank and ASMEX providing guidelines for formal cooperation across a number of areas such as training, exchanging economic and sector-related information, organising seminars and participating in promotional and sales-based activities. BMCE Bank also participated in a variety of trade shows such as MEDFEL in Perpignan, Les Rendez-vous de l’Entre-prise, SIFEL in Agadir, ELEC Expo in Casablanca, Rencontres Africa 2016 in Paris and the International Conference on One-stop Counters in Marrakesh.
PROJECT FINANCEFinancing major projects
In 2016, BMCE Bank continued to help corporates launch flagship projects as arranger or by providing partial financing or syndicated loans.
BMCE Bank was awarded the prize for the Best Wind Farm Project in 2015 by Dubai-based IJGlobal for its structuring of this large-scale project and the prize for the Best Project Finance Project 2015 by Lon-don-based EMEA Finance.
SME MARKET SEGMENTIncreased exposure to the very small business segment In 2016, BMCE Bank continued to make every effort to consolidate its strategic position in the SME segment in line with its development strategy for this market segment.
As a result, BMCE Bank introduced a number of high value added products to meet the diverse needs of SME customers including Crédit Formaté, Avance sur Marchandise and Tréso Plus, an amortisable advance.
It also redesigned the SME business package and the corporate payment card range. To support businesses with operations in the Offshore Zone, BMCE Bank enhanced its SME Business Package, enabling current account and convertible dirham account holders to subscribe for the package.
BMCE Bank signed partnership agreements with ASMEX, the Rabat-Salé-Kénitra CGEM and Casablan-ca Finance City, aimed at supporting SME customers by providing training, information and quality banking services. It also signed a second EUR 35 million credit facility contract with MorSEFF.
After the initial success of the first IMTIAZ Croissance programme launched by Maroc PME, BMCE Bank par-ticipated in the 2nd IMTIAZ Croissance programme in 2016 with the aim of promoting productive investment in industrial ecosystems. This new programme received 111 applications, 20 of which were from BMCE Bank’s customers.
BMCE BANK IN MOROCCO

PAGE
22/
23
In addition, as part of its policy of building strong customer relations and fostering customer loyalty among SMEs, BMCE Bank developed, in addition to the SME Club, two new concepts: the Centre for Expertise and Entrepreneurship for Small Businesses and Les Rendez-Vous de l’Enterprise, aimed at supporting SME customers by sharing expertise and knowledge.
Les Rendez-vous de l’Entreprise is a new event-based communications concept consisting of organising theme-based conferences and a series of meetings. Five conference-debates took place in 2016.
Similarly, another new and innovative concept named the Centre for Expertise and Entrepreneurship for Small Businesses is a dedicated forum for promoting entrepreneurship and very small businesses. The aim is to provide support, advice and assistance to SMEs that are either planning to set up a business or develop an existing business.
In addition, in accordance with the recommendations of the most recent regional small business tour orga-nised by the Professional Grouping of Moroccan Banks (GPMB), BMCE Bank actively participated in 12 Regio-nal Committees to develop closer relations with local businesses and provide support at the regional level.
BMCE Bank also participated in five flagship events – SIAM 2016, the Tangier Auto Sub-Contractors Expo, LOGISMED, ELEC EXPO and the Automotive Meetings Tangier – unmissable events for business owners as they provide opportunities for developing partnerships and support for SMEs in growing their businesses.
Similarly, BMCE Bank is endeavouring to forge partnerships with Industrial Zone Associations and Chambers of Commerce as a way of gaining access to prospective customers. The Bank is also developing a network of contacts such as consultants and photovol-taic manufacturers so as to promote its CAP ENERGIE product for energy efficient projects.
Cash Management
In 2016, a number of cash management services were developed or enhanced such as Cash Pool, BMCE Scan Valeurs, Ramassage de Fonds, Direct Report and Direct Valeurs.
Additional synergies with the Group’s other business lines Corporate Banking continued to generate additional synergies with the Group’s various specialised subsidia-ries including Maghrebail, Maroc Factoring, Locasom, RMA and BMCE Assurances.
As part of the process of developing sales synergies between the BMCE Bank and CM-CIC groups, BMCE Bank designed PLATAC, a support platform for CM-CIC Group’s existing and prospective customers that would like to invest in sub-Saharan Africa.
BMCE Bank has developed a dedicated range of services comprising (i) opening special accounts with day-to-day management services, (ii) financing facilities and guarantees, (iii) cash management on preferential terms, (iv) giving advice about overseas development and (v) supporting businesses in sub-Saharan Africa.
O U R W O R L D I S C A P I TA L
BMCE
BANK
OF
AFRICA

Investment Banking
BMCE Capital posted another set of highly respectable results in 2016 due to a strong performance by its core businesses and the sound corporate strategy set by its decision-making bodies.
The benefits of implementing the Grow in Africa (GINA) strategic plan are beginning to be felt in terms of syner-gies, deal origination and additional revenue generated.
In addition, a number of value-accretive strategic pro-jects were carried out in 2016 including: (i) buying out Axis Capital’s minority shareholders, with the company renamed BMCE Capital Tunisia (ii) launching new business lines such as BMCE Capital Titrisation and BMCE Capital Solutions, a platform that brings together the middle and back offices (iii) implementing digital initiatives such as introducing a CRM 360° platform, conducting research into big data as well as launching a new institutional website and (iv) enhancing BMCE Capital’s reputation in its markets in Morocco, Tunisia and the WAEMU region.
BMCE CAPITAL MARKETSA highly respectable performance
BMCE Capital’s Trading Floor delivered exceptional results in 2016 due to its successful organisational mo-del and its ability to capitalise on market opportunities in a context in which business activity benefited from the positive impact of lower rates on the fixed income portfolio’s valuation.
BMCE Capital Markets’ Dirham Fixed Income business posted record income which accounted for 51% of overall management income.
One of the main achievements regarding the Dirham Cash business was the completion of a project for automating the extraction of SRBM flows as part of the SRBM settlement system, resulting in real-time gross settlement of payments.
In 2016, the Foreign Exchange desk managed to capi-talise on the market opportunities available in terms of both sales and proprietary trading.
In addition, new functionality was developed for the BMCE FX-Direct platform while trading in two new currency pairs, the Russian Rouble and the Chinese Yuan, was added.Income from the FX Derivatives desk accounted for an estimated 26% of total proprietary trading income.
This desk endeavoured to innovate and develop custo-mised derivative products including a hedging strategy for the energy sector. In addition to these innovations, communication with the sales team was bolstered with the latter being encouraged to focus on products better adapted to customers’ needs by sending market opportunity emails.
The Foreign Currency Denominated Fixed Income desk pursued a strategy aimed at diversifying funding sources by signing deals with new counterparties while strengthening ties with existing domestic and interna-tional banking counterparties.
The Trading Floor’s sales desk continued to focus on boosting sales and bolstered its communications strate-gy for BMCE Capital Markets’ products. The desk also focused its sales efforts on commodities and, more specifically, the energy sector, signing hedge contracts with various counterparties.
The Proprietary Trading and Solutions desk focused on developing new investment strategies for the African continent. Its earnings accounted for 14% of overall in-come with pan-African strategies making a very strong contribution. This Desk was also active in MENA region debt, participating in the region’s most important issues in Saudi Arabia, Qatar and Abu Dhabi.
The Equities and Development desk focused on introducing new systems, enabling traders to anticipate market reactions so as to optimise the various alterna-tive trading strategies and capitalise on the market’s upward trend in 2016.
BMCE BANK IN MOROCCO

PAGE
24/
25
BMCE CAPITAL BOURSEMarket share gains
With market conditions benign, BMCE Capital Bourse’s trading volume rose sharply (+43.5%) to MAD 15.5 billion versus MAD 10.8 billion in 2015. As a result, its market share rose to 15.4% versus 14% the previous year.
Benefiting from a sharp upturn in the market as well as a windfall pay-out resulting from the Casablanca Stock Exchange’s demutualisation, BMCE Capital Bourse registered a sharp increase in profits.
BMCE CAPITAL GESTIONPositive financial results
In 2016, the Asset Management business strengthened its organisational structure, bolstering its corporate governance bodies and implementing cornerstone projects under the aegis of Head Office in Casablanca. Similarly, BMCE Capital Titrisation, a newly created specialised unit, was launched so as to enhance the existing product range.
In addition to these qualitative achievements, the Asset Management business in Morocco and the WAEMU re-gion posted positive financial results, reflecting a strong performance by individual departments.
With assets under management registering 14% growth at the industry level in Morocco, BMCE Capital Gestion saw its assets under management rise by 4% to reach a record high of MAD 55.5 billion. It is now ranked second within the industry with a market share of 15%.
BMCE CAPITAL GESTION PRIVEEProfits up strongly in 2016
BMCE Capital Gestion Privée managed to surpass its full-year forecasts despite tight market conditions, pos-ting operating revenues of more than MAD 48 million, relating exclusively to discretionary management.
In 2016, BMCE Capital Gestion Privée was also strongly involved in a number of cornerstone projects, including launching its institutional website, establishing the ‘BKGP Direct’ platform and mobile application as well as obtaining ISO 9001:2015 certification.
BMCE CAPITAL CONSEILMixed performance
With economic and financial conditions challenging in 2016, BMCE Capital Conseil managed to diversify its revenue sources, winning a number of advisory man-dates in the process.
By introducing a new sales and marketing strategy and a unit dedicated to sales, greater focus was given to merger and acquisition deals.
BMCE CAPITAL TITRESIncrease in assets under custody
With operating conditions seeing a sharp improvement in 2016 compared to the previous year, particularly with SODEP-Marsa Maroc’s successful IPO, the assets under custody of BMCE Capital’s Custody subsidia-ry reached a record high of MAD 214 billion at 31 December 2016, up +9% compared to 31 December 2015.
With market share broadly unchanged at 26%, BMCE Capital Titres’ mutual fund custody business saw its assets under custody trend higher (+10% year-on-year), reaching MAD 99 billion at 31 December 2016.
Institutional assets rose by +5% to MAD 58 billion at 31 December 2016.
BMCE
BANK
OF
AFRICA

Bay of Cadiz, Spain
O U R W O R L D I S C A P I TA L
BMCE BANK IN MOROCCO

PAGE
26/
27
BMCE CAPITAL RESEARCHWorking on behalf of other business lines
BMCE Capital’s Research Department continued to provide the brokerage division with Equity coverage, publishing an extensive range of documents.
The Department’s activities were also focused on wor-king for other entities within BMCE Capital including developing credit research, primarily for BMCE Capital Gestion and BMCE Capital Gestion Privée, as well as continuing to work on a number of deals including those relating to BMCE Bank.
BOA CAPITAL SECURITIESFinancial indicators resilient
In an increasingly competitive market in terms of competitors’ pricing policy as well as a growing number of brokerage firms, BOA Capital Securities put up some hearty resistance, as can be seen in its financial indicators.
Thanks to a strong performance in brokerage and custody, BOA Capital Securities’ revenues rose by 10% to MAD 39.1 million in 2016, despite seeing a contrac-tion in primary market activity, particularly in the fixed income segment.
BOA CAPITAL ASSET MANAGEMENTImproved financial performance
Benefiting from benign operating conditions, operating revenues rose by +52% to MAD 19.2 million in 2016.
BOA CAPITAL CONSEIL Support for sub-Saharan Africa
BOA Capital Advisory refocused its strategy on finan-cing as part of a new strategy consisting of financing SMEs and increasing BOA’s commitments in other WAEMU countries besides Senegal and Ivory Coast.
Against such a backdrop, BMCE Capital Conseil ma-naged to diversify its revenue sources by focusing on IPO mandates as well as financing mandates.
BMCE
BANK
OF
AFRICA

Resources and Means
GROUP HUMAN CAPITALGroup HR assuming greater importance
In 2016, human capital management at Group level was bolstered thanks to an HR seminar that brought together, for the first time, all HR staff working from the Group’s 40 subsidiaries. Workshops were organised dealing with important issues such as (i) the strategic challenges facing the HR function, (ii) HR policies and systems, (iii) HR risk management, (iv) HR information systems and (v) growth drivers for the HR community.
Several were also held for the Group’s entire HR staff ai-med at validating key principles governing HR practice at Group level and formalising HR Group policies in areas such as recruitment, career management, skills develop-ment, staff appraisal and compensation.
A Community Management approach was also adopted aimed at fostering a culture of dialogue within the Group Human Capital community. As part of a process of deve-loping intra-Group HR synergies, one of the highlights of 2016 was the sourcing of some 300 job applications on behalf of Moroccan subsidiaries.
In addition, new opportunities for mobility and career development, both at the parent company and at subsi-diary levels were proposed to employees.
In the same vein, a number of training initiatives were carried out in 2016. In fact, 66% of the Bank’s em-ployees benefited from some form of training, mainly in banking, followed by induction programmes, regulatory training and personal development training.
In addition, nearly 2,000 employees took part in e-lear-ning courses in support of the Group’s global expansion with nearly 5% of the workforce attending English and Spanish courses. Similarly, more than one hundred Corporate Managers and Group Assistant Directors benefited from the M4Banking programmes aimed at fostering participants’ value creation, team motivation and relational skills.
A commitment to healthy employer-employee relations
Improving social benefits and employees’ well-being have become the cornerstone to the Bank’s approach to employee welfare, in perfect harmony with the trade unions. In this respect, a number of agreements have been signed for the benefit of staff, enabling them to be-nefit from preferential terms and conditions. In addition, ongoing improvements were made to healthcare benefits for employees and their offspring after an agreement was signed with Sphera Global Healthcare, a specialist in healthcare marketing, either in person or remotely.
In addition, the BMCE Bank Club has continued to or-ganise a series of cultural and sporting activities for em-ployees’ children such as Swimming School and Music School as well as a morning for handicapped children.
Internal communications embedded in the Group’s corporate culture
In 2016, to foster a sense of belonging, different types of information media, guides and capsules were published in addition to corporate events being organised.
The Bank’s various projects or internal events were the subject of poster campaigns or publishing media such as the Annual Appraisal Campaign, the Multichannel Project and the Sphera Offer.
In addition, the list of events organised in 2016 was extensive which included International Women’s Day, Achoura, a tribute ceremony for retirees, team building sessions, the BMCE EuroServices Seminar and the Cor-porate Banking and Personal & Professional Banking’s sales meeting.
ECONOMIC & CUSTOMER INTELLIGENCEEconomic and sector knowledge provided by the Institute Of Africa
The goals of the Institute of Africa, launched at the start of 2016, are to provide economic and sector analysis about every country in which the Group has operations and help customers identify opportunities on the conti-nent.
Bank Of Africa no has access to a set of deliverables with new investor-oriented models for analysing countries while the output has been enhanced with about twenty deliverables made up of editions of the publication ‘African Trends’ and research focusing on Morocco and Africa, as well as a sector review covering 17 sectors.
At the same time, the Group’s expertise is now reco-gnised externally with a request made by the European Investment Bank to present a report in Abidjan on the banking sector in West and Central Africa. Similarly, Euler Hermès requested a major meeting with the BMCE Bank of Africa Group to present the potential for developing its business in Morocco and Africa.
BMCE BANK IN MOROCCO

PAGE
28/
29
Ongoing customer knowledge and support for the Network
The decision to adopt a Big Data approach, an excellent tool for developing knowledge about customers, was taken so as to be able to offer the customer the right product at the right time and via the right channel.
Regional Knowledge continues to provide support to the sales force, providing analysis for marketing purposes and where to establish points of sale. In 2016, an overall analytical approach was taken to identify growth drivers for each region within Morocco.
In 2016, a strategy was implemented to influence customers across all market segments, the ultimate goal being to win new and retain existing customers. A series of conferences and seminars was held in every region of Morocco to support auto-entrepreneurs as well as encouraging customers living abroad to invest in the country.
In addition, training sessions for small businesses, organised in conjunction with the Young Managers’ Centre and the IFC, have helped raise awareness of best practice in business management.
GROUP COMMUNICATIONSCorporate communications and media relations
As an adjunct to the Royal Visit to China, BMCE Bank of Africa actively took part in the meetings organised by the Moroccan delegation in Beijing, which resulted in strategic partnerships being signed between Moroccan and Chinese private sector operators. In this regard, a dedicated communications campaign was implemented in Morocco and China.
In addition, the Bank invested in renovating the Moroc-can maritime pavilion by setting up a new Moroccan shipping company, Africa Morocco Links (SML), in partnership with Attica, a Greek company, and imple-mented a communications campaign via the most influential domestic and international media.
In addition, a dedicated campaign was conducted at the COP22 in November 2016 via a 360° communications system developed on display panels made from plant-based matter, a dedicated website ‘ourworldiscapital.com’, an educational capsules video and a multimedia campaign.
In 2016, BMCE Bank employed every type of com-munication channel to the full: (I) nearly 500 press releases were issued via more than 80 media types with a noteworthy editorial content, most often dealing with the Group’s operations and expansion in Africa, (ii) 1,530 radio ads were broadcast on 10 national and regional stations and three programs were sponsored – the Africa Journal on Med Radio, Exchange rates on Medi 1 and Al Moukawil on MFM; (Iii) 242 4x3 panels and 108 kakemonos, mainly in Arabic, were produced, 2 wall facades in the centre of Casablanca and 80 dynamic display screens.
In addition, BMCE Bank’s audio-visual coverage was ex-ceptional this year with 169 ads broadcast in French and Arabic on national TV channels 2M, Medi 1 and Al Aoula during the Mawazine festival. Similarly, in cinemas, the ‘New World’ ad was screened in a French 70’’ version in 35 cinemas in Casablanca, Marrakesh, Fez and Tangier.
Sales-based communications and trade marketing
As part of an ongoing process of enhancing and ex-panding the scope of sales-based communications, the communications strategy in 2016 was structured around four operational stages varying according to potential, the issue in question, the goal and the target for the-me-based campaigns, tactical initiatives, network support initiatives and sales-based events.
This approach was underpinned by well-defined major strategic guidelines including rethinking the role of the commercial brand so as to meet business objectives – market/product, building a strong and differentiated communications strategy, adopting a communications plan tailored to the specific needs of each market seg-ment, integrating the different communications channels within an overall approach, bolstering relations-based communications and adopting a strong business com-munications approach.
BMCE
BANK
OF
AFRICA

Digital communications
In 2016, BMCE Bank’s online campaigns, organised around one-off and annual campaigns via online media partnerships, generated more than 8.3 million clicks and more than 729 million impressions – the number of times that a page with an ad is loaded. BMCE Bank registered a high click rate of 1.1%, highlighting the excellent overall performance of the one-off and annual campaigns.
In 2016, the Bank’s flagship campaigns targeted the Personal Banking market segment (the Joker campaign received 604,000 clicks and more than 49.2 million impressions), the Moroccans living abroad segment (Agence Directe was popular with more than 48.2 million impressions and 182,412 clicks) and the Young Professionals segment (the Young Professionals cam-paign attracted more than 61.9 million impressions and 693,215 clicks).
Three separate social networking communities are proac-tively managed: (i) the general BMCE Bank community with 590,133 fans, (ii) the ‘jesuisjeune.ma’ Moroccan youth community with 97,554 fans and (iii) the ‘AE Award’ community of African entrepreneurs.
Direct channels
With 1,824,419 visits in total in 2016, www.bmcebank.ma is experiencing an ongoing increase in traffic, which rose by +21.69% compared to the previous year.
Similarly, the www.jesuisjeune.ma website achieved a total of 535,091 visits, up 110% compared to 2015. This steep rise was due, in particular, to the ‘Young Professio-nals’ online campaign which began in October 2016.
The most recent addition to BMCE Bank’s portfolio, Agence Directe is becoming increasingly on the net. It has had 100,578 visits to date, mainly from France and Belgium.
As far direct communications were concerned, use of mailing as a distribution channel is constantly on the rise. In addition to the regulatory mailings contributing to this rise in 2016, sales-based mails such as Joker and Fatourati also had an impact.
CONVERGENCE ITStrong emphasis on Group-wide aspect
In terms of Group Convergence, the Bank continues to help subsidiaries develop their Information Systems. Overseas, worked continued on BMCE EuroServices and LCB Bank’s information systems.
As part of the strategic development of its IT activities, the Bank finished building and commissioning its new data centre at the Bouskoura site. This data centre was designed in accordance with best practice, the aim being to obtain ‘Tier III+’ certification based on Uptime Insti-tute’s classification.
DEVELOPING OPERATIONAL PROCESSES AND MEANSBolstering performance steering processes
In 2016, the main focus was on bolstering performance steering processes, introducing new digitalised customer pathways, integrating and developing new types of digital contact – Agence Directe – and distance selling, enhan-cing the functionality provided by the Bank’s remote channels, developing operational processes at branch le-vel and implementing a new quality assurance approach within the Remote Customer Relationship Management function.
Similarly, in 2016, an action plan was introduced for IS and organisational projects for Personal & Professional Banking, assistance provided and feedback and Network-based malfunctions processed and branch openings monitored.
BMCE BANK IN MOROCCO

PAGE
30/
31
PROJECT BRANCHSuccessfully implemented
This program consists of updating branch-based appli-cations to provide a real-time overview of front-to-back office operations.
One of the flagship innovations that has resulted from implementing the first batch – centralising balances, processing values and managing counter transactions – consisted in setting up the workflow for managing overruns and introducing a replacement process for managers should they be absent.
2016 also saw the ongoing development and enhan-cement of cash management products such as Cash Pool, BMCE Scan Valeurs, Ramassage de Fonds, Direct Report and Direct Valeurs.
CUSTOMER RELATIONS CENTREContributing to sales
The Remote Customer Relationship Management func-tion registered a sharp rise in call traffic, split between permanent and one-off campaigns. In addition, as part of Group synergies, the CRC carried out outbound call campaigns on behalf of BMCE EuroServices, RMA and Salafin relating to customer satisfaction, unit-linked auto insurance finance and on-demand loan renewals.
In addition, 2016 also saw the launch of Agence Di-recte, the showcase for the Multi-channel programme with has three major goals: (i) winning market share in Migrant Banking, (ii) increasing the penetration rate of Migrant Banking customers and (iii) tele-sales.
Since it was launched in 2016, Agence Directe’s show-case site has had just short of 66,000 online visitors, enabling the Bank to build a database of more than 1,000 prospective Moroccan customers living abroad, some of whom have since become BMCE Bank clients.
In addition, implementation of a new quality assurance approach within the Remote Customer Relationship Management function with a new governance approach and segregation of duties, has resulted in better fol-low-up and a significant improvement in service quality. The audit carried out at the end of 2016 by the firm Bureau Veritas Certification resulted in renewal of certi-fication in 2017 of service commitments for the remote customer relationship business with zero deviation with a customer satisfaction rate of 81% vs. 75% in 2015.
FOREIGN TRADE BUSINESS OVERHAULEDPosition bolstered
To bolster its position in the foreign trade segment, the Bank conducted a strategic review of its foreign trade operations – organisation, processes, information sys-tems etc. The aim was to improve service quality, risk management and productivity.
The purpose of this redesign project was to have a comprehensive, reliable and effective platform that meets international standards for processing BMCE Bank Of Africa’s international trade transactions.
The first steps were taken to implement a strategic project aimed at redesigning foreign trade information systems. The ‘Import title domiciliation management’ and ‘Import documentary credit’ modules were imple-mented across the entire Network.
BMCE
BANK
OF
AFRICA

Specialised Financial Subsidiaries
Okavango River, BotswanaO U R W O R L D I S C A P I TA L
BMCE BANK IN MOROCCO

PAGE
32/
33
MAGHREBAIL
In 2016, Maghrebail’s parent net income increased significantly (+35.3%) to MAD 87.1 million, driven primarily by a steep increase in net revenue which rose by 145% to MAD 388.8 million.
After factoring in MAD 169.5 million of provisions for non-performing loans and MAD 26.1 million of write-backs, the net cost of risk stood at MAD 143.4 million at 31 December 2016. One of the highlights of 2015 had been a net write-back of MAD 17.5 million. The loan-loss provision ration stood at 90.3% at 31 December 2016 versus 89.4% the previous year.
Thanks to its industry experience acquired over more than 40 years, its membership of BMCE Bank Group enabling it to reduce its funding costs and market its products, the improvements made in risk analysis and recovery and its diversified its income sources, Maghrebail’s net outstandings rose by +7.6% to MAD 10.9 billion in 2016. As a result, the leasing company’s market share rose to 25.2% to become the second-ran-ked company within the industry.
In a highly competitive market, new production rose by +6% year-on-year to MAD 3.4 billion in 2016.
SALAFIN
Salafin registered +2.4% year-on-year growth in net loan outstandings to MAD 2.4 billion at 31 December 2016, driven primarily by a +6.3% increase in loan outstandings.
In 2016, Salafin’s parent net income rose by 10.6% to MAD 138.5 million, resulting in an ROE of as high as 21.6%. This was achieved against a backdrop of positive net banking income growth, contained general operating expenses and an -11.7% year-on-year fall in the cost of risk.
In terms of its financial results, Salafin saw its net banking income grow by 4.7% to MAD 371 million. Growth was driven by an 11.7% increase in net interest income from its lending business and a 6.3% rise in fee income.
General operating expenses rose by +2.6% year-on-year to MAD 106.4 million in 2016. The cost-to-inco-me ratio improved by 60 basis points to 28.7% at 31 December 2016 with operating expenses remaining well contained.
Gross operating income increased by +6% year-on-year to MAD 269 million in 2016.
Preventive risk management and more effective recove-ry initiatives resulted in an improvement in the quality of the customer portfolio. As a result, provisions fell by as much as -11.7% to MAD 46.7 million in 2016 versus MAD 52.9 million in 2015.
MAROC FACTORING
Working closely with BMCE Bank, its parent company, Maroc Factoring adopted a new governance system that not only meets Bank Al-Maghrib’s regulatory requirements but is entirely consistent with the Group’s governance standards.
After embarking on a process overhauling its business model in 2016 aimed at optimising its regulatory capital needs while highlighting the expertise it has acquired in factoring, Maroc Factoring’s net income declined by a modest 2% to MAD 15.1 million in 2016 with net banking income down -12%.
The decline in net banking income was largely due to concerns over improving risk control. In addition, its impact was offset by developing existing contracts and sales and marketing.
The cost-to-income ratio declined from 47.4% at 31 December 2016 versus 40.6% at 31 December 2015 due to the -12% fall in net banking income together with a +2% rise in general operating expenses.
RM EXPERTS
RM Experts continued to implement its portfolio diversification strategy, supported by good command of debt recovery processes, a strong performance in debt recovery and well-developed information systems, ena-bling information to be processed rapidly and accura-tely and ensuring that both the Group’s and customers’ needs were met.
Thanks to a combination of amicable debt recovery processes and enforced debt recovery procedures, RM Experts has acquired a reputation as a leading company in the area of debt recovery.
At 31 December 2016, recovery of capital totalled MAD 406 million with write-backs up 17% year-on-year to MAD 295 million.
In addition, RM Experts provided a boost to sales by launching a communications campaign and bolstering efforts at marketing to prospective customers. This resulted in a number of collaborative agreements being signed with new customers.
RM Experts posted parent net income of MAD 6.3 million in 2016 against a backdrop of rising non-performing loans within the Moroccan banking industry.
BMCE
BANK
OF
AFRICA

African Activities
BMCE BANK IN AFRICA
Serengeti, Tanzania O U R W O R L D I S C A P I TA L

PAGE
34/
35
AFRICAN OPERATIONS
Operations in 20 countriesCoverage of 4 economic regions within the African continentNearly 550 branches in sub-Saharan AfricaNearly 3.5 million bank accounts
BANK OF AFRICA GROUP PROFILE
The history of BANK OF AFRICA Group dates back to 1982 when the original BANK OF AFRICA was establi-shed in Mali as an almost entirely private entity. Almost 35 years later, BOA Group is one of the largest pan-Afri-can groups with operations in 18 countries, 17 of which are in Africa. Since 2010, BANK OF AFRICA Group has been majority owned by BMCE BANK, Morocco’s third largest bank. BMCE Bank provides BOA Group with powerful strategic and operational support.
FMO8.94
PROPARCO3.73% BIO
2.03%
BMCE BANK OF AFRICA
72.85%
OTHERSHAREHOLDERS
12.45%
BANK OF AFRICA SHAREHOLDINGAT 31 DECEMBER 2016
BOA GROUP’S CONSOLIDATED FIGURES IN 2016
2015 2016 2015 2016 2015 2016 2015 2016 2015 20162015 2016
NET BANKING INCOME
GROSS OPERA-TING INCOME
NET INCOME ATTRI-BUTABLE TO SHAREHOLDERS OF THE PARENT COMPANY
TOTAL ASSETS DEPOSITSLOANS
+7% +6.7% +20% +8.5% +9% +7%
440
469185.2
197.6
56.2
67.47.2
7.8
4.6
5
3.5
3.8
IN M
ILLI
ON
EU
R
IN M
ILLI
ON
EU
R
IN M
ILLI
ON
EU
R
IN B
ILLI
ON
EU
R
IN B
ILLI
ON
EU
R
IN B
ILLI
ON
EU
R
BMCE
BANK
OF
AFRICA

2nd pan-African group in terms of geographical coverage
BMCE BANK IN AFRICA
Djibouti
Kenya
Tanzania
Uganda
BurundiRwanda
Niger
DR Congo
Senegal
Côte d'Ivoire
Mali Ghana
BurkinaFaso
Benin
Ethiopia
Togo
Madagascar
MoroccoTunisia
BOA-FRANCE2010Number of branches: 3
BOA-BENIN 1989Number of branches: 48
BMCE BANK SA MOROCCO 1959Number of branches: 723
TUNISIA 2006BMCE Capital Tunisie
BOA-MER ROUGE2010Number of branches: 8
BANQUE DE CREDIT DE BUJUMBURA 2008 Number of branches: 21
East Africa West Africa
Central Africa North Africa
Southern Africa
BOA-TANZANIA 2010Number of branches: 27
BOA-KENYA 2004 Number of branches: 43
BOA-RWANDA 2015 Number of branches: 12
BOA-ETHIOPIA2014 Representative office
BOA-MADA-GASCAR 1999 Number of branches: 90
BOA-UGANDA 2006 Number of branches: 35
LCB 2009 Number of branches: 20
BOA-DRC 2010 Number of branches: 11
BOA-SENEGAL 2001 Number of branches: 42
BOA-TOGO 2013 Number of branches: 10
BOA-NIGER 1994 Number of branches: 28
BDM SA MALI 1983 Number of branches: 54
BOA-MALI 1983 Number of branches: 60
BOA-GHANA2011Number of branches: 26
BOA-CÔTE D’IVOIRE 1996 Number of branches: 33
BOA-BURKINA FASO 1987 Number of branches: 50

PAGE
36/
37
Robust growth despite a somewhat challenging environment
In 2016, BOA Group’s economic and political environ-ment was marked by a liquidity and banking sector crisis in Kenya, an economic crisis in Nigeria and its impact on neighbouring countries, new regulations in Madagascar and their impact on foreign exchange revenues as well as presidential elections in Uganda, Niger, Benin, Djibouti and Ghana.
Against such a backdrop, BOA Group registered a positive commercial and financial performance in 2016. In commercial terms, BOA Group bolstered its core business, adding 453,822 new accounts to take the total number of accounts to 3.1 million. It continued to attract savings (deposits +10%) to finance various African economies (loans +8%), while continuing to expand its branch network (45 branch openings, taking the total number of branches to 540).
As far as BOA Group’s financial performance was concerned, aggregate net banking income rose by 6.6% to EUR 469 million in 2016 versus EUR 440 million in 2015. The aggregate cost-to-income ratio was broadly unchanged at 61.4% in 2016 versus 61.7% the previous year. Despite BHB booking an exceptional provision, the overall cost of risk ratio was unchanged at 1.7% at 31 December 2016. Aggregate net income grew by 18.5% year-on-year to EUR 113.3 million versus EUR 95.6 million the previous year.
Dune in the Namib DesertO U R W O R L D I S C A P I TA L
BMCE
BANK
OF
AFRICA

West Africa
BMCE BANK IN AFRICA
Sunrise over the Okavango Delta, Botswana
O U R W O R L D I S C A P I TA L

PAGE
38/
39
WAEMU region overview
Established in 1994, the West African Economic and Mo-netary Union is a sub-regional international organisation with its headquarters in Ouagadougou (Burkina Faso), bringing together 8 countries in West Africa – Benin, Burkina Faso, Côte d’Ivoire, Guinea Bissau, Mali, Niger, Senegal and Togo.
WAEMU aims to promote economic integration between its member states by means of an open and competi-tive market, adoption of a common standardised legal framework and integration of domestic economies, the goal being to transform the Union into a single market that is attractive to investors.
BOA has operations in 7 countries within the WAEMU region as well as in Ghana, which is not a WAEMU member.
West Africa, economic growth remains firm inthe WAEMU region
Despite a challenging environment in security and health terms, economic activity in the WAEMU region main-tained its upward trend, registering growth of 6.3% in 2016. This was due to increased activity in the trade and services sector, good agricultural and industrial producti-vity and a buoyant construction and public works sector, particularly in Senegal and Côte d’Ivoire.
Real GDP is forecast to grow by 6.5% in 2017, primarily due to rising infrastructure investment and increased economic diversification.
Benin
Togo
Niger
Mali
Burkina Faso
GhanaCôte d’Ivoire
Senegal
BMCE
BANK
OF
AFRICA

BMCE BANK IN AFRICA
Banque de L’Habitat du Benin
Established in 2004 as part of a public sector initiative, Banque de l’Habitat du Bénin subsequently became a private sector insti-tution. Banque de l’Habitat du Bénin was established to enable Beninese to acquire housing through long-term loans at attrac-tive interest rates. The Bank lends directly to retail customers as well as to real estate developers. SHAREHOLDING AT 31 DECEMBER 2016
31.07% BANK OF AFRICA-BENIN
58.36% BOA WEST AFRICA 10.57% OTHER SHAREHOLDERS
Total assets € 34.7 millionCustomer deposits € 30.1 millionCustomer loans € 26.7 million1 Euro = 655.957 F CFA
KEY FIGURES 2016

PAGE
40/
41
Danakil Desert, Ethiopia O U R W O R L D I S C A P I TA L
BMCE
BANK
OF
AFRICA

STRONG COMMERCIAL activity despite a challenging economic environ-ment
BANK OF AFRICA-BENIN’s total assets grew by 10% to EUR 1,422 million at 31 December 2016. Customer deposits increased by 4% from EUR 788 million in 2015 to EUR 821.69 million in 2016. Sight deposits accounted for 42% of total customer deposits, broadly unchanged on the previous year.
The Bank remained the top-ranking institution within the country’s banking industry with a market share of 25%. Customer loans registered growth of 28% over the period to EUR 510.20 million.
RESILIENT FINANCIAL performance
In 2016, net banking income rose by 0.4% to EUR 59.97 million. This weak growth rate was due to a base effect with 2015 earnings being boosted by a EUR 3.9 million capital gain on the disposal of securities held by the Bank in a number of Group subsidiaries.
As a result, the cost-to-income ratio went up to 52.4% at 31 December 2016 versus 48.8% the previous year.
Net income rose by 28.8% year-on-year to EUR 24.60 million while the Return on Equity was 24%.
2016 HIGHLIGHTS
n Crédit-bail and MTN Mobile Money launched
n A satellite branch opened at Abomey-Calavi Univer-sity (UAC), 20 km north of Cotonou
n Customer deposits surpassed the EUR 760 million mark while net income reached almost EUR 20 million
BOA-BENIN
BOA-BENIN – STOCK MARKET DATA (FCFA)
2014 2015 2016 AAGR*Closing price at 31/12 82 005 130 000 167 995 43.1%Annual performance 36.3% 58.5% 29.2%Earnings per share 11 854 11 854 16 023 16.3%Book value per share 60 458 64 014 71 916 9.1%Market capitalisation at 31/12 (billions) 82.6 130.9 169.2 43.1%
Dividend per share 7 716 8 100 9 614 11.6%Dividend yield (%) 9.41% 6.23% 5.72% -22.0%Price Earnings Ratio 6.9x 11.0x 10.5xPrice to Book Ratio 1.4x 2.0x 2.3x(*) Average Annual Growth Rate1 Euro = 655.957 FCFA
Total assets € 1 422 million Customer loans € 510 million Customer deposits € 822 million Net banking income € 60 million Net income € 24.6 million Employees 583Branch network 481 Euro = 655.957 F CFA
KEY FIGURES 2016
SHAREHOLDING AT 31 DECEMBER 2016
39.47% BOA WEST AFRICA
14.43% BOA GROUP S.A.2.63% OTHER SHAREHOLDERS
43.47% PRIVATE SHAREHOLDERS
BMCE BANK IN AFRICA

PAGE
42/
43
STRONG COMMERCIAL Performance
In 2016, Bank of Africa-Burkina Faso registered a positive growth in its main business indicators, illustrated by a 9.8% increase in customer deposits to EUR 656 million. Loan growth was also strong at +6.6%, reaching EUR 567.75 million.
Similarly, total assets rose by 8.7% to EUR 1,088.68 million. In addition to this significant increase, the Bank’s capital base also improved with shareholders’ equity growing by 9.8%.
CONVINCING results
Net banking income rose by 7.6% to EUR 51.35 million, primarily driven by net interest income (66%), fee and miscellaneous income (31%) and income from invest-ments in subsidiaries (3%).
Operating expenses grew by 15.3% year-on-year due to improvements made to the Bank’s security system as well as pay rises. In addition, as a result of positive growth in the Bank’s main P&L indicators together with the tax optimisation effect on income from available-for-sale securities, net income rose by 3.5% year-on-year to EUR 19 million.
2016 HIGHLIGHTS
n Three branches opened in Houndé, Orodara and Trame d’accueil
n Threshold of 300,000 accounts breached
n New products launched including « Prêt Ma Moto », Moneygram’s money transfer service and Airtel Money’s mobile money transfer service
BOA-BURKINA FASO - STOCK MARKET DATA (FCFA)
2014 2015 2016 AAGR*Closing price at 31/12 90 000 120 000 139 500 24.5%Annual performance 11.1% 33.3% 16.3% Earnings per share 9 526 10 935 11 312 9.0%Book value per share 40 116 45 025 49 453 11.0%Market capitalisation at 31/12 (billions) 99.0 132.0 153.5 24.5%
Dividend per share 5 845 6 692 7 920 16.4%Dividend yield (%) 6.49% 5.58% 5.68% -6.5%Price Earnings Ratio 9.4x 11.0x 12.3x Price to Book Ratio 2.2x 2.7x 2.8x (*) Average Annual Growth Rate1 Euro = 655.957 FCFA
Total assets € 1 088 million Customer loans € 567.75 million Customer deposits € 656 million Net banking income € 51.35 million Net income € 18.97 million Employees 428Branch network 50 1 Euro = 655.957 F CFA
KEY FIGURES 2016
SHAREHOLDING AT 31 DECEMBER 2016
BOA-BURKINA FASO
24.30% OTHER PRIVATE SHAREHOLDERS
10.24% LASSINE DIAWARA
BOA WEST AFRICA 56.47%
8.98%UNION DES ASSURANCES DE
BURKINA VIE
BMCE
BANK
OF
AFRICA

ONGOING PROGRESS on the commercial front
In 2016, BOA-Côte d’Ivoire opened 5 new branches, taking the total number of branches to 33 and 358 employees. Deposits rose by 13.5% to EUR 514 million. Deposit growth was outpaced by loan growth, with the latter rising by 13.6% to EUR 448.7 million despite the highly competitive operating environment. Total assets rose by 2.6% to EUR 950 million, surpassing the symbolic FCFA 600 billion mark. With EUR 38 million of regulatory capital, BOA-Côte d’Ivoire capital adequacy ratio stood at 8.8% versus the minimum 8% regulatory requirement.
SATISFYING results
In 2016, net banking income rose by 14.8% to EUR 44 million versus EUR 38 million in 2015. General operating expenses increased by 5.9% with five new branched opened in 2016. As a result, the cost-to-in-come ratio improved by 4.2 basis points to reach 49.1% versus 53.3% in 2015.
Net income stood at EUR 15.5 million, an increase of 23.2% on the previous year.Return on Assets and Return on Equity were 1.7% and 28.7% respectively, an improvement on 2015.
BOA-CÔTE D’IVOIRE
BOA-CÔTE D’IVOIRE - STOCK MARKET DATA (FCFA)
2014 2015 2016 AAGR*Closing price at 31/12 90 000 125 000 139 000 24.3%Annual performance 39.5% 38.9% 11.2% Earnings per share 9 850 9 850 10 149 1.5%Book value per share 38 429 41 576 39 013 0.8%Market capitalisation at 31/12 (billions) 73.8 102.5 139.0 37.2%
Dividend per share 6 200 6 200 6 089 -0.9%Dividend yield (%) 6.89% 4.96% 4.38% -20.3%Price Earnings Ratio 9.1x 12.7x 13.7x Price to Book Ratio 2.3x 3.0x 3.6x (*) Average Annual Growth Rate1 Euro = 655.957 FCFA
Total assets € 950 million Customer loans € 448.7 million Customer deposits € 522 million Net banking income € 44 million Net income € 15.5 million Employees 358Branch network 331 Euro = 655.957 F CFA
KEY FIGURES 2016
SHAREHOLDING AT 31 DECEMBER 2016
27.48% OTHER SHAREHOLDERS
3.34 % ATTICA S.A.
69.18% BOA WEST AFRICA
BMCE BANK IN AFRICA

PAGE
44/
45
BOA-MALI
SOLID fundamentals
Total assets stood at EUR 783.59 million at 31 De-cember 2016 while shareholders’ equity before appro-priation rose by 8.6% to EUR 62.91 million.
Customer deposits declined by a modest 2.0% to EUR 478.60 million in 2016 versus EUR 488.36 million in 2015.
Customer loans totalled EUR 392.85 million in 2016 versus EUR 394.24 million in 2015.
NET INCOME sharply higher
Net banking income stood at EUR 45.35 million in 2016. Net income rose by as much as 32.0%, however, from EUR 10.86 million in 2015 to EUR 14.33 million in 2016, breaching the FCFA 9 billion mark for the first time.
2016 HIGHLIGHTS
n BANK OF AFRICA-MALI was the largest stock by market capitalisation on Abidjan’s Regional Securities Exchange (BRVM)
n Participated in the 27th Africa-France summit, orga-nised by African and French employers federations, as sponsor of its Economic Forum
n 6 new branches opened in Bamako, Baguinéda and Ouelessebougou
BOA-MALI – STOCK MARKET DATA (FCFA)
2016Closing price at 31/12 40 000Annual performance NSEarnings per share 4 565Book value per share 20 033Market capitalisation at 31/12 (billions) 82.4Dividend per share 3 000Dividend yield (%) 7.50%Price Earnings Ratio 8.8xPrice to Book Ratio 2.0x(*) Average Annual Growth Rate1 Euro = 655.957 FCFA
Total assets € 783.59 million Customer loans € 392.85 million Customer deposits € 478.60 million Net banking income € 45.35 million Net income € 14.33 million Employees 366Branch network 601 Euro = 655.957 F CFA
KEY FIGURES 2016
SHAREHOLDING AT 31 DECEMBER 2016
31.07 RETAIL INVESTORS
61.39%BOA WEST AFRICA
5.47% OTHER LEGAL ENTITIES
2.07% ATTICA S.A.
BMCE
BANK
OF
AFRICA

BOA-NIGER
BUOYANT COMMERCIAL activity
BANK OF AFRICA-NIGER, which is the largest Nigerien company listed on the Regional Securities Exchange (BRVM), is a major player in the country’s banking industry. In 2016, the domestic operating en-vironment was benign although economic growth was slower than in the previous year.
In 2016, BOA-NIGER’s commercial activity was buoyant with total assets registering 9% growth to EUR 437 million versus EUR 401 million in 2015.
Customer deposits and customer loans grew by 1.2% and 7.2% respectively to EUR 222 million and EUR 250 million versus EUR 219 million and EUR 234 million the previous year.
SATISFYING financial results
Net banking income rose by 5.7% to EUR 29 million in 2016 versus EUR 27.5 million in 2015. Gross operating income was broadly unchanged at EUR 15.02 million. General operating expenses including amortisation rose by 13.1% to EUR 14 million in 2016 versus EUR 12.5 million the previous year.
Net income grew by 13.9% year-on-year to EUR 10.1 million in 2016 versus EUR 8.8 million in 2015, resulting in a Return on Equity of 24.7%, despite a 7.3% increase in shareholders’ equity.
2016 HIGHLIGHTS
n Agreement signed with the French Development Agency (AFD) for an insurance guarantee for interven-tion zone investment risk (ARIZ)
n New Chief Executive Officer appointed
n Increase in share capital from FCFA 9.5 billion to FCFA 10 billion (EUR 15 million) by incorporating share premium
n Two branches opened in Niamey
BOA-NIGER - STOCK MARKET DATA (FCFA)
Total assets € 437 million Customer loans € 250 million Customer deposits € 222 million Net banking income € 29 million Net income € 10 million Employees 245Branch network 281 Euro = 655.957 F CFA
KEY FIGURES 2016
SHAREHOLDING AT 31 DECEMBER 2016
28.25% OTHER SHAREHOLDERS
5.24% NIGERIENSHAREHOLDERS
0.15% BOA-NIGER EMPLOYEES6.88% WEST AFRICA
DEVELOPMENT BANK (WADB) 59.06% BOA WEST
AFRICA0.42%
ATTICA S.A
2014 2015 2016 AAGR*Closing price at 31/12 87 000 85 000 89 995 1.7%Annual performance 101.4% -2.3% 5.9% Earnings per share 5 364 6 100 6 600 10.9%Book value per share 26 499 28 844 29 411 5.4%Market capitalisation at 31/12 (billions) 82.7 80.8 90.0 4.3%Dividend per share 3 492 4 817 5 600 26.6%Dividend yield (%) 4.01% 5.67% 6.22% 24.5%Price Earnings Ratio 16,2x 13.9x 13.6x Price to Book Ratio 3.3x 2.9x 3.1x (*) Average Annual Growth Rate1 Euro = 655.957 FCFA
BMCE BANK IN AFRICA

PAGE
46/
47
DOUBLE-DIGIT GROWTH in commercial activity
In what was a fiercely competitive operating environment and despite having to clean up the customer loan port-folio, Bank Of Africa-Senegal registered deposit growth of 54.7% and loan growth of 21.9% to EUR 486 million and EUR 358.85 million respectively in 2016. As a result, total assets rose by 44.2% to EUR 795.37 million.
In terms of profitability, the Bank’s Return on Assets was 0.9%, up 30 points on the previous year.
EARNINGS up by a substantial 95%
As far as the key profit indicators were concerned, net banking income rose by 29.5% to EUR 33.52 million in 2016. After factoring in overheads, gross operating income increased by 74.2% year-on-year to EUR 16.37 million in 2016. The cost-to-income ratio was 51.2% at 31 December 2015 versus 63.7% at 31 December 2016, a 12.5 points improvement on the previous year.
Due to a combination of significantly higher net banking income and lower expenses, net banking income rose by 94.9% year-on-year to EUR 6.18 million.
2016 HIGHLIGHTS
n LIBCARD, a prepaid Visa card launched as well as a new version of Pack Mon Business
n Participated in the African Business Connect initiative, resulting from a partnership between Bank Of Africa and Maroc Export, aimed at bringing together Moroccan and sub-Saharan African companies
n Partnership agreement signed with the Priority Investment Guarantee Fund (FONGIP) to provide a loan guarantee for Pack Mon Business
BOA-SENEGAL – STOCK MARKET DATA (FCFA)
Total assets € 795.37 million Customer loans € 358.85 million Customer deposits € 486.00 million Net banking income € 33.52 million Net income € 6.18 million Employees 346Branch network 421 Euro= 655.957 F CFA
KEY FIGURES 2016
SHAREHOLDING AT 31 DECEMBER 2016
BOA-SENEGAL
2014 2015 2016 AAGR*Closing price at 31/12 64 500 79 000 47 000 -14.6%Annual performance NS 22.5% -40.5% Earnings per share 2 813 1 732 3 376 9.5%Book value per share 22 134 21 899 24 442 5.1%Market capitalisation at 31/12 (billions) 77,4 94.8 56.4 -14.6%Dividend per share 1 770 750 1 000 -24.8%Dividend yield (%) 2.74% 0.95% 2.13% -11.9%Price Earnings Ratio 22.9x 45.6x 13.9x Price to Book Ratio 2.9x 3.6x 1.9x (*) Average Annual Growth Rate1 Euro = 655.957 FCFA
38.17% PRIVATE SHAREHOLDERS
0.10% OTHER SHAREHOLDERS
61,74% BOA WEST AFRICA
BMCE
BANK
OF
AFRICA

GROWTH in commercial activity*
Customer deposits and customer loans rose by 8.7% and 15.4% to EUR 153.26 million and EUR 100.77 million respectively.
Total assets declined by a modest 0.2% year-on-year from EUR 258.52 million to EUR 257.96 million.
A RELATIVELY poor set of results
In 2016, BANK OF AFRICA-GHANA registered net income of EUR 5.45 million while gross operating income declined by 48% year-on-year to EUR 8.17 million.
Net banking income stood at EUR 25.33 million in 2016 versus EUR 29.59 million in 2015.
Operating expenses rose by 22% from EUR 14.01 million in 2015 to EUR 17.15 million in 2016, resulting in a cost-to-income ratio of 67.7% in 2016 versus 47.4% in 2015.
2016 HIGHLIGHTS
n 3 branches opened in Accra and 2 others in towns located to the north of the capital
n Ranked as the ‘Best Bank’ in the Customer Advisory Services category at the 15th Ghana Banking Awards
n Bank-insurance products - Family Care Assurance and Assured Child Education - launched
*At constant exchange rates
BOA-GHANA
Total assets € 257.96 million Customer loans € 100.77 million Customer deposits € 153.26 million Net banking income € 25.33 million Net income € 5.45 million Employees 398Branch network 261EURO= 4,4367 Cédis Ghanéens
KEY FIGURES 2016
SHAREHOLDING AT 31 DECEMBER 2016
6.50% OTHER SHAREHOLDERS
93.50%BOA WEST
AFRICA
BMCE BANK IN AFRICA

PAGE
48/
49
COMMERCIAL DEVELOPMENT gaining momentum
2016 proved to be another positive year in the Group’s ongoing development. Despite the challenging operating conditions and increasingly tough competition, BOA-To-go continued to deliver positive growth and gain market share. Its earnings, which were in line with estimates, were encouraging overall.
Customer deposits rose by 15.4% to EUR 49.58 million while customer loans increased by 33.4% to EUR 84.40 million. The branch network now comprises 10 branches.
Total assets stood at EUR 178.39 million. As a result, BOA-Togo was ranked 8th out of 13 banks by assets.
Net banking income rose up 31.9% to EUR 5.43 million, enabling the Bank to cover almost its entire overheads which totalled EUR 5.83 million.
The cost-to-income ratio also improved to 107.3% versus 134.5% the previous year. Risk-weighted assets totalled EUR 62.91 million, resulting in a capital to risk-weighted assets ratio of 12.3% versus the minimum regulatory requirement of 8%. 2016 HIGHLIGHTS
n New Chief Executive Officer appointed
n Baguida branch opened on the outskirts of Lomé
n ‘Everyone to School’, ‘Savings’ and ‘Fonxionaria’ campaigns launched
Total assets € 178.39 million Customer loans € 84.40 million Customer deposits € 49.58 million Net banking income € 5.43 million Net income € -1.6 million Employees 104 Branch network 101EURO= 655.957 F CFA
KEY FIGURES 2016
BOA-TOGO
SHAREHOLDING AT 31 DECEMBER 2016
0.56% PRIVATE SHAREHOLDERS
5% LASSINÉ DIAWARA
94,44% BOA WEST AFRICA
BMCE
BANK
OF
AFRICA

Tsingy De Bemaraha, Moronda-va region, Madagascar
O U R W O R L D I S C A P I TA L
Central Africa
BMCE BANK IN AFRICA
O U R W O R L D I S C A P I TA L
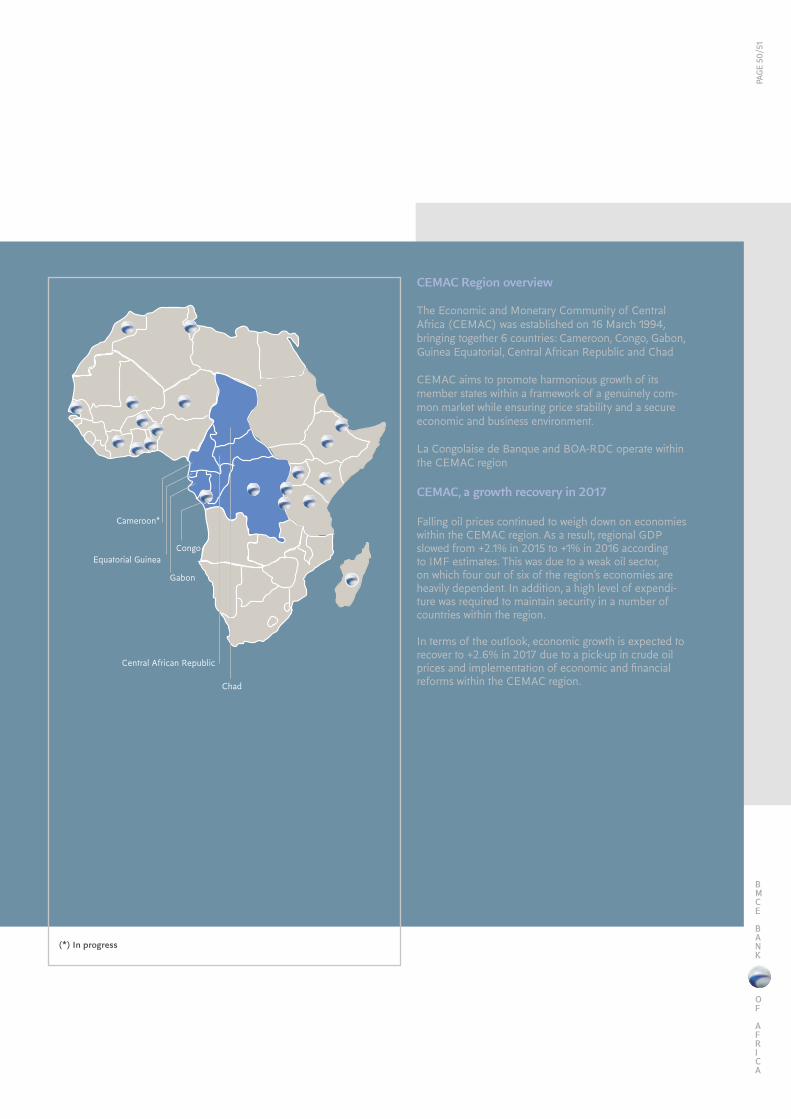
PAGE
50/
51
CEMAC Region overview
The Economic and Monetary Community of Central Africa (CEMAC) was established on 16 March 1994, bringing together 6 countries: Cameroon, Congo, Gabon, Guinea Equatorial, Central African Republic and Chad
CEMAC aims to promote harmonious growth of its member states within a framework of a genuinely com-mon market while ensuring price stability and a secure economic and business environment.
La Congolaise de Banque and BOA-RDC operate within the CEMAC region
CEMAC, a growth recovery in 2017
Falling oil prices continued to weigh down on economies within the CEMAC region. As a result, regional GDP slowed from +2.1% in 2015 to +1% in 2016 according to IMF estimates. This was due to a weak oil sector, on which four out of six of the region’s economies are heavily dependent. In addition, a high level of expendi-ture was required to maintain security in a number of countries within the region.
In terms of the outlook, economic growth is expected to recover to +2.6% in 2017 due to a pick-up in crude oil prices and implementation of economic and financial reforms within the CEMAC region.
Cameroon*
Equatorial Guinea
Central African Republic
Chad
Gabon
Congo
(*) In progress
BMCE
BANK
OF
AFRICA

O U R W O R L D I S C A P I TA L
Aerial view over Logipi Lake, Kenya
BMCE BANK IN AFRICA

PAGE
52/
53
ONGOING IMPROVEMENT in commercial activity
In 2016, BANK OF AFRICA-DRC registered strong growth in customer deposits and loans to large enter-prises and SMEs. Customer deposits rose by 15.3% while customer loans increased by 46%, giving the Bank a 5.9% share of the loan market versus 4.9% in 2015. As a result, net interest income rose by as much as 44%.
SUBSTANTIAL rise in earnings
In 2016, net banking income rose by 39% to EUR 17.6 million. The cost-to-income ratio declined significantly from 76.3% in 2016 to 75.8% in 2015.
In 2016, net income reached EUR 1.4 million versus EUR 1.8 million the previous year, a decline of 24%.
Return on Equity was 10.8% in 2016.
The Bank’s capital to risk-weighted assets ratio was comfortable at 11.6% despite strong growth in the Bank’s business activity.
All these initiatives will continue in 2017 while the network will see further expansion with 8 branch openings scheduled.
2016 HIGHLIGHTS
n New Chief Executive Officer appointed
n Sponsored the DRC national rugby team, champions of the African Nations Cup D2 South Zone and the 4th Cycling Tour of Democratic Republic of Congo
SHAREHOLDING AT 31 DECEMBER 2016
BOA-DRC
19.98% BIO S.A.
0.02% PRIVATE SHAREHOLDERS
14.98% PROPARCO S.A.
65.02% BOA GROUP S.A.
Total assets € 175 million Customer loans € 131 million Customer deposits € 94 million Net banking income € 17.6 million Net income € -1.4 million Employees 198Branch network 111EURO= 1255.008 CDF
KEY FIGURES 2016
BMCE
BANK
OF
AFRICA

East Africa
Lake Natron, Tanzania
O U R W O R L D I S C A P I TA L
BMCE BANK IN AFRICA

PAGE
54/
55
EAC region overview
The East African Community (EAC) is a regional in-ter-governmental organisation founded in 1967, dissolved in 1977 and then re-established on 7th July 2000. It brings together the republics of Burundi, Kenya, Rwanda, Tanzania and Uganda and South Sudan. It is headquarte-red in Arusha, Tanzania.
After acquiring Agaseke Bank, a Rwandan bank, Bank of Africa now covers the entire EAC region with a subsidia-ry in 5 out of the 8 countries within the region.
East Africa, region with solid fundamentalsboosted by investment programmes
East Africa, which registered growth of +6.1%, was one of the most dynamic economies in Africa in 2016, driven by improving regional infrastructure and a high level of FDI in Tanzania, Kenya and Ethiopia. These economies were also among those of sub-Saharan Africa which have seen the most improvement in their business climate, thereby attracting more investors.
In terms of the outlook, the region is expected to maintain its role as a growth locomotive with economic growth forecast to be +6.3% in 2017. This is primarily driven by implementation of major investment pro-grammes and stronger domestic demand.
Burundi
TanzaniaUganda
RwandaSouth Sudan
BMCE
BANK
OF
AFRICA

SOLID results*
In 2016, BANQUE DE CREDIT DE BUJUMBURA S.M. (BCB) was negatively impacted by the ongoing turbulent political and security situation which has persisted since the most recent elections in Burundi.
Customer deposits declined by 1.6% to EUR 144.49 million. Net customer loans contracted by 10.8% to EUR 64.09 million. Total assets rose by 0.2% to EUR 182.86 million.
In terms of results, net banking income rose by 3.9% to EUR 17.72 million.
General operating expenses declined by 4.4% to EUR 11.24 million.
Gross operating income rose by 3.1% to EUR 6.48 million in 2016 while net income increased by 40.4% to EUR 4.09 million.
2016 HIGHLIGHTS
n Inauguration of the new Kayanza branch building, 59 km to the north of Bujumbura
n AUDEC campaign launched, an automatic overdraft facility on the SESAME card
* At constant exchange rates
Banque de Credit du Bujumbura-BCB
Total assets € 182.86 million Customer loans € 64.09 million Customer deposits € 144.49 million Net banking income € 17.72 million Net income € 4.09 million Employees 342Branch network 211EURO= 1 779.0984 BIF
KEY FIGURES 2016
SHAREHOLDING AT 31 DECEMBER 2016
20.25%BOA GROUP S.A 17.37% BANQUE
DEGROOF
10.65% RÉPUBLIQUE DU BURUNDI
9.10% OFFICE DU THEDU BURUNDI (OTB)3.55% OTHER
SHAREHOLDERS
17.38% BIO
21.70% SOCIÉTÉD’ASSURANCES DU BURUNDI
-SOCABU-
BMCE BANK IN AFRICA
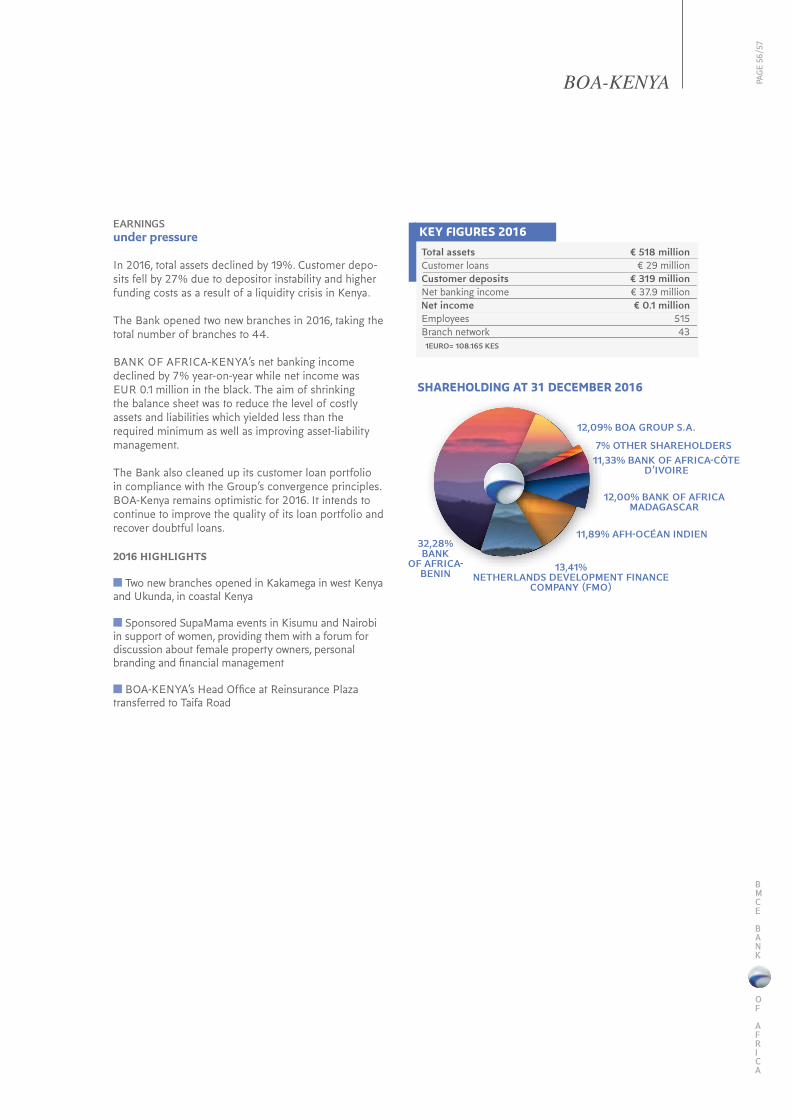
PAGE
56/
57
EARNINGS under pressure
In 2016, total assets declined by 19%. Customer depo-sits fell by 27% due to depositor instability and higher funding costs as a result of a liquidity crisis in Kenya.
The Bank opened two new branches in 2016, taking the total number of branches to 44.
BANK OF AFRICA-KENYA’s net banking income declined by 7% year-on-year while net income was EUR 0.1 million in the black. The aim of shrinking the balance sheet was to reduce the level of costly assets and liabilities which yielded less than the required minimum as well as improving asset-liability management.
The Bank also cleaned up its customer loan portfolio in compliance with the Group’s convergence principles. BOA-Kenya remains optimistic for 2016. It intends to continue to improve the quality of its loan portfolio and recover doubtful loans.
2016 HIGHLIGHTS
n Two new branches opened in Kakamega in west Kenya and Ukunda, in coastal Kenya
n Sponsored SupaMama events in Kisumu and Nairobi in support of women, providing them with a forum for discussion about female property owners, personal branding and financial management
n BOA-KENYA’s Head Office at Reinsurance Plaza transferred to Taifa Road
Total assets € 518 million Customer loans € 29 million Customer deposits € 319 million Net banking income € 37.9 million Net income € 0.1 million Employees 515 Branch network 43 1EURO= 108.165 KES
KEY FIGURES 2016
SHAREHOLDING AT 31 DECEMBER 2016
BOA-KENYA
12,09% BOA GROUP S.A.
7% OTHER SHAREHOLDERS11,33% BANK OF AFRICA-CÔTE
D’IVOIRE
12,00% BANK OF AFRICA MADAGASCAR
32,28%BANK
OF AFRICA-BENIN 13,41%
NETHERLANDS DEVELOPMENT FINANCE COMPANY (FMO)
11,89% AFH-OCÉAN INDIEN
BMCE
BANK
OF
AFRICA

SUBSTANTIAL * results
Despite the uncertain economic environment, BOA-UGANDA registered exceptional growth in its finan-cial results in 2016. Net income stood at EUR 3.19 mil-lion versus EUR 0.14 million in 2014 while net banking income rose by 35% to EUR 20.67 million.
The Bank’s cost of risk contracted by 52% to EUR 0.75 million in 2016 versus EUR 1.57 million in 2015.
COMMERCIAL PLAN gaining momentum
Customer deposits and customer loans each rose by 11% to EUR 126.16 million and EUR 77.04 million respectively. As a result, total assets increased by 9% to EUR 180.88 million in 2016 versus EUR 165.34 million the previous year.
In 2017, the Bank will continue to focus on using new distribution channels to enhance customers’ experience and improve business processes. It will further highlight the growth of the economy by increasing support for the country’s small and medium-sized enterprises which are genuine growth drivers. It intends to continue to pro-mote a risk-based culture, increase provision of foreign currency and ensure that the interests of its customers, shareholders and employees are protected and the com-munities in which the Bank operates.
* At constant exchange rates
BOA-UGANDA
Total assets € 180.88 million Customer loans € 77.04 million Customer deposits € 126.16 million Net banking income € 20.67 million Net income € 3.19 million Employees 443Branch network 351EURO = 3806.773 UGX
KEY FIGURES 2016
SHAREHOLDING AT 31 DECEMBER 2016
11.04% NETHERLANDS DEVELOPMENT FINANCE COMPANY (FMO)
37,96% AFH-OCÉAN INDIEN
7.76% CENTRAL HOLDINGS LTD
43,24% BANK OF AFRICA-KENYA
BMCE BANK IN AFRICA

PAGE
58/
59
RESULTS * impacted by the challenging environment
BANK OF AFRICA-TANZANIA’s performance was weaker than the previous year’s. Net income declined by 27.7% to EUR 1.6 million in 2016 versus EUR 2.22 million the previous year. This was due to the challen-ging operating environment experienced by Tanzania’s banking industry which negatively impacted the Bank’s foreign currency revenues and resulted in the cost of risk almost doubling.
In 2016, net banking income rose by 7.2% to EUR 20.20 million.
ONGOING implementation of the commercial plan
The Bank’s customer loan portfolio grew by 6% to EUR 141.17 million in 2016 versus EUR 133.45 million in 2015 while total assets increased by 9% to EUR 273.28 million versus EUR 250.01 million the previous year. In addition, by focusing on the retail banking segment, BOA-TANZANIE successfully ex-panded its portfolio of retail loans by more than 56% and will continue to concentrate on the retail and SME segments in accordance with the Bank’s three-year strategic plan.
Customer deposits grew by 12% year-on-year to EUR 171.05 million in 2016 versus EUR 152.40 million in 2015.
2016 HIGHLIGHTS
n ‘Bid Bond’ campaign launched to promote a TZS 1 billion (about EUR 410,000) bid bond without guarantee.
n Agreement signed with the French Development Agency (AFD) for a EUR 11.2 million (USD 11.84 mil-lion) credit facility to finance the purchase of renewable energy and energy efficiency equipment
n Products launched including Visa cards, a leasing pro-duct and the WEZESHA LOAN for home construction
* At constant exchange rates
Total assets € 273.28 million Customer loans € 141.17 million Customer deposits € 171.05 million Net banking income € 20.20 million Net income € 1.6 million Employees 309 Branch network 271EURO= 2 301.226 TZS
KEY FIGURES 2016
SHAREHOLDING AT 31 DECEMBER 2016
BOA-TANZANIA
3.5% OTHER SHAREHOLDERS
5.2% TANZANIA DEVELOPMENT FINANCE LTD -TDFL-
14.3% AFH-OCÉAN INDIEN
16.3% BIO
30.50% BOA GROUP S.A
15.7 % BANK OF AFRICA-KENYA
14.5% BOA WEST AFRICA
BMCE
BANK
OF
AFRICA

AN ENCOURAGING first year*
In its first financial year in 2016, BOA-RWANDA’s net income registered a significant decline. This was mainly due to the Bank’s transformation from being a microfi-nance bank to a full-service commercial bank, requiring significant investment.
Customer loans rose by 46.24% in line due to benign market conditions.
Group synergies and the cost incurred in the Bank’s transformation into a commercial bank contributed to the 24.44% growth in deposits.
The Bank will pursue its expansion programme with two new branch openings planned over the next 12 months. It will also introduce a new product for small and medium-sized enterprises.
2016 HIGHLIGHTS
n Head Office transferred from KN 46 Nyarugenge to KN 2 Chic Complex in Kigali
n New website launched and new business centre opened in Kigali
* At constant exchange rates
BOA-RWANDA
Total assets € 19.35 million Customer loans € 9.58 million Customer deposits € 10.97 million Net banking income € 1.99 million Net income € -0.65 million Employees 131Branch network 121EURO= 860.08181 FRW
KEY FIGURES 2016
BMCE BANK IN AFRICA

PAGE
60/
61
REMARKABLE results
Net banking income and gross operating income rose by 18.3% and 34.5% respectively to EUR 24 million and EUR 12.17 million in 2016 versus EUR 20.4 million and EUR 9.4 million.
Net income grew by 23.5% to EUR 8.38 million in 2016 versus EUR 7 million in 2015. The cost-to-income ratio improved from 53.8% at 31 December 2015 to 47.3% at 31 December 2016.
The cost of risk improved by 136.5% year-on-year to negative EUR 0.29 million in 2016 versusEUR 0.11 million the previous year.
ONGOING GROWTH in commercial activity
At 31 December 2016, total assets stood at EUR 505 million versus EUR 468.7 million at 31 December 2015, an increase of 3.2%, with the balance sheet structure relatively unchanged.
Customer deposits rose by 2% to EUR 434.6 million in 2016 versus EUR 427.2 million in 2015. Customer loans registered a steep increase with volumes reaching EUR 124.8 million at 31 December 2016. 2016 HIGHLIGHTS
n New website launched
n Two new branches and a business centre opened in Djibouti
n Agreement signed with the International School of Africa (ISA) to provide student loans on preferential terms
Total assets € 505,21 million Customer loans € 124,81 million Customer deposits € 434,59 million Net banking income € 24,08 million Net income € 8,76 million Employees 147 Branch network 81EURO = 186.0561 DJF
KEY FIGURES 2016
SHAREHOLDING AT 31 DECEMBER 2016
BOA-MER ROUGE
20% PROPARCO
80% AFH-OCÉAN INDIEN
BMCE
BANK
OF
AFRICA

Grandidier ’s Baobab Forest road, Madagascar
O U R W O R L D I S C A P I TA L
Southern Africa
BMCE BANK IN AFRICA

PAGE
62/
63
SADC region overview
The SADC is a Free Trade Area comprising 15 sou-thern African states. It is an economic space with 243 consumers. With aggregate GDP of USD 424 billion (EUR 336.5 billion), it is the largest economic area in sub-Saharan Africa. The regional economy is driven by South Africa. SADC is currently negotiating a free trade agreement with the European Union within the framework of the economic partnership agreements (EPA) scheme.
Bank of Africa Group’s is exposed to the SADC region via BOA-Madagascar (Indian Ocean), the Group’s largest subsidiary in terms of the number of branches.
Southern Africa, moderate growth prospects
The ongoing commodity price decline is continuing to have an impact on southern African economies. As a result, in 2016, economic growth slowed to 1.9% after registering growth of 2.2% in 2015 according to African Development Bank estimates. This was due to the decline in commodity prices and drought. The South African economy, which is the largest within the region, experienced a slowdown. Electricity shortages and weak commodity prices are continuing to weigh down on the country’s economic growth.
Regional economic growth is likely to remain moderate in 2017 although the outlook is generally positive due to anticipated investment in non-petroleum strategic sectors such as electricity, construction and new techno-logies.
Madagascar
BMCE
BANK
OF
AFRICA

STRONG CONTRIBUTION from commercial activity to financing economic development
2016 was a year of positive results, enabling BOA-MA-DAGASCAR to consolidate its position as the top-ran-ked bank within the industry in terms of the number of customers and deposits while registering a noteworthy increase in customer loans.
Business activity saw significant growth in 2016 with deposits up 14.4% increase and loans up 10.4%. Total assets surpassed the EUR 570 million mark, reaching EUR 593 million at 31 December 2016, an increase of 12.1% year-on-year.
The Bank’s capital adequacy ratio stood at 11.9% at 31 December 2016 versus the minimum 8% regulatory requirement.
EARNINGS modestly down
Net banking income rose by 11.5% to EUR 49 million due to significant growth in net interest income and a 14.4% increase in fee income. Operating expenses increased by only 1.1% year-on-year as a result of the Bank’s cost containment strategy. As a result, the cost-to-income ratio contracted by as much as 6.1 points to 59.3% at 31 December 2016.
Gross operating income rose by as much as 31.4% to EUR 20 million, primarily due to good control of general expenses.
Net income stood at MGA 53.2 billion, modestly down on 2015, with the latter having been positively impacted by a number of extraordinary items including a write-back of a sizeable non-performing loan. If this exceptio-nal write-back in 2015 were excluded, 2016 net income would have grown by 21.8% year-on-year.
The Bank’s financial profitability was satisfying with ROE and ROA of 24.8% and 2.7% respectively.
2016 HIGHLIGHTS
n Two agreements signed with the Ministry of Public Health and the Justice Ministry giving staff preferential terms when applying for the Bank’s products
n New Chief Executive Officer appointed
n Participated in a number of trade fairs and expos in-cluding: (i) Job and Entrepreneurship Fair (ii) Madagas-car International Fair (FIM) and (iii) 18th International Home Expo
BOA-MADAGASCAR
Total assets € 593 million Customer loans € 284 million Customer deposits € 481 million Net banking income € 49 million Net income € 15 million Employees 905Branch network 901EURO= 3509.5300MGA
KEY FIGURES 2016
SHAREHOLDING AT 31 DECEMBER 2016
0.29% OTHER FOREIGN
SHAREHOLDERS 4.40% PROPARCO
9.37% MALAGASY STATE
24.83% PRIVATEMALAGASY SHAREHOL-
DERS
61.11%BOA GROUP S.A.
BMCE BANK IN AFRICA

PAGE
64/
65
BMCE BANK OF AFRICAOur World is Capital

Banque de Développement du Mali, Mali’s leading bank with nearly 50 branches and more than 70 points of sale, managed to build on its very strong year-on-year performance in 2015.
In 2016, BDM maintained its status as market leader with some exceptional performances. Total loans grew by 10.75% from FCFA 522.296 billion in 2015 to FCFA 578.454 billion in 2016. Total deposits rose by 16.92% from FCFA 531 billion in 2015 to FCFA 620 billion in 2016.
Total assets increased by 16.6% to FCFA 710 billion in 2016 versus FCFA 609 billion in 2015.
Similarly, net banking income rose by 21% from FCFA 29.3 billion in 2015 to FCFA 35.8 billion in 2016. As a result, the Bank was the only banking institution within its industry to post double-digit earnings growth.
2016 saw the launch of the bank-insurance business, resulting from a partnership between two Malian insurance companies, SONAVIE and SAHAM Assurance Mali.
The partnership with BMCE Euroservices with regard to transfers from Malians living abroad became operational after the official launch 20th May 2017 in Paris.
Banque de Développement du Mali
Total assets FCFA 709 836 million Customer loans FCFA 578 454 million Customer deposits FCFA 620 548 million Net banking income FCFA 35 819 million Net income FCFA 11 923 million Employees 470 Branch network 50 1 Euro = 655.957 F CFA
KEY FIGURES 2016
SHAREHOLDING AT 31 DECEMBER 2016
19.58% MALIAN STATE
10.75% PRIVATE MALIANS
32.38% BMCE BANK OF AFRICA
15.96% BOAD
21.33% CCIM
OTHER AFRICAN SUBSIDIARIES

PAGE
66/
67
La Congolaise de Banque, one of the market leaders in credit distribution in Congo and the country’s largest bank in terms of branch network size, aims to become a leading regional bank in Central Africa.
In 2016, its share of the deposit market rose to 13.97% versus 13.85% in 2015 while its share of the loan mar-ket grew from 14.61% in 2015 to 14.90% in 2016.
Deposits totalled FCFA 185 billion while loans stood at FCFA 175 billion.
Net banking income rose by 5% and gross operating by 17%. By contrast, net income declined by 43% to FCFA 2 billion, impacted by a 150% jump in loan-loss provisions to FCFA 3.5 billion.
The non-performing loan ratio went up to 6.62% versus 4.92% in 2015 while the loan-loss coverage ratio was broadly unchanged at around 56% versus 48% in 2015.
Total assets FCFA 230 billion Customer loans FCFA 175 billion Customer deposits FCFA 185 billionNet banking income 19 billion Net income 2 billion Employees 288 Branch network 19 1 Euro = 194.444 DJF
KEY FIGURES 2016
La Congolaise de Banque
SHAREHOLDING AT 31 DECEMBER 2016
48% PRIVATE INVESTORS
4% SOUTERN CROSS FINANCE S.A11% CONGOLESE STATE
37% BMCE BANK
BMCE
BANK
OF
AFRICA

BMCE Bank in Europe
Forest reflection, CroatiaO U R W O R L D I S C A P I TA L

PAGE
68/
69
The European platform registered positive year-on-year earnings growth thanks to the performance of its two units, BBI London and BBI Madrid. As a result, it is now the Group’s 3rd largest profit centre, accounting for 9% of net income attributable to shareholders of the parent company in 2016.
EUROPEAN PLATFORM registers profit growth
The European platform, which is now the Group’s 3rd largest profit centre, saw its net income rise by as much as 21% to GBP 13.9 million while net banking income increased by 25% to GBP 36.4 million.
BMCE BANK INTERNATIONAL MADRID
Against a backdrop of stronger economic growth and a tightening of legal and regulatory requirements in Spain’s banking industry, particularly in the areas of risk assessment and management, prudential stan-dards, liquidity and financial information, BMCE Bank International Madrid (BBI Madrid) posted contrasting commercial and financial results in 2016.
Net banking income rose by 9% to EUR 18.5 million in 2016, in line with full-year forecasts, while net interest income was 21% ahead and fee income was up 8%. Similarly, gross operating income increased by 6% year-on-year to EUR 13.2 million in 2016.
Operating performance was bolstered by a 36% in-crease in total assets which reached EUR 516.7 million, 16% growth to EUR 432 million in the loan portfolio and a 55% increase in products and services transac-tion volumes, ahead of full-year forecasts.
BBI Madrid intends to implement a strategy aimed at boosting sales with an emphasis on new markets in Latin America.
BMCE BANK INTERNATIONAL LONDON & PARIS
Against a backdrop of slower global economic growth, high volatility in African markets, falling commodity prices and their impact on the budgets of several Afri-can countries, in particular, those that are oil producers, BMCE Bank International Plc London posted positive commercial and financial results in 2016.
Net banking income rose significantly (+27.3%) to GBP 20.6 million in 2016 versus GBP 16.2 million in 2015. The average annual growth rate for the period 2014-2016 was 25.5%. Net banking income was higher than the GBP 20 million forecast despite the impact from the Federal Reserve’s interest rate hike on bor-rowing costs.
Net income rose by 10.1% to GBP 8.6 million in 2016, ahead of full-year forecasts, versus GBP 7.8 million in 2015. The average annual growth rate over the period 2014-2016 was 36.3%. Return on Equity was 14.1% versus 14.6% the previous year.
BMCE
BANK
OF
AFRICA

BMCE Bank in Asia and in North America
BEIJING REPRESENTATIVE OFFICE
In 2016, the Beijing Representative Office’s main focus was on bolstering relations with the Chinese regulatory authorities and Bank Al-Maghrib as well as boosting marketing and relationship-building initiatives.
2016 proved to be a packed year with the Beijing Office carrying out a number of marketing, relationship-buil-ding or assistance assignments including: (i) the marke-ting initiatives in which the Beijing Office participated alongside General Management for International Coordination (DGCI) included presenting the full range of services of a number of Chinese equipment manufac-turers that are planning to set up operations in Morocco; (ii) it also submitted to the DGCI the initial information as part of a finance application for a solar power plant project; (iii) the Beijing Office organised visits by several delegations to both China and Morocco within the framework of a strategic partnership agreement. As a result, a visit was organised to industrial parks in China as well as meetings with Chinese officials in addition to visits to Casablanca and Tangier Med; (iv) the Beijing Of-fice also provided assistance and advice as part of a joint project between Chinese companies and BMCE Bank aimed at setting up an insurance company; (v) other missions were organised in Morocco in which various Chinese companies participated.
CANADA REPRESENTATIVE OFFICE
After signing a partnership agreement with Le Mouve-ment Desjardins in March 2014, BMCE Bank opened a representative office in Montreal to foster closer rela-tions with the Moroccan community in North America. This agreement enables BMCE Bank to provide support to Moroccans living in Canada, students and investors and meet their financial needs by offering preferential, rapid and secure banking terms.
In 2016, a number of events and marketing initiatives were carried out: (i) participated in the mobile consular tour organised by the Consulate General of the King-dom of Morocco in Montreal in the cities of Toronto, Quebec and Edmonton; (ii) sponsored the cultural week and an evening to celebrate the 13th anniversary of the Association of Moroccans in Toronto, during which the Representative Office received significant coverage and publicity via social networks, the website and newsletters throughout the entire event; (iii) BMCE Bank partici-pated exclusively in a real estate expo organised by Dyar Al Mansour at Laval’s conference centre; (iv) sponsored and participated in the Gala Dinner and the awards cere-mony in honour of Canadians of Arabic origin organised by the Council of Arab Ambassadors to Canada, chaired by the Moroccan Ambassador to Canada. This event attracted more than 500 Canadians of Moroccan or Arabic origin.

PAGE
70/
71
Li River, Guilin, China
O U R W O R L D I S C A P I TA L
BMCE
BANK
OF
AFRICA

Global economy
In 2016, the global economy proved resilient despite uncertainties caused by two major events: the United Kingdom’s withdrawal from the European Union and the election of Donald Trump as President of the United States. Given the slowdown in advanced economies, with domestic demand and investment remaining moderate, global GDP rose by +3.1%, after being revised down by 0.3 points.
The outlook for emerging countries is positive with Brazil and Russia moving out of recession. A number of sub-Saharan African countries are continuing to feel the effects of the decline in commodity prices.
Moderate growth in the euro zone Euro zone GDP rose by a modest +1.6%, according to IMF estimates, as a result of lower oil prices, a depreciation in the value of the euro and the ECB’s accommodative monetary policy, in a low inflationary environment.
Despite the low level of investment, persistently high unemployment and relative uncertainty surrounding Brexit and the outcome of elections in 2017 in France, Germany and the Netherlands, an acceleration in pri-vate sector activity towards the end of 2016 would ap-pear to suggest that the growth recovery is sustainable.
Economic growth revised down in the UnitedStates
In the United States, despite growth being weaker than expected (+2.4%), the ongoing improvement in the labour market – unemployment fell to its lowest level (4.6%) since 2007 – underpinned consumer spending. Against a backdrop of a modest pick-up in inflation, the US Federal Reserve raised its key interest rate by 25 basis points in December 2016.
There is room for improvement as far as the country’s macroeconomic balances are concerned with public debt reaching 108% of GDP, the budget deficit sur-passing 4% of GDP and import growth accelerating to +8.3%, leaving the new administration with little margin for manoeuvre.
Emerging and developing countries continue to underpin global growth
Economic growth in emerging and developing countries is estimated at +4.6% in 2016 according to the IMF although prospects vary from one region to another.
In China, growth stabilised in second half 2016 at around +6.7%, driven more by consumption and services than by the manufacturing sector and investment.
The Latin America and Caribbean region registered growth of -0.5% in 2016, according to IMF estimates and remained negatively impacted by lower commo-
dity prices. Mexico, Brazil and Argentina faced political tensions and economic challenges while Latin America and the Caribbean registered an improvement, benefiting from a recovery in the United States.Emerging Asian economies were resilient, particularly India, which registered growth of +7.2% in 2016. Growth remained robust in Europe’s emerging and developing economies. An attempted coup d’état and terrorist attacks added to economic uncertainty in Turkey in 2016 while Russia is likely to have resumed positive growth due to a pick-up in oil prices.
Sub-Saharan Africa’s diversified economiescome through unscathed In 2016, sub-Saharan Africa’s main economies continued to be negatively impacted by lower commodity prices together with political tensions. In Nigeria, economic acti-vity slowed to +1.5% in 2016 due to a shortage of foreign currency and crude oil production disruptions while South Africa’s economy is estimated to have grown by only +0.3%, according to the IMF.
Other more diversified countries within the region regis-tered positive growth, driven by private consumption and investment - Côte d’Ivoire +8%, Senegal +6.6%, Kenya +6% and Ethiopia +5.5%.
Economy resilient despitean uncertain environment
BMCE BANK AND ITS ENVIRONMENT

PAGE
72/
73
Improving economic fundamentals in West Afri-can Economic and Monetary Union (WAEMU)
The economic growth rate in WAEMU countries is expected to be broadly unchanged at +6.3%. With an overall budget deficit of 4.5% of GDP in 2016 and low inflation, WAEMU countries are continuing to invest in infrastructure and social sectors.
In Senegal, growth prospects are encouraging due to on-going investment as part of the Emerging Senegal Plan, a recovery in exports in the wake of a strong agricultural sector and efforts made to diversify the economy.
In Côte d’Ivoire, growth is being driven by an improving business climate, political stability and strong infrastruc-ture spending. Public investment continues to underpin Mali’s economy.
If individual member states are to comply with the community’s budget deficit target of 3% of GDP, then they will have to increase tax receipts and reduce public spending.
Robust growth in East Africa despite a lessbenign environment
With growth averaging +6.1% in 2016, East Africa’s growth rate is well above the average for the entire sub-Saharan African region. A pick-up in inflation in Kenya, Uganda and Tanzania, however, together with currency weakness, is having a relative impact on the economy.
In Ethiopia, after a decade of continuous growth, the economy slowed to +4.5% in 2016. Implementation of a major investment programme is likely to offset this slowdown, however.
In Kenya, the region’s pivotal economy, economic growth was broadly unchanged at +6% in 2016, under-pinned by public investment and a diversified economy. This was also the case for Rwanda, the most successful economy in the region in terms of business affairs.
Tanzania’s economy remained one of the most buoyant in 2016. Growth, estimated at +7.2%, will continue to be driven by the transport, construction, telecommu-nications and banking sectors together with public investment.
The Central African Economic and Monetary Community (CEMAC) remains prey to challen-ging economic and financial conditions After registering the weakest rate of growth in 2015, CEMAC economies are likely to have again slowed in 2016 with growth estimated at +1.9% according to the IMF.
The region’s budget deficit is expected to be 6% of GDP due to a high level of public spending and lower oil prices – 5 out of 6 countries in the region are oil-producing nations, while foreign currency reserves have dwindled from USD 15 billion in 2014 to USD 5 billion in 2016.
BMCE
BANK
OF
AFRICA

Entre Deux Lacs, Melsbroek, Belgium
O U R W O R L D I S C A P I TA L
Moroccan economyOngoing improvement in economic fundamentals
BMCE BANK AND ITS ENVIRONMENT

PAGE
74/
75
After an exceptional year in 2015, 2016 was charac-terised by weak cereal output, estimated at 35 million quintals versus 115 million in 2015, and by a slowdown in non-agricultural activity. Growth was only +1%, however, despite consumer spending and investment continuing to underpin economic activity.
Budget deficit under control In 2016, the budget deficit continued to contract, reaching 4% of GDP. A 4% rise in tax receipts together with a reduction in current expenditure offset the impact from a less than benign operating environment and weak growth.
Modest growth in inflation
In 2016, consumer prices both for foodstuffs and non-foodstuffs, continued to rise with inflation esti-mated at 1.6% in 2016.
The increase in non-food prices was more pronounced, impacted by a recovery in oil prices, while food prices suffered the effects of weak domestic production.
Trade balance deteriorates
The country’s foreign trade position was characterised by an acceleration in imports of capital goods and foodstuffs, resulting in a widening of the trade deficit to MAD 184 billion, up +19% compared to 2015.
Exports of goods and services rose by +2.9% to MAD 334 billion, driven primarily by automobiles, textiles and clothing, food products and pharmaceu-ticals. Phosphates and derivatives again registered negative growth (-12%) due to a contraction in global commodity prices. As a result, the sector surrendered its status to the auto industry as the country’s largest export sector.
The +9.3% increase in imports was primarily due to capital goods imports (+25.7%) and finished consu-mer goods (+15.2%), boosted the recovery in public infrastructure projects.
Modest decline in unemployment
Unemployment declined from 10.1% to 9.6% in 2016. It is worth noting that, as a result of the loss of 103,000 jobs in the unpaid sector, Morocco registered a net loss of 73,000 jobs across all sectors, 96% of which were in rural areas.
Industrial Acceleration Plan 2014-2020 to boost the country’s competitiveness
The auto sector, the Moroccan manufacturing industry’s new flagship sector
The auto industry, which is the growth engine of the Industrial Action Plan, has seen remarkable growth in recent years. The sector posted record high exports for a third consecutive year in 2016 with 316,712 vehicles exported, up +22.4% year-on-year. Growth, which was primarily driven by an 18% increase in output from Renault’s car plants in Tangier and Casablanca, is likely to accelerate over the coming years with the setting up of a new Peugeot plant in 2019.
Aeronautical industry registers a remarkable performance Morocco’s aeronautical industry now ranks 15th in glo-bal aeronautical investment and generates more than 11,000 jobs and USD 1 billion in revenue. The creation of four ecosystems in 2015 is likely to generate 23,000 new jobs and export revenue of USD 16 billion with the local content rate reaching 35%.
Marked improvement in the textiles and clothing sector Benefiting from a benign export environment, the textiles and clothing sector is undergoing profound change, benefiting from the global industry’s new dyna-mic, with China focusing more on its domestic market and a fast-fashion ecosystem emerging. In first half 2016, Morocco was ranked as the 7th largest supplier to the European Union after Cambodia and Vietnam.
Exports of textiles and leather rose by +6.1% to MAD 32.5 billion in 2016 with exports of manufac-tured clothes up +8.4%, hosiery items +4.9% and, to a lesser extent, shoes +0.7%.
BMCE
BANK
OF
AFRICA

Solid performance by the telecommunications sector
In 2016, the telecommunications sector continued to benefit from a positive environment. Total outgoing voice traffic rose by +7.7% year-on-year versus +8.1% in 2015. The number of internet subscribers grew by +17.9% in 2015, resulting in a penetration rate of 50.4% versus 42.8% the previous year.
These results offset the -3.8% decline in total te-lephone subscribers to nearly 43.6 million with mobile subscribers registering a -3.6% fall.
Positive performance by the tourism sector in second half After the downturn in 2015, the tourism sector resu-med growth in second half 2016. Tourist arrivals rose by +1.5% in 2016 after registering a -0.7% drop the previous year with arrivals by Moroccans living abroad outpacing foreign tourist arrivals.
Banking sector sees modest growth in credit
In response to Bank Al-Maghrib’s accommodative monetary policy which saw the key interest rate cut, demand for credit remained strong at +4% in 2016.
This was primarily due to a strong recovery in public sector projects and strong demand for credit from retail banking customers. Loans to private sector corporates, by contrast, remained sluggish.
Improved outlook for 2017
Moroccan economic growth is likely to accelerate in 2015 due to a better crop year. GDP growth is expected to be +3.6% according to the Haut Commissariat au Plan.
An increase in imports by advanced countries and a gradual recovery in emerging countries should result in an acceleration in global trade. In such a context, global demand for Moroccan merchandise is expected to rise by +3.2%, benefiting export sectors such as autos, elec-tronics and clothing and textiles.
An anticipated modest rise in global oil prices and industrial commodity prices, however, is likely to make domestic imports slightly more expensive.
BMCE BANK AND ITS ENVIRONMENT

PAGE
76/
77
BMCE BANK OF AFRICAOur World is Capital

Work of the Board of Directors
In 2016, BMCE Bank’s Board of Directors met on 6 occasions to discuss the following issues:
n Approve the financial statements for the financial periods ended 31 December 2015 and 30 June 2016;n Propose appropriation of income in respect of financial year 2015;n Appraise the Strategic Development Plan 2016-20;n Reappoint CDG and Mr Brahim BENJEL-LOUN-TOUIMI as Directors;n Propose the appointment of four Independent Directors to the Board;n Authorise a programme to issue up to MAD 3.5 billion of subordinated debt in one or more tranches;n Set the terms and characteristics of the subordi-nated bond issue’s first MAD 2 billion tranche;n Issue a MAD 500 million Green Bond;n Set the terms and characteristics of theMAD 500 million Green Bond issue;n Align the Bank’s Memorandum and Articles of Asso-ciation with the provisions of Act No. 78-12, amending and completing Act No. 17-95 regarding limited com-panies and the provisions of Act No. 103-12 regarding credit institutions and similar organisations, revoking Act No. 34-03;n Renew the three-year authorisation of an option to convert into shares amounts owing in respect of a EUR 70 million subordinated loan granted by Interna-tional Finance Corporation (IFC)n Prepare the Management Report and Resolutions to be put to the Annual General Meeting for its approval;n Appraise the recommendations of the Specialised Committees;n Related party agreements.
Green Bonds issued for the first time in Morocco
BMCE Bank of Africa’s MAD 500 million Green Bond issue, the first of its kind in Morocco, was one of the various initiatives carried out within the framework of the Kingdom of Morocco organising the COP22 conference in Marrakesh in October 2016.
This issue was aimed at:(i) Bolstering BMCE Bank of Africa’s commitment to corporate social responsibility in relation to environ-mental protection;(ii) Financing eco-responsible projects and (iii) Supporting private and public sector initiatives aimed at protecting natural resources.
This issue reflects the Group’s longstanding commit-ment, ever since the Bank was privatised in 1995, to sustainable development and environmental protec-tion, upon the Chairman’s initiative and under the impetus of the BMCE Bank Foundation for Educa-tion and the Environment. BMCE Bank of Africa pioneered sustainable finance solutions for customers. The Bank, as an adjunct to its environmental policy, demonstrated its commitment to promoting Green Business by launching, in 2012, BMCE Energico, Morocco’s first ever green invest-ment loan.
In addition, BMCE Bank was the first banking group to establish a socially responsible mutual fund, FCP Capital ISR, managed by BMCE Capital Gestion. In doing so, it extended its commitment to social res-ponsibility to its asset management operations.
In 2015, within the framework of the MorSEFF pro-gramme, developed with the support of the European Union in conjunction with bilateral (AFD and KfW) and multilateral institutions (EIB, EBRD), BMCE Bank launched Cap Energie, the first product in the southern and eastern Mediterranean region to offer technical assistance, subsidies and loans.
In October 2016, a second EUR 35 million MorSEF facility was launched to finance energy efficiency and renewable energy projects.
This issue, which attracted MAD 4.1 billion of subscriptions, was 8.3 times oversubscribed. MAD 89 million was allotted to Tranche A (fixed rate, unlisted) and MAD 411 million to Tranche B (floating rate, unlisted).
MAD 2 billion of subordinated debt issued
In March 2016, the Board of Directors submitted a resolution to the Annual General Meeting reques-ting authorisation to issue up to MAD 2 billion of non-convertible subordinated debt with a minimum maturity of 5 years, in one or more tranches.
This issue was intended to bolster the Bank’s capital base and enable it to meet it prudential and capital adequacy ratios, support implementation of its Strate-gic Growth Plan 2016-2020 and its growth strategy in Morocco and overseas.
BMCE BANK AND ITS GOVERNANCE

PAGE
78/
79
Against such a backdrop, the Board of Directors set the terms and characteristics for issuing the subordi-nated bond’s first MAD 2 billion tranche.
The bond issue, which took place in June 2016, was a resounding success as it was 2.37 times oversubscribed. MAD 447 million was allotted to Tranche A (unlisted), MAD 1,374 million to Tranche B (unlisted) and MAD 79 million to Tranche C (listed).
BMCE Bank’s Board of Directors – changes to RMA’s and FinanceCom’s permanent representatives
Upon the proposal of Mr Othman BENJELLOUN, BMCE Bank’s Chairman and Chief Executive Officer, RMA, the Bank’s benchmark shareholder, will be re-presented by Mr Zouheir BENSAID, its Chairman and Chief Executive Officer.
Similarly, FinanceCom will be represented by Mr Hicham EL AMRANI, who has been Chairman and Chief Executive Officer of the holding company since 2011. He is also a Director of RMA, FinanceCom Group’s insurance company and Méditel-Orange, Morocco’s second telecoms operator.
Mr Azeddine GUESSOUS, until now RMA’s permanent representative, will remain on the Board as an Intuitu Personae Director, a decision that was approved by the Annual General Meeting of 23rd May 2017.
Reappointment of Caisse de Dépôt et de Gestion and Mr Brahim BENJELLOUN TOUI-MI, BMCE Bank’s Chief Executive Officer, as Directors
The Annual General Meeting of May 2016, upon the Board’s proposal, approved the reappointment of Caisse de Dépôt et de Gestion, represented by Mr Abdellatif ZAGHNOUN and Mr Brahim BENJELLOUN TOUIMI, BMCE Bank Group Executive Managing Director as Directors.
Similarly, in accordance with the Bank Al-Maghrib di-rective on corporate governance in credit institutions, the Annual General Meeting approved the appoint-ment of four new Independent Directors:n Mr François Henrotn Mr Brian C. Mck. Henderson n Mr Philippe De Fontaine Vive n Mr Christian de Boissieu.With the appointment of these new directors, the Bank has given greater independence to the Specia-lised Committees.
A female Director appointed to BMCE Bank’s Board
As part of a process aimed at making BMCE Bank’s Board more independent, female and international in its outlook, in March 2017, the Board of Directors welcomed on board Mrs Hadeel IBRAHIM. Mrs IBRAHIM is the Founder and Executive Director of the Mo Ibrahim Foundation, which strives to pro-mote social and economic development in Africa by adopting best corporate governance practice.
BMCE
BANK
OF
AFRICA

Aligning BMCE Bank’s Memorandum and Articles of Association
With the introduction of Act No. 78-12, amending and completing Act No. 17-95 regarding limited companies and Dahir No. 1-14-193 of 5th March 2015, enacting Act No. 103-12 regarding credit institutions and similar organisations, revoking Act No. 34-03, the Bank brought its Memorandum and Articles of Association into line with the provisions of the said legislation.
These amendments relate primarily to the articles about related party agreements, convening sharehol-der meetings, publishing the results of shareholder voting, shareholders’ right to information, appointing independent directors to the Board, setting up an Au-dit Committee and a Risks Committee reporting di-rectly to the Board and the fact that the independent directors do not hold any shares in the Bank.
Renewal of the three-year authorisation of an option to convert into shares amounts owing in respect of a EUR 70 million su-bordinated loan granted by International Finance Corporation (IFC)
In accordance with the undertakings given to Interna-tional Finance Corporation (IFC) when BMCE Bank contracted a EUR 70 million perpetual subordinated bond with the IFC, the World Bank Group’s develop-ment finance institution, an Extraordinary General Meeting of May 2016 approved the renewal of the authorisation of an option enabling BMCE Bank to convert, under certain circumstances, the convertible bonds issued 8th April 2008.
It is worth recalling that the Annual General Mee-ting’s authorisation is for a 3-year period and must be renewed at least six months prior to its expiry in accordance with the provision of the contracted IFC loan.
In this context and, in the event that the IFC would be required to exercise the conversion option in accordance with its contractual commitments, the Annual General Meeting also authorised the Board to carry out, within three years, an equity issue reserved for IFC, by which the latter would subscribe in consi-deration for the amount due to it by BMCE Bank in respect of the aforementioned loan.
Strategic Development Plan 2016-2020
The Board of Directors appraised BMCE Bank of Africa Group’s Strategic Development Plan for the period 2016-2020.
This Plan is structured around 7 major themes:
1. Continue to grow organically by expanding the branch network with the opening of one hundred or so branches in Morocco and sub-Saharan Africa;2. Bolster the Group’s operations in Africa via Bank of Africa, in Europe via BMCE International Hol-ding for corporate banking and trade finance and via BMCE EuroServices for Migrant Banking and in China by opening a branch office in Shanghai;3. Consolidate retail banking and corporate banking operations, particularly in the SME segment and develop new high-growth niche segments such as participatory banking and green business;4. Remain firmly committed to multi-channel banking, the aim being to become market leader in digital banking in Morocco and Africa;5. Increase intra-Group commercial and operational synergies across business lines and geographical regions;6. Implement the Convergence Programme aimed at structuring the Group, with an emphasis on Risks, Ad Hoc and Permanent Control, Compliance, IT and Human Capital;7. Remain at the forefront of CSR and sustainable development.
BMCE Bank of Africa Group therefore continues to maintain its profile as a universal, innovative, mul-ti-African, synergistic, socially responsible and human bank.
BMCE BANK AND ITS GOVERNANCE

PAGE
80/
81
GOVERNANCE PRINCIPLES
Board of Directors’ responsibilities
The primary responsibility of the Board of Directors is to maintain a balance between shareholders’ interests and growth prospects, long-term value creation and depositor protection. This responsibility rests on two fundamental factors: decision-making and monitoring. The decision-making function consists of drawing up, in concertation with General Management, fundamental policies and strategic goals as well as approving a number of important decisions. The monitoring function involves assessing General Management’s decisions, ensuring compliance of systems and controls and implementing policies.The Board of Directors has a quadruple responsibility. It determines corporate strategy, appoints the directors responsible for managing the company within the confines of this strategy, chooses the method of organisation, controls the management process and monitors the quality of the information provided to shareholders and the market by means of the financial statements or when there is a major corporate action.
The Board of Directors has the following responsibilities: (i) Strategic planning,(ii) Determining and managing risk,(iii) Internal control, (iv) Corporate governance(v) Corporate Social Responsibility
Independence criteria
To comply fully with best practice in corporate gover-nance, the Board of Directors endeavours to ensure that at least one-third of the Board is made up of independent Directors. For a Director to qualify as independent, the following criteria must be complied with in their entirety:
- Criterion 1: The Director must not be an employee or member of the managing body of the Bank, a representative, employee or member of the governing body of a major shareholder or a consolidated com-pany and must not have been so during the previous three years.- Criterion 2: The Director must not be a member of the managing body of a company in which the Bank directly or indirectly holds office on its governing body or in which a member of the Bank’s managing body, currently in office or having been in office during the previous three years, holds office on its governing body.
- Criterion 3: The Director must not be a member of the governing or managing bodies of a major customer or supplier of the Bank or the Group, such
as for consulting and project management services or for whom the Bank or the Group accounts for a significant share of their business. - Criterion 4: The Director must not have close family ties with a member of the managing or governing bodies of a major shareholder of the Bank.
- Criterion 5: The Director must not have been a statutory auditor of the Bank during the previous three years.
- Criterion 6: The Director must not have been a member of the governing body of the Bank during the previous twelve years.
On appointing or reappointing an independent di-rector, the Corporate Governance Committee verifies that the independence criteria are met. An annual review is conducted to ensure compliance with the criteria mentioned above.
Remuneration
In accordance with the responsibilities entrusted to it, the Corporate Governance Committee proposes to the Board of Directors a remuneration policy for Directors based on relevant and objective criteria defined by this committee. Once validated by the Board of Directors, this re-muneration policy will specify an annual budget for Directors’ fees which the General Meeting may then allocate to the Directors as remuneration for their work. The fees will be made up of two components:
- A fixed component- A variable component
The variable component will be divided among the Directors in consideration for the work that they have accomplished as Chairman or as a member of the Board’s Specialised Committees. Directors’ fees will be recognised under the Bank’s operating expenses. Expenses incurred with regard to Directors’ travel, accommodation, meals and missions for Board mee-tings or committee meetings are borne by the Bank and reimbursed on presenting receipts.
BMCE
BANK
OF
AFRICA

MR OTHMAN BENJELLOUN,Chairman and Chief Executive Officer
O U R W O R L D I S C A P I TA L
Board of Directors
BMCE BANK AND ITS GOVERNANCE

PAGE
82/
83
t
Mr Othman BENJELLOUN is Chairman and Chief Executive Officer of BMCE Bank Of Africa Group, formerly Banque Marocaine du Commerce Extérieur, which was privatised in 1995. He is also Chairman of FinanceCom, the Bank’s holding company.
He has been the Chairman of the Moroccan Banking Association (GPBM) since 1995 and was Chairman of the Union of North African Banks from 2007 to 2009.
Mr BENJELLOUN founded BMCE Bank Foundation with a two-fold mission – education, primarily fighting illiteracy by building and managing community schools in rural areas in Morocco and Africa and environmental protection.
Mr BENJELLOUN was appointed as Chancellor of Al Akhawayn University of Ifrane between 1998 and January 2004 by His Majesty the late King Hassan II.
In 2007, he was awarded an Honorary Fellowship by King’s College, London.
Since 1981, he has been an Adviser to the Washington-based Center for Strategic International Studies (CSIS) that was formerly overseen by Dr Henry Kissinger. In 2013, the CSIS conferred upon him the prestigious title of Honorary Trustee.
Mr BENJELLOUN has received a number of decorations including Officer of the Order of the Throne by His Majesty the late King Hassan II, Commander of the Order of the Polar Star by
His Majesty the King of Sweden, Commander of the National Order of the Republic of Senegal, Commander by Number of the Order of Isabella the Catholic by His Majesty King Juan Carlos of Spain, Commander of France’s Order of Arts and Letters and, more recently, Commander of the Order of the Grand Star by the Republic of Djibouti.
On 7th April 2010, Mr BENJELLOUN was elevated to the rank of Commander of the Order of the Throne by his Majesty King Mohammed VI.
Born in 1932 in Casablanca, he is a graduate of École Polytechnique Fédérale de Lausanne in Switzerland.Mr BENJELLOUN is married to Dr Leïla Mezian Benjelloun who is an ophthalmologist. They have two children, Dounia and Kamal.
BMCE
BANK
OF
AFRICA

Board of Directors
MR MICHEL LUCAS
Mr Michel LUCAS was until recently Chairman of Crédit Mutuel Group (CIC).
Mr Michel LUCAS joined Crédit Mutuel de Strasbourg in 1971 as an IT specialist after working at Siemens and an IT services company. Leveraging his expertise in IT, he ensured that Crédit Mutuel gained a head-start in customer management. He actively participated in the bank’s geographical expansion and its foray into the insurance business. He helped set up the current Fédération Centre-Est-Europe Centre-Est-Europe, the largest of its kind. In 1992, he oversaw the demutualisation of Assurances du Crédit Mutuel, providing them with increased margin for manoeuvre in their development.
In January 1998, Mr Michel LUCAS became Chief Executive Officer of Crédit Mutuel Group, while retaining his previous functions. In April 1998, he oversaw the acquisition of Crédit Industriel et Commercial by Fédération Centre-Est-Europe. Mr Michel Lucas was also Chief Executive Officer of Banque Fédérative du Crédit Mutuel, Chairman of Assurances du Crédit Mutuel and Chairman of CIC’s Supervisory Board.
In October 2010, Mr Michel LUCAS was appointed as Chairman of Confédération Nationale and Fédération Centre-Est-Europe.
Born in 1939, Mr Michel LUCAS is an engineering graduate from Lille’s Institut Industriel du Nord-Ecole Centrale.
O U R W O R L D I S C A P I TA LMICHEL LUCAS, Representative, Banque Fédérative du Crédit Mutuel
BMCE BANK AND ITS GOVERNANCE

PAGE
84/
85
t
ABDELLATIF ZAGHNOUN,Representative, Caisse de dépôt et de Gestion
MR ABDELLATIF ZAGHNOUN
Mr Abdellatif ZAGHNOUN has been Chairman and Chief Executive Officer of Caisse de Dépôt et de Gestion since 2015.
After graduating in 1982 from the Ecole Mohammedia des Ingénieurs with a specialisation in mining, Abdellatif ZAGHNOUN began his career at the Office Chérifien des Phosphates (OCP), where he held a number of positions of responsibility until 2004.
In 2004, he was appointed as head of the Directorate General of Customs and Indirect Taxes. In 2007, Mr ZAGHNOUN became Vice-Chairman of the World Customs Organization (WCO) and Chairman of the WCO MENA region. In 2008, he was appointed as Chairman of the World Customs Organization’s Audit Committee.
In 2010, he became Director-General of the Directorate General of Taxes.
In January 2015, Mr ZAGHNOUN was appointed by His Majesty as Chief Executive Officer of the Caisse de Dépôt et de Gestion (CDG).
Mr Abdellatif ZAGHNOUN is married and has 3 children.
BMCE
BANK
OF
AFRICA

Board of Directors
O U R W O R L D I S C A P I TA L
MR AZEDDINE GUESSOUS
Mr Azeddine GUESSOUS has been Chairman and Chief Executive Officer of Maghrébail since 2004. He also sits on the Boards of a number of companies including RMA, BMCE Bank, Bank of Africa, BMCE Bank International Madrid, RISMA, Société Nationale d’Investissement, Sonasid and Imperial Tobacco Morocco.
Between 2010 and 2012, Mr GUESSOUS was Chairman of RISMA’s Supervisory Board. In 2001, he became Chairman and Chief Executive Officer of Al Watanya, an insurance company and, in 1995, Caisse Interprofessionnelle Marocaine de Retraite (CIMR).
Between 1978 and 1994, Mr GUESSOUS held a number of senior government positions including Minister of Trade, Industry and Tourism in 1978, Minister responsible for relations with the European Economic Community in 1985 and Morocco’s Ambassador to Spain between 1986 and 1995.
Mr GUESSOUS has received a number of decorations including Officer of the Order of Wissam, Spain’s Order of Civil Merit and Grand Cross, France’s National Order of Merit and the Order of the British Empire (Officer).
Mr GUESSOUS was born in 1941.
AZEDDINE GUESSOUS,Intuitu Personae Director
BMCE BANK AND ITS GOVERNANCE

PAGE
86/
87
t
MR ZOUHEIR BENSAID
Mr Zouheir BENSAID is currently Chief Executive Officer of RMA, the insurance company of FinanceCom Group, of which he has been Deputy Chief Executive Officer since January 2005.
He sits on the Boards of several companies including BMCE Bank, Medi Telecom-Orange, CGI, Maghrebail, RISMA, LYDEC, CTM and other Group subsidiaries as well as being a member of several audit committees.
Mr Zouheir BENSAID has a wealth of experience spanning more than 26 years of the banking, financial and manufacturing industries. In the mid ‘80s, after assuming responsibility for financial institutions at CITIBANK Maghreb, he spearheaded ABN AMRO’s expansion into Morocco’s north-east region.
In 1994, after a three-year period heading up an agri-business, Mr Zouheir BENSAID returned to the financial sector to play an active role in reforming Morocco’s capital markets. He became Chief Executive Officer of Maroc Inter Titres (MIT), BMCE Bank’s brokerage firm, where he oversaw the firm’s first capital-raising deals as well as being involved in privatisations and initial public offerings on the Moroccan Stock Exchange.
Mr Zouheir BENSAID then went on to become Vice-Chairman of the Casablanca Stock Exchange (SBVC) and the Professional Association of Brokerage Firms (APSB) between 1996 and 1998. Between 1998 and 1999, he was Chairman of the Casablanca Stock Exchange, overseeing a period of rapid modernisation.
A former student of Cornell, Mr Zouheir BENSAID was born in 1960. He graduated in Finance from the University of Nevada in 1985 and was a member of the Phi Kappa Phi Honour Society.
ZOUHEIR BENSAID, Representative, RMA
BMCE
BANK
OF
AFRICA

Board of Directors
O U R W O R L D I S C A P I TA L
MR HICHAM EL AMRANI
Mr Hicham El AMRANI has more than 20 years’ experience of private equity investment, financing and corporate strategy across a wide variety of industries.
When FinanceCom was founded in 2001, Mr EL AMRANI assumed responsibility for the Technologies & Telecommunications division. Appointed as Director of Strategy and Development between 2005 and 2008, Mr EL AMRANI was then promoted to the post of Deputy Chief Executive Officer in 2008. He then went on to become the Chief Executive Officer of the holding company in June 2010. He has been responsible for adopting best practice in steering the performance of the various entities within the holding company’s portfolio. He has also spearheaded a number of M&A deals, LBOs and restructurings as part of a process of rationalising the holding company’s portfolio and reducing debt.
In 2009, Mr EL AMRANI also coordinated the process enabling Portugal Télécom and Téléfonica to acquire a stake in Medi Telecom and the subsequent sale of a 40% stake in the company to France Telecom Orange in 2010. He is a Director and standing member of Medi Telecom-Orange’s various governing bodies.
In addition to these roles, Mr EL AMRANI is a Director of RMA, CTM, RISMA, Finatech, Colliers International Morocco and a member of Air Arabia Morocco’s Audit Committee.
Mr Hicham EL AMRANI is an engineering graduate of Ecole Hassania des Travaux Publics and holds an MBA and a Graduate Certificate in Manufacturing and Service Management from Southern New Hampshire University.
Born in 1973, Mr EL AMRANI is married and has two children.
Hicham EL AMRANI, Representative, FinanceCom
MR HICHAM EL AMRANI
Mr Hicham El AMRANI has more than 20 years’ experience of private equity investment, financing and corporate strategy across a wide variety of industries.
When FinanceCom was founded in 2001, Mr EL AMRANI assumed responsibility for the Technologies & Telecommunications division. Appointed as Director of Strategy and Development between 2005 and 2008, Mr EL AMRANI was then promoted to the post of Deputy Chief Executive Officer in 2008. He then went on to become the Chief Executive Officer of the holding company in June 2010. He has been responsible for adopting best practice in steering the performance of the various entities within the holding company’s portfolio. He has also spearheaded a number of M&A deals, LBOs and restructurings as part of a process of rationalising the holding company’s portfolio and reducing debt.
In 2009, Mr EL AMRANI also coordinated the process enabling Portugal Télécom and Téléfonica to acquire a stake in Medi Telecom and the subsequent sale of a 40% stake in the company to France Telecom Orange in 2010. He is a Director and standing member of Medi Telecom-Orange’s various governing bodies.
In addition to these roles, Mr EL AMRANI is a Director of RMA, CTM, RISMA, Finatech, Colliers International Morocco and a member of Air Arabia Morocco’s Audit Committee.
Mr Hicham EL AMRANI is an engineering graduate of Ecole Hassania des Travaux Publics and holds an MBA and a Graduate Certificate in Manufacturing and Service Management from Southern New Hampshire University.
Born in 1973, Mr EL AMRANI is married and has two children.
BMCE BANK AND ITS GOVERNANCE

PAGE
88/
89
t
MR FRANÇOIS HENROT
Mr François HENROT is a leading figure in the world of European finance. He has held several important positions within the Rothschild Group including Vice-Chairman of Rothschild & Co.’s Supervisory Board. He was also an Advisory Director and Vice-Chairman of the Board of Rexel, a global leader in the distribution of low-voltage electrical products.
He began his career at France’s Council of State and went on to hold several senior positions such as Chairman of the Board of COPEBA, a Belgian independent private investment company, Chief Executive Office and then Chairman of Compagnie Financière de Paribas’s Supervisory Board, member of the Supervisory Board of Yam Invest NV, a Dutch independent European investment company.
Having a keen interest in cultural affairs, Mr HENROT was Chairman of France’s Ecole Nationale Superieure des Arts décoratifs and is a member of the Association pour le Rayonnement de l'Opéra de Paris.
Additionally, he has co-authored a number of works including ‘the Banker and the Philosopher’ which deals with the 2008 financial crisis.
Born in 1949, Mr François HENROT is a graduate of Ecole Nationale d’Administration (ENA) and Stanford University.
FRANÇOIS HENROT, Independent Director
BMCE
BANK
OF
AFRICA

Board of Directors
O U R W O R L D I S C A P I TA L
MR BRIAN C. MCK. HENDERSON
Mr Brian C. Mck. HENDERSON is the Founding Partner of Henderson International Advisors, LLC. During a career spanning 43 years in international banking, he has forged significant client relationships in both the private and public sectors as well as developing expertise in management and corporate governance.
At Merrill Lynch, where he spent a large part of his career, Mr Mck. HENDERSON held several important positions including Executive Assistant to the Chairman and Chief Executive Officer, Vice-Chairman of Merrill Lynch Europe, Middle East and Africa and Chairman of the Global Public Sector division. He also served as Chairman of Prime Merrill S.p.a Italy and as member of the Board of Merrill Lynch South Africa Pty Ltd.
Mr Mck. HENDERSON began his career at Chase Manhattan Bank where he held a number of important positions within the Group’s European Institutions division, including Vice-Chairman and Director of the sub-Saharan Africa region and within the Investment Banking division. He was also a Board member of Banque Ivoirienne du Développement Industriel and Chase Bank Cameroon SA.He is currently non-executive Chairman of Augustea Bunge Maritime Ltd., Malta, and Advisor to Cremades & Calvo Sotelo, Madrid.
His public engagements include those of Vice-Chairman and Treasurer of the Atlantic Council of the United States, the Chatham House Foundation, Honouring Nations’ Board of Governors, the Harvard project on American-Indian economic development, the John F Kennedy School of Government and Director of the Fort Apache Heritage Foundation.
Mr Mck. HENDERSON holds a Bachelor of Science degree in International Economic Relations from Georgetown University, School of Foreign Service, Washington DC.
BRIAN MCK HENDERSON, Independent Director
BMCE BANK AND ITS GOVERNANCE

PAGE
90/
91
t
PHILIPPE DE FONTAINE VIVE, Independent Director
MR PHILIPPE DE FONTAINE VIVE
Mr Philippe DE FONTAINE VIVE was Vice-Chairman of the European Investment Bank where he was responsible for operations in France, the Mediterranean region, the innovation sector and matters relating to corporate social responsibility. He is currently Senior Advisor at Oliver Wyman, a consulting firm.
During his career, he has held several important positions within the Ministry of the Economy, Finance and Industry and the Treasury Department, where he was successively responsible for Banks, Insurance, Transport and Urban Planning, Debt and Emerging Markets Development, State Holdings and Financing the State and the Economy. He was also Vice-Chairman of the Paris Club, Adviser on International Affairs to France’s Minister of the Economy and Finance, International Affairs Advisor to the Ministry of Economy and Finance in Paris and Senior Adviser at the World Bank in Washington.
Born in 1959, Mr Philippe DE FONTAINE VIVE is a graduate of the Ecole Nationale d’Administration and the Institut d’Etudes Politiques in Paris. He holds a degree in econometrics.
BMCE
BANK
OF
AFRICA

Board of Directors
O U R W O R L D I S C A P I TA L
MR CHRISTIAN de BOISSIEU
Mr Christian DE BOISSIEU is an Emeritus Professor. As a consultant to international and multi-lateral institutions, he carried out a number of assignments for the Moroccan and Tunisian monetary authorities.
He has built a reputation for contributing to the development of conceptual frameworks in international finance and the work accomplished by France’s Economic Advisory Council which he chaired between 2003 and 2012. He also served as a member of the Attali Commission for stimulating economic growth, the ‘Big Loan’ Commission and the Board of France’s Financial Markets Regulator (AMF).
Mr Christian de Boissieu has written numerous books and articles on money, finance and banking, economic policy, European integration, international monetary issues, emerging countries and development. He has received a number of decorations from France and other countries including Commander of the Legion of Honour and Commander of the Ouissam Alaouite. He is also a member of France’s National Academy of Technologies and the Royal Academy of Belgium.
Mr Christian DE BOISSIEU is also Senior Advisor to Amundi and sits on the Board of Aaqius Geneva.
Mr Christian DE BOISSIEU, born in 1947, is a Doctor of Economic Science, holds a professorial diploma in Law and Economic Sciences, a higher educational degree in Public Law and is a graduate of Institut d’Etudes Politiques de Paris. He was a post-doctoral fellow at Northwestern University and at Harvard in 1973-1974. He was subsequently Visiting Scholar on several occasions to the Federal Reserve in Washington.
CHRISTIAN de BOISSIEU, Independent Director
BMCE BANK AND ITS GOVERNANCE

PAGE
92/
93
t
HADEEL IBRAHIM, Independent Director
MRS HADEEL IBRAHIM
Mrs Hadeel IBRAJIM is the Founder and Executive Director of the Mo Ibrahim Foundation.
She is Co-Chair of the Board of Directors of the Africa Center in New York, whose mission is to foster partnerships, collaboration, dialogue and understanding between artists, business leaders and members of African civil society and their counterparts in the United States and elsewhere.
Mrs Hadeel IBRAHIM sits on the Boards of the Mary Robinson Foundation for Climate Justice, the Synergos Institute, Femmes Africa Solidarité, the 1:54 Contemporary African Art Fair and the African Governance Institute.
She was previously a member of the high-level panel on humanitarian financing which reports to the UN Secretary General and a Board member of Refugees International, the Carter Center and the FT/IFC Transformational Business Awards Judging Panel.
Mrs Hadeel IBRAHIM is also a member of the Royal African Society Council and patron of Restless Development, a youth-led development agency.
BMCE
BANK
OF
AFRICA
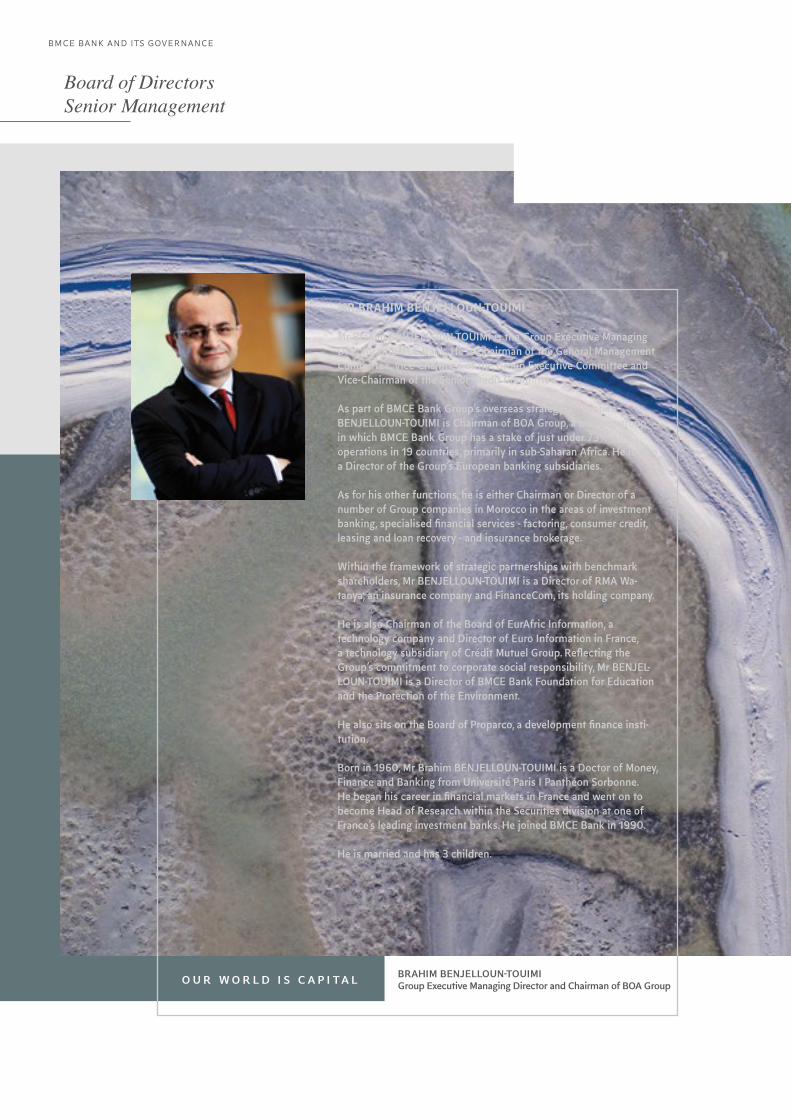
Senior Management Board of Directors
BRAHIM BENJELLOUN-TOUIMIGroup Executive Managing Director and Chairman of BOA GroupO U R W O R L D I S C A P I TA L
MR BRAHIM BENJELLOUN-TOUIMI
Mr Brahim BENJELLOUN-TOUIMI is the Group Executive Managing Director of BMCE Bank. He is Chairman of the General Management Committee, Vice-Chairman of the Group Executive Committee and Vice-Chairman of the Senior Credit Committee.
As part of BMCE Bank Group’s overseas strategy, Mr Brahim BENJELLOUN-TOUIMI is Chairman of BOA Group, a banking group in which BMCE Bank Group has a stake of just under 73% with operations in 19 countries, primarily in sub-Saharan Africa. He is also a Director of the Group’s European banking subsidiaries.
As for his other functions, he is either Chairman or Director of a number of Group companies in Morocco in the areas of investment banking, specialised financial services - factoring, consumer credit, leasing and loan recovery - and insurance brokerage.
Within the framework of strategic partnerships with benchmark shareholders, Mr BENJELLOUN-TOUIMI is a Director of RMA Wa-tanya, an insurance company and FinanceCom, its holding company.
He is also Chairman of the Board of EurAfric Information, a technology company and Director of Euro Information in France, a technology subsidiary of Crédit Mutuel Group. Reflecting the Group’s commitment to corporate social responsibility, Mr BENJEL-LOUN-TOUIMI is a Director of BMCE Bank Foundation for Education and the Protection of the Environment.
He also sits on the Board of Proparco, a development finance insti-tution.
Born in 1960, Mr Brahim BENJELLOUN-TOUIMI is a Doctor of Money, Finance and Banking from Université Paris I Panthéon Sorbonne. He began his career in financial markets in France and went on to become Head of Research within the Securities division at one of France’s leading investment banks. He joined BMCE Bank in 1990.
He is married and has 3 children.
BMCE BANK AND ITS GOVERNANCE

t
PAGE
94/
95
Brahim BENJELLOUN-TOUIMI Group Executive Managing Director and Chairman ofBOA Group
Mamoun BELGHITIChairman and Chief Executive Officer, RM Experts
Driss BENJELLOUN Delegate General Manager responsible for GroupFinance
M’Fadel EL HALAISSI Delegate General Manager responsible for CorporateBanking, Morocco
Mounir CHRAIBI
Delegate General Manager responsible for GroupOperations
Omar TAZI Delegate General Manager responsible for RetailBanking, Morocco
Mohammed AGOUMI Delegate General Manager responsible for CoordinatingOverseas Operations
Senior Management
BMCE
BANK
OF
AFRICA

Senior Management
from left to right
MAMOUN BELGHITIChairman and Chief Executive Officer, RM Experts
DRISS BENJELLOUNDelegate General Manager responsible for Group Finance
M’FADEL EL HALAISSIDelegate General Manager responsible for Corporate Banking, Morocco
O U R W O R L D I S C A P I TA L
BMCE BANK AND ITS GOVERNANCE

PAGE
96/
97
t
MR MAMOUN BELGHITI
Mr BELGHITI is Chairman and Chief Executive Officer of RM Experts, the Group’s specialised loan recovery subsidiary. He is also a director of BOA-Côte d’Ivoire, a subsidiary of BOA Group.
Mr Mamoun BELGHITI began his career in 1972 within the General Services and Inspec-torate Division. In 1981, he assumed responsi-bility for the Credit and Treasury Division and in 1991, the Investment and Credit Division. In 1996, he became Head of the Financial Affairs Division, where he played a key role in implementing the Bank’s strategic develop-ment plan and reorganisation. In the same year, Mr BELGHITI was promoted to the post of Deputy General Chief Executive Officer.
In February 1988, he was appointed as Chief Executive Officer responsible for Finan-cial Affairs and for the Domestic Banking Network. In April 2002, he became Senior Adviser to the Chairman with responsibility for representing the Bank in its dealings with domestic and international institutions and with the monetary authorities. He also sits on the governance bodies of companies in which the Bank is a shareholder. In March 2004, Mr BELGHITI was appointed as Chief Executive Officer of Remedial Mana-gement Group.
MR DRISS BENJELLOUN
Mr Driss BENJELLOUN is Delegate General Manager responsible for BMCE Bank Group Finance. He is also a Director of BMCE BANK Group subsidiaries including BOA Group, BOA Bénin, BOA Madagascar and BMCE Capital.
After joining BMCE Bank Group in 1986, Mr Driss BENJELLOUN was asked to oversee the project to set up a Management Control entity aimed at improving the steering of ope-rations. In 1990, he assumed responsibility for the project to set up an Audit and Manage-ment Control department.
After BMCE Bank was privatised in 1995, Mr Driss BENJELLOUN became Head of the Banking Production division. In 1998, he was appointed as Deputy Chief Executive Officer responsible for a number of departments that make up the Bank’s Group Support division: Banking Production, Information Systems, Organisation, General Services and Safety.
In 2003, Mr Driss BENJELLOUN became Head of the Group Financial Division with a remit to integrate BMCE Bank’s various subsidiaries in Morocco, Europe and Africa. He also partici-pated in the restructuring of BDM and steered the latter’s merger with BMCD.
Mr BENJELLOUN is a Doctor of Finance from Université Paris Dauphine in addition to postgraduate studies in accounting.
MR M’FADEL EL HALAISSI
Mr M’fadel EL HALAISSI is Delegate General Manager responsible for Corporate Banking, Morocco.
This division, which comes within General Management’s remit, brings together corpo-rate customers, SMEs and Large Enterprises.
This specific responsibility for corporate banking was entrusted to him after a career spanning more than 25 years in credit, investment finance, loan restructuring and long-term financing solutions.
On joining BMCE Bank, he was entrusted with the responsibility of setting up the invest-ment loans restructuring department.
He subsequently went on to become Head of Investment and Corporate Markets division in 1998.
In April 2002, he was appointed as Deputy Chief Executive Officer responsible for Corporate Banking, a division which was then subsequently expanded to include overseas operations.
Mr M’fadel EL HALAISSI is a Doctor of Econo-mics from Lille University.
BMCE
BANK
OF
AFRICA

Senior Management
from left to right
MOUNIR CHRAIBIDelegate General Manager responsible for Group Operations
OMAR TAZIDelegate General Manager responsible for Retail Banking, Morocco
MOHAMMED AGOUMIDelegate General Manager responsible for coordinating Overseas Operations
O U R W O R L D I S C A P I TA L
BMCE BANK AND ITS GOVERNANCE
PAGE
98/
99
t
MR MOUNIR CHRAIBI
Mr Mounir Chraibi is Delegate General Manager responsible for Group Operations. He joined BMCE Bank in 2010.
Mr Mounir CHRAIBI is responsible for all of BMCE Bank’s technology, legal affairs, logistics, quality and banking processing divisions.
As such, he oversees strategic projects such as designing the Banking and Insurance informa-tion system (SIBEA), converging the information systems of BMCE Bank’s overseas subsidiaries and automating the Bank’s back offices.
Mr CHRAIBI is Chairman of the Board of BMCE Immobilier, a subsidiary responsible for actively managing BMCE Bank’s non-operating real estate portfolio and Chairman of the Board of Damancash, a Morocco-based money transfer company which joined the BMCE Bank fold in 2014 when it was acquired by GNS Technologie, a Group subsidiary.
He began his career in 1987 as Project Manager of Crédit du Maroc’s information systems mas-ter plan and then, from 1989 to 1994, was made Head of Organisation and Information Systems of the Office d’Exploitation des Ports.
In 1994, he was appointed Chief Executive Officer of the Office de la Formation Profes-sionnelle et de la Promotion du Travail and then in 2001 as the Chief Executive Officer of the Caisse Nationale de la Sécurité Sociale.
In 2005, Mr CHRAIBI was appointed Wali (governor) of the Marrakesh Tensift Al Haouz region which, during his tenure, attracted high levels of private sector investment and saw the launch of several major flagship public projects.
Mr Mounir CHRAIBI is a graduate engineer of Ecole Polytechnique de Paris and Ecole Nationale Supérieure des Télécommunications de Paris.
He was decorated Commander of the Order of Wissam Al Arsh by His Majesty the King in 2008. He is also a Commander of Belgium’s Order of Leopold.
MR OMAR TAZI
Mr Omar TAZI is Delegate General Manager responsible for Retail Banking, Morocco.
Mr Omar TAZI began his career at the Banque de Développement du Canada. In 1992, he joined Wafa Bank as Head of Treasury.
From 1993 to 2005, Mr Omar TAZI held a nu-mber of posts of responsibility within Société Générale Marocaine de Banques (SGMB), including Head of the Investment Loans department, Head of the network for retail, professional and corporate banking and then Deputy Chief Executive Officer, Commercial Banking.
During this period, he was also Director, Vice Chairman or Chairman of a number of SGMB subsidiaries, including SOGEBOURSE, GES-TAR, SOGECREDIT, SOGEFINANCEMENT and ACMAR Morocco
From 2005 to 2010, Mr Omar TAZI was Chief Executive Officer of AFMA Group.
Mr Omar TAZI joined BMCE Bank Group in June 2011 with a remit to boost retail banking operations and improve the effectiveness of the Bank’s sales force. In 2012, he was appointed as Member of Salafin’s Supervisory Board and Director of BMCE EuroServices.
Mr Omar TAZI holds a Masters degree in Finance from the University of Sherbrooke, Canada.
MR MOHAMMED AGOUMI
Mr Mohammed AGOUMI is Delegate General Manager responsible for coordinating Over-seas Operations. As such, he is responsible for coordinating the Group’s various overseas subsidiaries and, in some cases, has direct responsibility for them. He has direct res-ponsibility for all of the Group’s European corporate entities and its offshore network in Morocco. He is also responsible for LCB Bank and BDM.
He chairs BBI Madrid’s Board of Directors and is a member of the Board of BOA, BBI Plc, BIH, LCB and BDM. He joined BMCE Bank Group in 2012, after a long international career in audit and consulting.
Prior to that, he held a number of functions and positions of responsibility at Credit Agri-cole France (CAS). He was appointed Deputy Chief Executive Officer of Le Crédit Lyonnais (LCL) in 2006. In 2008, he became a member of CASA Group’s Executive Committee with responsibility for overseeing the Group’s overseas development. In 2010, he founded Europa Corporate Bu-siness Group (ECBG). He is also the Chairman of ECBG’s Moroccan subsidiary, Financing Access Morocco. Mr Mohammed AGOUMI is a graduate of ESSEC (1979) and holds a DEA in Mathematical Economics and Econometrics (1980). He qualified as a chartered accoun-tant in Paris in 1993 and taught for two years at ESSEC.
BMCE
BANK
OF
AFRICA

O U R W O R L D I S C A P I TA L
Management of Overseas Operations
EUROPE AFRICA ASIA
MOHAMED AFRINEManaging Director
RADI HAMUDEH Managing Director
ADIL MESBAHI Managing Director
ADIL ZELLOUAMINE BOUABID Chief Executive Officer
MOHAMED TAHRI Managing Director
BRÉHIMA AMADOU HAÏDARA Managing Director
ABDELMALEK BENABDELJALILManaging Director
BMCE BANK AND ITS GOVERNANCE
BMCE INTERNATIONALUK/FRANCE
MOHAMED AFRINEManaging Director
BMCE INTERNATIONALESPAGNE
RADI HAMUDEH Managing Director
BMCE EUROSERVICES
ADIL MESBAHI Managing Director
BMCE BEIJING
ADIL ZELLOU
BANK OF AFRICA
AMINE BOUABID Chief Executive Officer
LA CONGOLAISE DE BANQUE
MOHAMED TAHRI Managing Director
BANQUE DE DEVELOPPEMENTDU MALI
BRÉHIMA AMADOU HAÏDARA Managing Director
BMCE CAPITAL TUNISIE
ABDELMALEK BENABDELJALILManaging Director

PAGE
100/
101
t
Management of Moroccan Subsidiaries
BMCE CAPITALInvestment bankingChairman of the Supervisory BoardKHALID NASR
MAGHREBAILLeasing Chairman and Chief Executive Officer AZEDDINE GUESSOUS
RM EXPERTSLoan recoveryChairman and Chief Executive Officer MAMOUN BELGHITI
SALAFINConsumer creditChairman of the Supervisory BoardAZIZ CHERKAOUI
MAROC FACTORINGFactoringChairman of the Supervisory BoardYOUSSEF HAMIRIFOU
EURAFRIC INFORMATIONTechnology servicesChairman of the Supervisory BoardYOUNES KARKOURI
EULER HERMES ACMARCredit insuranceChief Executive Officer TAWFIK BENZAKOUR
BMCE ASSURANCESInsurance consultingManaging Director FAYCEL ASSARI
LOCASOMVehicle leasingManaging Director YOUNES SENHAJI
CONSEIL INGÉNIERIE & DÉVELOPPEMENT Consulting engineeringManaging Director MONCEF ZIANI
OTHER OPERATIONSSPECIALISEDFINANCIAL SUBSIDIARIESINVESTMENT BANKING
BMCE CAPITAL MARKETSCapital marketsDirectorABDELMALEK BENABDELJALIL
BMCE CAPITAL BOURSESecurities brokerageManaging Director ANAS MIKOU
BMCE CAPITAL GESTIONAsset managementManaging Director AMINE AMOR
BMCE CAPITAL GESTION PRIVÉEPortfolio management Managing Director MERYEM BOUAZZAOUI
BMCE CAPITAL CONSEILCorporate finance advisoryChairman of the Supervisory BoardMEHDI JALIL DRAFATE
BMCE
BANK
OF
AFRICA

Corporate Governance
COMPOSITION MEETINGS RESPONSIBILITIES
CORPORATE GOVERNANCE, APPOINTMENTS AND REMUNERATION COMMITTEE
CHAIRMANBFCM - Groupe Crédit Mutuel - CIC, represented by Mr Michel LUCAS
STANDING MEMBERS• François HENROT, Independent Director• Philippe DE FONTAINE VIVE, Independent Director
ASSOCIATE MEMBER• Brahim BENJELLOUN-TOUIMI, Group Executive Managing Director
INVITED MEMBERSThe Corporate Governance Committee may invite at its discretion any member or non-member of BMCE Bank or of the Group, depending on the items for discussion on the Committee’s agenda, including those proposed by committees relating to agreements, appointments or remuneration
COMMITTEE SECRETARYGroup Executive Managing Director
The Corporate Governance Committee is a body reporting directly to the Board of Directors. It advises and makes recommendations to the Board on how to adopt and maintain a good governance policy. In this regard, its responsibility is to:
• Ensure compliance with good governance principles and the statutory and regulatory provisions in force and inform shareholders of these matters, especially in terms of the independence of Directors;• Examine and make recommendations on the composition, responsibilities and work of the Board of Directors and its specialist committees;• Anticipate and ensure resolution of potential conflicts of interest that arise between members of the Board of Directors relating to operations or transactions involving directors or shareholders;• Propose procedures for co-opting Directors and members of General Management and make recommendations to the Board concerning the appointment of new members;• Propose the remuneration policy for Directors and members of General Management in line with criteria established by the Board of Directors.
WORK OF THE CORPORATE GOVERNANCE, APPOINTMENTS AND REMUNERATION COMMITTEE
The Corporate Governance Committee, meeting in March 2017, welcomed its new standing members.
On this occasion, the Committee reviewed Mrs Hadeel Ibrahim’s professional career, resulting in a proposal to co-opt her as an Independent Director.It also took note of the progress of the Convergence Programme as part of its discussions on Group Corporate Governance and its implementation by subsidiaries.Similarly, within the framework of its responsibilities, the Committee reviewed the related party agreements that had been submitted to it.Regarding discussions on remuneration, it examined the principles for determining the budget allocated to directors’ fees, which amounted to MAD 5 million.During this session, the Committee (i) reviewed the composition of the Specialised Committees in the wake of changes to RMA’s and FinanceCom’s permanent representatives, (ii) took note that the Corporate Governance Corpus had been updated and (iii) reviewed the work of the Group’s main governance bodies.It was also decided that the Committee would be renamed the Corporate Governance, Appointments and Remuneration Committee.
Annually, or whenever necessa-ry, at the discretion of members of the Committee.
BMCE BANK AND ITS GOVERNANCE

PAGE
102/
103
COMPOSITION MEETINGS
GROUP RISKS COMMITTEE
RESPONSIBILITIES AND REMIT
CHAIRMANPhilippe DE FONTAINE VIVE, Independent Director
STANDING MEMBERS
• BFCM - Groupe Crédit Mutuel – CIC* • RMA, represented by Mr Zouheir BENSAID • FinanceCom represented by Mr Hicham EL AMRANI • Mr Azeddine GUESSOUS, Intuitu Personae• Mr François HENROT, Independent Director• Mr Brian C. McK. HENDERSON, Independent Director• Mr Christian DE BOISSIEU, Independent Direc-tor
ASSOCIATE MEMBERS • Group Executive Managing Director• Delegate General Manager responsible for Group Finance • Adviser to General Management • Group General Controller • Head of Group Risks• Head of Finance & Investments
INVITED MEMBERS• The committee may invite any person who is a member of the Group’s managing staff or any manager whose functions are within its remit, depending on the items for discussion on the Committee’s agenda.
COMMITTEE SECRETARY Group Risks Division
*Awaiting appointment ever since the departure of its previous representative
WORK OF THE GROUP RISKS COMMITTEE IN 2016
In 2016, the Group Risks Committee met on four occasions.
The Committee’s work included reviewing trends in the main credit risk indicators at the consolidated and parent levels in terms of credit distribution, portfolio quality, stress test results, sector and group limits.
Similarly, the Committee examined the principles underpinning the new delegation scheme, the system for market risk limits as well as trends in both market and operational risks, the 2016 guidelines for the credit approval policy submitted to it by the Group’s General Management Committee, the Country Risk Management System that is in the process of being adopted and the indicators of commitments relating to credit risks.
The Committee also took note of the parent company’s capital ratios as well as capital consumption by subsidiaries. In addition, as part of the forthcoming process of implementing Basel III requirements, it took the opportunity of analysing capital requirements.
In addition to conducting risk analysis of BMCE Bank of Africa Group, the Committee also analysed risk by major geographical region - Africa and Europe.
Quarterly
GROUP RISKS COMMITTEE
BMCE Bank Group’s Risk Committee is a body reporting directly to the Board of Directors whose remit has been extended to subsidiaries and other entities included within the Group’s scope of consolidation.
The Group Risks Committee assists the Board of Directors in matters such as strategy and risk management. In particular, it ensures that overall risk policy is adapted to the risk profile of both the Bank and the Group, the degree of risk aversion, its systemic importance, its size and its capital base.The Group Risks Committee assumes the following responsibilities on a permanent basis:
i. Advises the Board of Directors about risk strategy and the Group’s risk aversion profile;
ii. Ensures that the level of risks incurred is contained within the limits set by the Management Body in accordance with the risk aversion profile defined by the Board of Directors;
iii. Assesses the quality of the risk measurement policy and control and monitoring of risks at Bank and Group level;
iv. Ensures that risk information systems and communications are appropriate with regard to the risks incurred both;
v. Assesses the human and other resources allocated to the risk management and control function and ensures its independence;
vi. Assesses that capital and liquidity are adequate given the degree of risk aversion and risk profile of the Bank and Group;
vii. Informs the Board of Directors at least twice a year of the situation regarding non-performing loans, the results of measures taken to recover such loans by amicable means, restructured and sensitive loans and provides a progress report on their repayment;
viii. Ensures that stress-tests are carried out on the portfolios of subsidiaries in Morocco and overseas covering the economic and operating environments as well as any potential impact on the Group;
ix. Informs the Board of Directors of the results of risk monitoring from a regulatory perspective and the potential impact on the Bank and the Group;
x. Assists the Board of Directors in examining loans to related parties including the terms and conditions offered, repayment in accordance with the schedule, payment delays and consolidations undertaken (which must be reported to the Board of Directors).
xi. Examines the summary report of the Group Risk Steering and Management Committee.
xii. Is responsible for the risk management and control function.

CHAIRMANAzeddine GUESSOUS, Intuitu Personae Director
STANDING MEMBERS• BFCM - Groupe Crédit Mutuel – CIC *,• RMA, represented by Mr Zouheir BENSAID• François HENROT, Independent Director• Philippe DE FONTAINE VIVE, Independent Director• Christian de BOISSIEU, Independent Director
ASSOCIATE MEMBERS• Group Executive Managing Director• Delegate General Manager responsible for Group Finance• Adviser to General Management• Group General Controller• Head of Group Risks• Head of Finance & Investments
INVITED MEMBERS• External auditors; • Heads of Permanent Control and Compliance;• The committee may invite any person who is a member of the managing staff or any manager whose functions are within its remit, depending on the items for discussion on the Committee’s agenda.
COMMITTEE SECRETARY • Mr Khalid LAABI, General Controller of BMCE Bank Group
*Awaiting appointment ever since the departure of its previous representative
WORK OF THE GROUP AUDIT AND INTERNAL CONTROL COMMITTEE IN 2016
In 2016, the Group Audit and Internal Control Committee met on 4 occasions.
The Committee examined, in particular, the Group’s and the Bank’s commercial and financial performance and the Statutory Auditors’ reports incorporating the new legal provisions, non-operating real estate assets and related management arrangements, the compliance alert points in 2015 and the 2016 global audit plan for ad hoc control.
Regarding internal control, it examined, in particular, the consolidated annual report on internal control to be submitted to Bank Al Maghrib and prepared, in compliance with the regulatory provisions, the Group’s General Control Action Plan 2015 in terms of audit and inspection assignments, control activity indicators, the fraud report, an appraisal of the implementation of recommendations of Group CACI, Bank Al Maghrib and the statutory auditors, in addition to a summary of the main Group General Control Group and Compliance alert points.
Quarterly
COMPOSITION MEETINGS
GROUP AUDIT AND INTERNAL CONTROL COMMITTEE
BMCE BANK AND ITS GOVERNANCE

PAGE
104/
105
RESPONSIBILITIES AND REMIT
The Group Audit and Internal Control Committee (Group CACI) is a body reporting directly to the Board of Directors whose remit has been extended to subsidiaries and other entities included within the Group’s scope of consolidation.The Group Audit and Internal Control Committee assists the Board of Directors in matters such as internal control while ensuring that:• The internal control system and resources are: - Appropriate and compatible to be able to monitor and control risk within the Bank and at subsidiary level and produce information required by regulatory authorities as part of the monitoring process of the consolidated entity; - Adapted to the Group’s organisational structure as well as the activities of entities under its control;• The financial information intended for the Board of Directors is reliable and accurate such that the legitimate interests of shareholders, depositors and other stakeholders are safeguarded;• Examine the parent company and consolidated financial statements prior to submitting them to the Board of Directors for approval.
The Group Audit and Internal Control Committee shall ensure, on a permanent basis, that the following responsibilities are assumed in their entirety:
A. Regarding Internal Audit and Control, the Group Audit and Internal Control Committee:
i. Assesses the quality of the internal control system within the Bank and at subsidiary level by ensuring that, on a permanent basis:
- The accounting policies adopted by the Bank for preparing the parent company and consolidated financial statements are relevant, sustainable and accurate;- The process for collecting, handling and storing accounting and financial data is reliable;- Operating units are strictly set apart from control units; - Assesses whether internal control procedures are consistent and adequate; - Procedure manuals are established by departments or operating units, setting out the procedures for recording and handling operations and accounting-related processes;- Procedures for carrying out operations should comprise, as an integral part, appropriate control procedures and audit trails;
ii. Assesses whether the corrective measures proposed or implemented are appropriate to overcome any shortcoming or inadequacy in the internal control system; iii. Approves the Group’s Internal Audit Charter and assesses the audit plan and the human and other resources allocated to the Internal Audit activity;
iv. Assesses the human and other resources allocated to the periodic control, permanent control and compliance functions and ensures that they are independent from the Bank and its subsidiaries; v. Examines proposals to appoint or reappoint Statutory Auditors for Group entities and analyse their extent of coverage; vi. Defines minimal risk areas to be covered by internal auditors or Statutory Auditors; vii. Requests that an internal or external audit be carried out if deemed necessary; viii. Informs the Board of Directors of the results of monitoring matters related to internal control from a regulatory perspective and the potential impact on the Bank and the Group; ix. Prior to submitting them to the Board of Directors, examines the activity reports and recommendations of the internal audit, permanent control, compliance, risk management and control functions, the statutory auditors and the supervisory authorities as well as the corrective action taken;x. Examines the annual report on Internal Control on a consolidated basis, to be submitted to Bank Al Maghrib; xi. Examines the statutory auditors’ report for filing with Bank Al Maghrib and ensures that the resulting recommendations are implemented;xii. Assist the Board of Directors in analysing corporate and social responsibility (CSR) risk mapping;xiii. Examines the summary report of the work of the Group Coordination and Internal Control Committee.
B. Regarding monitoring information systems and communications, the Group Audit and Internal Control Committee:
Ensures that information systems and communicat ions a re e f fect ive and appropriate with regard to the risks incurred both on an individual as well as consolidated basis by:• Periodically assessing the security of information systems and, if necessary, the quality of the corrective action undertaken;• Checking the availability of information security procedures to ensure business continuity; • Safeguarding the probity and confidentiality of accounting and financial information; • Checking the policy for publishing information, ensuring that accurate, appropriate and comprehensible information is communicated at the right time regarding material aspects of the Bank’s activity in order to encourage transparency with regard to shareholders, the general public, staff, supervisory authorities, investors and other stakeholders.
C. Regarding monitoring Group Compliance policy, the CACI:
The Group Audit and Internal Control Committee examines the compliance situation within the Group and the state of progress in respect of compliance-related initiatives for each Group entity; The Committee ensures implementation of a formal policy for preventing and dealing with conflicts of interest. In this regard, it: • Ensures that a policy for preventing and managing conflicts of interest is adopted and enforced operationally. This policy must comprise a whistle-blowing mechanism, appropriate standards for supervising related party transactions, clear demarcation of reporting lines and responsibilities of members of the management body, a definition of delegation of powers and procedures for dealing with cases of non-compliance with these policies and procedures;• Ensures that the General Management Committee applies procedures prohibiting or restricting, in an appropriate manner, activities, relations or situation likely to harm the quality of governance such as:- Loans, especia l ly to members of administrative or management bodies or to shareholders, on terms which do not reflect standard market conditions or on terms different to those enjoyed by all staff as employee benefits;- Preferential treatment given to related parties or to other favoured entities; ii. Regarding monitoring the risk of non-compliance to which the Group is exposed, the CACI:• Ensures that operations carried out and internal procedures comply with the legal and regulatory provisions in force as well as with industry and ethical standards and practices; • Ensures that the Group Compliance function has adequate technical human resources and skills including knowledge of markets and products and that the employees in question have regular access to appropriate training.
D. Group Permanent Control
The Group Audit and Internal Control Committee assesses the permanent control policy, the reliability and security of transactions and compliance with procedures at branched, head office departments and financial entities under the Group’s control.

CHAIRMAN Chairman and Chief Executive Officer
VICE-CHAIRMAN Group Executive Managing Director
MEMBERS• Managing Director of RM Experts, Intuitu Personae• Delegate General Manager, responsible for Group Finance • Delegate General Manager, responsible for Corporate Banking, Morocco• Delegate General Manager, responsible for Group Operations• Delegate General Manager, responsible for Retail Banking, Morocco• Delegate General Manager, responsible for International Coordination• Chief Executive Officer of BOA Group• Chairman of BMCE Capital’s Executive Board
COMMITTEE SECRETARYHead of Group Risks
This Committee, under the authority of the Chairman, is responsible for steering the Group’s corporate strategy. It is the operational relay for the Board of Directors in making strategic proposals, implementing strategic decisions taken by the Board and closely monitoring Group risk management. It steers Group activities and rules on operational and functional issues that come under the remit of the Bank’s entities and internal committees.
Steer the Group’s corporate strategyInitiate and execute strategy and launch major intra-Group projects:
• Ensure that strategy is aligned across all Group entities in Morocco and overseas;• Ensure proper implementation of the Group’s corporate strategy • Identify and launch major keystone projects that will transform the Group;
Evaluate new strategic operations on behalf of the Board:• Opportunities for growth, investment, strategic equity investment and synergies for BMCE Bank Group;• Opportunities to extend BMCE Bank Group’s scope of activities (organic growth, growth by acquisition, disposals, diversification); • Manage investment risk and allocate capital and other financial resources accordingly.
Ensure the Group’s profitability and financial control:
Monitor risk management• Ensure risk monitoring and management, determine the Bank’s level of risk appetite and regularly assess whether it is appropriate;• Ensure risks are comprehensively hedged by adopting the required measures.
Human Resources• Examine policy for staff remuneration, training, mobility and recruitment;• Carefully manage the career progression of high-potential executives.
WORK OF THE GROUP EXECUTIVE COMMITTEE IN 2016
The main focus of the Executive Committee, meeting in 2016, was to review the projections of consolidated results at 31 December 2015. The corporate strategic commitments made had been complied with. It also noted the performance of the Debt Recovery Committee in terms of debt recovery and write-backs. In addition, in terms of international strategy, the Committee outlined the progress made in terms of the Group’s expansion in Asia.
The Committee was also informed of the anticipated appointment of four Independent Directors.
As part of the celebrations for the 20th anniversary since the Bank’s privatisation, the Committee was presented with a review of the Group’s achievements, which showed exceptional growth in business activity and earnings since privatisation.
Quarterly, or whenever ne-cessary, at the request of the Chairman or, by delegation, the Vice-Chairman of the Com-mittee.
COMPOSITION MEETINGS RESPONSIBILITIES
GROUP EXECUTIVE COMMITTEE
BMCE BANK AND ITS GOVERNANCE

PAGE
106/
107
CHAIRMAN Group Executive Managing Director
STANDING MEMBERS• CEO and Chairman of RM Experts• Delegate General Manager of BOA Group • Delegate General Manager, responsible for Group Finance• Delegate General Manager, responsible for Corpo-rate Banking, Morocco• Delegate General Manager, responsible for Group Operations• Delegate General Manager, responsible for Retail Banking, Morocco• Delegate General Manager, responsible for Interna-tional Coordination• Chairman of BMCE Capital’s Executive Board• Adviser to General Management• Group General Controller• Delegate General Manager, responsible for Concilia-tion, Financial Engineering & Restructuring• Head of Group Risks• Head of Finance & Investments• Delegate General Manager, responsible for Interna-tional Development Programmes• Delegate General Manager, Head of Group Commu-nications• Delegate General Manager, responsible for Market Development• Delegate General Manager, responsible for Invest-ments and Financial Engineering• Head of Group Governance & Development• Head of Group Compliance• Head of Group Human Capital
COMMITTEE SECRETARY
Head of Group Governance & Development
Weekly, every Wednesday
COMPOSITION MEETINGS
GENERAL MANAGEMENT COMMITTEE
WORK OF THE GENERAL MANAGEMENT COMMITTEE IN 2016
In 2016, the Group General Management Committee met on 34 occasions and rallied senior management around implementing the strategic decisions taken by the Board of Directors.The Group General Management Committee drew up the Strategic Development Plan 2016-20 and the capital allocation plan, which is primarily focused on expanding the branch network by opening one hundred or so branches in Morocco and in sub-Saharan Africa, bolstering the Group’s presence in Africa, consolidating operations and increasing intra-Group synergies. Similarly, a reassessment of a number of assumptions underpinning the SDP was carried out at the end of 2016, taking into account the latest developments and identifying drivers so as to meet the targets as well as a review of the trend in general operating expenses.In terms of optimising the risk profile of the Bank and the Group, the Committee examined trends in credit risk indicators and the general credit approval guidelines for 2016. In addition, it approved a new country risk management system to comply with Bank Al-Maghrib’s regulatory requirements as well as the implementation schedule.The Committee also approved the gradual implementation of a project to pool banking services and processing.On the sales front, the Committee reviewed the development strategies for the Corporate Banking, Professional Banking and Young Persons market segments, the action plans for growing the investment loan, foreign trade and green finance businesses. In addition, the Committee gave particular attention to the setting up of the Group’s participatory finance venture.As part of the process of motivating human capital and enhancing the Group’s corporate culture, the Committee discussed variable remuneration and bonuses, how to improve HR benefits by implementing new dedicated information systems and expanding the Solidarity Fund’s benefits.
RESPONSIBILITIES
The General Management Committee is responsible for translating and monitoring the Group’s corporate strategy into operational initiatives and measures.
STEERING THE BUSINESS
• Steer corporate strategy in line with Group Executive Committee decisions, draw up clear budgetary targets and ensure that strategy is implemented; • Encourage and assess the state of progress concerning implementation of major intra-Group projects that impact the Bank’s operations and development; • Validate annual budgets, monitor their allocation and ensure that resources are optimised; • Monitor budget implementation and ensure that corrective measures are taken in the event of deviating from budget; • Determine pricing policy for products and services while ensuring that business lines remain profitable; • Assess opportunities for launching new activities, products or services and ensure their monitoring and implementation; • Rule on operational issues that are within the remit of divisions, departments and internal committees and set objectives; • Ensure organisational efficiency by implementing necessary measures relating to human resources, organisation, IT, logistics and security which contribute to the Bank’s development.
INTERNAL CONTROL, AUDIT AND RISK MANAGEMENT
• Ensure risk monitoring and management, determine the Bank’s level of risk appetite and regularly assess whether it is appropriate; • Regularly monitor implementation of corporate policies and strategy and take corrective action if required; • Ensure compliance with prudential ratios and regulations in respect of internal control, risk and compliance; • Regularly inform the Audit and Internal Control Committee and the Board of Directors of the key issues and main findings from analysing and monitoring risks related to the Group’s activity and results;• Assess major commitments exceeding 5% of the Bank’s capital as well as loans on the watch and weak lists; • Make recommendations on measures to be taken on high risk accounts; • Ensure that the sales network undertakes effective initiatives and regularises major commitments.
HUMAN RESOURCES
• Examine policy for staff remuneration, training, mobility and recruitment • Ensure that recruitment and training policies are appropriate given operational priorities;• Carefully manage the career progression of high-potential executives. OTHER RESPONSIBILITIES
• Ensure a coherent commercial, institutional and financial communications policy; • Rule on potential conflicts of interests and unresolved cases within the remit of committees and entities at Group level;• Make proposals to the Group Strategic Committee about corporate strategy.
OPERATING COMMITTEE
CHAIRMAN
• Delegate General Manager, responsible for Group Operations
STANDING MEMBERS• Group General Control• Finance and Investments • Personal and Professional Banking• Corporate Banking• Group Risks • Group Human Capital• Technology Processes and Group Organisation • Risk management Morocco• Casa North Regional Division• Casa South Regional Division• Ex-Casa Regional Divisions• Governance and Management
COMMITTEE SECRETARYGroup Quality
ASSOCIATE MEMBERSIn addition to the above standing members, associate members include all divisional and departmental heads. They attend meetings to discuss those issues that they have submitted to the Operating Committee for deliberation.
The Operating Committee is a body that is responsible for reporting, information-sharing and ruling on any issue related to the Bank’s operations.
It therefore provides operational as well as technical expertise and makes recommendations to the General Management Committee to assist with decision-making.
• Ensure the rationalisation of the Bank’s project portfolio (organisation, IT, logistics, quality etc.) and the sharing of available resources;• Rule on project priorities, postponements and stoppages as a function of corporate strategy and allocated budgets; • Monitor the state of progress of project implementation and the impact on the Bank’s operations and development; • Ensure a rapid development cycle for new products and services, particularly in terms of time-to-market and resolve any related operational or functional issue; • Monitor the state of progress of the expansion of the branch network (branch openings, installation of off-site ATMs, branch closures etc.);• Regularly analyse the Bank’s main operating indicators (quality, incidents, production etc.) and operational risk and propose corrective action; • Rule on decisions regarding operational aspects relating to technical, organisational and logistical issues; • Report to the General Management Committee on potential conflicts of interest as well as on all unresolved customer files within the remit of the Bank’s entities and internal committees • Monitor implementation of recommendations from Group General Control relating to these competences.
WORK OF THE OPERATING COMMITTEE IN 2016
In 2016, the Operating Committee met on 24 occasions and dealt with about 30 issues, 23 of which were new, completing more than half.
Issues dealt with by the Operating Committee mainly included the HR business continuity plan, new procedures for valuing real estate, rolling out the Fatourati service for paying invoices using the Bank’s different online channels, paying vehicle tax remotely or in the branch, managing merchandise advances, strengthening IT security policy and mobile banking.
As far as the compliance component was concerned, the Committee examined issues relating to identifying ad hoc customers, third-party data reliability and the protection of personal data.
Regarding bank cards, the Committee’s work focused on travel cards, a review, ATMs, cancelling card payments and performance analysis.
Weekly and whenever necessary
COMPOSITION MEETINGS RESPONSIBILITIES
BMCE BANK AND ITS GOVERNANCE

PAGE
108/
109
GROUP INTERNAL CONTROL COORDINATION COMMITTEE
CHAIRMANChairman of the Group General Management Committee and, in his absence, the Group General Controller.
STANDING MEMBERS• Delegate General Manager, responsible for Group Finance• Delegate General Manager, responsible for Group Operations • Group General Controller• Head of Group Risks• Head of Finance & Investments• Head of Group Compliance• Head of Group Permanent Control
COMMITTEE SECRETARYHead of Group Compliance
ASSOCIATE MEMBERS• Head of Subsidiaries’ Risk, Internal Control and Compliance functions, depending on the items to be discussed on the Committee’s agenda.• Group Governance and Development division; • The Committee may invite, at its discretion, any member or non-member of BMCE Bank or of the Group, depending on the items to be discussed on the Committee’s agenda.
WORK OF THE GROUP INTERNAL CONTROL COORDINATION COMMITTEE IN 2016
In 2016, the Group Internal Control Coordination Committee met on 3 occasions.
During these meetings, it examined the possibility of acquiring IT systems for redesigning certain aspects of internal control, the appraisal of the deployment of the permanent control portal, the contracts entered into with foreign exchange counters, the ethics-based alert system and expanding the filtering and profiling of Bank staff.
Quarterly, or whenever necessary
COMPOSITION MEETINGS
The Group Internal Control Coordination Committee is a sub-committee of BMCE Bank Group’s General Management Committee. It helps the latter manage and monitor, at the operational level, control systems at Group level. In this regard, its responsibility is to:
• Monitor, on a permanent basis, the overall and actual functioning of internal control systems at Group level;
• Ensure consistency and standardisation of those items constituting internal control systems, the means employed to implement them (procedures, internal control tools etc.), rules ensuring that these systems are ring-fenced from operational units and the various responsibility levels under 1st and 2nd level control;
• Ensure that authority and responsibility levels and the remit of operational entities of the Bank and of its subsidiaries are clearly outlined and demarcated by means of procedures for executing operations;
• Take the necessary measures, in good time, to remedy any identifiable deficiency or failing,
while implementing recommendations to make good deficiencies or failings identified by the internal control system of the Bank and Group subsidiaries;
• Periodically review the internal control handbook of the Bank and its subsidiaries with a view to amending its provisions to account for legislative and regulatory changes as well as changes to the Group’s business operations and business lines;
• Coordinate preparation of the annual report on internal control in respect of regulatory provisions and ensure compliance with the principles governing the interaction of those parties contributing to its preparation;
• Analyse internal control reports, examine the main malfunctions and propose to the Group General Management Committee the necessary corrective action for reducing risk as much as possible;
• Coordinate the process for preparing the permanent control and compliance annual plans of the Bank and Group subsidiaries and ensure that they are updated;
• Ensure, on a regular basis, that the information systems used by the Bank and its subsidiaries for accounting and information processing satisfy the general objectives of prudence and security and that they comply with current accounting standards;
• Ensure that the information and communications systems are effective, reliable and well-adapted, covering all the main activities and the risks incurred, measuring and monitoring, permanently, on an individual as well as consolidated basis, exposure to the various risks;
• Closely monitor the accounting control system, ensuring the quality, reliability and completeness of financial data and of the accounting principles and standards adopted as well as the availability of information at any time.
RESPONSIBILITIES
BMCE BANK AND ITS GOVERNANCE

PAGE
110/
111
GROUP RISK STEERING AND MANAGEMENT COMMITTEE
CHAIRMAN• Group Executive Managing Director
STANDING MEMBERS• Delegate General Manager, responsible for Group Finance• Delegate General Manager of BOA Group• Delegate General Manager, responsible for Cor-porate Banking, Morocco• Delegate General Manager, responsible for Retail Banking, Morocco• Delegate General Manager, responsible for Group Operations• Delegate General Manager, responsible for Inter-national Coordination• Chairman of BMCE Capital’s Executive Board• Adviser to General Management• Group General Controller• Head of Group Risks Division• Head of Finance & Investments Division
COMMITTEE SECRETARY• Head of Group Risk Management
ASSOCIATE MEMBERS• The Chairmen and Chief Executive Officers of the subsidiary in question• Any other person in connection with the topic to be discussed by the Committee
WORK OF THE GROUP RISK STEERING AND MANAGEMENT COMMITTEE IN 2016
In 2016, the Group Risk Steering and Management Committee met on 3 occasions.
During these meetings, the Committee examined the 2016 credit approval guidelines, risk indicators at the Bank and Group levels, regulatory ratios and the Information and Development Committee charter.
Bi-monthly, or whenever neces-sary
COMPOSITION MEETINGS RESPONSIBILITIES
The Group Risk Steering and Management Committee is a sub-committee of BMCE Bank Group’s General Management Committee. It helps the latter manage and monitor, at the operational level:• The risk steering policy of the Group, BMCE Bank S.A. and its direct and indirect subsidiaries;• Ensures that the Group’s activities comply with risk policy and limits set by the Group, BMCE Bank S.A. and its direct and indirect subsidiaries.
The Group Risk Steering committee ensures that the risk steering policy of the Group, BMCE Bank S.A. and its direct and indirect subsidiaries is effective and consistent with risk management policy relating to credit, market and operational risks.
In this respect, its responsibility is to:• Determine global risk strategy and ensure that it is governed by policy and procedures which allow for measuring, controlling and monitoring risk both on an individual as well as a consolidated basis;• Define limits for general levels of risk incurred in accordance with the risk aversion profile determined by the Board of Directors and the overall operational thresholds set by the Group General Management Committee and ensure that they are complied with, while taking into consideration the capital of BMCE Bank S.A. and the Group’s direct and indirect subsidiaries (prudential ratios);• Examine internal risk measurement models;• Analyse the causes of potential overruns of global risk limits and propose corrective action;• Establish a policy for managing non-performing loans, periodically examine their progress and draw up action plans to manage them;• Monitor risk management at a regulatory level and in terms of methodology; • Monitor inter-Group organisational and IT projects related to risk steering;• Validate any change related to risk steering implemented by the Group or any of its subsidiaries;• Directly implement the policy for measuring, controlling and monitoring the risks incurred and report back to the Group General Management Committee on any changes to the appraisal criteria in each risk category at the levels of the Group, BMCE Bank S.A. and its direct and indirect subsidiaries;• Oversee the system for ensuring adequate internal capital levels in light of the risk aversion profile of the Group, BMCE Bank S.A. and its direct and indirect subsidiaries;• Monitor, on a regular basis, the quality of the risk steering policy implemented within the Group, BMCE Bank S.A. and its direct and indirect subsidiaries.

CHAIRMAN• Group Executive Managing Director
STANDING MEMBERS• Delegate General Manager, responsible for Group Finance• Delegate General Manager, responsible for Corporate Banking, Morocco• Delegate General Manager, responsible for Retail Banking, Morocco• Delegate General Manager, responsible for International Coordination• Chairman of BMCE Capital’s Executive Board• Adviser to General Management• Head of Group Risks• Head of Finance & Investments
COMMITTEE SECRETARY• Finance & Investments
ASSOCIATE MEMBERS• Head of Group ALM• Heads of Group subsidiaries or their appointed proxies, depending on the items for discussion on the agenda• Any person, at the Committee’s discretion, depending on the items for discussion on the agenda
The Group ALM Committee is the body responsible for drawing up and implementing the Group’s as-set-liability management strategy in line with the strategy determined by the Board of Directors. In this regard, its responsibility is to:
• Draw up and implement ALM strategy, enabling BMCE Bank Group to meet its obligations on a per-manent basis in line with the strategy determined by the Board of Directors (return on equity, risk appetite etc.);
• Ensure that a uniform and efficient system exists and is implemented, for identifying, measuring, controlling and mitigating ALM risks at Group level, while implementing best practices (sharing best practices among subsidiaries). In this regard, it approves asset-liability management procedures.
• Examine, on a frequent basis, the Group’s risk pro-file in respect of internal as well as statutory limits or those established by stakeholders (interest rate and liquidity risks as well as foreign currency risk resulting from exposure to instruments denomi-nated in major foreign currencies and in dirhams);
• Ensure that subsidiaries’ profits are protected against exchange rate fluctuations;
• Monitor transfer pricing within the Group in rela-tion to lending/borrowing operations;
• Examine the impact on the Group’s short-, medium- or long-term financial position from launching new products or business activities that carry interest rate or liquidity risks (such as com-pliance with current limits);
• Establish a course of action and priorities in all matters relating to liquidity, in the various curren-cies, while ensuring the efficiency of the Group’s Liquidity Contingency Plan in the event of a liqui-dity problem;
• Examine, on a frequent basis, the results of stress tests conducted using hypothetical scenarios and incorporating internal as well as external factors;
• Update, on a regular basis, the assumptions incorporated within the system for measuring balance sheet risks (such as run-off assumptions, interest rate forecasts etc.) and ensure that they are back-tested;
• Analyse the impact from macro-economic, regula-tory and legislative changes on the Group.
WORK OF THE GROUP ALM COMMITTEE IN 2016
In 2016, the ALM Committee met on 3 occasions. The main decisions and recom-mendations involved designing the Bank’s Strategic Development Plan, the additio-nal overall refinancing needs, foreign currency-denominated refinancing facilities and amendments to the pricing structure for term deposits.
In addition, with a view to deploying the current ALM system at the subsidiary level, it was presented and reviewed at the Convergence Programme steering meeting at-tended by Independent Directors.
Quarterly, or whenever neces-sary
COMPOSITION MEETINGS RESPONSIBILITIES
GROUP ALM COMMITTEE
BMCE BANK AND ITS GOVERNANCE
BMCE BANK OF AFRICAOur World is Capital
PAGE
112/
113

2000 Banco Espirito Santo 400 113 2.52% 6702001 Commerzbank 800 000 5.04% 450
Union Bancaire Privée 184 200 1.16% 4252002 FinanceCom 652 210 4.11% 420
Interfina 489 914 3.09% At various prices2003 FinanceCom 800 107 5.04% 400
Share buyback programme 795 238 5.01% 400Public offer of sale reserved for Group employees 750 000 4.72% 400Al Wataniya 250 000 1.57% 400
2004 FinanceCom 792 169 4.99% 400Crédit Industriel et Commercial 1 587 514 10.00% 500Morgan Stanley 476 000 3.00% 445
2005 Public offer of sale reserved for Group employees 530 129 3.34% 5252006 Share buyback programme 448 142 2.82% At various prices
BES / FUNDO PENSOES 400 402 2.52% 9852007 Caja de Ahorros del Mediterraneo 793 757 5.00% 1869.15
Share buyback programme 327 670 2.06% 27502008 CIC 800 000 5.04% 3000
BFCM 23 875 040 15.04% 270Share buyback programme - 3.11% At various prices
2009 BFCM 7 778 762 4.90% 290Share buyback programme 5 564 981 3.05% At various prices
2010 CDG 12 700 111 8.00% 2672010 Groupe Crédit Mutuel-CIC 10 712 000 5.00% 2352010 Group employees 2 500 000 1.64% 2002011 FinanceCom 7 937 500 4.62% 2002012 BES VIDA COMPAHNIA DE SEGUROS SA 4 401 240 2.56% 1922012 BFCM 2 300 000 1.34% 2002012 Increase in share capital reserved for RMAWatanya,
Financecom, CIMR, CDG, MAMDA/MCMA, BES, BFCM 7 500 000 4.36% 2002013 CDG 2 691 957 1.57% 2002014 CDG 897 317 0.50% 2002015 CDG 1 951 456 1% At various prices
2001 Nomura 323 597 2.24% 4002002 Interfina 652 210 4.11% 4202003 Commerzbank 1 595 345 10.05% 400
Interfina 750 000 4.72% 4002004 Commerzbank 792 169 4.99% 400
FinanceCom 1 587 514 10.00% 5002005 Share buyback programme 664 507 4.19% At various prices
Group employees 356 266 2.24% At various prices2006 Group employees 367 093 2.31% At various prices
Union Bancaire Privée 132 765 0.84% At various pricesBanco Espirito Santo 400 402 2.52% 985
2007 Share buyback programme 793 757 5.00% 1869.15Group employees 327 670 2.06% 2750CIMR 115 205 0.73% At various prices
2008 CIC 23 875 040 15.04% 270Group employees - 1.98% At various prices
2009 Share buyback programme 6 350 000 4.00% 290RMA WATANYA 1 428 762 0.90% 290
2010 Share buyback programme 12 589 826 7.93% 2672011 Caja de Ahorros del Mediterraneo 7 937 500 4.62% 2002012 Banco Espirito Santo 397 220 0.23% 1922012 BES / FUNDO PENSOES 4 004 020 2.33% 1922012 FinanceCom 2 300 000 1.34% 2002013 FinanceCom 2 691 957 1.57% 2002014 FinanceCom 897 317 0.50% 200
ACQUISITION OF EQUITY HOLDINGS % of share Purchase priceYear Shareholder Number of shares capital per share (MAD)
DISPOSAL OF EQUITY HOLDINGS Sales priceYear Shareholder Number of shares % of share capital per share (MAD)
CHANGES IN SHARE OWNERSHIP
1992 Bonus issue 750 000 000 750 000 75 000 000 825 000 000 100 NA1992 Cash subscription 825 000 000 1 750 000 175 000 000 1 000 000 000 100 200.001996 Bonus issue 1 000 000 000 2 857 142 285 714 200 1 285 714 200 100 NA1996 Issue reserved for foreign institutional investors 1 285 714 200 1 369 394 136 939 400 1 422 653 600 100 330.001996 Issue reserved for foreign institutional investors 1 422 653 600 205 409 20 540 900 1 443 194 500 100 330.002000 Bonus issue 1 443 194 500 1 443 194 144 319 400 1 587 513 900 100 NA2008 Stock split 1 587 513 900 158 751 390 -1 587 513 900 1-for-10 NA split2010 Share capital increase reserved for BFCM 1 587 513 900 10 712 000 107 120 000 1 694 633 900 10 235.002010 Share capital increase reserved for Group employees 1 694 633 900 2 500 000 25 000 000 1 719 633 900 10 200.002012 Share capital increase reserved for cornerstone shareholders 1 719 633 900 7 500 000 75 000 000 1 794 633 900 10 200.00
CHANGES IN SHARE CAPITAL
BMCE Bank SharesBMCE Bank Shares
Share capital before transaction (MAD)
Numberof shares issued
Increase in value (MAD)
Share capital af-ter transaction
(MAD)
Net value(MAD)
Issue price (MAD)
Type of transaction
BMCE BANk AND ITS SHAREHOlDERSBMCE BANk AND ITS SHAREHOlDERS

PAGE
114/
115
BMCE Bank’s Share Price Performance
In 2016, BMCE Bank’s share price rose by +4.21% to 223 DH while the Banks sector index increased by +18.51% to 13,309.44 points.
The MASI and MADEX indices gained +30.46% to 11,644.22 points and +31.59% to 9,547.25 points respectively.
BMCE BANKMASIMADEXBANKS SECTOR INDEX
140
130
115
100
9031/12/2015 29/02/2016 30/04/2016 30/06/2016 31/08/2016 31/10/2016 31/12/2016
2016 2015
Closing price 223 DH 214 DH
Market capitalisation 38.4 Mrd DH 38.4 Mrd DH
High 230 DH 240 DH
Low 200 DH 210 DH
Weighted average price 214 DH 220 DH
Share price performance 4.21% -2.7%
P/E 19.7 19.6
Dividend yield 2.24% 2.26%
COMPARATIVE PERFORMANCE IN 2016
MADEXMASIBMCE BANK
BMCE BANK’S SHARE PRICE PERFORMANCE IN 2016 LIQUIDITY VOLATILITY
BANKS SECTOR INDEX
+4.21% +30.46% +31.59% +18.51%
DIVIDEND PER SHARE
2012 2013 2016
3.3
5
2015
5
4
2014
4.4
MAIN SHARE PRICE INDICATORS
6 MONTHS 5.8% 22.7%1 YEAR 4.7% 21.9%5 YEARS 6.0% 21.2%
BMCE
BANK
OF
AFRICA

GDR PROGRAMME In 1996, BMCE Bank increased its share ca-pital via a USD 60 million issue of global de-positary receipts (GDRs) listed on the Lon-don Stock Exchange. The aim, which was to open up part of BCME Bank’s share capital to foreign shareholders, resulted in the Bank acquiring a more solid financial base com-pared to other emerging market banks.
High** Low ** Number of shares Amount Number of sessions
*Central Market**Highs and lows are based on the closing price
MONTHLY SHARE PRICE PERFORMANCE AND VOLUME IN 2016
GDR PROGRAMME AT 31 DECEMBER 2016
GDR Type Reg S*
Ticker BMEDNumber of shares 23 370
GDR Type 144 A**
Ticker BQMCYNumber of shares 180
(*) Reg S: GDRs which may be held by retail or corpo-rate investors domiciled outside the United States.
(**) 144A: GDRs which are reserved solely for ‘‘Quali-fied Institutional Buyers’’ (QIBs) domiciled within the United States. QIBs are institutions holding at least USD 100 million of securities for their own account. QIBs may not be retail investors.
January 214.8 210.9 144 353 30 633 374 19February 211.95 200.1 280 307 57 276 024 21March 215 200.4 283 846 59 653 622 19April 215 200 298 883 61 668 235 20May 215 206 212 280 45 029 693 21June 213 203 1 405 466 292 328 096 20July 214 202.5 663 282 139 284 075 14August 213.7 202 55 202 11 354 379 21September 209 204 70 620 14 548 284 19October 212 205.4 219 203 45 767 946 18November 213 207 103 864 21 603 613 21December 230 208.5 3 810 283 838 152 070 20
BMCE BANK AND ITS SHAREHOLDERS

PAGE
116/
117
Shareholders’ Rights
The shareholder, as the owner of an equity security, is entitled to a number of rights such as a right of access to information, a right to contribute to the smooth running of the company by participating in collective decision-making and an entitlement to earnings.
BMCE Bank’s shares are listed on the Casablanca Stock Exchange. Each share has a nominal value of ten (10) dirhams.
Right to information
BMCE Bank complies strictly with all requirements relating to publicity and information as prescribed by current legislation regarding communicating with shareholders, regardless of the size of shareholdings, about major corporate events and, in particular, any fresh news likely to bring about a change in the Bank’s stock price.
Shareholders have a right to access information on a permanent and temporary basis. The annual financial statements for the previous three fiscal years are avai-lable to shareholders at the Bank’s head office.
Similarly, every year, in addition to the parent com-pany financial statements, the management report and Statutory Auditors’ general and special reports, the list of Directors, the list of agreements under Articles 56 et seq. and the proposed allocation of the previous financial year’s earnings are made avai-lable at least fifteen days before the Annual General Meeting.
Furthermore, for an uninterrupted period beginning no later than the 21st day preceding the AGM, the Bank shall make available to its shareholders, on its website, the information and documents listed in Ar-ticle 121(ii) relating to limited companies as amended and completed.
In addition, the fact that BMCE Bank is a public li-mited company, the Board of Directors’ Management Report must highlight the value and appropriateness of investments made by the Bank and their fore-seeable impact on its development. It must also make mention, where appropriate, of the risks inherent in the said investments; it must indicate and assess risks and events known to the company’s Management or the Board of Directors which are likely to exert a positive or negative influence on the Bank’s financial position.
Lastly, the Bank’s shareholders may ask questions of the management during a General Meeting or submit written questions beforehand to the Board of Directors.
Voting rights
Each of the Bank’s shareholders is entitled to parti-cipate in collective decision-making either in person or via an authorised proxy, another shareholder, an ascendant or descendant, spouse or any legal entity involved in portfolio management.
At a General Meeting, the principle of one vote per ordinary share held applies.Voting rights are exercised at least once a year at the Ordinary General Meeting, convened to rule on the financial statements for the financial year in question.One or more shareholders representing at least 5% of the share capital has/have the right to request inclu-sion of one or more draft resolutions on the agenda of the said Meetings.
Dividend entitlement
Each shareholder is entitled to the distribution of pro-fits generated by the Bank in the form of a dividend, provided that distributable profits have been made and that their distribution has been approved by the Annual General Meeting.
Distributable profit is composed of the net income for the period less previous losses as well as amounts posted to reserves plus retained profits brought forward from previous periods.
BMCE
BANK
OF
AFRICA

INVESTOR RELATIONS
In 2016, BMCE Bank organised a number of major events for the global investor community – investment funds, banks and insurance companies both etc. – in Morocco and overseas, as well as participating in one-one-one meetings at the 6th EFG Hermes London MENA & Frontier Confe-rence, the Credit & Equities Emerging Markets Conference in London and the Third One-on-One Equity Conference in Marrakesh.
Relations were also bolstered with the Bank’s rating agencies – Moody’s and Fitch for the soli-cited rating and Capital Intelligence for the unso-licited PI rating – by reviewing the rating reports issued on the Bank as well as those published by the said agencies on the Moroccan and African banking sector.
In addition, BMCE Bank prepared information packs for the MAD 2 billion subordinated bond issue in June 2016 and the MAD 500 million Green Bond issue in November 2016.
In 2016, media relations and public opinion were reinforced by developing and maintaining an extensive network of partners that wrote articles, briefings and news about the Bank, producing content (presentations, articles, press releases and press kits), meetings and participating in
events as well as developing internal communica-tions materials.
Other initiatives undertaken to highlight the Bank’s solid fundamentals and its reputation for being accessible such as developing a system for monitoring media relations and public opinion, including the domestic and overseas media’s perception of the Group, press reaction and the Group’s strategic deals, as well as organising conferences to present BMCE Bank’s financial results and engage with the financial community and the media, for which appropriate materials such as a press kit need to be prepared.
BMCE Bank emphasises the importance of publications for internal as well as external use, in particular, the annual report, the abridged report, the media presentation, the institutional pre-sentation and that of Bank Of Africa, the banks sector presentation and the sustainable finance brochure, published in French and English, for the COP22 event.
DESCRIPTION Financial year Parent income Morocco income % change 2016 (MAD millions) % % 15/16
2016
Morocco income 999 +19.44%
Parent income 1 325 +1.6%
Total dividends 897.3 67.72% 89.82%
Dividend per share 5 DH
2015
Morocco income 836.4 -13.3%
Parent income 1 304 +8.4%
Total dividends 897.3 68.81% 107%
Dividend per share 5 DH
2014
Morocco income 965.1 +14.5%
Parent income 1 203 +8.5%
Total dividends 789.6 65.6% 81,8%
Dividend per share 4.4 DH
BMCE BANK AND ITS SHAREHOLDERS

PAGE
118/
119
BMCE Bank’s rating
Moody’s, February 2017
BANK DEPOSITS IN DIRHAMS: BA1/NPFOREIGN CURRENCY BANK DEPO-SITS: BA2/NPFINANCIAL STRENGTH: D OUTLOOK: STABLE
Fitch Ratings August 2016
LONG-TERM FOREIGN CURREN-CY DEPOSITS: BB+SHORT-TERM FOREIGN CURREN-CY DEPOSITS: BLONG-TERM LOCAL CURRENCY DEPOSITS: BBB-SHORT-TERM LOCAL CURRENCY DEPOSITS: F3VIABILITY RATING: B+OUTLOOK: STABLE
Capital Intelligence August 2016
SHORT-TERM FOREIGN CURREN-CY DEPOSITS: A3LONG-TERM FOREIGN CURREN-CY DEPOSITS: BBB-FINANCIAL STRENGTH RATING: BBB-SUPPORT RATING: 2OUTLOOK: STABLE
BMCE
BANK
OF
AFRICA

MARCH 2017
MAY 2017
JULY 2017
JUNE 2017
Abridged Annual Report 2016 published in Arabic, Tamazight, French, English and Spanish
Board of Directors’ meetingInterim results published for the half-year ended 30 June 2017 – press release, summary parent and consolidated financial statements and notes to the financial statementsMeeting with analysts and media to present BMCE Bank’s performance for the half year ended 30 June 2017
Publication of the Annual Report and CSR Report 2016 in Arabic
Board of Directors’ meetingQuarterly results published for the quarter ended 30 September 2017
AUGUST 2017
SEPTEMBER 2017
OCTOBER 2017
NOVEMBER 2017
Financial Communications Agenda 2017
Board of Directors’ meeting Annual results published for the year ended 31 December 2016 – press release, summary parent and consolidated financial statements and notes to the financial statementsMeeting with analysts and media to present BMCE Bank’s performance for the year ended 31 December 2016
Annual General Meeting held 23 May 2017Board of Directors meetingQuarterly results published for the quarter ended 31 March 2017
Annual Report and Sustainable Development Report 2016 published in English
Annual Report and Sustainable Development Report 2016 published in French
BMCE BANK AND ITS SHAREHOLDERS

BMCE BANK OF AFRICAOur World is Capital
PAGE
120/
121

Risk Management Organisation
BMCE Bank of Africa Group’s Internal Control system consists of a permanent control system and an ad hoc control system. The reasons for it being so effective are due to the fact that its stakeholders’ responsibilities are distinct and separate yet comple-mentary and well-coordinated, its reference manuals and systems are customised and its governance and management bodies have clearly defined remits.
GOVERNANCE & MANAGEMENT BODIES
Group Risks Committee
BMCE Bank Group’s Risk Committee is a body reporting directly to the Board of Directors whose remit extends to the Bank, its direct and indirect subsidiaries and other entities included within the Group’s scope of consolidation. The Group Risks Committee assists the Board of Di-rectors in matters such as strategy and risk manage-ment. In particular, it ensures that overall risk policy is adapted to the risk profile of both the Bank and the Group, the degree of risk aversion, its systemic importance, its size and its capital base.
Audit and Internal Control Committee
The Group Audit and Internal Control Committee (Group CACI) is a body reporting directly to the Board of Directors whose remit extends to the Bank, its subsidiaries and other entities included within the Group’s scope of consolidation.
The CACI assists the Board of Directors in matters such as internal control, corporate strategy and risk management while ensuring that:n The internal control system and resources are:
- Consistent and compatible to be able to monitor and control risk within the Bank and produce information required by regulatory authorities; - Adapted to the Bank’s organisational structure as well as the activities of entities under the Bank’s control;- The financial information intended for the Board of Directors is reliable and accurate such that the legitimate interests of shareholders, depositors and other stakeholders are safeguarded;
n Examine the parent company financial statements prior to submitting them to the Board of Directors for approval.
General Management Committee The General Management Committee is responsible for translating and monitoring the Group’s corporate strategy into operational initiatives and measures.
This Committee, which meets weekly, is also res-ponsible for steering the Bank’s business, managing its internal control and risk management systems, monitoring HR and overseeing commercial, institu-tional and financial communications.
Group Risk Steering and Management Committee The Group Risk Steering and Management Com-mittee is a sub-committee of BMCE Bank of Africa Group’s General Management Committee. It helps the latter manage and monitor, at the operational level:
n Group risk steering policy;n And ensures that the Group’s activities comply with risk policies and the limits set.This Committee ensures that BMCE Bank Group’s risk steering policy is effective and consistent with risk management policy relating to credit, market, country and operational risks.
Group ALM Committee
The Group ALM Committee is the body responsible for drawing up and implementing the Group’s asset-liability management strategy in line with that approved by the Board of Directors. Its main responsibilities are to:n Draw up an asset-liability management strategy; n Organise and oversee asset-liability sub-com-mittees;n Have a comprehensive understanding of the types of risk inherent in the Bank’s activities and remain informed of any changes to these risks as a function of trends in financial markets, risk management practices and the Bank’s activities;n Review and approve the procedures for control-ling the risks inherent in the Bank’s activities in terms of approving loans, investments, trading and other significant activities and products;n Oversee the reporting systems which measure and control the main sources of risk on a daily basis;n Review and approve the risk limits on a frequent basis as a function of any potential change to the institution’s strategy, approve new products and react to any major changes in market conditions.

PAGE
122/
123
Group Internal Control Coordination Committee
The Group Internal Control Coordination Com-mittee is the body responsible for monitoring effective and operational implementation of control systems at Group level. In this respect, it is tasked with coordinating action regarding the Group Inter-nal Control system and ensuring that it is consistent and effective.
Credit Committees
n Senior Credit Committee This committee is chaired by the Bank’s Chair-man and Chief Executive Officer with the Group Executive Managing Director as Vice-Chairman. It is sub-divided by market segment into two com-mittees, one specialising in Corporate Banking, the other in Personal and Professional Banking.
These committees meet twice-weekly and include senior managers of the Bank.
n Regional Credit Committee The Regional Credit Committee meets on a weekly basis. The dates for holding RCCs are decided by each region’s Regional Director and notices are sent to all members.
Committee for Monitoring Accounts Showing Anomalies
As part of its portfolio monitoring remit, the Com-mittee for Monitoring Accounts Showing Anomalies – main committee or select committee - meets on a monthly basis to monitor the rehabilitation of high-risk accounts.
ORGANISATIONAL STRUCTURE FOR MANA-GING CREDIT, MARKET, COUNTRY AND OPE-RATIONAL RISKS
Group Risks Division
The Group Risks Division ensures that credit, market and operational risks are monitored and controlled. The Division is responsible for:
n Defining BMCE Bank Group’s risk policy; n Implementing a risk control system relating to credit, market and operational risks;n Defining and managing the credit approval and monitoring processes.
The Group Risks Division comprises six units:n Group Risk Management Divisionn Commitments Monitoringn Commitments Analysisn Group Risk Convergence n Group Risk Consolidation & Steeringn Group Risk Projects Steering
BMCE
BANK
OF
AFRICA
CREDIT RISK
The Bank’s credit division operates in accordance with the general credit policy approved by the Group’s senior management. The Group’s require-ments in terms of ethics, reporting lines, compliance with procedures and discipline in risk analysis are guiding principles.
This general policy is further divided into specific policies and procedures depending on the character of specific operations or counterparties.
Decision-making procedure
BMCE Bank has adopted a dual approach to the credit approval process as follows: 1- A standardised approach for retail products within the framework of Product Programs which define, for each product, risk management rules governing product marketing. Risk policy may be implemented in two ways:n Use of a self-check form with formatted approval criteria as the basis of risk assessment; this self-check form lists credit approval criteria and checks compliance with credit standards. A credit appli-cation must be rejected if it does not comply with these standards unless exemption has been granted by the Committee. n A delegation system by which credit approval decisions are delegated to different levels of power. This ensures consistency in credit decision-ma-king and a high level of integrity from the person to whom powers have been delegated. Each credit application is processed by subordinate entities prior to its approval by the duly responsible decision-ma-king entity. 2- An individualised approach based on the particu-lar characteristics and requirements of corporates based on three fundamental principles:n Management of the loan portfolio which provides Senior Management with enough information to be able to assess the customer’s risk profile;n The delegation of authority to employees, assigned intuitu personae on the basis of their decision-making ability, experience, personal skills, professional skills and training;n The balance of powers, granted on the judgement of at least three people known as a ‘troïka’.For certain risk levels, approval must be sought from the Senior Credit Committee or the Bank’s Chair-man.
The Group Risks Division monitors risk manage-ment quality and ensures compliance with internal rules and procedures.
It is also worth noting that Group General Control and the external auditors provide additional objec-tive control of credit quality and ensure that proce-dures are complied with.
System for monitoring and steering credit risks
The system for monitoring and steering credit risks provides second level control. It operates inde-pendently of monitoring carried out by sales units on a daily basis.
The system may be adapted to the specific character of each subsidiary in concertation with the Group Risks Division.
Responsibility for risk monitoring is entirely incu-mbent on sales units. Daily monitoring of transac-tion-related risks is the responsibility of the sales person in charge of the customer relationship. To help sales units fulfil their responsibilities, they are assisted by the Group Risks Division which provides alerts.
The controls carried out by the Group Risks Division are primarily aimed at ensuring that the advanced alert system is effective both in terms of risk ma-nagement and sales units anticipating the potential risks so that the Bank’s loan portfolio is managed appropriately.
The main operational responsibilities of the Group Risks Division, as part of its remit for monitoring and steering credit risks, may be summarised as follows:n Monitor commitments’ regularity: compliance with the initially-stated purpose of the loan and with credit limits, examining payment incidents, reviewing customer files for which payments are due etc.n Detect loans showing persistent signs of weakness;n Monitor, in partnership with the branch network, developments in relation to the Bank’s main risks (problem loans, largest or most sensitive commit-ments);n Determine which customer files are eligible for downgrade as required by regulations governing non-performing loans.n Monitor on a permanent basis credit risk indi-cators including healthy loans, troubled loans and non-performing loan mentioning provisioning, non-performing loan ratios and hedging ratios.
RISK MANAGEMENT ORGANISATION

Steering the loan portfolio
The loan portfolio of the Group and its entities is steered using a number of indicators of risk resulting when credit approval is given as well as those arising during the life of the loan.
Multi-criteria analysis of the loan portfolio is a way of controlling risks retrospectively. This consists of identifying and tracking all loan commitments of the Group and its entities based on a number of criteria such as products, maturities, customers, business groups, customer segments, counterparty ratings, asset categories (healthy and non-performing), business sectors, agencies, geographical areas, types of security etc. Multi-criteria analysis is a credit risk management tool.
The Credit Risks unit is responsible for carrying out multi-criteria analysis of the loan portfolio. It is also responsible for reporting on credit risks, both within the Group to the Risk Committees and to senior management, and externally, to regulators.
Monitoring high-risk accounts
High-risk accounts relate to those for which the risk is likely to subsequently increase, thereby resulting in a cost to the Bank. They consist of commitments which show either a visible deterioration in risk quality as measured against quantitative criteria or a potential deterioration in risk quality as measured against qualitative criteria. Assessment, intervention and the complementary nature of the Commercial and Risks Divisions remain the determining factors for identifying high-risk accounts.
Loan classification
On carrying out the monthly review of the Bank’s portfolio and analysis of high-risk accounts, each subsidiary reviews its regulatory loan classification as required by local regulatory requirements.
This review is finalised by the committees res-ponsible for monitoring high-risk accounts on the recommendation of each entity’s Risks Division. The latter is also responsible for implementing these decisions by monitoring and transferring these ac-counts from the “healthy” to the “non-performing, requires provisioning” category.
Provisioning is checked and monitored by Group General Control, the external auditors, the Audit and Internal Control Committee and the Group Risks Committee.
INTERNAL RATINGS SYSTEM
The Bank has an internal ratings system covering the entire BMCE Bank Group, including local subsidia-ries.
This system is operationally embedded in the Bank’s various business lines and subsidiaries e.g. the system is used for delegating, pricing and sales and marketing targeting as well as simplifying the credit approval decision-making process. A rating is attributed to each customer, such that a third party has one and only one rating.
In compliance with regulatory principles, ratings attributions and their subsequent revisions must be carried out or approved by a party which does not directly benefit from the approval of the loan.
PAGE
124/
125
BMCE
BANK
OF
AFRICA

DESCRIPTION OF THE CHARACTERISTICS OF THE INTERNAL RATINGS MATRIX BY RISK CATEGORY
Inve
stm
ent
gra
de Limited risk
1 Extremely stable short- and medium-term; very stable long-term; solvent despite serious disruptions;
2 Very stable short- and medium- term; stable long-term; sufficiently solvent despite persistently negative events;
3 Solvent short- and medium-term despite significant difficulties; mode-rately negative developments can be withstood long-term;
4Very stable short-term; no expected change to threaten the loan in the coming year; sufficiently solid medium-term to be able to survive; long-term outlook still uncertain;
Medium risk5
Stable short-term; no expected change to threaten the loan in the coming year; can only withstand small negative developments me-dium-term;
6 Ability limited to withstand unexpected negative developments;7 Ability very limited to withstand unexpected negative developments;
Sub
-in
vest
men
t g
rad
e
High risk
8Ability limited to repay interest and principal on time; any change in internal and external economic and commercial conditions will make it difficult to fulfil obligations;
9Incapable of repaying interest and principal on time; fulfilling obligations dependent on favourable internal and external commercial and economic conditions;
Very high risk 10 Very high risk of default; incapable of repaying interest and principal on time; partial default in repayment of interest and capital;
11 Total default in repayment of interest and capital.
1
0.03%
24.67%
4.80%
11.00%9.72%
17.17%
13.30%
10.41%
0.35% 1.15%
5.36%
5 8 102 6 9 113 74
BREAKDOWN OF COMMITMENTS BY RISK CATEGORY AT 31 DECEMBER 2016
Limited risk Dec 2016 (40.50%)
Medium risk Dec 2016 (40.20%)
High risk Dec 2016 (10.76%)
Very high riskDec 2016 (6.51%)
DEFINITIONCLASSCATEGORY
RISK MANAGEMENT ORGANISATION

PAGE
126/
127
RATING RETAIL CUSTOMERS
Rating retail customers consists of statistically mo-delling retail customers in default as well as their risk behaviour.
Behavioural score matrices for salaried and professio-nal customers are displayed in the Customer Rela-tionship Management (CRM) system with additional remarks provided. They are updated on a daily basis. Behavioural ratings have also been developed for Moroccans living abroad.
Guarantees and Securities
The Group receives various types of guarantee as loan collateral. As a general rule, collateral requirements are governed by two factors: the type of credit requested and the quality of the counterparty.
The Group systematically mortgages all property which it has financed - housing loans and loans for property development - and requests that customers take out insurance cover. Similarly, funding for public procurement of goods, capital equipment and business premises are systema-tically guaranteed by pledges on the items funded and insurance cover is also required.
In addition to these guarantees, the Group general-ly strengthens its position by requesting personal guarantees from counterparties whenever it is deemed necessary, depending on the quality of the latter.
Concentration limits
The Bank’s risk policy is constantly focused on loan portfolio diversification.
Credit risk management is based on a system in which a risk opinion and formal risk limits are attributed to strategic initiatives at the business line level, such as in the event of a new business or product launch. For BMCE Bank of Africa Group, the risk of credit risk concentration may result from exposure to individual counterparties, interest groups or counterparties belon-ging to the same business sector.
INDIVIDUAL COUNTERPARTIES
The Group monitors individual concentrations at the parent and consolidated levels on a monthly basis. It closely monitors the commitments of its largest 10, 20 and 100 customers by commitment.
INTEREST GROUPS
Portfolio diversification by counterparty is monitored on a regular basis, particularly within the framework of the Group’s individual concentration policies. Credit risk exposure to counterparties or groups of counter-parties with relatively sizeable loans, of more than 5% of the Bank’s capital, are specifically monitored, both on an individual and consolidated basis.
Furthermore, controlling major risks also ensures that the aggregate risk incurred for each beneficiary does not exceed 20% of the Group’s net consolidated capital, as required by Moroccan banking industry regulations. BMCE Bank of Africa Group ensures that it complies with the concentration thresholds stipulated in the Bank Al-Maghrib directive.
Counterparties belonging to the same bu-siness sector
The chosen methodology for setting sector limits is based on a statistical model which includes historical default rates and the number of counterparties by business sector and by risk category -rating.
The objective is to model the probability of default by using appropriate econometric techniques and a de-pendent random variable whose value is derived from the number of default occurrences.
The model also enables the Bank to identify priority sectors for credit expansion in the context of the Bank’s development plan as well as bad loan expe-rience by sector. This approach, adopted by the Group Risks Division, is complemented by back-testing the model every six months.
Sector-specific limits are reviewed every six months in consultation with sales units and the Bank’s Econo-mic Intelligence Centre which provide operational experience as well as estimates of macroeconomic and industry growth. The opinions of these entities help to challenge and provide further confirmation of the model’s suitability in a given economic context.
BMCE
BANK
OF
AFRICA

The Victoria Falls on the Zambezi River cascading into the First Gorge, Zambia
RISK MANAGEMENT ORGANISATION

PAGE
128/
129
BREAKDOWN OF THE GROUP’S OUTSTAN-DING CUSTOMER COMMITMENTS (DOMES-TIC ACTIVITY) BY BUSINESS SECTOR AT 31 DECEMBER 2016:
Stress tests
BMCE Bank of Africa Group conducts half-yearly stress tests so as to evaluate the vulnerability of its loan portfolio in the event of a change in circums-tances or deterioration in the quality of counterpar-ties.
Stress tests are conducted in order to assess the Group’s resilience in the face of unexpected, extreme events. Operationally, they consist of simulating sce-narios in the event of default of a certain percentage of the Group’s counterparties. The ultimate aim is to quantify the impact on provisioning and, as a result, on profitability and on the Group’s consolidated Tier 1 capital.
An assessment is conducted twice a year to ensure that the various scenarios chosen are appropriate. This assessment is conducted on the basis of anti-cipated goals for carrying out stress tests and each time that market conditions suggest that a potentially unfavourable change is likely to seriously impact the Group’s ability to withstand it.
LEVEL OF EXPOSURE TO COUNTERPARTY RISK BASED ON METHODS APPLIED TO OFF-BALANCE SHEET ITEMS
n Financial activitiesn Real estate developmentn Retail, auto repairs and
domestic itemsn Production and
distribution of electricity, gas and water
n Transportation and telecommunications
n Agribusiness and tobacco industry
n Construction and public works
n Metallurgical, mechanical, electrical and electronic industries
n Hotels and restaurants
n Textile, clothing and leather industries
n Chemical and specialty chemical industries
n Miscellaneous manufacturing industries
n Mining industriesn Agriculture, hunting and
forestryn Public sector
administrationn Fisheries, Aquaculturen Othersn Retail
11.63%
9.33%
11.89%
3.64%
3.98%2.37%
1.50%4.05%
1.17%0.89%
1.36%6.02%
0.03%0.67%0.29%0.12%
9.66%
31.40%
Type of Exposure Risk-Weighted Assets post CRA Balance-sheet items 150 279 904Off balance sheet items: financing commitments 5 806 937Off balance sheet items: guarantee commitments 11 376 010Counterparty Risk: temporary disposals of securities relating to the bank portfolio -Counterparty Risk:temporary disposals of securities relating to the trading portfolio 474 191Counterparty Risk: derivative products relating to the bank portfolio -Counterparty Risk: derivative products relating to the trading portfolio 364 867Other assets / Other items 26 648 802Settlement Risk 293 170Total 195 243 881
CREDIT RISK-WEIGHTED ASSETS
BMCE
BANK
OF
AFRICA

MARKET RISK
Market risk management at BMCE Bank Group adheres to regulatory standards as defined by super-visory authorities in application of best international management practices as defined by the Basel Accords.
Types of market risk
The Bank differentiates between four types of market risk: n Interest rate risk; n Equity risk;n Foreign currency risk;n Commodities risk; And three types of credit risk for market transactions: n Issuer risk; n Counterparty risk;n Settlement risk.
Financial instruments mapping
The following table shows products traded as part of BMCE Bank Group’s trading portfolio, mapped by risk factor:
GOVERNANCE
The main contributors to BMCE Bank of Africa Group’s market risk management policy are as follows:
n General Management, which implements market risk management strategies and policies approved by the Board of Directors;
n The Group Risks Committee, which defines Group market risk management policy and approves any change in steering risks in market operations imple-mented by any of the Group’s entities;
n The Group Market Risks Committee, which ensures that the system for monitoring BMCE Bank of Africa Group’s market risks is effective and consistent with policy for managing the Group’s market risks;
n The Group Market Risks Department which, as a separate department from the Group’s front-office, centralises management of BMCE Bank of Africa Group’s market risk; this gives it maximum objectivity in steering market risks and in arbitrating between the different market activities;
n The Risk management units of BMCE Bank of Africa Group entities which ensure first level control of market activities within their own entities and report back to Group Risk Management;
n Internal Audit, which ensures implementation of market risk management policy and rigorous com-pliance with procedures.
Market risk management system
BMCE Bank Group’s market risk management system is based on three main factors:n Management of limits; n Risk indicators; n Capital requirements.
Foreign exchange products
Change cashFX spot FX forwardsFX derivativesFX swaps
Equity productsEquitiesEquity/index derivativesEquity mutual funds
Fixed income products
I- Corporate and interbank loans/borrowings • Fixed rate (MAD and foreign currencies)• Floating rate (MAD and foreign currencies)II- Negotiable debt securities and other debt securitiesII-1 Sovereign securities• Fixed rate (MAD)• Floating rate (MAD and foreign currencies)II-2 Securities issued by credit institutions and companies• Fixed rate (MAD)• Floating rate (MAD and foreign currencies)III- Stock lending/borrowing• Stock lending/borrowing• Repos/Reverse reposIV- Interest rate derivatives • Interest rate swaps • Swap futures • Forward Rate AgreementV- Fixed income mutual funds • Money market mutual funds• Bond mutual funds
Commodity derivatives and credit derivatives
Commodity futuresCommodity futures and optionsCredit default swaps (CDS)Credit linked notes (CLN)
RISK MANAGEMENT ORGANISATION

PAGE
130/
131
MANAGEMENT OF LIMITS
Counterparty limits in market transactions
The approval process for counterparty limits and appli-cations to overrun those limits in market transactions is governed within BMCE Bank Group of Africa via a system of delegation of powers within a framework of procedures specific to each counterparty type. Monitoring authorised counterparty limits and overruns is carried out individually by the risk management unit within each BMCE Bank Group entity on a daily basis as well as overall by the risk management entity res-ponsible for monitoring and consolidating the Group’s exposure in market transactions.
Market limits
In order to control market risk within BMCE Bank Group of Africa and to diversify the trading portfolio, a set of market limits has been jointly adopted by Group Risk Management and each entity’s risk management unit. These market limits reflect BMCE Bank Group’s risk profile and help to steer market risk management by arbitrating between its various market activities.
The market limits adopted by BMCE Bank are based on a VaR approach and comprise the following:
n Stop-loss limitsn Position limits n Overall VaR limits n Capital requirement limitsn Transaction limits
Regulatory limits
In addition to limits adopted for internal purposes, BMCE Bank Group of Africa also complies with regula-tory limits defined by Bank Al-Maghrib including: n Limits on foreign currency positions which should not exceed 10% of shareholders’ equity; n Limits on the overall foreign exchange position which should not exceed 20% of shareholders’ equity.
MONITORING MARKET RISK INDICATORS
Value-at-Risk (VaR)-
Value-at-Risk is a technique used to quantify overall market risk. It helps to quantify the risk incurred by calculating the potential loss over a given time horizon and the degree of probability. Unlike traditional risk indicators, Value-at-Risk combines several risk factors and measures their interaction, thereby taking into consideration portfolio diversification.
BMCE Bank Group of Africa uses software to calculate overall Value-at-Risk and VaR by asset class on a daily basis as well as carrying out daily back-testing for a number of methods.
Stress-testing by risk factor
A series of stress tests are conducted on a daily basis for each of the trading portfolio’s activities. These stress tests replicate the impact of an extreme situation on the current portfolio by applying hypothetical scenarios or identifying the worst possible situations for the Bank.
The results of stress tests are used to quantify the impact on the Bank’s net banking income, capital levels, capital adequacy ratios and Tier 1 capital ratio.
Regulatory stress tests are also conducted on a half-yearly basis as stipulated in technical notice No.01-DSB-2012.
CHANGES IN VAR (1 DAY) GENERAL RISK IN 2016
Jan 16 Apr 16 Jul 16 Oct 16Feb 16 May 16 Aug 16 Nov 16Mar 16 Jun 16 Sep 16 Dec 16
BMCE
BANK
OF
AFRICA

CAPITAL REQUIREMENTS
BMCE Bank Group of Africa uses the Moody’s system to calculate capital requirements under the standardised approach for market risks. This enables it to meet regulatory requirements in terms of repor-ting and monitor capital requirements regarding the Group’s trading portfolio.
The Group’s consolidated capital requirements in respect of market risk at 31 December 2016 were as follows:
METHOD FOR VALUING TRADING PORTFOLIO SECURITIES
Dirham-denominated fixed income andmoney market instruments
Market values of fixed income and money market assets are calculated on Kondor+ using the dirham yield curve for fixed income and money market assets on the basis of the dirham rate curve publi-shed by Bank Al-Maghrib and on each transaction’s characteristics.
Money market and fixed income mutualfunds
A number of mutual funds publish net asset values on a daily basis while others are updated weekly.Mutual funds are valued on the basis of net asset value calculated on a daily or weekly basis.
Foreign currency-denominated fixed inco-me products
Foreign currency-denominated fixed income pro-ducts are valued on Kondor+ on the basis of the yield curves for the foreign currencies in question and on each transaction’s characteristics.
Foreign exchange options
Foreign exchange options are valued on the fol-lowing basis: volatility curve, yield curves (EUR, MAD and USD) and foreign exchange crosses for the three currencies.
The foreign exchange options position is included in the overall foreign exchange position using the delta equivalent method.
Overall foreign exchange position
The value of foreign exchange positions does not include the 0.2% levied by Bank Al-Maghrib on each spot trade.
Branch-based foreign exchange transactions are exe-cuted at BMCE Bank’s fixing rate (non-negotiable rate). A final statement of orders awaiting execution is transmitted to the Foreign Exchange Desk on day “N” which deals with it immediately. On “N+1” in the morning, the Middle Office receives a statement comprising possible amendments to branch network positions and updates Kondor+.
Positive Fair Value of Contracts (Guarantees)
Guarantees relating to market risks relate to “repo” agreements. The latter are securities sold under repur-chase agreements in order to raise funds.
COUNTRY RISK
In a constantly changing world and within the constraints of the Group’s overseas growth strategy and regulatory requirements, the introduction of a country risk management system will enable the Group to identify, measure and control its cross-bor-der risks.
The Country Risk unit’s adopted methodology is based on the following points:
Country risk management policy
The country risk management policy aims to define a framework for overseeing all overseas business activi-ties that generate risks for the Bank. It establishes ma-nagement standards and rules in order to harmonise regulatory requirements and in-company governance.
Country risk reporting
Monthly reporting by overseas subsidiaries and the parent company enables the Group Risks Division to assess each country’s potential risk factors and help to establish risk-mitigation strategies.
CAPITAL REQUIREMENTS
CAPITALREQUIRED
Fixed income risk 709 958Equity risk 52 431Foreign exchange risk 29 584Commodity risk 4 085Total capital required in respect of market risk 796 058
Country risk management policy
ProvisioningIdentifying country risk
assets
Stress-testing Country risk reporting
Setting limitsWeekly review
and alerts
Country risk management
process
RISK MANAGEMENT ORGANISATION

PAGE
132/
133
IDENTIFYING CROSS-BORDER RISKS
BMCE Bank Group is exposed to international risks through the various types of commitment made by the Bank to non-resident counterparties in dirhams or in foreign currencies. These include:
n Loans to non-residentsn Trade finance businessn Foreign assetsn Market operations
Breakdown of country risk exposure by geographical region:
CONSOLIDATION
Country risk commitments are identified in such a way as to establish a position for each subsidiary as well as for the Group, providing an overview of the Group’s overall exposure to cross-border risks.
Introduction of an alerts system
This system consists of monitoring regulatory, econo-mic and financial factors by tracking all the prominent events occurring during the week. These items are dis-seminated to all interested parties in a Monthly Report.
An additional module outlining country risk trends is also disseminated.
Ratings system
BMCE Bank Group bases its country risk assessments on the ratings of external agencies such as Coface, S&P and Moody’s.
Setting limits
When establishing country limits for loan commit-ments, BMCE Bank Group takes into consideration:n An assessment of an issuer’s risk profile;n Risk appetite;n The breakdown and diversification of the loan portfolio of each subsidiary and of the Group, while complying with the maximum permitted concen-tration by country based on a percentage of Tier 1 capital.
These limits are monitored on a permanent basis.
Stress tests
Des stress tests sont réalisés régulièrement afin de s’assurer de la capacité de la Banque à résister à des scénarii de dégradation extrêmes des risques pays et à en mesurer l’impact sur le bilan et sur la rentabilité de la banque et sa solvabilité.
Provisioning
A provision is recognised for country risk whenever it materialises, in the event of debt rescheduling, a political crisis or any other factor which may nega-tively impact the Bank’s profitability.
An annual review is systematically carried out to reassess the country supposedly in default, which may potentially require the Group to recognise a provision.
OPERATIONAL RISK
Operational risk management policy
The Group has adopted an operational risk manage-ment policy that aims to:
n Identify, measure and evaluate operational risks; n Control the risks and evaluate the controls; n Steer and monitor implementation of preventive and/or corrective action for major risks.
Classification
Operational risks or losses may be analysed and categorised on the basis of three factors: cause, effect - financial impact or otherwise - and event type under Basel.
OCDE11 10762%
UEMOA1639 9%
Others357020%
MENA4072%
East Africa 13257%
BMCE
BANK
OF
AFRICA

Links to credit and market risks
The management of operational risks is potentially lin-ked to managing credit and market risks at two levels:
n At a general level, analysis of the Bank’s overall level of risk aversion - in terms of allocation of capital - must be carried out and “trans-risks” monitored;n At a specific level, some operational risks can be directly linked to market risk and credit risk manage-ment.
Operational risk management organisation
The framework governing operational risk manage-ment within BMCE Group of Africa is based on two main objectives:
n Define a target policy consistent with BMCE Bank Group’s business organisation inspired by best practice;n Involve and empower business lines and subsidia-ries in the day-to-day management of operational risk management.
Operational risk management at BMCE Bank Group involves four major entities:
n BMCE Bank’s Group Operational Risk Department;n BMCE Bank’s branch network;n BMCE Bank’s business divisions;n Subsidiaries.
Operational risks coordinators have been appointed by the aforementioned entities. These include:
n Operational Risk Correspondents (CRO);n Operational Risk Coordinators (CORO);n Operational Risk Liaison Officers (RRO).
The operational risk management’s remit also extends to Group subsidiaries such as Salafin, Maghrébail, Maroc Factoring, RM Experts, BMCE Capital, Tangier Offshore (TOS), BMCE Bank International Plc, BMCE International Madrid, La Congolaise des Banques, BOA France, BMCE Euro Services and Eurafric Information (EAI).
Governance of operational risk management
Governance of operational risks within BMCE Bank Group is organised by three operational risk Com-mittees:n Group Operational Risk Committee – incorporated within the Group Risks Committee;n Operational Risk Monitoring (Business Lines) Committee;n Operational Risk (Subsidiaries) Committee.These committees are tasked with periodically:
- Reviewing changes in operational risk exposure and in the environment for controlling such risks;- Identifying the main areas of risk in terms of activi-ties and risk types;
- Defining preventive and corrective action required and its monitoring to contain the level of risk;- Reviewing the amount of capital to be allocated to operational risks, the cost of preventive action required and the cost of insurance.
Fundamental methodology principles
BMCE Bank Group’s operational risk management policy has two strategic objectives:
n Reduce exposure to operational risks;n Optimise capital requirements relating to hedging operational risks.
The internal system for measuring operational risks is closely linked to the Group’s day-to-day risk manage-ment process via:
n Collecting risk events;n Mapping operational risks;n Key risk indicators.
The senior management of the entity in question, General Management and the Board of Directors are regularly notified of operational risk exposure and any losses incurred.
Internal and/or external auditors are invited to perio-dically review management processes and systems for measuring operational risk. These audits relate to units’ activities and the independent operational risk management function.
Management of operational risks at BMCE Bank Group of Africa has been entirely automated by means of specialised software. This software is used to collect risk events and map operational risks and key risk indicators by the Bank, its Moroccan subsidiaries and, increasingly, its African subsidiaries. To support its implementation, a number of awareness-raising and training initiatives were organised for operational risk staff across the entire Group.
RISK MANAGEMENT ORGANISATION

PAGE
134/
135
Operational risk control and mitigation
Several types of action may be taken to manage ope-rational risks:
n Reinforce checks;n Hedge risks, especially via insurance contracts;n Avoid risks, in particular, by redeploying activities;n Draw up business continuity plans.
BMCE Group of Africa has a very strong control policy, resulting in a significant reduction in operational risks.
However, in terms of operational risk management, over and above its risk control policy, the Group is at liberty to find the best possible solution on a case by case basis, depending on the different types of risks described above.
Additionally, the Group has insurance policies to mitigate risks such as damage to office buildings, fraud, theft of valuable items and third-party liability cover etc.
Every major risk identified is reported to the Bank’s senior management and will result in a corrective and/or preventive action plan whose implementation is mo-nitored by the Operational Risk Monitoring Committee which meets on a quarterly basis.
Risk Aggregation
Under the organisational policy adopted by the Bank which is based on Operational Risk Correspondents, risk events are reported by Basel type - eight business lines - and by loss category for all business lines as well as for Group subsidiaries.
Business Continuity Plan
The Business Continuity plan is a response to the rising demand to minimise the impact in the event of any interruption to the Bank’s activities. This is due to in-creasing reliance on the resources underpinning those activities including human, IT or logistics resources.
The Business Continuity Plan is a set of measures and procedures aimed at ensuring that the Bank, under different crisis scenarios such as a major shock, maintains essential services in fail-soft mode on a tem-porary basis, prior to a planned resumption of normal operations.
The strategic principles underpinning the Business Continuity Plan are as follows:n BMCE Bank has a moral responsibility to allow its customers access to the funds that they have entrusted to it. Any breach of this obligation in times of crisis may have an impact on public order. This principle prevails above any other;
n BMCE Bank must guarantee its commitments towar-ds Morocco’s interbank clearing system;n BMCE Bank intends, first and foremost, to comply with all existing legal and contractual commitments entered into - relating to loans and other commitments - prior to entering into any other commitment;n BMCE Bank intends to maintain its international credibility by guaranteeing, first and foremost, its com-mitments vis-à-vis foreign correspondents;
BMCE Bank of Africa Group’s existing customers take priority over all others.
Services are executed in their entirety, beginning in the front-office and culminating in the back-office - e.g. from branch level up until recognition in accounting terms -.
BCP tests relating to different aspects are conducted on a regular basis.
BMCE
BANK
OF
AFRICA
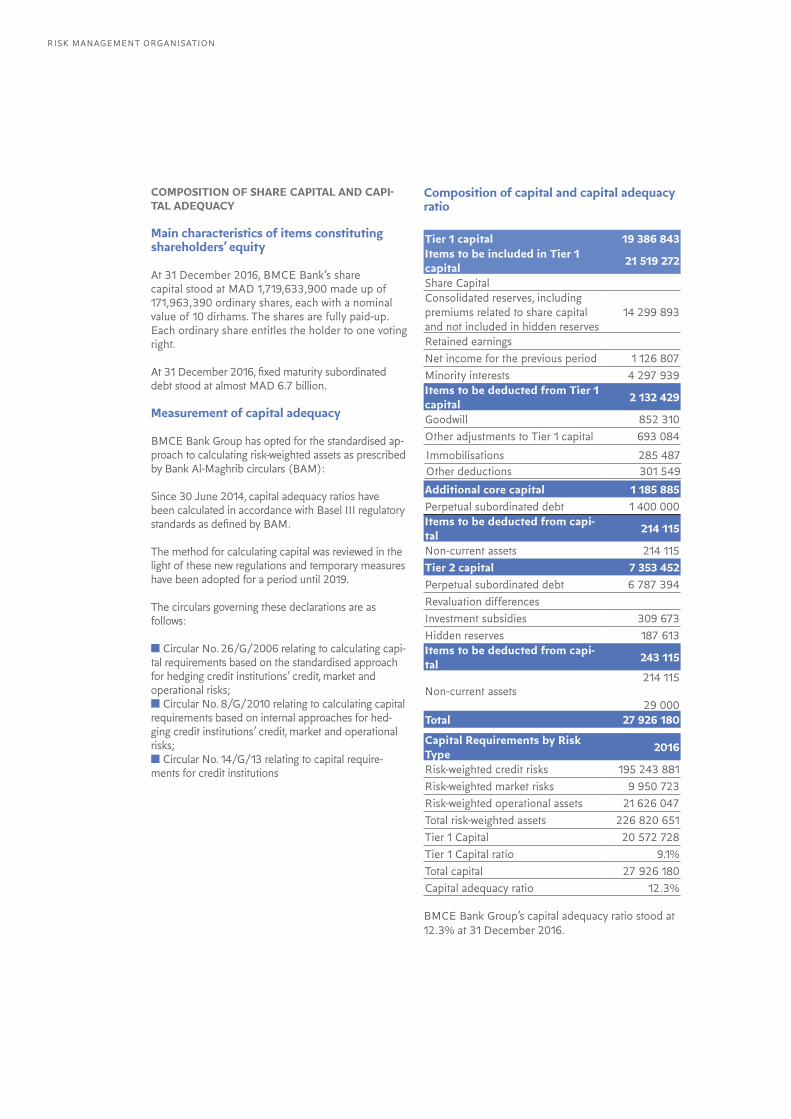
COMPOSITION OF SHARE CAPITAL AND CAPI-TAL ADEQUACY
Main characteristics of items constituting shareholders’ equity
At 31 December 2016, BMCE Bank’s share capital stood at MAD 1,719,633,900 made up of 171,963,390 ordinary shares, each with a nominal value of 10 dirhams. The shares are fully paid-up. Each ordinary share entitles the holder to one voting right.
At 31 December 2016, fixed maturity subordinated debt stood at almost MAD 6.7 billion.
Measurement of capital adequacy
BMCE Bank Group has opted for the standardised ap-proach to calculating risk-weighted assets as prescribed by Bank Al-Maghrib circulars (BAM):
Since 30 June 2014, capital adequacy ratios have been calculated in accordance with Basel III regulatory standards as defined by BAM.
The method for calculating capital was reviewed in the light of these new regulations and temporary measures have been adopted for a period until 2019.
The circulars governing these declarations are as follows:
n Circular No. 26/G/2006 relating to calculating capi-tal requirements based on the standardised approach for hedging credit institutions’ credit, market and operational risks; n Circular No. 8/G/2010 relating to calculating capital requirements based on internal approaches for hed-ging credit institutions’ credit, market and operational risks; n Circular No. 14/G/13 relating to capital require-ments for credit institutions
Composition of capital and capital adequacy ratio
Tier 1 capital 19 386 843Items to be included in Tier 1 capital 21 519 272
Share CapitalConsolidated reserves, including premiums related to share capital and not included in hidden reserves
14 299 893
Retained earnings Net income for the previous period 1 126 807Minority interests 4 297 939Items to be deducted from Tier 1 capital 2 132 429
Goodwill 852 310Other adjustments to Tier 1 capital 693 084
Immobilisations 285 487Other deductions 301 549Additional core capital 1 185 885Perpetual subordinated debt 1 400 000Items to be deducted from capi-tal 214 115
Non-current assets 214 115Tier 2 capital 7 353 452Perpetual subordinated debt 6 787 394Revaluation differencesInvestment subsidies 309 673Hidden reserves 187 613Items to be deducted from capi-tal 243 115
Non-current assets214 115
29 000Total 27 926 180
Capital Requirements by Risk Type 2016
Risk-weighted credit risks 195 243 881 Risk-weighted market risks 9 950 723 Risk-weighted operational assets 21 626 047 Total risk-weighted assets 226 820 651 Tier 1 Capital 20 572 728 Tier 1 Capital ratio 9.1%Total capital 27 926 180 Capital adequacy ratio 12.3%
BMCE Bank Group’s capital adequacy ratio stood at 12.3% at 31 December 2016.
RISK MANAGEMENT ORGANISATION

MONITORING OVERSEAS SUBSIDIARIES
The Convergence Programme’s implementation phase progressed well in 2016 in line with the Group’s goals. This involved ongoing implementa-tion of systems by new subsidiaries so as to expand geographical coverage to the entire Group.
At the end of 2016, an implementation review was carried out by the subsidiaries in Ivory Coast and Senegal to obtain as much feedback as possible and, where appropriate, adjust the system prior to ongoing implementation in 2017.
Credit risk system
The work involved in implementing the credit risk system was aimed at meeting the strategic goals set by Group Risks in accordance with Bank Al-Ma-ghrib’s regulatory requirements and the Group’s regulatory framework. This work was divided into two parts.
Operational risk management system
The operational risk management system has now been implemented by 17 subsidiaries – BOA Benin, BOA Côte d’Ivoire, BOA Burkina Faso, BOA Senegal, BOA Niger, BOA Mali, BOA Madagascar, BOA France, BOA Togo, BOA DRC, BOA Kenya, BOA Ghana, BOA Uganda, BOA Tanzania, BOA Red Sea, LCB and BBI UK:
n Operational risk maps were finalised and approved at the local level in five areas.
STEERING GROUP RISK PROJECTS
Risk projects management policy
The Group Risks Division centralises project stee-ring and management and Group systems adminis-tration within a dedicated Group Risk Project Stee-ring unit. This provides a comprehensive overview of the progress made at the Group level in terms of the Group’s cornerstone projects.
The Risk projects management policy, which is im-plemented across the entire Group, aims to ensure effective and efficient management of Risk projects in line with divisional strategy.
Responsibilities of the Group Risk Project Steering unit
The Group Risk Project Steering unit has the fol-lowing responsibilities:
n Manage Group Risks – Group Third Party database, Group Business database, Group Commit-ments database and centralise data, settings, control, handling and reporting
n Centralise the Group risk project portfolio – de-termine the stakeholders and schedules and identify the extent to which projects are interdependent
n Steer risk projects, select and prioritise projects and monitor the state of progress of all initiatives
n Draw up project factsheets – goals, deliverables and detailed project implementation plans
n Manage alerts and arbitrage applications
n Plan key stages and control project delivery schedules
n Organise, prepare and steer corporate governance bodies
n Monitor data qualification and reliability initiatives
PAGE
136/
137
BMCE
BANK
OF
AFRICA

ASSET-LIABILITY MANAGEMENT
Liquidity risk
The Bank’s strategy in terms of liquidity risk management is aimed at ensuring that its funding structure is adapted so as to enable it to continue to grow its operations in a stable manner.
An acceptable liquidity level is one that enables the Bank to finance asset growth and fulfil its commit-ments when they fall due, thereby protecting the Bank from any potential crisis.
Two indicators are used to evaluate the Bank’s liqui-dity profile:n The Liquidity Coverage Ratio, which stood at 135% on a consolidated basis at 31 December 2016, well above the 70% regulatory limit set by Bank Al-Maghrib for 2016;n The cumulative liquidity gap profile, the method of periodic or cumulative gaps in dirhams and in foreign currencies, which measures the level of liquidity risk incurred by the Bank over the short, medium and long term.
This method is used to estimate the net refinancing requirements over different time periods and deter-mine an appropriate hedging strategy.
Interest rate risk
Interest rate risk is the risk that future changes in interest rates will negatively impact the Bank’s profit margins.Interest rate risk is measured by conducting simu-lation-based stress tests under a scenario in which interest rates are raised by 200 basis points as recommended by the Basel Committee.The Bank’s strategy in terms of interest rate risk management is aimed at ensuring earnings stability in the event of changes in interest rates, thereby protecting net interest income and optimising the economic value of equity.Changes in interest rates may negatively impact net interest income and result in the Bank significantly undershooting its initial projections.In order to counter such risks, the ALM department regularly steers the Bank’s strategy by establishing rules for matching assets and liabilities by maturity and by defining a maximum tolerance deviation limit for net interest income by comparison with projec-ted net banking income.
Sensitivity of the value of the banking port-folio
Simulation-based stress-tests are conducted to measure the impact of changes in interest rates on net interest income and on the economic value of equity.
At 31 December 2016, the impact from a 200 basis point change in interest rates on net banking income was an estimated MAD 101 million or 1.7% of pro-jected 2016 net banking income, well below the 5% limit set by ALCO.
The change in the economic value of equity in the event of a 200 basis point shock was an estimated MAD 11,135 million or 6.7% of regulatory capital, well below the 20% limit set by ALCO.
RISK MANAGEMENT ORGANISATION

BMCE BANK OF AFRICAOur World is Capital
PAGE
138/
139

BMCE Bank Of Africa Group’s every action syste-matically complies with provisions that are specific to banking and financial operations, regardless of whether they are legislative or regulatory by nature, as well as the ethical and professional principles and standards in force. Compliance with these standards and principles underlines the Groups strong com-mitment to protecting all stakeholders, particularly its customers.
Upholding such commitments is not simply the responsibility of a group of experts but, rather, a culture and state of mind that guides Group’s entire staff at all times.
NON-COMPLIANCE RISK
Non-compliance risk, as defined by Group Com-pliance policy, is the risk of judicial, administrative or disciplinary sanction, significant financial loss or damage to one’s reputation, resulting from non-com-pliance with provisions that are specific to banking and financial operations, regardless of whether they are legislative or regulatory by nature, ethical and professional standards or instructions established by the Group Executive Committee in application of the corporate strategy approved by BMCE Bank of Africa Group’s Board of Directors.
In accordance with the Compliance policy approved by the Board of Directors, Group Compliance’s in-volvement is at the BMCE Bank Group level as part of a process of managing, controlling and mitigating non-compliance risk, primarily in relation to:
n Anti-money laundering and countering the finan-cing of terrorismn Complying with financial embargoes n Combatting corruption and fraud n Complying with ethics and professional conduct n Preventing conflicts of interest and market abuse n Protecting personal data n Mitigating non-compliance risk relating to new products and business lines
COMPLIANCE SYSTEM
To ensure that these guidelines are adhered to, the Group has adopted a Compliance system comprising an organisational structure, a standard framework, procedures and information systems.
An effective system for preventing non-compliance risk is based on shared responsibility between business lines and the Compliance function. Each business line is responsible for mitigating non-com-pliance risks within its remit. Group Compliance’s role is to coordinate and advise each business lines.
The Compliance system was bolstered in 2015 to take into consideration regulatory developments
and the Group’s geographical expansion. As a result, its remit was extended to cover, in addition to its traditional AML/CFT activities and management of financial embargoes, new functional areas such as personal data protection, compliance with FATCA, approving new products and activities and many other issues. As far as its geographical remit is concerned, the major event of 2016 was that work began on establishing a Group-wide Compliance function by forging new ties with subsidiaries and, in particular, applying Group standards at the subsidia-ry level and introducing a reporting system.
In 2016, the concept of a Compliance ‘community’ was also introduced, regarded as a major way of fostering a common compliance culture among staff working in Compliance. As a result, an inaugural Group Compliance Community conference was held which was attended by some fifty Compliance Offi-cers from twenty countries in Africa and Europe.
ORGANISATION AND GOVERNANCE OF THE COMPLIANCE FUNCTION
Organisation of the Compliance function
Group Compliance is a separate function that spe-cialises exclusively in managing, controlling and mi-tigating non-compliance risk. It carries out its duties directly at both the Group and BMCE Bank levels.
Group Compliance, which reports to the Group General Management Committee, consists of three distinct entities: n BMCE Bank Compliance, which is responsible for managing and mitigating non-compliance risk at the BMCE Bank level;n Group standards and advisory, whose main responsibility is to devise Group Compliance stan-dards, ensure that they are updated as a function of permanent regulatory developments and oversee projects that have an impact at the Group level;n Group coordination/steering, whose main res-ponsibility is to ensure coordination between the Group and its different entities regarding Com-pliance matters.
GROUP COMPLIANCE

PAGE
140/
141
All Heads of Compliance of each of the Group’s fully consolidated subsidiaries report to Group Compliance.
Governance: Group Compliance, from an operatio-nal perspective, reports to:
n Group General Management Committeen Group Audit and Internal Control Committeen Group Internal Control Coordination Committee
Compliance function’s responsibilities: The Compliance function is responsible for devising and implementing the system for managing non-com-pliance risk at the Group level. It encompasses a number of aspects including:
n Financial security, which encompasses issues such as anti-money laundering (AML) and countering the financing of terrorism (CFT), Know Your Customer (KYC) and compliance with financial embargoes;n Ethics and professional conduct, which encom-passes matters relating to rules of proper conduct, managing conflicts of interest, insider trading inci-dents, whistle-blowing, the prevention of fraud and corruption and personal data protection; n Compliance-related advisory, which aims to provi-de operational entities with the necessary support to perform their duties domestically and overseas and mitigate non-compliance risk;n Group Compliance steering, which is responsible for enforcing Group standards at the subsidiary level and providing them with assistance and support.
Group Compliance organises and carries out compliance checks in conjunction with the other Compliance-related functions and coordinates the Compliance function at the Group level by providing practical support to each Group entity domiciled in Morocco or overseas.
Anti-money laundering and countering the finan-cing of terrorism (AML/CFT): Given its size, the diversity of its businesses and the strong expansion of its overseas operations, BMCE Bank of Africa Group is faced with a major risk in terms of money laundering and terrorist financing. Its financial and geographical diversity means that the Group is also confronted with a risk of contagion and damage to its reputation should one of its entities become involved in a money laundering or terrorist financing incident. The Group is liable to be inspected by regulators or incur financial and/or administrative penalties in the different countries in which it has operations.
Against a backdrop of regulatory tightening around the world, the Group has been bolstering its AML/CFT system. Several measures were taken in 2016 in this respect, including:
n Increasing the number of head office staff specia-lising in AML/CFT while recommending that subsi-diaries also increase the number of staff specialising in financial security;n Updating profiling and filtering systems so as to enhance the technical platform and improving func-tional rules for detection;n Providing training in AML/CFT to the entire domestic retail banking network and the Group’s subsidiaries.
Know Your Customer (KYC): The Know Your Cus-tomer operating system, regarded by BMCE Bank of Africa Group as the core of any effective com-pliance system, was bolstered in 2016 as follows:
n New lists were obtained so as to identify certain customer categories, including politically exposed persons;n Improvements were made to the branch produc-tion system’s data dictionary so as to enhance the quality of the data collected from customers at the outset of the customer relationship;n A vast project was launched to improve the relia-bility of existing customer data;n The branch network was provided with greater assistance regarding transaction-related and ac-count-opening risks;n The KYC system was updated in the wake of dis-cussions with foreign correspondent banks.
Financial embargoes and sanctions: Group Com-pliance is responsible for ensuring that the Group complies with sanctions lists and adopts a system whereby each entity fully takes on board the restric-tions announced by the different international sanc-tions programmes. The Group Compliance System ensures that all subsidiaries strictly adhere to the applicable sanctions programmes. In this respect, a number of initiatives were undertaken:
n Commercial lists were obtained, highlighting the main sanctions programmes with regular updates provided;n The subsidiaries in question were briefed about the sanctions programmes;n Notes aimed at raising awareness were distributed to each Group subsidiary in question regarding com-pliance with embargoes.
BMCE
BANK
OF
AFRICA

Ethics and professional conduct: Compliance with ethics and professional conduct is a key aspect of the rules of conduct to which all Group employees must adhere. Proper application of procedures by internal and external resources – service providers, temporary staff and interns – is closely monitored.
Training and awareness initiatives relating to ethics and professional conduct are regularly organised for staff by Group Compliance.
Group Compliance is responsible for establishing the ethical principles adopted by BMCE Bank of Africa Group which underpin its Code of Ethics, Rules of Proper Conduct and Gift Policy etc. A Code of Ethics was drawn up by Group Compliance specifying the rules of ethics and professional conduct to be adopted by BMCE Bank of Africa Group when carrying out its duties. The goal is protect the Group’s good reputation and ensure that best practice in rules of ethics and professional conduct is applied by the entire staff. Any incident of non-compliance with the requirements of the Code is reported to Management.
Preventing, detecting and managing conflicts of interest: A system for preventing (policies, internal procedures), detecting (whistle-blowing, declaring conflicts of interest) and managing conflicts of interest (internal committees, management rules) is implemented by Compliance in conjunction with other control functions.
Personal data protection: Group Compliance is working on introducing an appropriate system to ensure that the Group complies with the regulatory requirements regarding personal data protection – defining the criteria for processing personal data and obligations regarding respect for the rights of the persons in question when processing and transfer-ring their data.
In 2016, the Group also intensified its efforts at communicating with the branch network and Head Office entities about personal data protection. Prevention of fraud and corruption: Fraud prevention is first and foremost the responsi-bility of the operational and functional entities and their supervisors. The fraud prevention system established by the Group is based on developing an attitude of vigilance regarding the risk of fraud, iden-tifying different types of fraud, frequently appraising fraud risks, incorporating the risk of fraud in opera-ting systems, implementing employee management policies aimed at bolstering fraud prevention and informing staff about any penalties incurred.
In the fight against corruption, the Group has adop-ted a prevention system based on raising awareness among staff, reporting alerts to senior manage-ment – whistle-blowing – and supervising practices relating to employees giving and receiving gifts and benefits.
Compliance-related advisory and regulatory monitoring: In 2016, Group Compliance defined a decentralised system for regulatory monitoring so as to ensure that new regulations applicable to each subsidiary were reported on a regular basis.
Appraising non-compliance risk relating to new products and activities: With the aim of being to-tally transparent when marketing new products and activities and acting the best interest of customers, Group Compliance analyses the impact from any new product, service or activity proposed by the Group in compliance terms.
The Compliance appraisal procedure for new pro-ducts and activities provides a framework ensuring that all products and activities marketed by the various distribution channels comply with legal and regulatory requirements. This procedure ensures that Group Compliance approves any new product or activity or any material transformation of an exis-ting product. Group Compliance may issues a notice blocking any new release if there is a material risk to the institution, its customers or its partners.
Advising operational entities: Either Group Compliance or local Compliance functions may be consulted by operational entities to answer any of their enquiries on any compliance-related issue when carrying out their operational activities.
GROUP COMPLIANCE

Training: An annual training plan for the branch network was established by Group Compliance tackling issues relating to financial security and ethics and professional conduct.
A wide range of compliance-related training and awareness initiatives are regularly organised by Com-pliance which includes presentation-based training, e-learning and, in particular, the publication of notes aimed at raising awareness.
2017 OUTLOOK
The Group Compliance system will continue to be bolstered in 2017. The Compliance function will be more closely integrated by:
n Bolstering the Compliance function at the Group level by adopting a proactive approach to managing the community of Compliance Officers;n Encouraging behavioural change with regard to adopting key concepts;n Brain-storming about how to best pool resources so as to develop expertise at the Group level and integrate the Compliance function more closely;n Finalising implementation of the standard Com-pliance system by each of the Group’s consolidated subsidiaries.
2017 will also provide an opportunity to endorse gover-nance of the Compliance function by holding meetings of newly created management bodies. The function’s good governance, its independence and its status as an entity reporting directly to the Group’s senior mana-gement is a regulatory requirement as well as ensuring that the system for protecting the reputation of the Bank and Group is effective.
PAGE
142/
143
BMCE
BANK
OF
AFRICA

Spring in the Atlas Mountains, MoroccoO U R W O R L D I S C A P I TA L
Social and Environmental Responsibility

PAGE
144/
145
ROYAL RECOGNITION for Dr Leila MEZIAN, Chairperson
On the occasion of the Feast of the Throne celebrated on 30th July 2016, His Majesty, King Mohammed VI bestowed the Order of Ouissam Alaouite on Dr Leila Mezian Benjelloun, as Chairperson of the BMCE Bank Foundation. BMCE Bank in turn paid tribute to her at the Bank’s Head Office on 14th October 2016.
A SLEW OF EDUCATIONAL INITIATIVES implemented across the Medersat.Com network
In 2016, a new educational system governing Medersat.com schools was introduced which consisted of standardising text books, implementing a new approach to teaching French, introducing the teaching of Mathematics and Earth and Life Sciences in French, implementing a standardised text book for the Tamazight language, boosting the use of new information and communication technologies in teaching practices, training teachers to use new educational approaches particularly with regard to French and Tamazight language teaching, revising school timetables and managing school areas and classrooms as a function of year groups and the time allocated to academic work.
AN EFFECTIVE EDUCATIONAL AND ORGANISATIONAL SYSTEM implemented in conjunction with the Ministry of National Education
As part of the process of implementing the new educational and organisational system, new teachers were recruited to Medersat.Com network schools. The recruitment and deployment process was managed in close conjunction with the Ministry of National Education’s HR Department.
Specific discussions were also held with Delegates from the Ministry of National Education and Directors of Regional Academies of Education and Training (AREF) to ensure that the number of teachers working in network schools remained stable, particularly at the start of the 2016-17 academic year.
In addition to these initiatives, educational supervisors’ responsibilities were redefined and a new mode of teaching supervision was adopted in the wake of a Ministry of National Education circular published in June 2016 regarding the appointment and assignment of certified supervisors to Foundation schools. The circular was sent to all Provincial Delegates and AREF Directors.
SUPPORT AND RECOGNITION for the teaching staff
To enhance the quality of teachers and provide them with the necessary skills, training sessions were organised for French and Tamazight teachers.
Similarly, in a bid to encourage teachers working in Medersat.Com schools to increase their effectiveness and adopt innovative teaching practices, a Merit prize is awarded at the end of each academic year to schools with the best academic results and the best record in terms of a school’s environmental, socio-cultural and educational impact.
MULTILINGUAL EDUCATION a growing interest in other languages
As part of the process of promoting the Tamazight language, the best students from Network schools, selected on the basis of their internal preparatory exams, participated in the Tifinagh Olympiads organised in August by the Ministry of National Education. Our students topped the rankings.
Similarly, as a result of a collaborative project between the Foundation and the Chinese Embassy to Morocco, Mandarin Chinese has been taught in 3 schools since 2015, with around 148 students taking the subject.
INFORMATION SYSTEMS fully complying with standards
In conjunction with an external consulting firm, the IT system’s content and operating settings were redefined to meet the specific educational requirements of Medersat.Com Network schools. Several initiatives were initiated, in particular, upgrading and adapting IT applications, resulting in more effective management of administrative and educational aspects. A new system was also introduced for customising academic results and report cards for Foundation schools.
BMCE Bank Foundation
BMCE
BANK
OF
AFRICA

RENEWED COMMITMENT TO SUPERVISORY VISITS and monitoring
As part of the ongoing monitoring process, the Director of the Medersat.Com programme organised a number of surprise visits. The purpose was to ensure that schools were functioning properly, establish direct contact with teachers and make the Foundation’s presence felt in schools, ensure that the new educational measures had been adopted by the Network schools from 2015 and ascertain schools’ needs in terms of equipment and teaching materials.
Subsequent to these visits, a report was drawn up, highlighting the incentives and disciplinary measures to be taken as well as the needs in terms of school equipment.
EXTRA-CURRICULAR ACTIVITIES a well-rooted culture fostering personal growth and development
In order to develop a sense of cultural and artistic awareness in pupils attending Medersat.Com schools and expand the schools’ outreach, various co-curricular activities were organised throughout the academic year. With parental involvement, pupils were able to participate in celebrating the various national and international holidays as well as activities organised to raise awareness about climate change issues as an adjunct to the COP22 conference held in Marrakesh.
APPRAISING ACADEMIC PERFORMANCE highly commendable results
So as to ensure ongoing improvement, an internal educational audit of academic results was carried out in July 2016 regarding the five core subjects – Arabic, French, Tamazight, Maths and Sciences - with around 9,900 students from 62 Network schools appraised.
The results of the audit were very encouraging overall with 89% of the students appraised obtaining a score that was higher than the average of 5/10, with 61% achieving an average of more than 7/10. In addition, French teachers underwent a written and oral appraisal.
SOCIAL AND ENVIRONMENTAL RESPONSIBILITY

PAGE
146/
147
Sustainable Development
A WELL-FOUNDED REPUTATION IN SUSTAINABLEand responsible financing
With the new CAP ENERGIE financing solution, the Bank has funded more than 40 companies and, as a result, has enabled its customers to become more competitive on a sustainable basis by making energy efficiency and renewable energy a key part of their strategic development.
In addition to the technical assistance and advice provided to customers, the enormous success of the MorSEFF credit facility resulted in a second EUR 35 million financing line in October 2016, announced at a conference organised by BMCE Bank of Africa and the EBRD on ‘Supporting the emergence of a green finan-cial market in Africa’. The conference was attended by leading personalities from African banks and regulatory authorities.
HEAVILY INVOLVED in COP22
In the days leading up to the COP22 conference, BMCE Bank of Africa became the first bank in Moroc-co to issue Green Bonds to finance green projects that promote energy efficiency and the use of renewable energy.
Furthermore, a EUR 20 million credit facility agree-ment was signed with the European Investment Bank and the FMO, the Dutch development bank, as an adjunct to the COP22 conference, to help finance Morocco’s circular economy in solid waste collection, recycling and recovery. The facility is to be backed by a technical assistance programme, 75% of which is spon-sored by the FMO, as well as an exchange programme in the Netherlands organised by the FMO for the benefit of the Bank and its customers. EUR 11 million of this credit facility had already been taken up prior to the product being marketed.
The Bank also signed a Memorandum of Understan-ding to establish a credit facility in partnership with the AFD and the EIB to finance adaptation to climate change with an emphasis on industrial waste water treatment in Morocco. This facility will also involve technical assistance.
SOLID COMMITMENT to CSR best practice
In 2016, BMCE Bank of Africa became the first Mo-roccan bank to sign up to the United Nations Global Compact, underlining its commitment and support for the ten principles relating to human rights, labour stan-dards, environmental protection and anti-corruption.
During the year, the Bank also subscribed to the ‘Mainstreaming Climate Action within Financial Institutions’ initiative in conjunction with the EIB, the AFD, the EBRD, HSBC, Yes Bank and others financial institutions.
In 2017, the various credit facilities – MorSEFF II, the waste water product, the solid waste recovery product – will be marketed in addition to the Green Bonds. Inspired by the MorSEFF programme’s success, a pilot project will be launched by BOA Senegal to develop a specialised product offering.
NON-FINANCIAL RISKS
One of the Group’s strategic priorities is to ensure its sustainability by adopting a holistic approach to risk management incorporating environmental, social and governance (ESG) criteria. Work was carried out in close conjunction with the Group Risks Department aimed at progressively incorporating ESG risks within the Group’s operational risk map.
In 2017, this approach will be extended to all areas of corporate social responsibility, thereby effectively incorporating these risks within the Group Risk Ma-nagement system by adopting a robust approach to identifying, analysing, assessing and monitoring risks.
BMCE
BANK
OF
AFRICA

SOCIAL AND ENVIRONMENTAL MANAGEMENT SYSTEMS a dedicated organisational approach
In 2016, the Bank calculated the direct greenhouse gas emissions generated by its entire operations in relation to energy consumption, the supply chain, transporting personnel, building construction, waste recycling, and subcontracted work so as to adopt appropriate reduc-tion measures.
This carbon footprint reduction programme was un-derlined in the Bank’s sustainable development policy by means of an integrated management system which includes environmental aspects (ISO 14001 certifica-tion), energy aspects (ISO 50001 certification), the international Green Building Solutions Awards 2016, the national Smart Building award as well as HEQ cer-tification granted to BMCE Bank Of Africa Academy’s new site.
In 2017, occupational health and safety certification will be renewed with the Bank implementing a number of risk prevention programmes relating to employees’ and customers’ health and safety. The Bank will apply for renewal of ISO 14001 certification in its latest version, which incorporates all the various requirements for managing direct and indirect environmental impacts. The Bank’s greenhouse gas emission report will also be updated so as to measure the effectiveness of the measures taken by the Bank.
MORE AWARDS international recognition
BMCE Bank of Africa’s sustainable development strategy is embodied in a strong and well-embedded CSR system which enables it to surpass the standard regulatory and universal models, drawing inspiration from best international practice.
As a result of the commitment shown by every one of the Bank’s business lines to CSR, the Bank was named ‘Top Performer, CSR Morocco’ by Vigeo-Eiris, a non-financial ratings agency, for the 4th consecutive year in the ‘Environment’ category. Furthermore, since December 2016, the Bank has been included in the Eiris Vigeo Emerging 70 Index specialising in emerging countries, in recognition of best practice in CSR.
BMCE Bank of Africa was an award winner for the 3rd consecutive year at the CSR Arabia Awards 2016, the-reby underlying its status as the first bank in the region to have obtained ISO 500001 certification for its energy management system and the first Moroccan bank and the second in Africa to be awarded HEQ certification from Cerway International Certification for the new BMCE Bank Of Africa Academy head office.
SOCIAL AND ENVIRONMENTAL RESPONSIBILITY

PAGE
148/
149
Blue Lake of Biei, Hokkaido, Japan
O U R W O R L D I S C A P I TA L
BMCE
BANK
OF
AFRICA

EMPHASIS ON BOLSTERING HR’s Group-wide dimension
In 2016, emphasis was placed on managing human capital on a Group-wide basis. As a result, for the very first time, an HR seminar was organised and attended by each representative of the HR function from the Group’s 40 or so subsidiaries. A variety of workshops were organised on significant themes such as (i) strate-gic HR issues (ii) HR policies and systems (iii) HR risk management (iv) HR information systems (v) growth drivers for the HR community.
A Community Management approach was also adopted aimed at fostering a culture of dialogue within the Group Human Capital community.
As part of a process of developing intra-Group HR sy-nergies, one of the highlights of 2016 was the sourcing of some 300 job applications for posts in the Group’s Moroccan subsidiaries.
In addition, there were 20 intra-Group secondments, including 9 from the parent company to overseas subsidiaries, 5 to Moroccan subsidiaries and 6 cases of repatriation.
On a different note, 2016 saw new certification programmes launched for some of the Group’s Head Office functions.
BUSINESS DEVELOPMENT a priority for HR
In 2016, to support the expansion of the Bank’s com-mercial network with the opening of 28 new branches and 5 business centres, the Bank promoted about one hundred staff to the ranks of Branch Manager or Customer Adviser.
341 staff were recruited to bolster sales and Head Office operations – by both the parent company and subsidiaries – as well as certain support functions.
At the same time, around 1,260 students (23% of the workforce) from various schools and universities completed one- to six-month internships within BMCE Bank’s various entities. In a bid to boost youth employ-ment, about 10 jobs were offered to interns.
MANAGING STAFFING levels pro-actively
In 2016, to ensure that the Jobs and Competencies Framework met the needs of the different banking business lines, a project was initiated to redesign the Framework and align it more closely with the GPBM framework.
The latter is the cornerstone of all HR systems, in par-ticular (i) career management (ii) workforce planning in terms of jobs and competencies (iii) performance management (iv) managing high-fliers and (v) recruit-ment. It is intended that this project will be extended to the Group level.
In operational terms, 33% of the Bank’s staff either changed posts or were promoted, resulting in 1,712 internal transfers.
To boost the Group’s managerial culture, the ‘MBON-GWANA’ programme was designed for LCB Bank.
TRAINING the cornerstone of development
18,554 man-hours of training were provided in 2016 benefiting 66% of the Bank’s workforce. The trai-ning was focused primarily on banking business lines (66%), support for new hires (14%), regulatory-related training (15%) and personal development training (19%). Furthermore, 82% of those benefiting from these training courses were from the Network.
As far as diploma-based training was concerned, 63 employees pursued their studies for the ITB and Banking Diploma via an e-learning approach. To sup-port the Group’s increasingly international profile, 289 employees or 5% of the workforce attended English and Spanish classes.
So as to standardise the training process for new hires, the Bank leveraged its partnership with the OFPPT to train 79 students for banking business lines.
Similarly, more than one hundred Senior Managers from Corporate Banking and Assistant Directors par-ticipated in the M4Banking programme, designed to foster in participants a sense of value creation, boost teamwork and reinforce interpersonal skills.
Group Human Capital
SOCIAL AND ENVIRONMENTAL RESPONSIBILITY

PAGE
150/
151
In 2016, the newly-established Risk Academy, in conjunction with the Association in Risk Management (AMRAE), launched a number of courses aimed at bolstering the risk control culture across the Group. These included: (i) the 2nd ARM 54 programme for 21 Risk Managers, (ii) the 1st ARM 56 programme attended by 35 participants and (iii) the 1st ARM 54 programme in English for 15 employees at the Group level.
In addition, one of the innovations of 2016 was the launch of the Culture4.Banking programme for 150 Managers (50% of whom were from Head Office departments and 50% from the commercial network). This programme is aimed at fostering a transversal managerial culture across Head Office departments and the Network.
STRONG EMPHASIS on employees’ welfare
Enhancing staff benefits and employees’ welfare is a key priority when it comes to the Bank’s commitment to its employees and has the entire support of trade union organisations. A number of agreements were therefore signed for employees’ benefit, giving them preferential terms when booking hotels or purchasing clothes, among other things.
Another important aspect during the year was to improve healthcare coverage for employees and their families. As a result, an agreement was signed with Sphera Global Healthcare, a specialist in healthcare marketing, in person or remotely.
In addition, the BMCE Bank Club continued to orga-nise a series of cultural and sporting activities for em-ployees’ children such as Swimming School and Music School as well as a morning for handicapped children.
CHANGES IN THE WORKFORCE REFLECTING TRENDS in the underlying business
In 2016, the Group’s workforce grew by 3% versus 2015 to 14,112 employees. This was primarily due to the expansion of the business in sub-Saharan Africa.
At the Group level, 1,223 persons were recruited in 2016 to meet the needs of the business and employees leaving the company.
BMCE Bank’s total workforce stood at 5,294 em-ployees at 31st December 2016, up 2.5% versus end-December 2015. Approximately three-quarters of employees are employed within the distribution network.
Consistent with the Group’s commitment to promoting gender equality, the percentage of female employees increased to more than 38% in 2016 versus 34% in 2012.
BMCE
BANK
OF
AFRICA

HEAVILY COMMITTED to promoting culture
BMCE Bank, which is heavily committed to sponsoring Morocco’s cultural scene, continues to provide financial support to a number of well-known domestic and international festivals and art exhibitions.
In 2016, the Bank sponsored the Nador International Festival of Cinema and Remembrance, the Fez Festival of World Sacred Music, a photographic and cultural exhibition about the three kings, an exhibition of paintings by Mr Youssef Benjelloun and Mrs Aziza Kadiri, the Agadir Timitar Signs & Culture Festival, the Ifrane International Festival, the Nador Eastern Comedy Festival, the Nador Mediterranean Festival, the « Oriental Evolution » Ballet, the Marrakesh International Film Festival, the Jazz under the Argan Tree Festival in Essaouira. The Bank also contributed to the making of ‘Exporting Morocco, Made in Morocco & Made in Africa’.
A STRONG SHOWING at trade fairs and exhibitions
Each year, BMCE Bank supports a number of economic events that are aimed at forging closer relations with strategic partners in value added sectors with strong growth potential. In 2016, it participated in the Africa Directors Club Forum, the African Entrepreneurship Award (AEA), the Study in France Expo, the Morocco Solar Power Expo, the Jobs and Professions Caravan, the Hassania College’s Junior Enterprise entrepreneurship competition, the Pharmacists’ International Fair, the CECODEl Entrepreneurship competition, the Medical Expo 2016, the Meknes International Agricultural Fair, the Regional Meetings of the Housing Industry, the ENCG Settat Art Symposium, the Casablanca Bar’s Open Days, the Fashion.be fashion show, the National Conference of Doctors, the Automotive Sub-contracting Fair, the « Morocco, Your Footprint in Africa » conference in London, the Logismed Fair, the Eastern Region’s dentists’ conference, the Small Business International Forum, the Economic Forum of the Chambers of Industry and Business Leaders of Arab Maghreb Union countries, the International Conference on One-Stop Shops, the MedCop Climate conference, the Italian Design and Technology Trade Fair – Medinit Expo 2016, the Conference of Business Leaders of the Sous-Massa Region, the COP 22 Conference in Marrakesh, the Elect Expo 2016 International Trade Fair, the Timitar Festival, the Sakane Expo property fair and the International Fruit and Vegetables Trade
Fair.STRONG SUPPORT for non-profit organisations and foundations
Strong support for non-profit organisations and foundations
BMCE Bank continues to strive to serve humanitarian causes by making charitable donations or purchasing tickets on behalf of non-profit organisations and foundations that work tirelessly for noble causes. Among these were the Diplomatic Foundation to which the Bank contributed financially to setting up a provisional shelter for sub-Saharan Africa’s most vulnerable migrants into Morocco, the PEEP Association, the Association of Public Sector Doctors in the Northern and Central Regions, the Noujoum Association’s 5 kilometre run, the Foundation for Managing the Mohammed VI National Centre for Handicapped Persons, L’avenir - the Association of Parents and Friends of children suffering from cancer, the Bouregreg Association, the Arts and Crafts Association, the ISCAE association promoting cultural exchange, the Handi Equality and Development Association, the Ibdaate Biladi Art and Culture Association, Heure Joyeuse, the Voix de Femmes Association, the Cooperative Studies Centre for Local Development (CECODEl), International Women’s Day, the General Confederation of Moroccan Businesses (CGEM), the Agadir Regional Tourism Council and the Green Building & City Solutions Awards Cluster. The Bank also made a financial contribution to the Ramadan 1437 charitable initiative, Diapason, the Association fighting to reduce the school drop-out rate and Sidaction Maroc 2016 - the National Solidarity Initiative to combat AIDS.
Objectif, Maghreb Secours’ quarterly review, the annual publication of Friends of Morocco’s Ponts et Chaussée engineering college, the magazine of Louis Massignon, a French high school as well as the magazine Fissa3 Hebdo from ISCAE all received financial aid in return for advertising space.
Public Relations
SOCIAL AND ENVIRONMENTAL RESPONSIBILITY

PAGE
152/
153
The Bank also purchased tickets for evening events such as an Evening of Hope, organised by AGIR, a non-profit organisation providing support to paediatric patients suffering from cancer and blood disorders, the Andalusian and Malhoune Bajdoub musical evening and an event organised by the Riad Zitoun School which runs literacy courses and vocational training for young girls.
In addition, in support of an initiative by the Mohammed VI Foundation for Environmental Protection, personally sponsored by Her Royal Highness Princess Laila Hasnaa, BMCE Bank also made a considerable contribution to the Clean Beaches campaign, providing technical as well as financial assistance, aimed at cleaning up and livening up the beaches in the town of El Harhoura.
A FLAIR for sport
The Bank’s ongoing commitment to sponsoring sporting events enhances its reputation and underlines the importance of the BMCE Bank brand.
In 2016, BMCE Bank sponsored a number of sporting events including the Mohammed VI Football Academy, the Terry Fox run organised by L’Avenir - the Association of Parents and Friends of children suffering from cancer, the Hassan II Golf Trophy, an expedition to climb the volcanic peaks of the Andes Mountains, the Fez International Bridge Festival, the tennis tournament of the Casablanca Airports’ Cultural and Sports Club, the Moulay El Hassan International Circuit Grand Prix, the « Driver Cup » - the Automobile Industry’s International Golf Trophy, the Moroccan Equestrian Trophy as well as a swimming marathon across the Gibraltar straits.
BMCE
BANK
OF
AFRICA

African Entrepreneurship Award
BMCE Bank Of Africa, a pioneer in promoting entrepreneurship
Officially announced at the Global Entrepreneurship Summit held in November 2014 in Marrakesh, the Afri-can Entrepreneurship Award (AEA), in its second year, was awarded to a dozen or so prize winners hailing from the entire continent.
With an annual budget of USD 1 million, the Award is testimony to the importance placed by BMCE Bank of Africa on the continent’s economic development. It aims to reward Africa’s best entrepreneurship projects which have a lasting and sustainable social impact in educa-tion, the environment and innovation.
Organising this Award was simply a logical step given the Bank’s forward-looking vision and track record in environmental protection, which has been a hallmark of its policy. It also acknowledges the pivotal role that en-trepreneurship will need to play in Africa’s development and the Group’s ambition in promoting its development in Africa, by Africans and for Africans.
At the awards ceremony presided by Mr Othman Ben-jelloun, Chairman of BMCE Bank Of Africa Group and attended by eminent members of Rabat’s diplomatic corps, recognition was given in particular to the colla-borative work which has made this second year such a success.
Mentoring has proven to be the key factor behind the AEA’s success. In 2016, more than 220 partner mentors from a variety of backgrounds - universities, incubators, business angels and investors - guided the young entre-preneurs and helped them to embody their projects and ideas.
Almost 7,000 entrepreneurs in 2 years
In terms of figures, the second AEA, launched in February 2016, attracted nearly 4,000 entrepreneurs from 105 countries, including 54 African countries. The participation rate in 2016 recorded a 33% increase compared to the first year’s competition. Since being launched in 2015, more than 10,000 entrepreneurs have submitted applications via the AEA website.
The programme also extended its partner network to more than 220 partner-mentors, representing 35 natio-nalities from Africa, Europe, Asia and North America.
In its second year, 37 finalists competed from 22 coun-tries – in 2015, there were 34 finalists from 15 countries. They were coached by 8 mentors during the Boot Camp – 6 coaches in 2015. The Boot Camp gave the entrepre-neurs an opportunity to share their values in a collegiate environment marked by a strong sense of team spirit.
The candidates spent four days together from 30th November to 3rd December 2016. At the end of this
period, 11 winners were selected by a jury made up of well-known business leaders and entrepreneurs.
11 award winners
The first prize, worth USD 150,000, was awarded to Mahmud Johnson of Liberia in the Environment category for his project on products made from palm oil, to Jennifer Shigoli of Tanzania in the Education category for her project on reusable sanitary towels and to Abdeladim Moumen of Morocco in the Unchartered Category for his project on diagnostic kits for infectious diseases.
The second prize, worth USD 100,000, was awarded to Ernie Aylward of South Africa in the Environment cate-gory for his electric mini taxi project, to Abideen Adelu of Nigeria in the Education category for his mobile app enabling students to test themselves and to Joyce Kyalema from Uganda in the Unchartered Category for her pumpkin seeds business.
Worth USD 50,000, Pioneer Awards were given to Fre-derico Peres da Silva from Mozambique for his project aimed at connecting workers in the informal sector, to Achiri Nji of Cameroon, for his app enabling buses to be tracked instantaneously, to Benti Gelalcha from Ethiopia for his project on veterinary ambulatory services, to Murtula Sanni of Nigeria for his platform for skilled craftsmen and to Omar Kadiri from Morocco.
The award winners pursue a customised mentoring pro-gramme designed to help them plan, launch and grow their enterprises.
It is worth recalling that, in 2015, 10 entrepreneurs from 8 African countries shared the USD 1 million prize mo-ney. Of these 10 award winners, 9 successfully reached the milestones required of them subsequent to them receiving their award.
A number of ‘takeaways’ for BMCE Bank of Africa
Based on about 15 key principles – volunteer mentoring, partnerships, creating an entrepreneurial ecosystem, process transparency, an innovative digital platform, commitment to effective and sustainable learning, a logo that evokes Value and Potential, a collegial and friendly approach – the AEA aims to create a corpus of knowledge that will enable it to become, over the long-term, ‘tomorrow’s bank’ as well as gaining a better un-derstanding of the needs of small businesses in Africa.
This type of initiative will therefore serve as a spring-board for entrepreneurship across the entire African continent via distribution channels that are branded ‘Bank of Africa’ and ‘BMCE Bank’ as well as ‘Banque de Developpement du Mali’, ‘La Congolaise de Banque’ and the Group’s Moroccan subsidiaries.
SOCIAL AND ENVIRONMENTAL RESPONSIBILITY

BMCE BANK OF AFRICAOur World is Capital
PAGE
154/
155

Dear Shareholders, Ladies and Gentlemen,
We are honoured to invite you to the Annual General Meeting of Shareholders in accordance with the Memorandum and Articles of Association and the amended Act 17-95 relating to limited companies and Articles 29 and seq. of BMCE Bank’s Memorandum and Articles of Association in order to report on BMCE Bank’s business activity and results for the period ended 31 December 2016 and its future prospects and to submit, for your approval, the balance sheet and financial statements for the said period.
These financial statements are attached to this report.
The statutory notices have been sent to you on a regular basis and all documents and items required by current regulations are made available to shareholders within the requisite periods.
CONSOLIDATED RESULTS AND BALANCE SHEET INDICATORS
BMCE Bank of Africa Group’s financial performance
BMCE Bank of Africa Group’s total assets rose by 9.5% year-on-year to MAD 306.0 billion at 31 December 2016. Total assets breached the MAD 300 billion mark for the first time.
BMCE Bank Group’s shareholders’ equity rose by 7% to MAD 18.3 billion at 31 December 2016 versus MAD 17.0 billion in 2015.
The scope of consolidation was broadly stable between 2015 and 2016. The Group saw its stake in BOA Group diluted from 75% to 72.8% following an equity issue by the latter reserved for a minority shareholder.
Consolidated loans grew by 3.7% from MAD 173.3 billion in 2015 to MAD 179.8 billion in 2016. Restated for money market repurchase agreements, loans increased by 8.5%.
Customer deposits grew by 6.6% over the same period to MAD 190 billion versus MAD 178.2 billion in 2015.
To bolster its equity, the Bank issued MAD 2 billion of subordinated debt on the domestic market in June 2016, which enabled it to bolster its capital adequacy ratio.
Regarding its consolidated financial performance, net banking income rose by 10% year-on-year to MAD 12,990 million versus MAD 11,817 million in 2015. Growth was driven by the performance of market operations (+86%) and an 8% increase in net interest income and fee income.
Gross operating income rose by almost 15% to MAD 5,615 million at 31 December 2016.
The cost of risk increased by 12% to MAD 1,616 million versus MAD 1,440 million in 2015.
Net income attributable to shareholders of the parent company rose by 4% to MAD 2,036 million in 2016 versus MAD 1,956 million in 2015, breaching the MAD 2 billion mark. Consolidated ROE was 12.6%.
Net income (Group) was 7% higher at MAD 2,835 million in 2016 versus MAD 2,655 million in 2015.
CONTRIBUTION TO NET INCOME ATTRIBUTABLE TO SHAREHOLDERS OF THE PARENT COMPANY BY BUSINESS LINE Contributions to BMCE Bank Group’s net income attributable to shareholders of the parent company by business line are shown below:
Consolidated contributions dec.-15 % dec.-16 % ChangeMOROCCAN OPERATIONS 1 177 60% 1 192 59% 1%BMCE BANK 845 43% 814 40% -4%SUBSIDIARIES 331 17% 378 19% 14%SPECIALISED FINANCIAL SERVICES 174 9% 188 9% 8%INVESTMENT BANKING 110 6% 141 7% 28%OTHERS 48 2% 49 2.4% 3%OVERSEAS OPERATIONS 779 40% 844 41% 8%EUROPE 171 8.7% 183 9.0% 7%AFRICA 608 31% 661 32% 9%NET INCOME 1 956 100% 2 036 100% 4%
Moroccan operations accounted for 59% of total net income attributable to shareholders of the parent company, broadly unchanged on the previous year.
Overseas operations saw their contribution to total net income attributable to shareholders of the parent company rise by 8% to 41%
African operations accounted for 32% of total net income attributable to shareholders of the parent company, up 9% on 2015.
RESULTS AND CONTRIBUTIONS FROM BMCE BANK SA’S OPERATIONS
BMCE Bank SA’s total assets rose by 9.4% to MAD 205 billion at 31 December 2016 versus MAD 187.0 billion at 31 December 2015, breaching the MAD 200 billion mark for the first time.
The Bank’s net banking income increased by 14.2% from MAD 5,374 million at 31 December 2015 to MAD 6,136 million at 31 December 2016. This was due to a combination of factors:
A significant rise in income from market operations (+68% compared to 31 December 2015) due to the performance of the fixed income portfolio
An increase of almost 5% in net interest income
21% growth in dividends (+MAD 89 million) to MAD 512 million in 2016 versus MAD 423 million in 2015
An 8.5% increase in fee income
General expenses rose by 7.1% from MAD 3,263 million at 31 December
Management ReportAT 31 DECEMEMBER 2016
NET BANKING INCOME
+14.2%
2015 2016
5 374
6 136
GENERAL OPERATING EXPENSES
+7.1%
2015 2016
3 263
3 493
TOTAL ASSETS
+9.5%
2015 2016
187205
BREAKDOWN OF NET BANKING INCOME
+11.6%
2015 2016
Income from market operations
Fee income
Net interest income
Other net income 295716
917 995
329
3 4463 609
1 202+68%+8.5%
+5%
COST-TO-INCOME RATIO
2015 2016
60.7%
56.9%
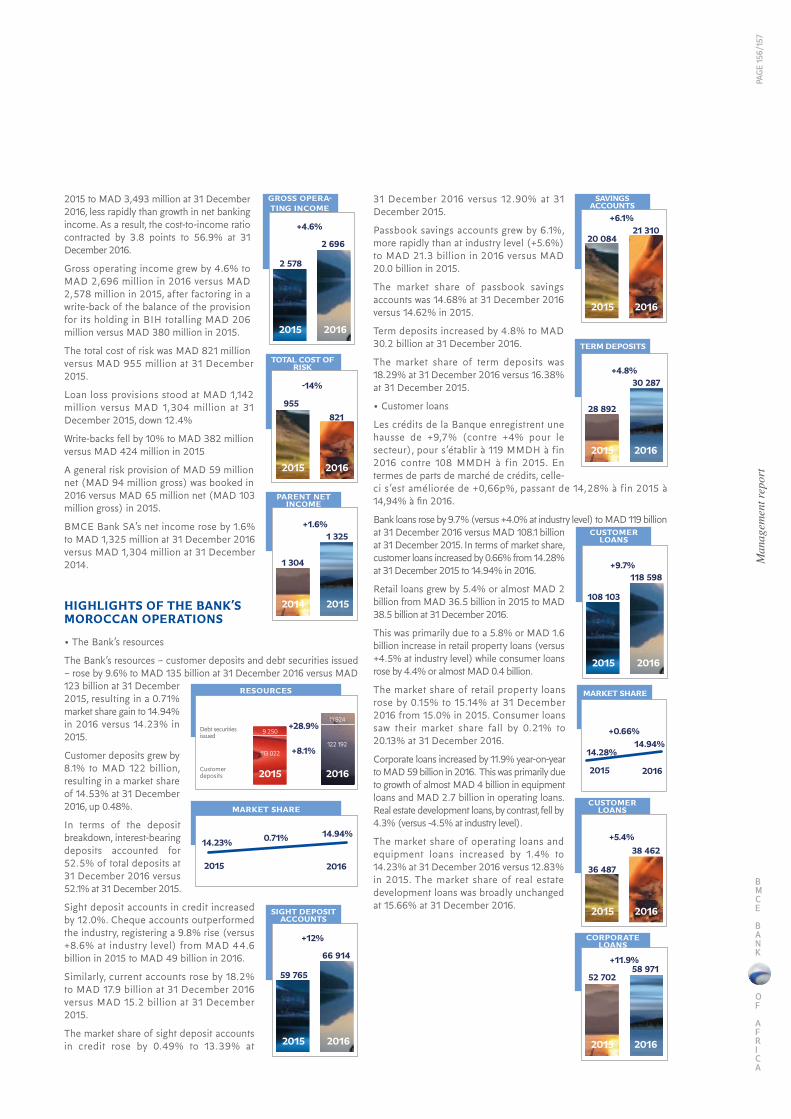
Man
agem
ent r
epor
t
2015 to MAD 3,493 million at 31 December 2016, less rapidly than growth in net banking income. As a result, the cost-to-income ratio contracted by 3.8 points to 56.9% at 31 December 2016.
Gross operating income grew by 4.6% to MAD 2,696 million in 2016 versus MAD 2,578 million in 2015, after factoring in a write-back of the balance of the provision for its holding in BIH totalling MAD 206 million versus MAD 380 million in 2015.
The total cost of risk was MAD 821 million versus MAD 955 million at 31 December 2015.
Loan loss provisions stood at MAD 1,142 million versus MAD 1,304 million at 31 December 2015, down 12.4%
Write-backs fell by 10% to MAD 382 million versus MAD 424 million in 2015
A general risk provision of MAD 59 million net (MAD 94 million gross) was booked in 2016 versus MAD 65 million net (MAD 103 million gross) in 2015.
BMCE Bank SA’s net income rose by 1.6% to MAD 1,325 million at 31 December 2016 versus MAD 1,304 million at 31 December 2014.
HIGHLIGHTS OF THE BANK’S MOROCCAN OPERATIONS
• The Bank’s resources
The Bank’s resources – customer deposits and debt securities issued – rose by 9.6% to MAD 135 billion at 31 December 2016 versus MAD 123 billion at 31 December 2015, resulting in a 0.71% market share gain to 14.94% in 2016 versus 14.23% in 2015.
Customer deposits grew by 8.1% to MAD 122 billion, resulting in a market share of 14.53% at 31 December 2016, up 0.48%.
In terms of the deposit breakdown, interest-bearing deposits accounted for 52.5% of total deposits at 31 December 2016 versus 52.1% at 31 December 2015.
Sight deposit accounts in credit increased by 12.0%. Cheque accounts outperformed the industry, registering a 9.8% rise (versus +8.6% at industry level) from MAD 44.6 billion in 2015 to MAD 49 billion in 2016.
Similarly, current accounts rose by 18.2% to MAD 17.9 billion at 31 December 2016 versus MAD 15.2 billion at 31 December 2015.
The market share of sight deposit accounts in credit rose by 0.49% to 13.39% at
31 December 2016 versus 12.90% at 31 December 2015.
Passbook savings accounts grew by 6.1%, more rapidly than at industry level (+5.6%) to MAD 21.3 billion in 2016 versus MAD 20.0 billion in 2015.
The market share of passbook savings accounts was 14.68% at 31 December 2016 versus 14.62% in 2015.
Term deposits increased by 4.8% to MAD 30.2 billion at 31 December 2016.
The market share of term deposits was 18.29% at 31 December 2016 versus 16.38% at 31 December 2015.
• Customer loans
Les crédits de la Banque enregistrent une hausse de +9,7% (contre +4% pour le secteur), pour s’établir à 119 MMDH à fin 2016 contre 108 MMDH à fin 2015. En termes de parts de marché de crédits, celle-ci s’est améliorée de +0,66p%, passant de 14,28% à fin 2015 à 14,94% à fin 2016.
Bank loans rose by 9.7% (versus +4.0% at industry level) to MAD 119 billion at 31 December 2016 versus MAD 108.1 billion at 31 December 2015. In terms of market share, customer loans increased by 0.66% from 14.28% at 31 December 2015 to 14.94% in 2016.
Retail loans grew by 5.4% or almost MAD 2 billion from MAD 36.5 billion in 2015 to MAD 38.5 billion at 31 December 2016.
This was primarily due to a 5.8% or MAD 1.6 billion increase in retail property loans (versus +4.5% at industry level) while consumer loans rose by 4.4% or almost MAD 0.4 billion.
The market share of retail property loans rose by 0.15% to 15.14% at 31 December 2016 from 15.0% in 2015. Consumer loans saw their market share fall by 0.21% to 20.13% at 31 December 2016.
Corporate loans increased by 11.9% year-on-year to MAD 59 billion in 2016. This was primarily due to growth of almost MAD 4 billion in equipment loans and MAD 2.7 billion in operating loans. Real estate development loans, by contrast, fell by 4.3% (versus -4.5% at industry level).
The market share of operating loans and equipment loans increased by 1.4% to 14.23% at 31 December 2016 versus 12.83% in 2015. The market share of real estate development loans was broadly unchanged at 15.66% at 31 December 2016.
PARENT NET INCOME
+1.6%
2014 2015
1 304
1 325
TERM DEPOSITS
+4.8%
2015 2016
28 892
30 287
CORPORATE LOANS
+11.9%
2015 2016
52 70258 971
TOTAL COST OF RISK
-14%
2015 2016
955821
SAVINGS ACCOUNTS
+6.1%
2015 2016
20 08421 310
CUSTOMER LOANS
+5.4%
2015 2016
36 487
38 462
MARKET SHARE
2015 2016
14.23%14.94%
GROSS OPERA-TING INCOME
+4.6%
2015 2016
2 578
2 696
CUSTOMER LOANS
+9.7%
2015 2016
108 103
118 598
SIGHT DEPOSIT ACCOUNTS
+12%
2015 2016
59 765
66 914
RESOURCES
+28.9%
+8.1%
Customer deposits
Debt securities issued
113 022
9 250
11 924
122 192
2015 2016
MARKET SHARE
2015 2016
14.28%14.94%
+0.66%
0.71%
PAGE
156/
157
BMCE
BANK
OF
AFRICA

NET BANKING INCOME
BMCE Bank SA’s net banking income rose by 14.2% to MAD 6,136 million in 2016 versus MAD 5,374 million in 2015.
Net interest income rose by 5.0% year-on-year from MAD 3,446 million in 2015 to MAD 3,609 million in 2016. This was due to:
A 10% improvement in the Bank’s intermediation margin on customer loans due to:
A 12.4% increase (+MAD 6.6 billion) in average non-interest-bearing deposits driven primarily by a rise in cheque accounts and current accounts.
A decline in average interest-bearing deposits as a result of a 33.8% fall (-MAD 3.5 billion) in average certificates of deposit together with a steep decline in average remuneration rates on passbook savings accounts to 1.88% at 31 December 2016 versus 2.28% in 2015 and on term deposits to 3.68% at 31 December 2016 versus 4.02% at 31 December 2015.
The Bank’s total funding costs improved by 29 basis points compared to 2015 to 1.52% at 31 December 2016 versus 1.81% in 2015.
In addition, average loan outstandings rose by 7.4% (+MAD 7.3 billion) in 2016.
ii- A decline in the cash margin following the Bank’s return to the money market for its refinancing needs in the wake of the rising cost of subordinated debt due to the Bank issuing a further MAD 2 billion of subordinated notes in 2016.
Fee income
Fee income rose by almost 8.5% to MAD 995 million at 31 December 2016 versus MAD 917 million at 31 December 2015, primarily due to:
- A MAD 47 million rise in fees from account maintenance and packages primarily due to an increase in inventory of packages sold.
- An 11% (+MAD 10 million) increase in payment card fees primarily due to an increase in royalties on the Visa Gold Card.
- Fees from loans rose by 26% or MAD 31 million mainly as a result of fees from personal loan overruns (+MAD 20 million).
• Income from market operations
Income from market operations rose by 68% to MAD 1,202 million at 31 December 2016 versus MAD 716 million at 31 December 2015 due to:
- A rise in the mutual fund portfolio’s yield from 2.9% to 3.4% resulting in increased capital gains in 2016, against a backdrop of declining Treasury bond yields together with proactive management of the market portfolio.
- Revaluation of the Treasury bond portfolio revealed an unrealised capital loss of almost MAD 196.5 million at 31 December 2016.
- Stock market gains in 2016 boosted the performance of the Maroc Valeurs equity mutual fund which registered a gain of MAD 73.4 million in 2016 versus a loss of MAD 15.7 million in 2015.
GENERAL OPERATING EXPENSES
General operating expenses rose by 7.1% to MAD 3,493 million at 31 December 2016 versus MAD 3,263 million at 31 December 2015.
- Employee expenses increased by 5.9% to MAD 1,540 million in 2016 due to a 2.5% rise in the number of employees (+129 FTE) in 2016, taking the total number of staff to 5,294 employees at 31 December 2016 in addition to an increase in staff bonuses.
- Other operating expenses rose by 8% from MAD 1,808 million in 2015 to MAD 1,953 million in 2016, mainly due to:
- An increase in the number of branches (26 new branches were opened), resulting in additional operating expenses (lease purchase agreements, specialised lines etc.) and
- Higher taxes resulting from the acquisition of property as dations in payment and from repurchase agreements with customers.
The cost-to-income ratio improved by 3.8 points to 56.9% at 31 December 2016 versus 60.7% at 31 December 2015.
COST OF RISK
The total cost of risk fell by 14% to MAD 821 million at 31 December 2016 versus MAD 955 million at 31 December 2015.
Net additional loan loss provisions amounted to MAD 1,201 million at 31 December 2016 versus MAD 1,369 million at 31 December 2015. It is worth noting that a general risk provision of MAD 59 million net (MAD 94 million gross) was booked in 2016 versus MAD 65 million net (MAD 103 million gross) in 2015.
Write-backs fell by 10% to MAD 382 million in 2016 versus MAD 423 million in 2015.
Outstanding provisions for non-performing loans increased by 16.3% from MAD 4,776 million in 2015 to MAD 5,556 million in 2016.
The loan-loss provision coverage ratio increased 67.01% at 31 December 2015 to 72.47% at 31 December 2016 and the non-performing loan ratio declined from 6.59% at 31 December 2015 to 6.46% at 31 December 2016.
BREAKDOWN OF NET BANKING INCOME
+11.6%
2015 2016
Income from market operations
Fee income
Net interest income
Other net income 295716
917 995
329
3 4463 609
1 202+68%+8.5%
+5%
NET INTEREST INCOME
+5%
2015 2016
3 446
3 609
FEES FROM ACCOUNT
MAINTENANCE, PAYMENT CARDS AND PACKAGES
+16.3%
2015 2016
353411
FEES FROM LOANS
+25.7%
2015 2016
120150
INCOME FROM MARKET
OPERATIONS
+68%
2015 2016
716
1 202
ADDITIONAL LOAN LOSSPROVISIONS AND WRITE-BACKS
20162015Reprises de provisions clientèleDotations aux provisions clientèle
382
1 201
423
1 369
COVERAGE RATIO
2015 2016
67.01%72.47%
NON-PERFORMING LOAN RATIO
2015 2016
6.59%6.46%

NET INCOME
BMCE Bank S.A’s net income rose by 1.6% to MAD 1,325 million at 31 December 2014 versus MAD 1,304 million at 31 December 2015.
SPECIALISED FINANCIAL SERVICES
ContributionSPECIA-LISED
FINANCIAL SERVICES
SALAFIN Maghrébail M.Factoring RM ExpertsEuler
Hermes Acmar
SPECIALISED FINANCIAL SERVICES
Dec-16Dec-15Dec-16Dec-15Dec-16Dec-15Dec-16Dec-15Dec-16Dec-15Dec-16Dec-15
Consolidated net banking income
785 644 249.8 245.9 300.4 463.7 94.0 70.3 0.0 4.8 na na
Change 22% -2% 54% -25%General expenses -232 -219 -91.0 -93.0 -70.7 -81.9 -17.3 -17.5 -39.8 -39.1 na na
Change -6% -2% -16% -1% 2%Cost of risk -86 45 -52.9 -46.7 91.5 -46.6 6.5 7.2 na na na naChange -291% 12% -151% 12%Net income 188 174 87.1 95.1 59.7 72.5 20.9 17.8 0.7 0.3 5.5 2.3Change 8% 9% 22% -15% -52% -58%
The Specialised Financial Services business line accounted for 9% of net income attributable to shareholders of the parent company. Its contribution rose by 8% in 2016.
Salafin saw its parent net income rise by 10.6% to MAD 138.5 million due to 4.7% growth in net banking income, good control of general operating expenses and an 11.5% drop in the cost of risk compared to 2015. Its contribution to net income attributable to shareholders of the parent company increased by 9% year-on-year from MAD 87.1 million to MAD 95.0 million.
Maghrébail’s parent net income increased by 35% year-on-year to MAD 87 million. Its contribution to net income attributable to shareholders of the parent company rose by 22%.
Maroc Factoring’s parent net income declined by 2% to MAD 15.1 million in 2016. Its contribution to consolidated net income attributable to shareholders of the parent company was MAD 17.8 million in 2016 versus MAD 21 million the previous year. This decline was due to the company’s decision to overhaul its business model to enable it to optimise its equity capital and leverage the expertise that it has acquired over the years in factoring.
RM Experts’ parent net income was MAD 6.3 million in 2016 versus MAD 8.4 million in 2015.
INVESTMENT BANKING AND ASSET MANAGEMENT
ContributionINVEST-MENT
BANKING BMCE Capital BK Bourse BK Gestion
Investment Banking & Asset Management Dec-16 Dec-15 Dec-16 Dec-15 Dec-16 Dec-15 Dec-16 Dec-15Consolidated net banking income 393.9 344.4 185.0 195.7 17.9 35.1 141.5 163.1Change 14% 6% 96% 15%General expenses -288.0 -267.7 -216.5-229.6 -13.0 -16.2 -38.2 -42.2Change -8% -6% -24% -10%Cost of risk -1.5 -6.4 -6.4 -1.5 0.0 0.0 0.0 0.0Change 76% 76%Net income 141.1 110.1 48.2 56.5 1.0 12.2 60.9 72.3Change 28% 17% 19%
The Investment Banking & Asset Management business line accounted for almost 7% of net income attributable to shareholders of the parent company. Its contribution rose by 28% from MAD 110.1 million in 2015 to MAD 141 million in 2016, due to a strong
performance from BMCE Capital Gestion and exceptional items at BMCE Capital Bourse.
BMCE Capital’s contribution to consolidated net income attributable to shareholders of the parent company grew by 17%.
BMCE Capital Bourse posted parent net income of MAD 25 million thanks to two extraordinary items: (i) MAD 18.4 million of capital gains on disposing of its 5.9% stake in the Casablanca Stock Exchange and (ii) an exceptional dividend of MAD 13.8 million received from the Exchange. BMCE Capital Bourse’s contribution to net income attributable to shareholders of the parent company was MAD 12 million in 2016 versus MAD 1 million in 2015.
BMCE Capital Gestion’s parent net income rose by 19% to MAD 72 million versus MAD 60.9 million in 2015.
OTHER MOROCCAN OPERATIONSMAROC
Contribution Others Locasom EAI CIDOther Moroccan operations Dec-16 Dec-15 Dec-16 Dec-15 Dec-16 Dec-15 Dec-16 Dec-15
Consolidated net banking income
142.7 147.3 147.3 142.7 na na na na
Change -3% -3%General expenses -77.8 -77.3 -77.3 -77.8 na na na na
Change -1% -1%Cost of risk -1.3 -1.2 -1.2 -1.3 na na na naChange -9% -9%Net income 48.8 47.5 37.6 39.1 -1.7 -2.8 11.7 12.4Change 3% 4% -63% 7%
BMCE Bank Group’s ‘Other operations’ include Locasom, EAI and CID, which together accounted for 2.4% of net income attributable to shareholders of the parent company.
Locasom, a subsidiary specialising in vehicle leasing, saw its parent net income rise by 8% to MAD 28 million. Its contribution to net income attributable to shareholders of the parent company increased by 4% to MAD 39 million in 2016 versus MAD 37.6 million in 2015.
EAI, a technology subsidiary established as a joint venture with RMA and CIC, saw its contribution to net income attributable to shareholders of the parent company fall from negative MAD 1.7 million to negative MAD 2.8 million.
CID, a subsidiary in which the Bank owns a 38.9% stake and which is consolidated under the equity method, saw its parent net income rise by 7% in 2016. Its contribution to net income attributable to shareholders of the parent company was MAD 12.4 million in 2016.
RESULTS AND CONTRIBUTIONS FROM OVERSEAS OPERATIONS
Contribution International Europe AfricaOverseas operations Dec-16 Dec-15 Dec-16 Dec-15 Dec-16 Dec-15Consolidated net banking income
6 143 5 800 446.1 501.4 5 354 5 642
Change 6% 12% 5%General expenses -3 518 -3 333 -208.9 -202.1 -3 124 -3 316
Change -6% 3% -6%Cost of risk -870 -929 -25.0 -29.8 -904.0 -840.3Change 6% -19% 7%Net income 844 779 170.9 183.1 608.0 660.7Change 8% 7% 9%
In 2016, the contribution from overseas operations to consolidated net income attributable to shareholders of the parent company rose by 8% from MAD 779 million to MAD 844 million, accounting for 41% of total net income attributable to shareholders of the parent company.
PARENT NET INCOME
+1.6%
2015 2016
1 304
1 325
Man
agem
ent r
epor
tPA
GE 15
8/15
9
BMCE
BANK
OF
AFRICA

This sharp rise was due to a 7% increase in the contribution from European operations and a 9% rise in the contribution from African operations.
EUROPEAN OPERATIONSBMCE International Holding (BIH) saw its contribution to net income attributable to shareholders of the parent company grow by 7% year-on-year to MAD 183 million in 2016. This was due to the impact from a fall in sterling following the Brexit referendum. In local currency terms, BIH’s consolidated net income rose by 21% from GBP 11.4 million to GBP 13.9 million.
Similarly, BMCE Bank International UK saw its contribution to net income attributable to shareholders of the parent company rise by 32% to MAD 138.7 million in 2016 versus MAD 105 million in 2015.
By contrast, BMCE Bank International Madrid’s contribution was MAD 44 million in 2016 versus MAD 65.6 million in 2015, down 32%. This was primarily due to an in increase in the cost of risk against a backdrop of regulatory tightening by the Spanish authorities, particularly regarding country risk management.
AFRICAN OPERATIONS
Contribution Africa BOA LCB BDMAfrican operations Dec-16 Dec-15 Dec-16 Dec-15 Dec-16 Dec-15 Dec-16 Dec-15Consolidated net banking income
5 642 5 354 5 038 5 318 315.6 323.7 na na
Change 5.4% 5,6% 2.6%General expenses -3 316 -3 124 -2 918 -3 114 -205.2 -201.2 na naChange -6% -7% 2%Cost of risk -840 -904 -907 -728 3.1 -112.1 na naChange 7% 20%Net income 660.7 608.0 498.2 577.1 30.8 3.6 79.0 80.1Change 9% 16% -88% 1%
Bank of Africa saw its contribution to net income attributable to shareholders of the parent company reach MAD 577 million in 2016, up 16% on 2015. As a result, it accounted for 28% of total net income attributable to shareholders of the parent company in 2016.Its contribution to total net banking income grew by 5.6% to MAD 5,318 million, accounting for 41% of total net banking income. BOA Group’s contribution to the cost of risk, after restatements under IFRS, totalled -MAD 728 million in 2016 versus -MAD 907 million in 2015.BOA Group’s net income attributable to shareholders of the parent company, based on local accounting standards, grew by 20% to MAD 67.3 million in 2016 versus EUR 56.2 million in 2015.La Congolaise de Banque saw its parent net income fall by 20% to EUR 4.3 million in 2016 versus EUR 5.3 million in 2015. Its contribution to net income attributable to shareholders of the parent company declined by 88%.Lastly, Banque de Développement du Mali, consolidated under the equity method, saw its contribution to net income attributable to shareholders of the parent company tread water at around MAD 80 million in 2016.
SUBSIDIARIES’ CONTRIBUTIONS TO THE BANK’S NET INCOME Contribution Déc. 15 % STR Déc. 16 % STR VARMOROCCAN OPERATIONS 1 177 60% 1 192 59% 1%BMCE BANK 845 43% 814 40% -4%SUBSIDIARIES 331 17% 378 19% 14%SPECIALISED FINANCIAL SERVICES 174 9% 188 9% 8%SALAFIN 87 4% 95 5% 9%MAGHREBAIL 60 3% 72 4% 22%MAROC FACTORING 21 1% 18 1%RM EXPERTS 0.7 0% 0.3 0%ACMAR 5.5 0% 2.3 0% -58%
INVESTMENT BANKING & ASSET MANAGEMENT 110 6% 141 7% 28%BMCE CAPITAL 48 2% 57 3% 17%BMCE CAPITAL BOURSE 1.0 0% 12 1%BMCE CAPITAL GESTION 61 3% 72 4% 19%OTHERS 48 2% 49 2% 3%LOCASOM 38 2% 39 2% 4%EAI -2 0% -3 0%CID 12 1% 12 1% 7%OVERSEAS OPERATIONS 779 40% 844 41% 8%EUROPE 171 9% 183 9% 7%AFRICA 608 31% 661 32% 9%BOA 498 25% 577 28% 16%LCB 31 2% 4 0% -88%BDM 79 4% 80 4% 1%NET INCOME 1 956 100% 2 036 100% 4%
ASSET-LIABILITY MANAGEMENT AT 31 DECEMBER 2016
Liquidity risk:
The Liquidity Coverage Ratio (LCR) was 117% at the parent level and 135% on a consolidated basis at 31 December 2016, above the 70% regulatory limit set by Bank Al-Maghrib for 20165.Interest rate risk:The results of stress tests carried out at 31 December 2016 on the impact from a 200 basis points change in interest rates on net interest income and the economic value of shareholders’ equity complied with the limits set by the ALCO committee.The impact from a 200 basis points change in interest rates on net interest income was estimated to be MAD 101 million or 1.7% of estimated 2016 net banking income, below ALCO’s 5% limit. The change in the economic value of shareholders’ equity in the event of a 200 basis points shock was estimated to be MAD 1,135 million or 6.7% of regulatory shareholders’ equity, which was also below the ALCO limit of 20%.
THE BANK’S GROWTH PROSPECTS
BMCE Bank of Africa Group continues to nurture its vision of being a universal, innovative, multi-African, synergistic and socially responsible bank.
For the next five years, the Group therefore intends to:
- Accelerate its rate of growth by expanding its branch network in Morocco and overseas by opening of one hundred or so branches in Morocco and Sub-Saharan Africa;- Maximise the Group’s presence in Africa via Bank of Africa, in Europe via BIH (corporate banking and trade finance) and via BMCE EuroServices in Migrant Banking;- Bolster Retaill Banking and Corporate Banking operations, particularly in the SME segment and develop new high-growth niche segment such as Participatory Banking and Green Business;- Implement the Convergence Programme aimed at structuring the Group, with emphasis placed on Risks, Ad Hoc and Permanent Control, Compliance, IT and Human Capital.It is worth recalling that, against a backdrop of growth in private sector lending and a consolidation of strategic holdings, the Bank bolstered its capital base in 2016 by issuing MAD 2 billion of additional subordinated debt. This came in the wake of three MAD 2 billion issues in 2015 and the MAD 1 billion issues in September 2014 and in January 2013.In addition, the Bank is committed to pursuing its efforts at cost reduction in a context of increased staffing to support the development of the branch network and the strengthening of head office functions. The Bank will also pursue its efforts at credit recovery and at cleaning up the loan portfolio to contain the cost of risk both in Morocco and overseas.

Annual General Meeting of 23rd May 2017
Having been convened by Mr Othman Benjelloun, Chairman & Chief Executive Officer, BMCE Bank’s Annual General Meeting of Shareholders met validly at 11 o’clock on 23rd May 2017 at the Head Office, 140 Avenue Hassan II, Casablanca, a quorum having been reached with the Shareholders present or represented at the meeting owning over a quarter of the shares carrying voting rights.
The Shareholders unanimously adopted in their entirety the fol-lowing resolutions which had been put before them by the Board of Directors.
FIRST RESOLUTION
The Annual General Meeting, having been read the Board of Direc-tors’ Management Report and the Statutory Auditors’ General and Special Reports, shall unreservedly approve these documents in their entirety. It shall also approve the financial statements for the financial year ended 31st December 2016.
The Annual General Meeting shall acknowledge that the individual financial statements as well as the results relating to BMCE Bank’s domestic operations, branch offices and subsidiaries and related statements of income (income statement and management accoun-ting statement), drawn up at 31st December 2016, reflect the Bank’s entire operations.
SECOND RESOLUTION
The Annual General Meeting shall acknowledge that annual income in respect of the financial year ended 31st December 2016 is as follows:
For the Moroccan operations 998,851,556.71 Dirhams
For the Paris branch office
Dirham equivalent of foreign currency value 84,328,562.11 Dirhams
For the BMCE Bank Offshore branch office
Dirham equivalent of foreign currency value 241,791,176.59 Dirhams
Resulting in net income of 1,324,971,295.41 Dirhams
As a result, the Annual General Meeting shall decide to appropriate income in respect of financial year 2016 as follows:
Net income 1,324,971,295.41 Dirhams
Ordinary dividend of 6% 107,678,034.00 Dirhams
Balance 1,217,293,261.41 Dirhams
Extraordinary dividend of 44% 789,638,916.00 Dirhams
Balance 427,654,345.41 Dirhams
Balance brought forward 61,929.21 Dirhams
Balance 427,716,274.62 Dirhams
To extraordinary reserves 427,700,000.00 Dirhams
Balance to be carried forward 16,274.62 Dirhams
The portfolio of subsidiaries and long-term investments generated dividends of MAD 512 million in financial year 2016.
Net write-backs for equity securities amounted to MAD 222 million. All the above items have been included in the parent financial sta-tements.
The Annual General Meeting shall set the dividend distribution at 5 dirhams per share.
This dividend will be paid on or after 11th July 2017 at the company’s head office, 140 Avenue Hassan II, Casablanca, BMCE Capital Titres. The dividend payment will be made by the transfer of coupon pay-ments into BMCE BANK’s account held in the ledgers of MARO-CLEAR.
THIRD RESOLUTION
The Annual General Meeting shall set the total gross amount of Directors’ fees in respect of the financial year ended 31st December 2016 at five million dirhams (MAD 5,000,000).
FOURTH RESOLUTION
The Annual General Meeting, having been read the Statutory Audi-tors’ Special Report on related party agreements referred to in Article 56 et seq. of Act No. 17-95, as amended and completed, relating to limited companies and Article 26 of the Memorandum and Articles of Association, shall approve the conclusions of the said report and the related party agreements mentioned therein.
FIFTH RESOLUTION
The Annual General Meeting shall acknowledge that the Bank’s Statutory Auditors, KPMG and FIDAROC GRANT THORNTON, will have completed their assignments in respect of the financial year ended 31st December 2016 in accordance with the applicable legal and statutory requirements.
SIXTH RESOLUTION
The Annual General Meeting shall wholly and unreservedly discharge the Directors of their management responsibilities in respect of the financial year ended 31st December 2016.
SEVENTH RESOLUTION
The Annual General Meeting, upon the proposal of the Board of Di-rectors, shall decide to appoint Mr Azeddine GUESSOUS, a Moroccan citizen, as a Director for a 6-year term of office, expiring at the Annual General Meeting convened to approve the financial statements for the financial year ended 31st December 2022.
EIGHTH RESOLUTION
The Annual General Meeting, upon the proposal of the Board of Di-rectors, shall decide to appoint Mrs Hadeel IBRAHIM, an Anglo-Su-danese citizen, as an Independent Director for a 6-year term of of-fice, expiring at the Annual General Meeting convened to approve the financial statements for the financial year ended 31st December 2022.
As a result, the company’s Board of Directors will be composed of the following twelve Directors:
1. Mr Othman BENJELLOUN, Chairman & Chief Executive Officer
2. La Banque Fédérative du Crédit Mutuel – BFCM – Groupe Crédit Mutuel – CIC, represented by Mr Michel LUCAS
3. La Caisse de Dépôt et de Gestion, represented by Mr Abdellatif ZAGHNOUN
4. RMA, represented by Mr Zouheir BENSAID
5. FinanceCom, represented by Mr Hicham EL AMRANI*
6. Mr Azeddine GUESSOUS
7. Mr François HENROT
8. Mr Brian C. MCK. HENDERSON
9. Mr Philippe DE FONTAINE-VIVE
10. Mr Christian DE BOISSIEU
11. Mrs Hadeel IBRAHIM
12. Mr Brahim BENJELLOUN-TOUIMI
Reso
lutio
nsPA
GE 16
0/16
1
BMCE
BANK
OF
AFRICA

NINTH RESOLUTIONWith Statutory Auditor FIDAROC GRANT THORNTON’s term of office of expiring at the end of the current Meeting, the Annual General Meeting shall decide, in accordance with Bank Al Maghrib’s regulatory directives relating to the rotation of statutory auditors, not to renew this term of office.
As a result, the Annual General Meeting shall wholly and unreservedly discharge FIDAROC GRANT THORNTON of its responsibilities.
The Annual General Meeting shall appoint ERNST & YOUNG as a Statutory Auditor for a 3-year term of office, expiring at the Annual General Meeting convened to approve the financial statements for the financial year ended 31st December 2019.
TENTH RESOLUTION
With Statutory Auditor KPMG’s term of office of expiring at the end of the current Meeting, the Annual General Meeting shall decide to renew KPMG’s term of office for a further three (3) financial years, expiring at the Annual General Meeting convened to approve the fi-nancial statements for the financial year ended 31st December 2019.
ELEVENTH RESOLUTION
The Annual General Meeting, having been read the Board of Di-rectors’ Report, shall authorise the Board to carry out issues of one or more perpetual subordinated bonds comprising a loss absorp-tion clause totalling up to one billion four hundred million dirhams (MAD 1,400,000,000), in accordance with the provisions of Articles 292-315 of Act No. 17-95 relating to limited companies, as amended and completed.
The bonds will be issued in one or more tranches by public offering on the domestic market within five (5) years.
The issued amount may be limited to the amount subscribed by investors in compliance with the provisions of Article 298 of Act No. 17-95 relating to limited companies.
TWELFTH RESOLUTION
The Annual General Meeting shall delegate full powers, by virtue of Article 294 of Act No. 17-95 relating to limited companies, as amended and completed, to the Board of Directors for the following purpose:
- To decide on and establish the features and final terms of the ap-proved subordinated bond issue(s) mentioned above
- To carry out the approved subordinated bond issue(s) mentioned above
- And, generally, to ensure that these bond issues comply with the applicable legal and regulatory requirements.
THIRTEENTH RESOLUTION
The Annual General Meeting shall acknowledge of the following changes to permanent representatives:
- The Director FinanceCom: Mr Hicham EL AMRANI* shall replace Mr Zouheir BENSAID for the remainder of the Director’s term of of-fice, that is to say, until the Annual General Meeting convened to rule on the financial statements for the year ended 31st December 2020;
- The Director RMA: Mr Zouheir BENSAID shall replace Mr Azed-dine GUESSOUS for the remainder of the Director’s term of office, that is to say, until the Annual General Meeting convened to rule on the financial statements for the year ended 31st December 2018.
FOURTEENTH RESOLUTION
The Annual General Meeting gives full powers to the bearer of the original or copy of this report to carry out all legal formalities.
(*) awaiting the approval of the Supervisory Authorities
VOTING RESULTS
The shareholders present or represented own 139,790,705 shares1 or 77.9% of the Company’s capital and voting rights.
Votes ‘For’ Votes ‘Against’
Abs-ten-
tions
Number of shares for which
voting intentions have been expressed
Total votes ‘For’ (%)
Resolu-tions Type Number of votes
1 Ordinary 139.790.705 - - 139.790.705 77.9%2 Ordinary 139.790.705 - - 139.790.705 77.9%3 Ordinary 139.790.705 - - 139.790.705 77.9%4 Ordinary 139.790.705 - - 139.790.705 77.9%5 Ordinary 139.790.705 - - 139.790.705 77.9%6 Ordinary 139.790.705 - - 139.790.705 77.9%7 Ordinary 139.790.705 - - 139.790.705 77.9%8 Ordinary 139.790.705 - - 139.790.705 77.9%9 Ordinary 139.790.705 - - 139.790.705 77.9%10 Ordinary 139.790.705 - - 139.790.705 77.9%11 Ordinary 139.790.705 - - 139.790.705 77.9%12 Ordinary 139.790.705 - - 139.790.705 77.9%13 Ordinary 139.790.705 - - 139.790.705 77.9%14 Ordinary 139.790.705 - - 139.790.705 77.9%
1 Each BMCE Bank share shall carry one voting right.
Statutory Auditors’ Audit Report
47, rue Allal Ben Abdellah20 000 CasablancaMaroc
To shareholder’s of BMCE BANK140, Avenue Hassan IICasablanca
11, Avenue Bir Kacem SouissiRabat
AUDIT REPORT ON THE CONSOLIDATED FINANCIAL STATEMENTSFOR THE FINANCIAL YEAR ENDED 31 DECMBER 2016
We have audited the attached consolidated financial statements of Banque Marocaine du Commerce Extérieur and its subsidiaries (BMCE Bank Group), comprising the balance sheet at 31 December 2016, the income statement, the statement of other comprehensive income, the statement of changes in shareholders’ equity and the cash flow statement as well as notes containing a summary of the main accounting policies and other explanatory notes. These financial statements show consolidated shareholders’ equity and equivalent of MAD 23,582,687 K, including consolidated net income of MAD 2,834,827 K.
Management’s responsibility
It is Management’s responsibility to prepare and present these financial statements to give a true and fair view of the company’s financial position in accordance with International Financial Reporting Standards (IFRS). This responsibility includes designing, implementing and maintaining internal control procedures regarding the drawing up and presentation of the financial statements to ensure that they free of material misstatement as a result of fraud or error and for making accounting estimates that are reasonable under the circumstances.
Auditor’s responsibility
It is our responsibility to express an opinion on these financial statements based on our audit. We carried out our audit in accordance with Moroccan accounting standards. These standards require that we comply with ethical requirements and plan and perform the audit to obtain reasonable assurance that the financial statements are free from material misstatement.
An audit involves implementing procedures to obtain audit evidence about the amounts and disclosures in the financial statements. The procedures adopted depend on the auditor’s judgement, including an assessment of the risks of material misstatement in the financial sta-tements as a result of fraud or error.
In making these risk assessments, the auditor takes into consideration the internal control procedures adopted by the entity regarding the drawing up and presentation of the financial statements so as to determine appropriate audit procedures under the circumstances and not for the purpose of expressing an opinion on the effectiveness of the said procedures. An audit also consists of assessing whether the accounting policies adopted are appropriate and whether the accounting estimates made by senior management are reasonable, as well as assessing the overall presentation of the financial statements.
We believe that the audit evidence obtained is sufficient and appropriate to provide a basis for our audit opinion.
Opinion on the financial statements
In our opinion, the financial statements referred to above in the first paragraph give, in all material aspects, a true and fair view of the financial position of BMCE Bank Group, comprising the persons and entities included within the scope of consolidation as at 31 December 2016 as well as its financial performance and cash flows over the same period, in accordance with the accounting principles and procedures described in the consolidated additional information statement.
Casablanca, 12 April 2017
The Statutory Auditors
Audi
t Rep
ort
PAGE
162/
163
BMCE
BANK
OF
AFRICA

Consolidated Financial StatementsAS OF DECEMBER 31,2016
I. CONSOLIDATED BALANCE SHEET, CONSOLIDATED INCOME STATEMENT, STATEMENT OF NET INCOME, STATEMENT OF CHANGES IN SHAREHOLDERS’ EQUITY, CASH FLOW STATEMENT AND SUMMARY OF ACCOUNTING POLICIES
1.1. CONSOLIDATED BALANCE SHEET
The consolidated financial statements at 31 december 2015 were approved by the board of directors on 27 march 2017.
ASSETS NOTES 2016 2015Cash and amounts due from central banks and post office banks 4.1 12 155 637 10 403 090 Financial assets at fair value through profit or loss 4.2 38 890 923 25 760 228 Derivatives used for hedging purposes 2 938 7 207 Available-for-sale financial assets 4.3 8 317 725 6 846 572 Loans and receivables due from credit institutions 4.4 21 221 229 20 971 036 Loans and receivables due from customers 4.5 179 774 222 173 279 696 Remeasurement adjustment on interest rate risk hedged assets - - Held-to-maturity financial assets 4.7 25 136 170 24 559 458 Current tax assets 4.8 414 191 63 550 Deferred tax assets 4.8 521 548 473 814 Accrued income and other assets 4.9 6 440 776 5 364 187 Non current assets held for sale - - Investment associates 4.10 631 268 585 787 Investment property 4.11 3 746 146 3 035 131 Property, plant and equipment 4.11 6 988 825 6 516 029 Intangible assets 4.11 828 970 703 525 Goodwill 4.12 852 310 852 310 TOTAL ASSETS 305 922 878 279 421 620
(In thousand MAD)
LIABILITIES & SHAREHOLDERS EQUITY NOTES 2016 2015Due to Central Banks and Post Office Banks - - Financial liabilities at fair value through profit or loss 4.2 2 098 276 2 046 594 Derivatives used for hedging purposes - - Due to credit institutions 4.4 49 708 268 51 176 027 Due to customers 4.5 190 050 335 178 255 021 Debt securities 4.6 13 186 303 8 967 697 Remeasurement adjustment on interest rate risk hedged portfolios - - Current tax liabilities 4.8 641 287 131 027 Deferred tax liabilities 4.8 1 198 242 1 130 452 Accrued expenses and other liabilities 4.9 14 278 900 6 315 040 Liabilities related to non-current assets held for sale - - Technical reserves of insurance companies - - Provisions for contingencies and charges 4.13 685 204 650 913 Subsidies, assigned public funds and special guarantee funds - - Subordinated debts 4.6 10 493 376 8 639 297 TOTAL DEBTS 282 340 191 257 312 068 Capital and related reserves 13 299 090 12 899 418 Consolidated reserves - - - Attributable to parent 2 934 250 2 101 501 - Non-controlling interests 4 520 991 4 381 320 Unrealized or deferred gains or losses, attributable to parent -9 794 65 587 Unrealized or deferred gains or losses, non-controlling interests 3 323 6 996 Net Income - - - Attributable to parent 2 036 186 1 955 535 - Non-controlling interests 798 641 699 195 TOTAL CONSOLIDATED SHAREHOLDERS’S EQUITY 23 582 687 22 109 552 TOTAL 305 922 878 279 421 620
(In thousand MAD)

Con
solid
ated
Fin
anci
al S
tate
men
ts
CONSOLIDATED INCOME STATEMENT NOTES 2016 2015 + Interests and similar income 14 505 242 13 502 956 - Interests and similar expense -5 259 644 -4 962 142 Net Interest income 2.1 9 245 598 8 540 814 + Fees received and commission income 2 572 675 2 290 577 - Fees paid and commission expense -455 730 -339 423 Net fee income 2.2 2 116 945 1 951 154 +/- Net gains or losses on financial instruments at fair value through profit or loss 2.3 982 990 441 412 +/- Net gains or losses on available for sale financial assets 2.4 229 923 211 536 Income from market transactions 1 212 913 652 948 + Other banking revenues 2.5 884 515 1 044 522 - Other banking expenses 2.5 -469 956 -372 633 Net Banking Income 12 990 015 11 816 805 - General Operating Expenses 2.9 -6 678 453 -6 261 222 - Allowances for depreciation and amortization PE and intangible assets 2.9 -696 947 -672 006 Gross Operating Income 5 614 615 4 883 577 - Cost of Risk 2.6 -1 616 531 -1 439 956 Operating Income 3 998 084 3 443 621 +/- Share in net income of companies accounted for by equity method 103 652 97 733 +/- Net gains or losses on other assets 2.7 -111 741 74 609 +/- Change in goodwill -31 514 Pre-tax earnings 3 958 481 3 615 963 +/- Corporate income tax 2.8 -1 123 654 -961 233 Net income 2 834 827 2 654 730 Non-controlling interests 798 641 699 195 Net income attributable to parent 2 036 186 1 955 535 Earnings per share 11,35 10,90 Diluted Earnings per share 11,35 10,90
(In thousand MAD)
1.2. CONSOLIDATED INCOME STATEMENT
1.3. STATEMENT OF NET INCOME AND GAINS AND LOSSES RECOGNISED DIRECTLY IN SHAREHOLDERS’ EQUITY
STATEMENT OF NET INCOME AND GAINS AND LOSSES RECOGNISED DIRECTLY IN SHAREHOLDERS’ EQUITY 2016 2015
Net income 2 834 827 2 654 730Currency tranlation adjustment -79 054 -68 049Reevaluation of available for sale financial assets -4 909 -1 354Reevaluation of hedging instruments -74 145 -66 695Reevaluation of fixed assets -74 145 -66 695Actuarial gains and losses on defined plans 0 0Proportion of gains and losses directly recognised in shareholders equityon companies consolidated under equity method 0 0
Total gains and losses directly recognised in shareholders equity -79 054 -68 049Net income and gains and losses directly recognised in shareholders equity 2 755 773 2 586 681attributable to parent 1 960 805 1 871 688Non-controlling interests 794 968 714 993
(In thousand MAD)
PAGE
164/
165
BMCE
BANK
OF
AFRICA

1.4. STATEMENT OF CHANGES IN SHAREHOLDER’S EQUITY
STATEMENT OF CHANGES IN SHAREHOLDER’S EQUITY
Share Capital
Reserves related to
stock
Treasury stock
Reserves & conso-lidated
earnings
Unrea-lised or
deferred gains or losses
Sharehol-der’s Equity attributable
to parent
Non-control-ling inte-
restsTotal
Ending balance of Shareholder’s Equity 12.31.2014 1 794 634 10 693 747 0 3 425 707 149 436 16 063 524 4 739 627 20 803 152Change in the accounting methods 0 0Beginning Balance of adjusted Shareholder’s Equity 12.31.2014 1 794 634 10 693 747 0 3 425 707 149 436 16 063 524 4 739 627 20 803 152
Operations on capital 411 037 -411 037 0 0Share-based payment plans 0 0Operations on treasury stock 0 0Dividends -788 651 -788 651 -452 274 -1 240 925Net income 1 955 535 1 955 535 699 195 2 654 730PP&E and intangible assets : Revaluations and disposals (A) 0 0
Financial instruments : change in fair Value and transfer to earnings (B) -82 495 -82 495 15 799 -66 696
Currency translation adjustments : Changes and transfer to earnings (C) -1 354 -1 354 -1 354
Avantages au personnel 0 0Unrealized or deferred gains or losses (A)+ (B) + (C) 0 -83 849 -83 849 15 799 -68 050Change in the scope of consolidation -68 567 -68 567 83 181 14 614Others -55 951 -55 951 1 983 -53 968Ending Balance of Shareholder’s Equity 12.31.2015 1 794 634 11 104 784 0 4 057 036 65 587 17 022 041 5 087 511 22 109 552Impact of changes in accounting methods 0 0Ending Balance of adjusted Shareholder’s Equity 12.31.2015 1 794 634 11 104 784 0 4 057 036 65 587 17 022 041 5 087 511 22 109 552
Operations on capital 399 672 -399 672 0 0Share-based payment plans 0 0Operations on treasury stock 0 0Dividends -947 308 -947 308 -455 689 -1 402 997Net income 2 036 186 2 036 186 798 641 2 834 827PP&E and intangible assets: Revaluations and disposals (E) 0 0
Financial instruments: change in fair Value and transfer to earnings (F) -70 472 -70 472 -3 673 -74 145
Currency translation adjustments: Changes and transfer to earnings (G) -4 909 -4 909 -4 909
IAS 19 R 0 0Unrealized or deferred gains or losses (E)+ (F) + (G) -75 381 -75 381 -3 673 -79 054Change in the scope of consolidation (*) 94 400 94 400 -68 140 26 260Others 129 794 129 794 -35 695 94 099Ending Balance of adjusted Shareholder’s Equity 12.31.2016 1 794 634 11 504 456 0 4 970 436 -9 794 18 259 732 5 322 955 23 582 687

1.5. CASH FLOW STATEMENTS AS OF DECEMBER 31st, 2016
1.5.1. Cash Flow Statement
CASH FLOW STATEMENT NOTE 2016 2015
Pre-tax net income 3 958 481 3 615 961 +/- Net depreciation/amortization expense on property, plant, and equipment and intangible assets
2.9 696 947 672 212
+/- Impairment of goodwill and other non- current assets 31 514 - +/- Impairment of financial assets -39 470 46 758 +/- Net allowances for provisions 2.6 1 633 772 952 970 +/- Share of earnings in subsidiaries accounted for by equity method 4.10 -103 652 -97 733 +/- Net loss (income) from investing activities -1 061 663 -822 557 +/- Net loss (income) from financing activities - - +/- Other movements -541 722 -165 751 Non monetary items included in pre-tax net income and other adjustments 615 726 585 900 +/- Cash flows related to transactions with credit institutions 59 915 6 870 435 +/- Cash flows related to transactions with customers -1 497 240 -355 618 +/- Cash flows related to transactions involving other financial assets and liabilities -3 358 590 -3 575 435 Dont Flux liés aux autres opérations affectant les titres de transaction -2 216 271 -2 235 371 +/- Cash flows related to transactions involving non financial assets and liabilities 701 528 -1 992 029 Dont Flux liés aux autres opérations affectant les dettes sur titres Empruntés 701 528 -1 884 371 +/- Taxes paid -560 317 -581 529 Net Increase (Decrease) in cash related to assets and liabilities generated by operating activities
-4 654 704 365 824
Net Cash Flows from Operating Activities -80 497 4 567 685 +/- Cash Flows related to financial assets and equity investments -1 425 337 -2 474 166 +/- Cash flows related to investment property 4.11 -728 257 -2 211 410 +/- Cash flows related to PP&E and intangible assets 4.11 -1 003 781 -1 361 288 Net Cash Flows from Investing Activities -3 157 375 -6 046 864 +/- Cash flows related to transactions with shareholders -1 088 198 -667 738 +/- Cash flows generated by other financing activities 6 291 591 -2 947 262 Net Cash Flows from Financing Activities 5 203 393 -3 615 000 Effect of movements in exchange rates on cash and equivalents -233 206 -164 613 Net Increase in Cash and equivalents 1 732 315 -5 258 792 Beginning Balance of Cash and Equivalents 5 956 947 11 215 740 Net Balance of cash accounts and accounts with central banks and post office banks 4.1 10 403 196 9 966 853 Net Balance of demand loans and deposits- credit institutions -4 446 249 1 248 887 Dont Prêt et Emprunt de trésorerie JJ -2 877 349 489 872 Ending Balance of Cash and Equivalents 7 689 262 5 956 947 Net Balance of cash accounts and accounts with central banks and post office banks 4.1 12 155 637 10 403 196 Net Balance of demand loans and deposits- credit institutions -4 466 375 -4 446 249 Dont Prêt et Emprunt de trésorerie JJ -1 153 270 -2 877 349 Net increase in cash and equivalents 1 732 315 -5 258 792
2016 2015
Dividends received 2.4 240 014 218 305 Dividends paid 1.5 -1 402 997 -1 240 925 Interest received 12 532 242 12 290 029 Interest paid -3 771 219 -3 366 255
Con
solid
ated
Fin
anci
al S
tate
men
tsPA
GE 16
6/16
7
BMCE
BANK
OF
AFRICA

1.6. SUMMARY OF ACCOUNTING POLICIES APPLIED BY THE GROUP
1.6.1. Applicable accounting standardsThe first consolidated financial statements to be prepared by BMCE Bank Group in accordance with international accounting standards (IFRS) were those for the period ended 30 June 2008 with an opening balance on 1 January 2007.
The consolidated financial statements of BMCE Bank Group have been prepared in accordance with international accounting standards (International Financial Reporting Standards – IFRS), as approved by the IASB.
The Group has not opted for early adoption of the new standards, amendments and interpretations adopted by the IASB where retrospective application is permitted.
1.6.2. Consolidation principlesa. Scope of consolidation
The scope of consolidation includes all Moroccan and foreign entities in which the Group directly or indirectly holds a stake.
BMCE Bank Group includes within its scope of consolidation all entities, whatever their activity, in which it directly or indirectly holds 20% or more of existing or potential voting rights. In addition, it consolidates entities if they meet the following criteria:
- The subsidiary’s total assets exceed 0.5% of the parent company’s;
- The subsidiary’s net assets exceed 0.5% of the parent company’s;
- The subsidiary’s banking income exceeds 0.5% of the parent company’s;
- “Cumulative” thresholds which ensure that the combined total of entities excluded from the scope of consolidation does not exceed 5% of the consolidated total.
b. Consolidation methods
The method of consolidation adopted (fully consolidated or accounted for under the equity method) will depend on whether the Group has full control, joint control or exercises significant influence.
At 31 December 2015, no Group subsidiary was jointly controlled.
c. Consolidation rules
The consolidated financial statements are prepared using uniform accounting policies for reporting like transactions and other events in similar circumstances.
Elimination of intragroup balances and transactionsIntragroup balances arising from transactions between consolidated companies, and the transactions themselves, including income, expenses and dividends, are eliminated. Profits and losses arising from intragroup sales of assets are eliminated, except where there is an indication that the asset sold is impaired.
Translation of financial statements prepared in foreign currenciesBMCE Bank Group’s consolidated financial statements are prepared in dirhams. The financial statements of companies whose functional currency is not the dirham are translated using the closing rate method. Under this method, all assets and liabilities, both monetary and non-monetary, are translated using the spot exchange rate at the balance sheet date. Income and expenditures are translated at the average rate for the period.
d. Business combinations and measurement of goodwillCost of a business combination The cost of a business combination is measured as the aggregate fair value of assets acquired, liabilities incurred or assumed and equity instruments issued by the acquirer in consideration for control of the acquired company. Costs attributable to the acquisition are recognised through income.
Allocating the cost of a business combination to the assets acquired and liabilities incurred or assumed The Group allocates, at the date of acquisition, the cost of a business combination by recognising those identifiable assets, liabilities and contingent liabilities of the acquired company which meet the criteria for fair value recognition at that date.
Any difference between the cost of the business combination and the Group’s share of the net fair value of the identifiable assets, liabilities and contingent liabilities is recognised under goodwill.
GoodwillAt the date of acquisition, goodwill is recognised as an asset. It is initially measured at cost, that is, the difference between the cost of the business combination over the Group’s share of the net fair value of the identifiable assets, liabilities and contingent liabilities.
The Group has adopted from 2012 the “full goodwill” method for new acquisitions. This method consists of measuring goodwill based on the difference between the cost of the business combination and minority interests over the fair value of the identifiable assets, liabilities and contingent liabilities.
It is worth noting that the Group has not restated business combinations occurring before 1 January 2008, the date of first-time adoption of IFRS, in accordance with IFRS 3 and as permitted under IFRS 1.
Measurement of goodwillIn accordance with IAS 36, impairment tests must be conducted whenever there is any indication of impairment that a unit may be impaired and at least once a year to ensure that the goodwill recognised for each CGU does not need to be written down.
At 31 December 2015, the Group conducted impairment test to ensure that the carrying amount of cash-generating units was still lower than the recoverable amount.
The recoverable amount of a cash-generating unit is the higher of the net fair value of the unit and its value in use.
Fair value is the price that is likely to be obtained from selling the CGU in normal market conditions.
Value in use is based on an estimate of the current value of future cash flows generated by the unit’s activities as part of the Bank’s market activities:
- If the subsidiary’s recoverable amount is more than the carrying amount, then there is no reason to book an impairment charge;
- If the subsidiary’s recoverable amount is less than the carrying amount, the difference is recognised as an impairment charge. It will be allocated to goodwill as a priority and subsequently to other assets on a pro-rata basis.
The Bank has employed a variety of methods for measuring CGU value in use depending on the subsidiary. These methods are based on assumptions and estimates:
- A revenue-based approach, commonly known as the “dividend discount model”, is a standard method used by the banking industry. The use of this method depends on the subsidiary’s business plan and will value the subsidiary based on the net present value of future

dividend payments. These flows are discounted at the cost of equity.
- The “discounted cash flow method” is a standard method for measuring firms in the services sector. It is based on discounting available cash flows at the weighted average cost of capital.
Step acquisitions
In accordance with revised IFRS 3, the Group does not calculate additional goodwill on step acquisitions once control has been obtained.
In particular, in the event that the Group increases its percentage interest in an entity which is already fully consolidated, the difference at acquisition date between the cost of acquiring the additional share and share already acquired in the entity is recognised in the Group’s consolidated reserves.
1.6.3. Financial assets and liabilitiesa. Loans and receivablesLoans and receivables include credit provided by the Group.
Loans and receivables are initially measured at fair value or equivalent, which, as a general rule, is the net amount disbursed at inception including directly attributable origination costs and certain types of fees or commission (syndication commission, commitment fees and handling charges) that are regarded as an adjustment to the effective interest rate on the loan.
Loans and receivables are subsequently measured at amortised cost. The income from the loan, representing interest plus transaction costs and fees and commission included in the initial value of the loan, is calculated using the effective interest method and taken to income over the life of the loan.
b. SecuritiesClassification of securities
Securities held by the Group are classified under one of three categories.
Financial assets at fair value through P&L
This category includes financial assets and liabilities held for trading purposes. They are measured at fair value at the balance sheet date under “financial assets at fair value through P&L”. Changes in fair value are recognised in the income statement under “Net gains or losses on financial instruments at fair value through P&L”.
It is worth noting that the Group has not designated, on initial recognition, non-derivative financial assets and liabilities at fair value through income using option available under IAS 39.
An instrument many only bedesignated at fair value through profit or loss if the following conditions are met:
- If designation were to eliminate or significantly reduce any inconsistency in the instrument’smeasurement or recognition which would arise if designated otherwise;
- If a group of financial assets, financial liabilities or both were to be managed and its performance assessed on a fair value basis in accordance with a documented risk management or investment strategy;
- If the economic characteristics and risks of an embedded derivative were not closely related to those of the host contract (see Appendix A, paragraphs AG30 and AG33);
Financial assets and financial liabilities at fair value through profit are loss are recognised in the balance sheet at fair value.
Changes in the fair value of financial assets and liabilities are recognised as losses or gains in the P&L.
Interest income is recognised under interest income and expenses while dividends are recognised under other operating income if the right to payment has been established.
It is worth underlining that the Group has not designated,on initial recognition,any non-derivative financial asset or liability at fair value through profit or lossas per the option offered by IAS 39.
In 2013, the Bank issued a USD 300 million fixed rate international bond. This bond is hedged by a swap with the same characteristics as those of the bond (a fixed rate versus a variable rate). This transaction is qualified as a fair value hedging relationship.
The bond and the swap are therefore recognised at fair value through profit or loss.
The change in the fair value attributable to changes in credit risk resulted in a gain of MAD 1.6 million. The cumulative impact is MAD 19 million. Own credit default risk is calculated on the basis ofhistorical data on default rates and that of credit ratings agencies.
The amount that the Bank will be obliged to pay at maturity is MAD 27.5 million more than the current carrying amount.
Held-to-maturity financial assets
Held-to-maturity financial assets include securities with fixed or determinable payments and fixed maturity securities that the Group has the intention and ability to hold until maturity.
Assets in this category are accounted for at amortised cost using the effective interest method, which builds in amortisation of premium and discount, corresponding to the difference between the asset’s purchase price and redemption value and acquisition costs, if material. They may be written down, if applicable, in the event of issuer default. Income earned from this category of assets is included in “Interest and similar income” in the income statement.
Available-for-sale financial assets
Available-for-sale financial assets are fixed income and floating rate securities other than those classified under the two previous categories.
Assets included in the available-for-sale category are initially recognised at fair value plus transaction costs, if material. At the balance sheet date, they are re-measured at fair value, with changes in fair value shown on a separate line in shareholders’ equity. Upon disposal, these unrealised gains and losses are transferred from shareholders’ equity to the income statement, where they are shown on the line “Net gains or losses on available-for-sale financial assets”. The same applies in the event of impairment.
Income recognised using the effective interest method for fixed income available-for-sale securities is recorded under “Interest and similar income” in the income statement.
Dividend income from floating rate securities is recognised under “Net gains or losses on available-for-sale financial assets” when the Group’s right to receive payment is established.
Temporary acquisitions and salesRepurchase agreementsSecurities subject to repurchase agreements are recorded in the Group’s balance sheet in their original category.
The corresponding liability is recognised in the under “Borrowings” as a liability on the balance sheet.
Securities temporarily acquired under reverse repurchase agreements are not recognised in the Group’s balance sheet. The corresponding receivable is recognised under “Loans and receivables”.
Con
solid
ated
Fin
anci
al S
tate
men
tsPA
GE 16
8/16
9
BMCE
BANK
OF
AFRICA

Securities lending and borrowing transactions
Securities lending transactions do not result in de-recognition of the lent securities while securities borrowing transactions result in recognition of a debt on the liabilities side of the Group’s balance sheet.
Date of recognition of securities transactions
Securities recognised at fair value through income or classified under held-to-maturity or available-for-sale financial assets are recognised at the trade date.
Regardless of their classification (recognised as loans and receivables or debt), temporary sales of securities as well as sales of borrowed securities are initially recognised at the settlement date.
These transactions are carried on the balance sheet until the Group’s rights to receive the related cash flows expire or until the Group has substantially transferred all the risks and rewards related to ownership of the securities.
c. Foreign currency transactionsMonetary assets and liabilities denominated in foreign currenciesMonetary assets and liabilities denominated in foreign currencies are translated into the functional currency of the relevant Group entity at the closing rate. Translation differences are recognised in the income statement, except for those arising from financial instruments earmarked as a cash flow hedge or a net foreign currency investment hedge, which are recognised in shareholders’ equity.
d. Impairment and restructuring of financial assetsImpairment of loans and receivables and held-to-maturity financial assets, provisions for financing and guarantee commitmentsAt each balance sheet date, the Group determines whether there is objective evidence of impairment to a financial asset or group of financial assets as a result of an event or several events occurring after initial recognition, whether this event affects the amount or timing of future cash flows and whether the consequences of the event can be reliably measured.
The Group assesses, in the first instance, whether there is objective evidence of impairment on an individual basis for individually material assets or on a collective basis for financial assets which are not individually material.
If the Group determines that there is no objective evidence of impairment to a financial asset, whether considered individually material or not, it includes this asset within a group of financial assets with a similar credit risk profile and subjects them to an impairment test on a collective basis.
At an individual level, objective evidence that a financial asset is impaired includes observable data relating to the following events:
- The existence of accounts which are past the due date;
- Any knowledge or evidence that the borrower is experiencing significant financial difficulty, such that a risk can be considered to have arisen, regardless of whether the borrower has missed any payments;
- Concessions in respect of the credit terms granted to the borrower that the lender would not have considered had the borrower not been experiencing financial difficulty.
Impairment is measured as the difference between the carrying amount and the present value, discounted at the asset’s original effective interest rate, of those components (principal, interest, collateral, etc.) regarded as recoverable.
The Group’s portfolio doubtful loan portfolio is categorised as follows :
Individually material loans : Each of these loans is reviewed individually in order to estimate recovery payments and determine recovery schedules. Impairment under IFRS relates to the difference between amounts owing and the net present value of expected recovered payments.
Non-individually material loans : Loans not reviewed on an individual basis are segmented into different risk categories having similar characteristics and are assessed using a statistical model, based on historical data, of annual recovery payments by each risk category.
Counterparties not showing any evidence of impairment These loans are risk-assessed on a portfolio basis with similar characteristics. This assessment draws upon historical data, adjusted if necessary to reflect circumstances prevailing at the balance sheet date. This analysis enables the Group to identify counterparty groups which, as a result of events occurring since inception of the loans, have collectively acquired a probability of default at maturity that provides objective evidence of impairment of the entire portfolio but without it being possible at that stage to allocate the impairment to individual counterparties.
This analysis also estimates the loss relating to the portfolios in question, taking account of trends in the economic cycle during the assessment period.
Based on the experienced judgement of the Bank’s divisions or Risk Division, the Group may recognise additional collective impairment provisions in respect of an economic sector or geographical region affected by exceptional economic events. In this regard the Group established watch lists of the accounts at risk.
Provisions and provision write-backs are recognised in the income statement under “Cost of risk” while the theoretical income earned on the carrying amount of impaired loans is recognised under “Interest and similar income” in the income statement.
ForbearanceThe Bank complies with IFRS requirements in matters of forbearance agreements, particularly with regard to discounts applied to restructured loans.The amount deducted is recognised under cost of risk. If the restructured loan is subsequently reclassified as a performing loan, it is reinstatedunder net interest income over the remaining term of the loan.
Impairment of available-for-sale financial assets
Impairment of “available-for-sale financial assets”, which mainly comprise equity instruments, is recognised through income if there is objective evidence of impairment as a result of one or more events occurring since acquisition.
The Group has determined two types of non-cumulative impairment for equity instruments recorded under “available-for-sale financial assets”. The first one is a significant decline in the security’s price. By “significant” is implied a fall of more than 40% from the acquisition price. The second is a prolonged decline, defined as an unrealised loss over a one-year period.
For financial instruments quoted on a liquid market, impairment is determined using quoted prices and, for unquoted financial instruments, is based on valuation models.
For unquoted equity instruments, the impairment criteria applied are as follows :
- The growing likelihood that the debtor could become bankrupt or undertake any other financial reorganisation;
- The disappearance of an active market for that financial asset because of thedebtor ’s financial difficulties; or observable data
indicating that there is a measurable decrease in the estimated future cash flows from a group of financial assets since initial recognition ofthose assets, even though the decrease cannot yet be identified with theindividual financial assets in the group.
Impairment losses taken against equity securities are recognised as a component of net banking income under “Net gains or losses on available-for-sale financial assets” and may only be reversed through income after these securities are sold. Any subsequent decline in fair value constitutes an additional impairment loss, recognised in through income.
In the case of debt instruments, impairment is assessed on the basis of the same criteria applied to loans and receivables, that is, on an individual basis if there is objective evidence of impairment or on a collective basis if there is no evidence of impairment.
Given the characteristics of its portfolio, the Group is not concerned by debt instruments.
Restructuring of assets classed as “Loans and receivables”An asset classified in “Loans and receivables” is considered to be restructured due to the borrower’s financial difficulty when the Group, for economic or legal reasons related to the borrower’s financial difficulty, agrees to modify the terms of the original transaction that it would not otherwise consider, resulting in the borrower’s contractual obligation to the Group, measured at present value, being reduced compared with the original terms.
At the time of restructuring, a discount is applied to the loan to reduce its carrying amount to the present value of the new expected future cash flows discounted at the original effective interest rate.
The decrease in the asset value is recognised through income under “Cost of risk”.
For each loan, the discount is recalculated at the renegotiation date using original repayment schedules and renegotiation terms.
The discount is calculated as the difference between :
- The sum, at the renegotiation date, of the original contractual repayments discounted at the effective interest rate; and
- The sum, at the renegotiation date, of the renegotiated contractual repayments discounted at the effective interest rate. The discount, net of amortisation, is recognised by reducing loan outstandings through income. Amortisation will be recognised under net banking income.
e. Issues of debt securitiesFinancial instruments issued by the Group are qualified as debt instruments if the Group company issuing the instruments has a contractual obligation to deliver cash or another financial asset to the holder of the instrument. The same applies if the Group is required to exchange financial assets or liabilities with another entity on terms that are potentially unfavourable to the Group, or to deliver a variable number of the Group’s treasury shares.
In the Group’s case, this concerns certificates of deposit issued by Group banks such as BMCE BANK and BANK OF AFRICA as well as notes issued by finance companies MAGHREBAIL and SALAFIN.
f. Treasury sharesThe term “treasury shares” refers to shares of the parent company, BMCE BANK SA and its fully consolidated subsidiaries.
“Treasury shares” refer to shares issued by the parent company, BMCE Bank SA, or by its fully consolidated subsidiaries. Treasury shares held by the Group are deducted from consolidated shareholders’ equity regardless of the purpose for which they are held. Gains and losses arising on such instruments are eliminated from the consolidated income statement.
As of December 31, 2015, the Group does net hold any treasury shares.
g. Derivative instrumentsAll derivative instruments are recognised in the balance sheet on the trade date at the trade price and are re-measured to fair value on the balance sheet date.
Derivatives held for trading purposes are recognised “Financial assets at fair value through income” when their fair value is positive and in “Financial liabilities at fair value through income” when their fair value is negative.
Realised and unrealised gains and losses are recognised in the income statement under “Net gains or losses on financial instruments at fair value through income”.
h. Fair value measurement of own credit default risk (DVA) / counterparty risk (CVA)Since the value of derivative products has not been material until now, the Bank will continue to monitor the extent to which this factor is significant in order to take into consideration fair value adjustments relating to its own credit default risk (DVA) / counterparty risk (CVA).
i. Determining the fair value of financial instrumentsFair value is defined as the amount for which an asset could be exchanged, or a liability settled, between knowledgeable, willing parties in an arm’s length transaction.
Financial assets classified under “Financial assets at fair value through income” and “Available-for-sale financial assets” are measured at fair value.
Fair value in the first instance relates to the quoted price if the financial instrument is traded on a liquid market.
If no liquid market exists, fair value is determined by using valuation techniques (internal valuation models as outlined in Note 4.15 on fair value).
Depending on the financial instrument, these involve the use of data taken from recent arm’s length transactions, the fair value of substantially similar instruments, discounted cash flow models or adjusted book values.
Characteristics of a liquid market include regularly available prices for financial instruments and the existence of real arm’s length transactions.
Characteristics of an illiquid market include factors such as a significant decline in the volume and level of market activity, a significant variation in available prices between market participants or a lack of recent observed transaction prices.
j. Income and expenses arising from financial assets and liabilitiesThe effective interest rate method is used to recognise income and expenses arising from financial instruments, which are measured at amortised cost.
The effective interest rate is the rate that exactly discounts estimated future cash flows through the expected life of the financial instrument or, when appropriate, a shorter period, to the net carrying amount of the asset or liability in the balance sheet. The effective interest rate calculation takes into account all fees received or paid that are an integral part of the effective interest rate of the contract, transaction costs, and premiums and discounts.
Con
solid
ated
Fin
anci
al S
tate
men
tsPA
GE 17
0/17
1
BMCE
BANK
OF
AFRICA

k. Cost of risk“Cost of risk” includes impairment provisions net of write-backs and provisions for credit risk, losses on irrecoverable loans and amounts recovered on amortised loans as well as provisions and provision write-backs for other risks such as operating risks.
l. Offsetting financial assets and liabilitiesA financial asset and a financial liability are offset and the net amount presented in the balance sheet if, and only if, the Group has a legally enforceable right to offset the recognised amounts and intends either to settle on a net basis or to realise the asset and settle the liability simultaneously.
1.6.4. Property plant and equipment and intangible as-setsa. Property, plant and equipmentThe Group has opted for the cost model to measure property, plant and equipment and intangible assets.
It is worth noting that, in application of the option provided under IFRS 1, the Group has chosen to measure certain items of property, plant and equipment at the transition date at their fair value and use this fair value as deemed cost at this date.
In accordance with IAS 23, borrowing costs directly attributable to the acquisition are included in the acquisition cost of items of property, plant and equipment.
As soon as they are available for use, items of property, plant and equipment are amortised over the asset’s estimated useful life.
Given the character of BMCE Bank Group’s property, plant and equipment, it has not adopted any residual value except for transport equipment owned by LOCASOM, a subsidiary.
In respect of the Group’s other assets, there is neither a sufficiently liquid market nor a replacement policy over a period that is considerably shorter than the estimated useful life for any residual value to be adopted.
This residual value is the amount remaining after deducting from the acquisition cost all allowable depreciable charges.
Given the Group’s activity, it has adopted a component-based approach for property. The option adopted by the Group is a component-based amortised cost method by applying using a component-based matrix established as a function of the specific characteristics of each of BMCE Bank Group’s buildings.
Component-based matrix adopted by BMCE Bank
Head office property Other property
Period QP Period QPStructural works 80 55% 80 65%Façade 30 15%General & technical installations 20 20% 20 15%
Fixtures and fittings 10 10% 10 20%
ImpairmentThe Group has deemed that impairment is only applicable to buildings and, as a result, the market price (independently-assessed valuation) will be used as evidence of impairment.
b. Investment property
IAS 40 defines investment property as property held to earn rentals or for capital appreciation or both. An investment property generates cash flows that are largely independent from the company’s other
assets in contrast to property primarily held for use in the production or supply of goods or services.
The Group qualifies investment property as any non-operating property.
BMCE Bank Group has opted for the cost method to value its investment property. The method used to value investment property is identical to that for valuing operating property.
In accordance with the requirements of paragraph 79(e) of IAS 40, the Group has investment properties whose acquisition cost is deemed to be substantially material valued by external surveyors at each balance sheet date (cf. 4.15 on fair value).
c. Intangible assets
Intangible assets are initially measured at cost which is equal to the amount of cash or cash equivalent paid or any other consideration given at fair value to acquire the asset at the time of its acquisition or construction.
Subsequent to initial recognition, intangible assets are measured at cost less cumulative amortisation and impairment losses.
The amortisation method adopted reflects the rate at which future economic benefits are consumed.
Impairment is recognised when evidence (internal or external) of impairment exists. Evidence of impairment is assesses at each balance sheet date.
Given the character of the intangible assets held, the Group considers that the concept of residual value is not relevant in respect of its intangible assets. As a result, residual value has not been adopted.
1.6.5. LeasesGroup companies may either be the lessee or the lessor in a lease agreement.
Leases contracted by the Group as lessor are categorised as either finance leases or operating leases.
a. Lessor accounting
Finance leasesIn a finance lease, the lessor transfers the substantial portion of the risks and rewards of ownership of an asset to the lessee. It is treated as a loan made to the lessee to finance the purchase of the asset.
The present value of the lease payments, plus any residual value, is recognised as a receivable.
The net income earned from the lease by the lessor is equal to the amount of interest on the loan and is taken to the income statement under “Interest and other income”. The lease payments are spread over the lease term and are allocated to reducing the principal and to interest such that the net income reflects a constant rate of return on the outstanding balance. The rate of interest used is the rate implicit in the lease.
Individual and portfolio impairments of lease receivables are determined using the same principles as applied to other loans and receivables.
Operating leasesAn operating lease is a lease under which the substantial portion of the risks and rewards of ownership of an asset are not transferred to the lessee.
The asset is recognised under property, plant and equipment in the lessor’s balance sheet and depreciated on a straight-line basis over the lease term. The depreciable amount excludes the asset’s residual value. The lease payments are taken to the income statement in full

on a straight-line basis over the lease term.
Lease payments and depreciation expenses are taken to the income statement under “Income from other activities” and “Expenses from other activities”.
b. Lessee accountingLeases contracted by the Group as lessee are categorised as either finance leases or operating leases.
Finance leasesA finance lease is treated as an acquisition of an asset by the lessee, financed by a loan. The leased asset is recognised in the balance sheet of the lessee at the lower of fair value or the present value of the minimum lease payments calculated at the interest rate implicit in the lease.
A matching liability, equal to the fair value of the leased asset or the present value of the minimum lease payments, is also recognised in the balance sheet of the lessee. The asset is depreciated using the same method as that applied to owned assets after deducting the residual value from the amount initially recognised over the useful life of the asset. The lease obligation is accounted for at amortised cost.
Operating leasesThe asset is not recognised in the balance sheet of the lessee. Lease payments made under operating leases are taken to the lessee’s income statement on a straight-line basis over the lease term.
1.6.6. Non-current assets held for sale and discontinued activitiesAn asset is classified as held for sale if its carrying amount is obtained through the asset’s sale rather than through its continuous use in the business.
At 31 December 2015, the Group did not recognise any assets as held for sale or discontinued activities.
1.6.7. Employee benefitsClassification of employee benefitsa. Short-term benefitsShort-term benefits are due within twelve months of the close of the financial year in which employees provided the corresponding services. They are recognised as expenses in the year in which they are earned.
b. Defined-contribution post-employment benefitsThe employer pays a fixed amount in respect of contributions into an external fund and has no other liability. Benefits received are determined on the basis of cumulative contributions paid plus any interest and are recognised as expenses in the year in which they are earned.
c. Defined-benefit post-employment benefits
Defined-benefit post-employment benefits are those other than defined-contribution schemes. The employer undertakes to pay a certain level of benefits to former employees, whatever the liability’s cover. This liability is recognised as a provision.
The Group accounts for end-of-career bonuses as defined-benefit post-employment benefits: these are bonuses paid on retirement and depend on employees’ length of service.
d. Long-term benefitsThese are benefits which are not settled in full within twelve after the
employee rendering the related service. Provisions are recognised if the benefit depends on employees’ length of service.
The Group accounts for long-service awards as long-term benefits: these are payments made to employees when they reach 6 different thresholds of length of service ranging from 15 to 40 years.
e. Termination benefitsTermination benefits are made as a result of a decision by the Group to terminate a contract of employment or a decision by an employee to accept voluntary redundancy. The company may set aside provisions if it is clearly committed to terminating an employee’s contract of employment.
Principles for calculating and accounting for defined-benefit post-employment benefits and other long-term benefits
a. Calculation method The recommended method for calculating the liability under IAS 19 is the “projected unit credit” method. The calculation is made on an individual basis. The employer’s liability is equal to the sum of individual liabilities.
Under this method, the actuarial value of future benefits is determined by calculating the amount of benefits due on retirement based on salary projections and length of service at the retirement date. It takes into consideration variables such as discount rates, the probability of the employee remaining in service up until retirement as well as the likelihood of mortality.
The liability is equal to the actuarial value of future benefits in respect of past service within the company prior to the calculation date. This liability is determined by applying to the actuarial value of future benefits the ratio of length of service at the calculation date to length of service at the retirement date.
The annual cost of the scheme, attributable to the cost of an additional year of service for each participant, is determined by the ratio of the actuarial value of future benefits to the anticipated length of service on retirement.
b. Accounting principlesA provision is recognised under liabilities on the balance sheet to cover for all obligations.
Actuarial gains or losses arise on differences related to changes in assumptions underlying calculations (early retirement, discount rates etc.) or between actuarial assumptions and what actually occurs (rate of return on pension fund assets etc.) constitute.
They are amortised through income over the average anticipated remaining service lives of employees using the corridor method.
The past service cost is spread over the remaining period for acquiring rights.
The annual expense recognised in the income statement under “Salaries and employee benefits” in respect of defined-benefit schemes comprises:
- The rights vested by each employee during the period (the cost of service rendered) ;
- The interest cost relating to the effect of discounting the obligation ;
- The expected income from the pension fund’s investments (gross rate of return);
- The effect of any plan curtailments or settlements.
1.6.8. Share-based paymentsThe Group offers its employees the possibility of participating in share issues in the form of share purchase plans.
Con
solid
ated
Fin
anci
al S
tate
men
tsPA
GE 17
2/17
3
BMCE
BANK
OF
AFRICA

New shares are offered at a discount on the condition that they retain the shares for a specified period.
The expense related to share purchase plans is spread over the vesting period if the benefit is conditional upon the beneficiary’s continued employment.
This expense, booked under “Salaries and employee benefits”, with a corresponding adjustment to shareholders’ equity, is calculated on the basis of the plan’s total value, determined at the allotment date by the Board of Directors.
In the absence of any market for these instruments, financial valuation models are used that take into account performance-based criteria relating to the BMCE Bank share price. The plan’s total expense is determined by multiplying the unit value per option or bonus share awarded by the estimated number of options or bonus shares acquired at the end of the vesting period, taking into account the conditions regarding the beneficiary’s continued employment.
1.6.9. Provisions recorded under liabilities Provisions recorded under liabilities on the Group’s balance sheet, other than those relating to financial instruments and employee benefits mainly relate to restructuring, litigation, fines, penalties and tax risks.
A provision is recognised when it is probable that an outflow of resources providing economic benefits will be required to settle an obligation arising from a past event and a reliable estimate can be made about the obligation’s amount. The amount of such obligations is discounted in order to determine the amount of the provision if the impact of discounting is material.
A provision for risks and charges is a liability of uncertain timing or amount.
The accounting standard provides for three conditions when an entity must recognise a provision for risks and charges:
- A present obligation towards a third party ;
- An outflow of resources is probable in order to settle the obligation;
- The amount can be estimated reliably.
1.6.10. Current and deferred taxes
The current income tax charge is calculated on the basis of the tax laws and tax rates in force in each country in which the Group has operations.
Deferred taxes are recognised when temporary differences arise between the carrying amount of an asset or liability in the balance sheet and its tax base.
A deferred tax liability is a tax which is payable at a future date. Deferred tax liabilities are recognised for all taxable temporary differences other than those arising on initial recognition of goodwill or on initial recognition of an asset or liability for a transaction which is not a business combination and which, at the time of the transaction, has not impact on profit either for accounting or tax purposes.
A deferred tax asset is a tax which is recoverable at a future date. Deferred tax assets are recognised for all deductible temporary differences and unused carry-forwards of tax losses only to the extent that it is probable that the entity in question will generate future taxable profits against which these temporary differences and tax losses can be offset.
The Group has opted to assess the probability of recovering deferred tax assets.
Deferred taxes assets are not recognised if the probability of recovery is uncertain. Probability of recovery is ascertained by the business projections of the companies concerned.
1.6.11. Cash flow statementThe cash and cash equivalents balance is composed of the net balance of cash accounts and accounts with central banks and the net balances of sight loans and deposits with credit institutions.
Changes in cash and cash equivalents related to operating activities reflect cash flows generated by the Group’s operations, including cash flows related to investment property, held-to-maturity financial assets and negotiable debt instruments.
Changes in cash and cash equivalents related to investing activities reflect cash flows resulting from acquisitions and disposals of subsidiaries, associates or joint ventures included in the consolidated group, as well as acquisitions and disposals of property, plant and equipment excluding investment property and property held under operating leases.
Changes in cash and cash equivalents related to financing activities reflect the cash inflows and outflows resulting from transactions with shareholders, cash flows related to subordinated debt, bonds and debt securities (excluding negotiable debt instruments).
1.6.12. Use of estimates in the preparation of the financial statements
Preparation of the financial statements requires managers of business lines and corporate functions to make assumptions and estimates that are reflected in the measurement of income and expense in the income statement and of assets and liabilities in the balance sheet and in the disclosure of information in the notes to the financial statements.
This requires the managers in question to exercise their judgement and to make use of information available at the time of preparation of the financial statements when making their estimates.
The actual future results from operations where managers have made use of estimates may in reality differ significantly from those estimates depending on market conditions. This may have a material impact on the financial statements.
Those estimates which have a material impact on the financial statements primarily relate to:
- Impairment (on an individual or collective basis) recognised to cover credit risks inherent in banking intermediation activities ;
Other estimates made by the Group’s management primarily relate to :
- Goodwill impairment tests ;
- Provisions for employee benefits;
- The measurement of provisions for risks and charges.

II. NOTES TO THE INCOME STATEMENT FOR THE YEAR ENDED 31 DECEMBER 2016
2.1. NET INTEREST INCOME
Includes net interest income (expense) related to customer and interbank transactions, debt securities issued by the Group, the trading portfolio (fixed income securities, repurchase agreements, loan / borrowing transactions and debts securities), available for sale financial assets and held-to-maturity financial assets.
NET INTEREST INCOME2016 2015
Income Expense Net Income Expense NetCustomer Items 10 346 197 3 163 407 7 182 790 9 885 496 3 089 650 6 795 846Deposits, loans and borrowings 9 688 738 3 062 214 6 626 524 9 361 634 2 973 026 6 388 608Repurchase agreements 101 193 -101 193 116 624 -116 624Finance leases 657 459 657 459 523 862 523 862Interbank items 825 329 1 292 729 -467 400 887 565 916 517 -28 952Deposits, loans and borrowings 606 763 1 172 157 -565 394 623 683 877 403 -253 720Repurchase agreements 218 566 120 572 97 994 263 882 39 114 224 768Debt securities issued 0 0 0 0 0 0Cash flow hedge instruments 0 0 0 0 0 0Interest rate portfolio hedge instruments 0 0 0 0 0 0Trading book 1 908 668 803 508 1 105 160 1 341 654 955 975 385 679Fixed income securities 1 908 668 463 711 1 444 957 1 341 654 623 022 718 632Repurchase agreements 0 0Loans/borrowings 0 0Debt securities 0 339 797 -339 797 0 332 953 -332 953Available for sale financial assets 0 0Held to maturity financial assets 1 425 048 1 425 048 1 388 241 1 388 241TOTAL 14 505 242 5 259 644 9 245 598 13 502 956 4 962 142 8 540 814
(In thousand MAD)
As of December 31, 2016, the net interest income increased by 8.3% compared as of December 31, 2015 and amounted 9 245 million MAD. This variation is mainly due to an increase of income related to trading portfolio, which amounted 1 909 million MAD as of December 31, 2016 versus 1 342 million MAD as of December 31, 2015.
NET FEE INCOME2016 2015
Income Expense Net Income Expense NetNet fee on transactions 1 900 141 242 909 1 657 232 1 575 303 164 300 1 411 003
With credit institutions - - With customers 1 336 588 1 336 588 1 125 822 1 125 822 On custody 267 138 112 548 154 590 196 168 97 622 98 546 On foreign exchange 296 415 130 361 166 054 253 313 66 678 186 635 On financial instruments and off balance sheet - -
Banking and financial services 672 534 212 821 459 713 715 274 175 123 540 151 Income from mutual funds management - - Income from electronic payment services 365 244 55 540 309 704 361 150 49 371 311 779 Insurance - - Other 307 290 157 281 150 009 354 124 125 752 228 372 NET FEE INCOME 2 572 675 455 730 2 116 945 2 290 577 339 423 1 951 154
(In thousand MAD)
Net fee income covers fees from interbank market and the money market, customer transactions, securities transactions, foreign exchange transactions, securities commitments, financial transactions derivatives and financial services.
Con
solid
ated
Fin
anci
al S
tate
men
tsPA
GE 17
4/17
5
BMCE
BANK
OF
AFRICA

2.3. NET GAINS ON FINANCIAL INSTRUMENTS AT FAIR VALUE THROUGH PROFIT OR LOSS
This entry includes all items of income (excluding interest income and expenses, classified under «Net interest income» as described above) relating to financial instruments managed within the trading book.
This covers gains and losses on disposals, gains and losses related to mark-to-market, as well as dividends from variable-income securities..
NET GAINS ON FINANCIAL INSTRU-MENTS AT FAIR VALUE THROUGH profit or loss
2016 2015
Trading Book
Assets measured under the fair value
option
Total Trading Book
Assets measured under the fair value
option
Total
Fixed income and variable income securities 976 350 976 350 466 807 466 807Derivative instruments 6 746 -106 6 640 -27 077 1 682 -25 395Repurchase agreementsLoansBorrowingsRemeasurement of interest rate risk hedged portfoliosRemeasurement of currency positionsTOTAL 983 096 -106 982 990 439 730 1 682 441 412
(In thousand MAD)
As of December 31, 2016, net gains on financial instruments at fair value through profit rose by 123% compared to December 31, 2015.
This variation is mainly due to an increase of yield of fixed and variable income from 467 million MAD in 2015 to 976 million MAD in 2015.
2.4. NET GAINS ON AVAILABLE-FOR-SALE FINANCIAL ASSETS
This section includes :
- Dividends and other income from equities and other floating rate securities classified as financial assets available for sale ;
- Gains and losses on disposals of fixed and floating rate securities classified as available for sale financial assets ;
- Impairment provisions on floanting rate securities, classified as available for sale financial assets.
NET GAINS ON AVAILABLE-FOR-SALE FINANCIAL ASSETS 2016 2015Fixed income securities 0 0Disposal gains and lossesEquity and other variable-income securities 229 923 211 536Dividend income 240 014 218 305Impairment provisions -10 091 -5 314Net disposal gains 0 -1 455TOTAL 229 923 211 536
(In thousand MAD)
As of December 31, 2016, net gains on available-for-sale financial assets increased significantly compared to 31 December 2015 and amounted MAD 230 million. This variation is mainly due to the increase in dividend income, which amounted nearly MAD 218 million in 2015, compared to MAD 240 million in 2016

2.5. NET INCOME FROM OTHER ACTIVITIES
NET INCOME FROM OTHER ACTIVITIES2016 2015
Income Expense Net Income Expense NetNet income from insurance activities - - Net income from investment property - - - - - - Net income from assets held under operating leases 270 114 111 298 158 816 269 116 104 725 164 391 Net income from property development activities - - - - - - Other banking income & expenses 258 049 96 299 161 750 383 325 218 872 164 453 Other operating income 356 352 262 359 93 993 392 081 49 036 343 045 TOTAL NET INCOME FROM OTHER ACTIVITIES 884 515 469 956 414 559 1 044 522 372 633 671 889
(In thousand MAD)
2.6. COST OF RISK
Includes expenses arising from the manifestation of credit risk and counterparty disputes inherent in the banking business conducted with stakeholders. Net impairment non covered by such risk allocations are classified in the income statement according to their type.
Cost of risk for the period
COST OF RISK FOR THE PERIOD 2016 2015Impairment provisions -2 355 213 -2 571 528Impairment provisions on loans and advances -2 310 117 -2 444 843Impairment provisions on held to maturity financial assets (excluding interest rate risks)Provisions on off balance sheet commitments -8 643 -13 059Other provisions for contingencies and charges -36 453 -113 626Write back of provisions 721 441 1 618 558Write back of impairment provisions on loans and advances 669 887 1 475 347Write back of impairment provisions on held to maturity financial assets (excluding interest rate risks)Write back of provisions on off balance sheet commitments 0 1 575Write back of other provisions for contingencies and charges 51 554 141 636Changes in provisions 17 241 -486 986Losses on counterparty risk on available for sale financial assets (fixed income securities)Losses on counterparty risk held to maturity financial assets Loss on irrecoverable loans and advances not covered by impairment provisions Loss on irrecoverable loans and advances covered by impairment provisions -11 102 -529 326Discount on restructured products Recoveries on amortized loans and advances 28 343 42 340Losses on off balance sheet commitments Other lossesCost of Risk -1 616 531 -1 439 956
(In thousand MAD)
Cost of risk for the period
COST OF RISK FOR THE PERIOD 2016 2015Net allowances to impairment -1 633 772 -952 971Recoveries on loans and receivables previously written off 28 343 42 340Irrecoverable loans and receivables not covered by impairment provisions -11 102 -529 325TOTAL COST OF RISK FOR THE PERIOD -1 616 531 -1 439 956
(In thousand MAD)
Con
solid
ated
Fin
anci
al S
tate
men
tsPA
GE 17
6/17
7
BMCE
BANK
OF
AFRICA

Cost of risk for the period asset type
COST OF RISK FOR THE PERIOD ASSET TYPE 2016 2015Loans and Receivables due from credit institutionsloans and receivables due from customers -1 622 989 -1 456 481Available for sale financial assetsHeld to maturity financial assetsFinancial assets from market transactionsOthersCommitments and others 6 458 16 525Total cost of risk for the period -1 616 531 -1 439 956
(In thousand MAD)
2.7. NET GAINS ON OTHER ASSETS
NET GAINS ON OTHER ASSETS 2016 2015PP&E and intangible assets used in operations 0 0Capital gains on disposalsCapital losses on disposals Equity interests 0 0Capital gains on disposals 0Capital losses on disposals 0 0Others* -111 741 74 609Net Gain/Loss on Other Assets -111 741 74 609
(In thousand MAD)
2.8. INCOME TAX
2.8.1. Current and deferred tax
CURRENT AND DEFERRED TAX 2016 2015Current tax 414 191 63 550Deferred tax 521 548 473 814Current and deferred tax assets 935 740 537 364Current tax 641 287 131 027Deferred tax 1 198 242 1 130 452Current and deferred tax liabilities 1 839 530 1 261 479
(In thousand MAD)
2.8.2. Net income tax expense
NET INCOME TAX EXPENSE 2016 2015Current tax expense -1 078 191 -790 809Net deferred tax expense -45 463 -170 424Net Corporate income tax expense -1 123 654 -961 233
(In thousand MAD)
2.8.3. Effective tax rate
EFFECTIVE TAX RATE 2016 2015Net income 2 834 827 2 654 730Net corporate income tax expense -1 123 654 -961 233Average effective tax rate 39,6% 36,2%
(In thousand MAD)

Analysis of effective tax rate
ANALYSIS OF EFFECTIVE TAX RATE 2016 2015 Standard tax rate 37,0% 37,0% Differential in tax rates applicable to foreign entities Reduced tax rate Permanent differences Change in tax rate Déficit reportable Other items 2,6% -0,8% Average effective tax rate 39,6% 36,2%
(In thousand MAD)
2.9 - GENERAL OPERATING EXPENSES
GENERAL OPERATING EXPENSES 2016 2015Staff expenses 3 511 124 3 275 478Taxes 120 407 104 508External expenses 1 585 443 1 486 180Other general operating expenses 1 461 479 1 395 056Allowances for depreciation and provisions of tangible and intangible assets 696 947 672 006General operating expenses 7 375 400 6 933 228
(In thousand MAD)
General operating expenses increased by 6.38% between 2015 and 2016, from MAD 6,933 million at December 31, 2015 to MAD 7,375 million at December 31, 2016.
This variation can be explained by a 7.19% increase in staff expenses, from MAD 3,275 million in 2015 to MAD 3,511 million in 2016, and by the increase in other operating expenses (including taxes, Amortization and other external expenses) of 5.65% from MAD 3,658 million in 2015 to MAD 3,864 million in 2016
Con
solid
ated
Fin
anci
al S
tate
men
tsPA
GE 17
8/17
9
BMCE
BANK
OF
AFRICA

III. SEGMENT INFORMATIONBMCE Bank Group is composed of four core business activities for accounting and financial information purposes:
- Banking in Morocco : includes BMCE Bank’s Moroccan business;
- Asset management and Investment banking : includes investment banking (BMCE Capital), securities brokerage (BMCE Capital Bourse) and asset management (BMCE Capital Gestion) ;
- Specialised financial services : includes consumer credit (Salafin), leasing (Maghrébail), factoring (Maroc Factoring), recovery (RM Experts) and credit insurance (Acmar) ;
- International activities : includes BMCE International (Madrid), Banque de Développement du Mali, La Congolaise de Banque, BMCE Bank International and Bank Of Africa.
3.1. EARNINGS BY BUSINESS LINE
2016
EARNINGS BY BUSINESS LINE Activity in morocco
Invest-ment
Banking
Specialised financial services
OthersInterna-tional
activitiesTotal
Net interest Income 3 645 136 69 037 761 297 -16 351 4 786 479 9 245 598Net Fee income 1 030 566 169 988 12 501 0 903 890 2 116 945Net Banking Income 5 525 326 393 864 784 994 142 682 6 143 149 12 990 015General Operating Expenses & allowances for depreciation and amortization -3 260 377 -288 018 -231 504 -77 796 -3 517 705 (7 375 400)
Operating Income 2 264 949 105 846 553 490 64 886 2 625 444 5 614 615Corporate income tax -605 905 -47 661 -181 653 -17 920 -270 515 (1 123 654)Net Income Attributable to shareholders of the parent 814 518 141 073 188 023 48 758 843 814 2 036 186
2015Net interest Income 3 517 004 32 488 620 546 -17 635 4 388 411 8 540 814Net Fee income 963 811 150 168 13 519 0 823 656 1 951 154Net Banking Income 4 880 905 344 371 644 205 147 277 5 800 047 11 816 805General Operating Expenses & allowances for depreciation and amortization -3 037 457 -267 747 -218 765 -77 284 -3 331 975 (6 933 228)
Operating Income 1 843 447 76 625 425 441 69 993 2 468 071 4 883 577Corporate income tax -464 940 -48 930 -151 203 -16 773 -279 387 ( 961 233)Net Income Attributable to shareholders of the parent 845 170 110 059 173 887 47 536 778 883 1 955 535
(In thousand MAD)

3.2. ASSETS AND LIABILITIES BY BUSINESS ACTIVITY
2016
ASSETS AND LIABILITIES BY BUSI-NESS ACTIVITY
Activity in morocco
Invest-ment
Banking
Specialised financial services
OthersInterna-tional
activitiesTotal
Total assets 205 383 601 979 684 9 234 390 183 128 90 142 075 305 922 878Assets itemsAvailable for sale assets 2 249 497 101 026 19 718 20 464 5 927 020 8 317 725Customer loans 117 079 106 121 14 702 011 0 47 992 984 179 774 222Financial assets at fair value 38 499 389 208 390 207 0 182 937 38 890 923Held to maturity assets 4 188 468 0 0 0 20 947 702 25 136 170Liabilities & shareholders equity itemsCustomer deposits 131 000 917 17 908 600 0 58 140 801 190 050 335Shareholder’s Equity 15 463 646 315 561 1 478 662 ( 32 906) 6 357 724 23 582 687
2015Total assets 187 904 186 724 956 7 343 858 214 288 83 234 332 279 421 620Assets itemsAvailable for sale assets 2 141 161 107 685 17 265 20 365 4 560 096 6 846 572Customer loans 113 592 597 109 14 680 785 0 45 006 205 173 279 696Financial assets at fair value 25 275 085 122 281 207 0 362 655 25 760 228Held to maturity assets 4 328 349 0 0 0 20 231 109 24 559 458Liabilities & shareholders equity itemsCustomer deposits 121 110 279 2 616 1 107 886 0 56 034 240 178 255 021Shareholder’s Equity 14 966 626 263 520 1 422 829 ( 35 622) 5 492 199 22 109 552
(In thousand MAD)
3.3. BREAKDOWN OF LOANS AND RECEIVABLES
Breakdown of loans and receivables to credit institutions by geographical region
BREAKDOWN OF LOANS AND RECEIVABLES TO CREDIT INSTITUTIONS BY GEOGRAPHICAL REGION2016 2015
PERFORMING LOANS NPLS PROVISIONS PERFORMING
LOANS NPLS PROVISIONS
Morocco 13 781 032 58 620 58 620 13 272 891 58 616 58 616Europe 3 145 671 0 0 3 127 517 0 0Subsaharian Africa 4 275 686 27 760 8 920 4 554 179 24 100 7 651Total 21 202 389 86 380 67 540 20 954 587 82 716 66 267Allocated debtsProvisionsNet Value 21 202 389 86 380 67 540 20 954 587 82 716 66 267
(In thousand MAD)
Breakdown of loans to customer by georgraphical region
BREAKDOWN OF LOANS TO CUSTOMER BY GEORGRAPHICAL REGION2016 2015
PERFORMING LOANS
NPLSINDIVIDUAL PROVISIONS
COLLECTIVE PROVISIONS
PERFORMING LOANS
NPLSINDIVIDUAL PROVISIONS
COLLECTIVE PROVISIONS
Morocco 128 534 813 9 353 560 4 358 705 1 748 430 125 168 158 8 419 017 3 904 848 1 408 837Europe 3 885 045 205 958 85 332 0 3 816 758 110 303 32 658 0Subsaharian Africa 41 432 888 5 150 768 2 424 641 171 702 38 924 773 4 204 443 1 936 574 80 839Net Value 173 852 746 14 710 286 6 868 678 1 920 132 167 909 689 12 733 763 5 874 080 1 489 676
(In thousand MAD)
Con
solid
ated
Fin
anci
al S
tate
men
tsPA
GE 18
0/18
1
BMCE
BANK
OF
AFRICA

Change in impairment for loans due from customers
2016 2015TOTAL PROVISIONS AT BEGINNING OF THE PERIOD 7 363 756 6 877 560Provisions 2 369 128 2 464 842Write-backs of provisions -708 909 -1 421 577Use of provisions -174 476 -522 094Change in currency parities and other -60 689 -34 975TOTAL PROVISIONS AT END OF THE PERIOD 8 788 810 7 363 756
(In thousand MAD)
Change in impairment for loans due from credit institutions
2016 2015TOTAL PROVISIONS AT BEGINNING OF THE PERIOD 66 267 68 353 Provisions 1 273 Write-backs of provisions -2 086
Use of provisions - - Change in currency parities and otherTOTAL PROVISIONS AT END OF THE PERIOD 67 540 66 267
(In thousand MAD)
IV. NOTES TO THE BALANCE SHEET FOR THE YEAR ENDED 31 DECEMBER 2015
4.1. CASH, AMOUNTS DUE FROM CENTRAL BANKS, BANKS AND THE POST OFFICE
CASH, AMOUNTS DUE FROM CENTRAL BANKS, BANKS AND THE POST OFFICE 2016 2015
Cash 3 391 893 3 562 741Central banks 7 922 511 5 998 648Treasury 836 575 836 959Giro 4 658 4 742Central banks, treasury, giro 8 763 744 6 840 349Cash, central banks, treasury, giro 12 155 637 10 403 090
(In thousand MAD)

4.2. ASSETS AND LIABILITIES AT FAIR VALUE THROUGH PROFIT OR LOSS
Financial assets and liabilities recognised at fair value through income consist of negotiated transactions for trading purposes.
ASSETS AND LIABILITIES AT FAIR VALUE THROUGH PROFIT OR LOSS
2016 2015
Trading book
Assets desig-nated at fair
value through profit or loss
Total Trading book
Assets desig-nated at fair
value through profit or loss
Total
Financial assets at fair value through profit or lossNegotiable certificates of deposits 16 099 331 16 099 331 4 746 066 4 746 066Treasury bills and other eligible for central bank refinancing 14 101 323 14 101 323 4 235 874 4 235 874
Other negotiable certificates of deposits 1 998 008 1 998 008 510 192 510 192Bonds 3 231 539 3 231 539 1 518 833 1 518 833Government bonds 881 003 881 003 616 244 616 244Other bonds 2 350 536 2 350 536 902 589 902 589Equities and other variable income securities 19 533 271 19 533 271 19 490 636 19 490 636Repurchase agreementsLoansTo credit institutionsTo corporate customersTo private individual customersTrading Book Derivatives 26 782 26 782 4 693 4 693Currency derivatives 26 205 26 205 4 089 4 089Interest rate derivatives 577 577 604 604Equity derivativesCredit derivativesOther derivativesTotal financial assets at fair value through profit or loss 38 890 923 38 890 923 25 760 228 25 760 228
Of which loaned securitiesExcluding equities and other variable-income securitiesFinancial liabilities at fair value through profit or lossBorrowed securities and short sellingRepurchase agreementsBorrowings 2 037 621 2 037 621 1 999 324 1 999 324Credit institutions 2 037 621 2 037 621 1 999 324 1 999 324Corporate customersDebt securitiesTrading Book Derivatives 60 655 60 655 47 270 47 270Currency derivatives 60 655 60 655 47 270 47 270Interest rate derivativesEquity derivativesCredit derivativesOther derivativesTotal financial liabilities at fair value through profit or loss 60 655 2 037 621 2 098 276 47 270 1 999 324 2 046 594
(In thousand MAD)
Con
solid
ated
Fin
anci
al S
tate
men
tsPA
GE 18
2/18
3
BMCE
BANK
OF
AFRICA

4.3. AVAILABLE-FOR-SALE FINANCIAL ASSETS
Available-for-sale financial assets are non-derivative financial assets other than those classified as:
a) Loans and receivables;
b) Held-to-maturity financial assets;
c) Financial assets at fair value through profit or loss.
AVAILABLE-FOR-SALE FINANCIAL ASSETS 2016 2015
Negotiable certificates of deposit 0 0Treasury bills and other bills eligible for central bank refinancingOther negotiable certificates of depositBonds 5 501 553 4 112 360Government bonds 3 970 101 2 833 016Other bonds 1 531 452 1 279 344Equities and other variable-income securities 3 251 983 3 153 573Of which listed securities 316 103 319 930Of which unlisted securities 2 935 880 2 833 643Total available-for-sale financial assets, before impairment provisions 8 753 536 7 265 933Of which unrealized gains and losses -435 811 -419 361Of which fixed-income securitiesOf which loaned securities -435 811 -419 361Total available-for-sale financial assets, net of impairment provisions 8 317 725 6 846 572Of which fixed-income securities, net of impairment provisions
(In thousand MAD)
4.4. INTERBANK TRANSACTIONS, RECEIVABLES AND AMOUNTS DUE FROM CREDIT INSTITUTIONS
Loans and receivables due from credit institutions
LOANS AND RECEIVABLES DUE FROM CREDIT INSTITUTIONS 2016 2015
Demand accounts 4 992 941 5 630 176Loans 13 446 232 12 839 340 Including cash loans DD 24 826 27 323Repurchase agreements 2 846 445 2 567 788Total loans and receivables due from credit institutions, before impairment provisions 21 285 618 21 037 304Provisions for impairment of loans and receivables due from credit institutions -64 389 -66 268Total loans and receivables due from credit institutions, net of impairment provisions 21 221 229 20 971 036
(In thousand MAD)
Amounts due to credit institutions
AMOUNTS DUE TO CREDIT INSTITUTIONS 2016 2015
Demand accounts 2 801 428 2 081 821Borrowings 32 330 639 34 683 456 Including cash loans DD 1 153 270 2 877 349Repurchase agreements 14 576 201 14 410 750TOTAL 49 708 268 51 176 027
(In thousand MAD)

4.5. LOANS, RECEIVABLES AND AMOUNTS DUE FROM CUSTOMERS
LOANS, RECEIVABLES AND AMOUNTS DUE FROM CUSTOMERSLOANS AND RECEIVABLES DUE FROM CUSTOMERS 2016 2015Demand accounts 24 688 644 25 697 536Loans to customers 138 932 342 124 431 972Repurchase agreements 11 561 531 18 162 143Finance leases 13 380 515 12 351 801Total loans and receivables due from customers, before impairment provisions 188 563 032 180 643 452Impairment of loans and receivables due from customers -8 788 810 -7 363 756Total loans and receivables due from customers, net of impairment provisions 179 774 222 173 279 696
BREAKDOWN OF AMOUNTS DUE FROM CUSTOMERS BY BUSINESS ACTIVITY 2016 2015Activity in Morocco 117 079 106 113 592 596Specialized Financial Services 14 702 011 14 680 785International Activities 47 992 984 45 006 206Investment Banking 121 109Other Activities 0 0Total 179 774 222 173 279 696Allocated DebtsValue at Balance sheet 179 774 222 173 279 696
BREAKDOWN OF AMOUNTS DUE FROM CUSTOMERS BY GEOGRAPHICAL REGION 2016 2015Morocco 131 781 238 128 273 490Sub saharan Africa 43 987 312 41 111 803Europe 4 005 672 3 894 403Total 179 774 222 173 279 696Allocated DebtsValue at Balance sheet 179 774 222 173 279 696
AMOUNTS DUE TO CUSTOMERS 2016 2015On demand deposits 108 326 940 100 028 015Term accounts 40 965 156 40 871 554Savings accounts 22 391 034 21 017 845Cash certificates 5 085 322 4 666 140Repurchase agreements 4 218 496 2 481 744Other items 9 063 387 9 189 723TOTAL LOANS AND RECEIVABLES DUE TO CUSTOMERS 190 050 335 178 255 021
BREAKDOWN OF AMOUNTS DUE TO CUSTOMERS BY BUSINESS ACTIVITY 2016 2015Activity in Morocco 131 000 907 121 110 279Specialized Financial Services 908 610 1 107 886International Activities 58 140 801 56 034 240Investment Banking 17 2 616Other Activities 0 0Total 190 050 335 178 255 021Allocated DebtsValue at Balance sheet 190 050 335 178 255 021
BREAKDOWN OF AMOUNTS DUE TO CUSTOMERS BY GEOGRAPHICAL REGION 2016 2015Morocco 131 909 534 122 220 781Sub saharan Africa 56 390 289 54 445 069Europe 1 750 512 1 589 171Total 190 050 335 178 255 021Allocated DebtsValue at Balance sheet 190 050 335 178 255 021
(In thousand MAD)
Con
solid
ated
Fin
anci
al S
tate
men
tsPA
GE 18
4/18
5
BMCE
BANK
OF
AFRICA
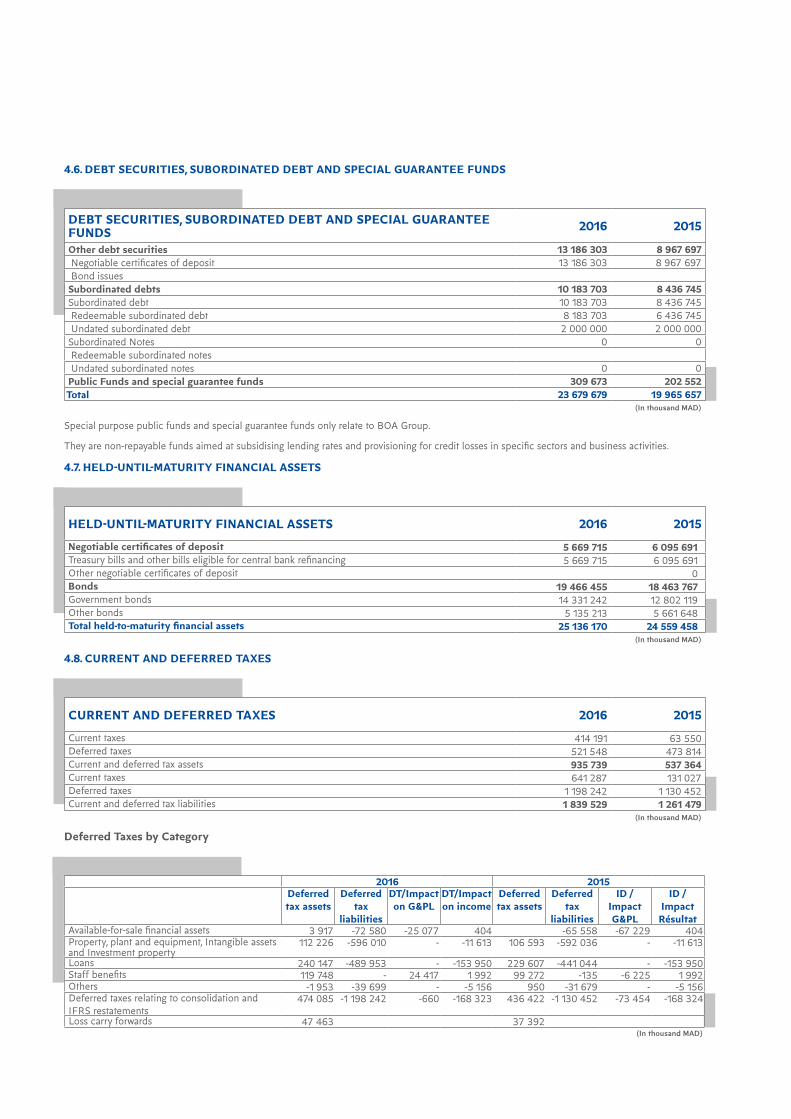
4.6. DEBT SECURITIES, SUBORDINATED DEBT AND SPECIAL GUARANTEE FUNDS
DEBT SECURITIES, SUBORDINATED DEBT AND SPECIAL GUARANTEE FUNDS 2016 2015
Other debt securities 13 186 303 8 967 697 Negotiable certificates of deposit 13 186 303 8 967 697 Bond issuesSubordinated debts 10 183 703 8 436 745Subordinated debt 10 183 703 8 436 745 Redeemable subordinated debt 8 183 703 6 436 745 Undated subordinated debt 2 000 000 2 000 000Subordinated Notes 0 0 Redeemable subordinated notes Undated subordinated notes 0 0Public Funds and special guarantee funds 309 673 202 552Total 23 679 679 19 965 657
(In thousand MAD)
Special purpose public funds and special guarantee funds only relate to BOA Group.
They are non-repayable funds aimed at subsidising lending rates and provisioning for credit losses in specific sectors and business activities.
4.7. HELD-UNTIL-MATURITY FINANCIAL ASSETS
HELD-UNTIL-MATURITY FINANCIAL ASSETS 2016 2015
Negotiable certificates of deposit 5 669 715 6 095 691Treasury bills and other bills eligible for central bank refinancing 5 669 715 6 095 691Other negotiable certificates of deposit 0Bonds 19 466 455 18 463 767Government bonds 14 331 242 12 802 119Other bonds 5 135 213 5 661 648Total held-to-maturity financial assets 25 136 170 24 559 458
(In thousand MAD)
4.8. CURRENT AND DEFERRED TAXES
CURRENT AND DEFERRED TAXES 2016 2015
Current taxes 414 191 63 550Deferred taxes 521 548 473 814Current and deferred tax assets 935 739 537 364Current taxes 641 287 131 027Deferred taxes 1 198 242 1 130 452Current and deferred tax liabilities 1 839 529 1 261 479
(In thousand MAD)
Deferred Taxes by Category
2016 2015Deferred tax assets
Deferred tax
liabilities
DT/Impact on G&PL
DT/Impact on income
Deferred tax assets
Deferred tax
liabilities
ID / Impact G&PL
ID / Impact Résultat
Available-for-sale financial assets 3 917 -72 580 -25 077 404 -65 558 -67 229 404 Property, plant and equipment, Intangible assets and Investment property
112 226 -596 010 - -11 613 106 593 -592 036 - -11 613
Loans 240 147 -489 953 - -153 950 229 607 -441 044 - -153 950 Staff benefits 119 748 - 24 417 1 992 99 272 -135 -6 225 1 992 Others -1 953 -39 699 - -5 156 950 -31 679 - -5 156 Deferred taxes relating to consolidation and IFRS restatements
474 085 -1 198 242 -660 -168 323 436 422 -1 130 452 -73 454 -168 324
Loss carry forwards 47 463 37 392 (In thousand MAD)
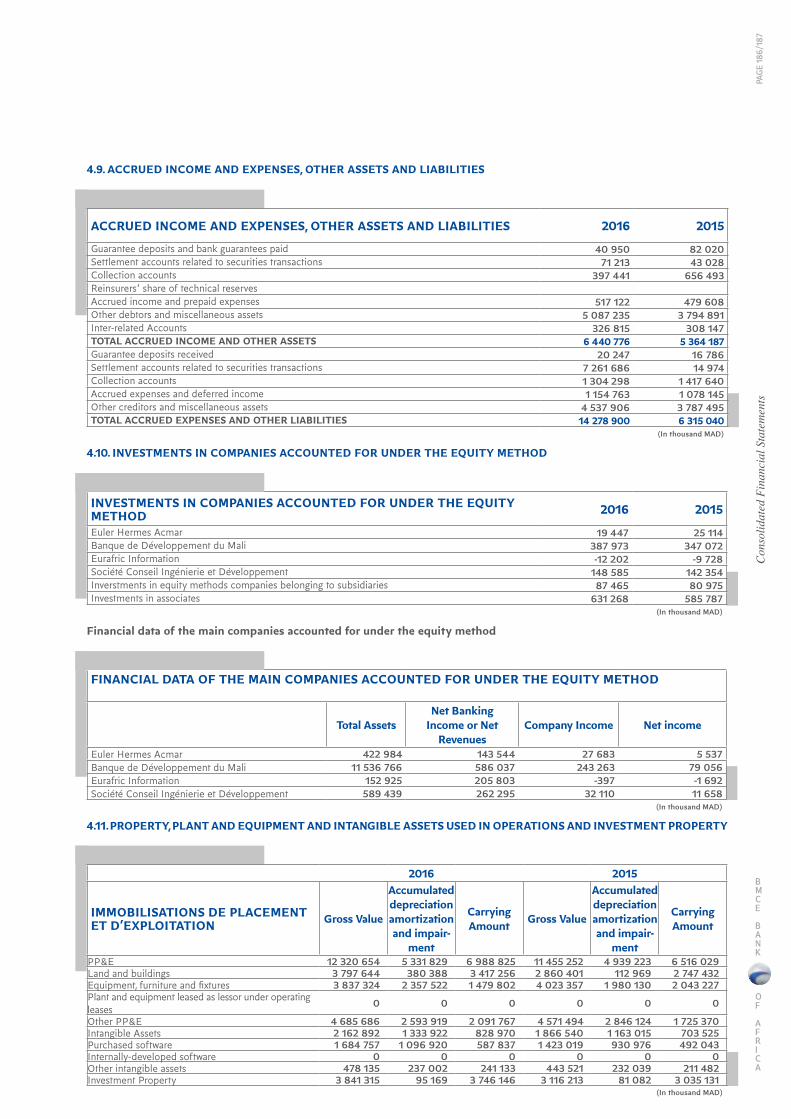
4.9. ACCRUED INCOME AND EXPENSES, OTHER ASSETS AND LIABILITIES
ACCRUED INCOME AND EXPENSES, OTHER ASSETS AND LIABILITIES 2016 2015
Guarantee deposits and bank guarantees paid 40 950 82 020 Settlement accounts related to securities transactions 71 213 43 028 Collection accounts 397 441 656 493 Reinsurers' share of technical reservesAccrued income and prepaid expenses 517 122 479 608 Other debtors and miscellaneous assets 5 087 235 3 794 891 Inter-related Accounts 326 815 308 147 TOTAL ACCRUED INCOME AND OTHER ASSETS 6 440 776 5 364 187 Guarantee deposits received 20 247 16 786 Settlement accounts related to securities transactions 7 261 686 14 974 Collection accounts 1 304 298 1 417 640 Accrued expenses and deferred income 1 154 763 1 078 145 Other creditors and miscellaneous assets 4 537 906 3 787 495 TOTAL ACCRUED EXPENSES AND OTHER LIABILITIES 14 278 900 6 315 040
(In thousand MAD)
4.10. INVESTMENTS IN COMPANIES ACCOUNTED FOR UNDER THE EQUITY METHOD
INVESTMENTS IN COMPANIES ACCOUNTED FOR UNDER THE EQUITY METHOD 2016 2015
Euler Hermes Acmar 19 447 25 114Banque de Développement du Mali 387 973 347 072Eurafric Information -12 202 -9 728Société Conseil Ingénierie et Développement 148 585 142 354Inverstments in equity methods companies belonging to subsidiaries 87 465 80 975Investments in associates 631 268 585 787
(In thousand MAD)
Financial data of the main companies accounted for under the equity method
FINANCIAL DATA OF THE MAIN COMPANIES ACCOUNTED FOR UNDER THE EQUITY METHOD
Total Assets Net Banking
Income or NetRevenues
Company Income Net income
Euler Hermes Acmar 422 984 143 544 27 683 5 537Banque de Développement du Mali 11 536 766 586 037 243 263 79 056Eurafric Information 152 925 205 803 -397 -1 692Société Conseil Ingénierie et Développement 589 439 262 295 32 110 11 658
(In thousand MAD)
4.11. PROPERTY, PLANT AND EQUIPMENT AND INTANGIBLE ASSETS USED IN OPERATIONS AND INVESTMENT PROPERTY
2016 2015
IMMOBILISATIONS DE PLACEMENT ET D’EXPLOITATION Gross Value
Accumulated depreciation amortization and impair-
ment
Carrying Amount Gross Value
Accumulated depreciation amortization and impair-
ment
Carrying Amount
PP&E 12 320 654 5 331 829 6 988 825 11 455 252 4 939 223 6 516 029Land and buildings 3 797 644 380 388 3 417 256 2 860 401 112 969 2 747 432Equipment, furniture and fixtures 3 837 324 2 357 522 1 479 802 4 023 357 1 980 130 2 043 227Plant and equipment leased as lessor under operating leases 0 0 0 0 0 0
Other PP&E 4 685 686 2 593 919 2 091 767 4 571 494 2 846 124 1 725 370Intangible Assets 2 162 892 1 333 922 828 970 1 866 540 1 163 015 703 525Purchased software 1 684 757 1 096 920 587 837 1 423 019 930 976 492 043Internally-developed software 0 0 0 0 0 0Other intangible assets 478 135 237 002 241 133 443 521 232 039 211 482Investment Property 3 841 315 95 169 3 746 146 3 116 213 81 082 3 035 131
(In thousand MAD)
Con
solid
ated
Fin
anci
al S
tate
men
tsPA
GE 18
6/18
7
BMCE
BANK
OF
AFRICA

Change in property, plant and equipment
CHANGE IN PROPERTY, PLANT AND EQUIPMENT 2016 2015
Net value as of January, 1st 6 521 829 5 847 075Acquisition of the year 859 988 2 172 198Entrance in the scope - -Depreciation, Amortization of impaiment (470 711) (853 088)Disposal of the year (328 668) (677 373)Reclassifications 406 387 27 217NET VALUE AT END OF PERIOD 6 988 825 6 516 029
(In thousand MAD)
Change in intangible assets
CHANGE IN INTANGIBLE ASSETS 2016 2015
Net value as of January, 1st 703 525 744 273Acquisition of the year 324 337 181 642Entrance in the scope - -Depreciation, Amortization of impaiment (173 905) (186 771)Disposal of the year (13 633) (10 950)Reclassifications (11 354) (24 669)NET VALUE AT END OF PERIOD 828 970 703 525
(In thousand MAD)
investment properties
INVESTMENT PROPERTIES 2016 2015
Net value as of January, 1st 3 035 131 835 047Acquisition of the year 744 004 2 242 743Entrance in the scope - -Depreciation, Amortization of impaiment (18 306) (4 828)Disposal of the year (13 643) (29 943)Reclassifications (1 040) (7 888)NET VALUE AT END OF PERIOD 3 746 146 3 035 131
(In thousand MAD)
4.12. GOODWILL
GOODWILL 2016 2015
Gross value at start of period 852 310 832 470Accumulated impairment at start of periodCarrying amount at start of period 852 310 832 470Acquisitions 19 840DisposalsImpairment losses recognized during the periodTranslation adjustmentsSubsidiaries previously accounted for by the equity methodOther movements 0 0Gross value at end of period 852 310 852 310Accumulated impairment at end of periodCARRYING AMOUNT AT END OF PERIOD 852 310 852 310
(In thousand MAD)

The following table provides a breakdown of goodwill :
2016 book Value 2015 book ValueMaghrébail 10 617 10 617Banque de développement du Mali 3 588 3 588SALAFIN 5 174 5 174Maroc Factoring 1 703 1 703BMCE Capital Bourse 2 618 2 618BMCE International (Madrid) 3 354 3 354Bank Of Africa 711 976 711 976LOCASOM 98 725 98 725CID 14 555 14 555TOTAL 852 310 852 310
Goodwill impairment tests
The recoverable amount of a cash-generating unit has been determined on the basis of value in use.
An intrinsic value approach has been adopted to determine value in use at BOA and Locasom as follows:
- At BOA, the “dividend discount model” (hereafter, the “DDM”) has been adopted. This is a standard method used by the banking industry to determine an activity’s value by reference to the net present value of dividends that the activity is likely to generate in the future. The value thus calculated corresponds to the value in shareholders’ equity;
- At Locasom, the “discounted cash flow method” (hereafter, the “DCF” method) has been adopted. This is a standard method used by the services sector to determine an activity’s value by reference to the net present value of available cash flows that the activity is likely to generate in the future. The value thus calculated corresponds to enterprise value.
Cash-flow projections are based on financial estimates over a three-year period approved by management.
Bank of Africa Locasom% %
Discount rate 18% 8.5%Growth rate 2% 3%
A certain number of assumptions of estimated net banking income, the cost-to-income ratio, the costs of risk and risk-weighted assets (hereafter, “RWA”) underpin the DDM, which is used to determine recoverable value. These are taken from medium-term (3-year) business plans for the first three years, representing the duration of the economic cycle to which the banking industry is sensitive and then in perpetuity, based on sustainable growth rates to calculate terminal value.
Key cash flow variables are EBITDA and the operating margin which underpin the DCF method. This is a standard method used by the services sector to determine an activity’s value by reference to the net present value of available cash flows that the activity is likely to generate in the future. The value thus calculated corresponds to enterprise value.
Discount rate
The indirect approach has been used to determine the cost of capital. The indirect approach consists of adjusting the cost of capital of a reference country (France) by a country risk factor, reflecting the specific risks relating to the economic, political, institutional and financial conditions of the country in which the company has its operations.
BOA’s cost of capital has been determined on the basis of the observed average discount rate, calculated by weighting the discount rate of each bank by net banking income, in each of the countries in which BOA has operations. The discount rate ranges from 16% to 18% for BOA and from 7% to 8.5% for Locasom.
Growth rate
BOA’s business forecasts have been prepared using the CFA Franc. The CFA Franc is guaranteed by the French Treasury and has a fixed exchange
rate against the euro. As a result, the long-term growth rate adopted by BOA is 2%, in line with estimates of inflation in France.
Locasom’s growth rate has been set at 3%, in line with assumptions for the rate of growth of its sector in Morocco.
Regulatory capital requirements
BOA’s risk weighted assets must satisfy Core Tier One regulatory capital requirements over the entire period for which BOA has made estimates.
Net banking income
Estimates of net banking income have been made on the basis on the currently low level of bank penetration in Africa and, as a result, the strong growth potential.
L’EBITDA
Estimates of EBITDA and operating margins have been made on the basis of historical data.
Cost-to-income ratio
Estimates of the cost-to-income ratio are highly correlated with growth in expenses, particularly those relating to the opening of branches, which are required in order to attract new customers.
Sensitivity to changes in assumptions
BANK OF AFRICACost of capital 18%Unfavorable change of 200 basis points -1 685 379Favorable change of 200 basis points 2 198 234 LOCASOMCost of capital 8,5%Unfavorable change of 200 basis points -208 537Favorable change of 150 basis points 342 689
For the cash-generating units in question, there is no reason to amortise goodwill, even after factoring in, for impairment tests, the most adverse change in the cost of capital, considered by management to be the assumption most sensitive to any reasonable change.
4.13. PROVISIONS FOR CONTINGENCIES AND CHARGES
2016 2015Total provisions at start of period 650 913 523 011Additions to provisions 51 674 222 915Reversals of provisions -51 024 -147 234Effect of movements in exchange rates and other movements 39 329 57 128
Gross value at end of period -5 688 -4 907TOTAL PROVISIONS AT END OF PERIOD 685 204 650 913
Legal and fiscal
risks
Obliga-tions for post-em-ployment benefits
Loan commit-ments
and guar-antees
Onerous contrats
Other provisions
Total book value
Total provisions at start of period
25 167 323 090 19 602 0 283 054 650 913
Net additions to provisions 14 220 6 578 8 643 0 22 531 51 972
Provisions used 0 0 0 0 0 0Effect of movements in exchange rates
-18 574 0 0 0 -32 450 -51 024
Other movements -118 0 -12 119 0 45 580 33 343TOTAL PROVI-SIONS AT END OF PERIOD
20 695 329 668 16 126 0 318 715 685 204
Con
solid
ated
Fin
anci
al S
tate
men
tsPA
GE 18
8/18
9
BMCE
BANK
OF
AFRICA

4.14. TRANSFERS OF FINANCIAL ASSETS
Financial assets that have been transferred by the Group are mainly composed of securities sold temporarily under repurchase agreements or securities lending transactions.
The liabilities associated with securities temporarily sold under repurchase agreements consist of amounts owing from credit institutions and customers under “Repurchase agreements”.
Transferred financial assets not derecognised
These include repurchase agreements or securities lending transactions resulting in a transfer of securities without them being derecognised.
The assets that have been transferred by the Group are:
» Treasury securities» Certificates of deposit» Bonds
Transfers of derecognised financial assets
These include securitisation transactions resulting in a transfer of securities leading to de-recognition.
There have been no significant transfers of derecognised securities by the Group in 2016 and 2014.
2016Carrying
amounts of transferred
assets
Carrying amounts of associated liabilities
Securities lending operationsSecurities at fair value through profit or lossRepurchase agreementsSecurities at fair value through profit or loss 14 338 028 14 329 475
Securities classified as loans and receivables 0 0
Available-for-sale assets 460 221 459 843 Total 14 798 249 14 789 318
2015Carrying
amounts of transferred
assets
Carrying amounts of associated liabilities
Securities lending operationsSecurities at fair value through profit or lossRepurchase agreementsSecurities at fair value through profit or loss 13 288 374 13 282 129
Securities classified as loans and receiv-ables 0 0
Available-for-sale assets 691 953 691 060 Total 13 980 326 13 973 188
4.15. FAIR VALUE
4.15.1. Fair value of financial instruments carried at amortised cost
The information supplied in this note must be used and interpreted with the greatest caution because these fair values are an estimate of the value of the relevant instruments as of 31 December 2014. They are liable to fluctuate from day to day as a result of changes in different variables such as interest rates and credit quality of the counterparty.
In particular, they may differ significantly from the amounts actually received or paid on maturity of the instrument. In most cases, the fair value is not intended to be realised immediately, and in practice might
not be realised immediately. Consequently, this fair value does not reflect the actual value of the instruments on the assumption that BMCE Bank Group remained a going concern.
The fair value of a financial instrument is defined as the amount for which an asset could be exchanged, or a liability settled, between knowledgeable, willing parties in an arm’s length transaction.
The valuation techniques and assumptions used ensure that the fair value of financial assets and liabilities is measured on a consistent basis throughout the BMCE Bank Group.
Fair value is based on prices quoted on a liquid market when these are available. In other cases, fair value is determined using commonly-used valuation techniques.
The table below shows the fair value of the Group’s financial assets and liabilities at 31 December 2016 :
2016 2015
Book valueEstimated
market value
Book valueEstimated
market value
FINANCIAL ASSETSLoans and receivables due from credit insti-tutions
21 221 229 21 235 707 20 971 036 20 998 500
Loans and receivables due from customers 179 774 222 180 516 425 173 279 696 173 621 762
Placements détenus jusqu'à leur échéance 25 136 170 25 438 896 24 559 458 24 444 821
Immeubles de place-ment 3 746 146 3 807 973 3 035 131 3 096 958
FINANCIAL LIABILITIESLoans and receivables due to credit institu-tions
49 708 268 49 708 268 51 176 027 51 176 027
Loans and receivables due to customers 190 050 335 190 050 335 178 255 021 178 255 021
Debt securities 13 186 303 13 186 303 8 967 697 8 967 697Subordinated debts 10 493 376 10 493 376 8 639 297 8 639 297
The techniques and assumptions used to determine fair value for each category are described hereafter:
Loans and receivables
The fair value of receivables is determined by estimating the fair value of assets held after conducting sensitivity analysis on each asset class on the basis of each instrument’s duration and convexity by observing historical returns as a function of changes in market conditions.
In the absence of a market yield curve reflecting actual rates along the different segments of the curve, average yields on origination for the financial year in question have been used as indicative of actual market rates.
In the case of loans and receivables that have a maturity of less than one year (demand liabilities) or are granted on floating-rate terms, fair value equates to the carrying amount due to their limited sensitivity to changes in rates or by the simple fact that they are granted on the basis of actual market conditions.
Loans and receivables due from credit institutions
Loans and receivables due from credit institutions totalled MAD 21.2 billion with a fair value close to the carrying amount. This is due to the predominance of short-term money market transactions (in the form of cash loans, interbank loans and repurchase agreements).
Outstandings of loans to finance companies totalled MAD 9.4 billion, amortisable over a short period, with a fair value that is MAD 14.5 million higher than the carrying amount.

Loans and receivables due from customers
Outstandings of loans and receivable due from customers totalled MAD 179 billion at 31 December 2016, consisting primarily of cash loans, overdraft facilities and floating rate loans.
Outstandings of fixed-rate loans primarily consist of consumer loans amortisable over a short period (average maturity 2.3 years) and fixed-rate mortgage loans amortisable over an average period of almost 7.2 years.
The sensitivity analysis of the Bank’s fixed rate loan book shows a faire value that is 333 million MAD higher than the carrying amount.
Financial liabilities
In the case of financial liabilities that have a maturity of less than one year (demand liabilities) or are granted on floating-rate terms, or for an indefinite period (as is the case for perpetual subordinated debt) as well as most regulated savings products, fair value equates to the carrying amount.
Amounts due to credit institutions
Amounts due to credit institutions totalled MAD 49.7 billion and are recognised at their carrying amount. They consist primarily of short-term cash borrowing transactions in the form of 7-day advances from the Central Bank, interbank borrowings and borrowings from local banks or foreign correspondent banks in addition to repurchase agreements.
Amounts due to customers
Amounts due to customers totalled MAD 190 million, consisting primarily of non-interest-bearing sight deposits in the form of cheque accounts, current accounts in credit and immediate-access regulated savings account.
Repurchase agreements with customers, particularly in respect of mutual funds, are also recognised under “Amounts due to customers”.
Outstandings of term deposits totalled MAD 41 billion, with an average maturity of less than one year consisting due to the predominance of 3-month, 6-month and 12-month maturities.
In the case of customer term deposits, fair value equates to the carrying amount.
Debt securities
Outstandings of debt securities totalled MAD 13.2 billion, consisting primarily of certificates of deposit issued by the Bank with predominantly 3-month, 6-month and 12-month maturities.
In the case of debt securities, fair value equates to the carrying amount.
Subordinated debt
Outstandings of subordinated debt, which totalled MAD 10.5 billion, are recognised at the carrying amount due to the predominance of floating-rate issues and perpetual subordinated debt outstandings.
4.15.2. Breakdown by measurement method of financial instruments recognised at fair value presented in accordance with IFRS 7 recommendations
2016Level 1 Level 2 Level 3 Total
FINANCIAL ASSETSFinancial instruments at-fair-value through profit or loss held for trading
38 890 923 - - 38 890 923
of which financial assets at-fair-value through profit or loss 38 890 923 38 890 923 of which derivative financial instruments - Financial instruments desig-nated as at-fair-value through profit or loss
-
Derivatives used for hedging purposes -
Available for sale financial assets 8 317 725 8 317 725 FINANCIAL LIABILITIESFinancial instruments at-fair-value through profit or loss held for trading
- 2 098 276 - 2 098 276
of which financial assets at-fair-value through profit or loss 2 037 621 2 037 621 of which derivative financial instruments 60 655 60 655 Financial instruments designated as at-fair-value through profit or lossDerivatives used for hedging purposes
2015Level 1 Level 2 Level 3 Total
FINANCIAL ASSETSFinancial instruments at-fair-value through profit or loss held for trading
25 760 228 - - 25 760 228
of which financial assets at-fair-value through profit or loss
25 760 228
25 760 228
of which derivative financial instruments - Financial instruments desig-nated as at-fair-value through profit or loss
-
Derivatives used for hedging purposes -
Available for sale financial assets 6 846 572
6 846 572
FINANCIAL LIABILITIESFinancial instruments at-fair-value through profit or loss held for trading
- 2 046 594 -
2 046 594 of which financial assets at-fair-value through profit or loss 1 999 324 1 999 324 of which derivative financial instruments 47 270 47 270 Financial instruments designated as at-fair-value through profit or lossDerivatives used for hedging purposes
The Bank has transferred its bonds from Level 1 to Level 2 of the fair value hierarchy. This transfer was made to comply with the hierarchy criteria for each level as defined by IFRS 13.
Unquoted available-for-sale financial assets classified as Level 3 assets under the fair value hierarchy are measured using the following methods:
- Carrying amount
- Adjusted net asset value
- Net asset value
- Pricing – corporate events
The Group primarily usesthe ‘net asset value’ and ‘carrying amount’ valuation methods.
Con
solid
ated
Fin
anci
al S
tate
men
tsPA
GE 19
0/19
1
BMCE
BANK
OF
AFRICA

The above methods are preferred due to these securities’ illiquidity and/or a lack of comparable transactions.
Different methods are used to measure variable income securities such as :
67% of the portfolio is measured using the net asset value method and 21% using the comparable model (similar equity transactions).
Table of changes in available-for-sale financial assets under Level 3 :
2016Debt Equity
CARRYING AMOUNT at 1st January 4 112 359 2 734 213 6 846 572 Profits and losses recognised in the P&L - 16 656 16 656
Profits and losses recognised in equity - 13 334 13 334 Acquisitions 1 753 241 116 854 1 870 095 Disposals -336 055 -63 613 -399 668 Transfers - - - Translation differences -27 992 -1 272 -29 264 Reclassifications - - - CARRYING AMOUNT AT END OF PERIOD 5 501 553 2 816 172 8 317 725
2015Debt Equity
CARRYING AMOUNT at 1st January 2 402 295 2 163 669 4 565 964 Profits and losses recognised in the P&L - -1 114 -1 114
Profits and losses recognised in equity - -57 090 -57 090 Acquisitions 2 192 760 587 861 2 780 621 Disposals -418 169 -67 308 -485 477 Transfers - - - Translation differences -64 527 108 195 43 668 Reclassifications - - - CARRYING AMOUNT AT END OF PERIOD 4 112 359 2 734 213 6 846 572
4.15.3. Fair value hierarchy of assets and liabilities recognised at amortised cost
2016Level 1 Level 2 Level 3 Total
ASSETSLoans and receivables due from credit insti-tutions
21 235 707 21 235 707
Loans and receivables due from customers 180 516 425 180 516 425
Held-to-maturity finan-cial assets 5 456 267 19 982 629 25 438 896
LIABILITIESDue to credit institutions 49 708 268 49 708 268 Due to customers 190 050 335 190 050 335 Debt securities issued 13 186 303 13 186 303 Subordinated debt 10 493 376 10 493 376
2015Level 1 Level 2 Level 3 Total
ASSETSLoans and receivables due from credit insti-tutions
20 998 500 20 998 500
Loans and receivables due from customers 173 621 762 173 621 762
Held-to-maturity financial assets 4 762 514 19 682 307 24 444 821
LIABILITIESDue to credit institutions 51 176 027 51 176 027
Due to customers 178 255 021 178 255 021 Debt securities issued 8 967 697 8 967 697
Subordinated debt 8 639 297 8 639 297 Fair value measurement of financial instruments
Financial instruments measured at fair value are classified at three levels in accordance with IFRS 7 :
» Level 1 :
Quoted prices on liquid markets for identical assets or liabilities :
This level includes financial instruments with quoted prices in a liquid market that can be used directly.
For BMCE Bank Group, it includes listed equities, mutual funds, bonds and Treasury bonds.
» Level 2 :
Observable inputs other than Level 1 quoted prices for the asset or liability in question either directly (prices) or indirectly (price-derived inputs):
This level includes financial instruments quoted on markets considered insufficiently liquid as well as those traded on over-the-counter markets. Prices published by an external source, derived from the measurement of similar instruments, are considered to be price-derived inputs.
The Group does not have any financial instruments measured at Level 2.
» Level 3 :
Inputs relating to the asset or liability that are not based on observable market data (non-observable inputs) : Given the diversity of instruments and the reasons for including them in this category, calculating the sensitivity of fair value to changes in variables would appear to be of little relevance.
This level includes unlisted equities valued by various methods including the net carrying amount, net adjusted asset value, net asset value, stock market multiples and equity issue pricing.
Level 3 inputs are inputs relating to assets or liabilities which are not based on observable market-based data (unobservable data). Given the diversity of instruments and the reasons for including them within this category, calculating the sensitivity of fair value to changes in the inputs would likely generate information of limited relevance.
The fair values of held-to-maturity financial assets are determined using valuation techniques for which significant inputs are unobservable or cannot be corroborated by market-based observations, due for instance to the instrument beingilliquid as well as significant model risk. An unobservable input is a parameter for which there are no market data available. It is therefore derived from in-house assumptions about the data used by other market participants. Assessing whether a product is illiquid or subject to significant model risk is a matter of judgment.
Held-to-maturity financial assets classified under Level 3 are primarily bonds held by banks in sub-Saharan Africa.
V/ FINANCING ANG GUARANTEE COMMITMENTS
5.1. FINANCIAL COMMITMENT
2016 2015Financing commitments given 13 452 970 9 846 296 - To credit institutions 1 023 096- To customers: 13 452 970 8 823 200 Confirmed letters of creditOther commitments given to customersFinancing commitments received 2 181 683 2 491 359 From credit institutions 2 181 683 2 491 359 From customers - -
» Financing commitments given to credit and similar institutions
This entry relates to commitments to make liquidity facilities available to other credit institutions such as refinancing agreements and back-up commitments on securities issuance.
» Financing commitments given to customers
This entry relates to commitments to make liquidity facilities available to customers such as confirmed credit lines and commitments on securities issuance.
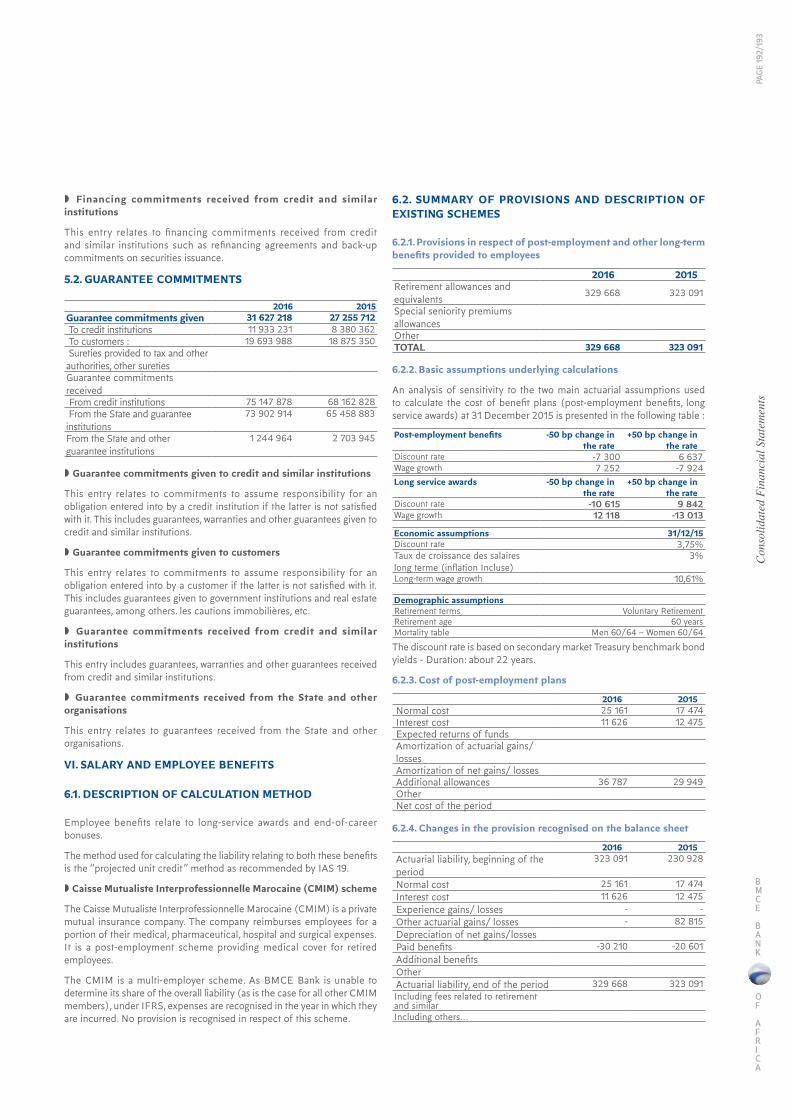
» Financing commitments received from credit and similar institutions
This entry relates to financing commitments received from credit and similar institutions such as refinancing agreements and back-up commitments on securities issuance.
5.2. GUARANTEE COMMITMENTS
2016 2015Guarantee commitments given 31 627 218 27 255 712 To credit institutions 11 933 231 8 380 362 To customers : 19 693 988 18 875 350 Sureties provided to tax and other authorities, other suretiesGuarantee commitments received From credit institutions 75 147 878 68 162 828 From the State and guarantee institutions
73 902 914 65 458 883
From the State and other guarantee institutions
1 244 964 2 703 945
» Guarantee commitments given to credit and similar institutions
This entry relates to commitments to assume responsibility for an obligation entered into by a credit institution if the latter is not satisfied with it. This includes guarantees, warranties and other guarantees given to credit and similar institutions.
» Guarantee commitments given to customers
This entry relates to commitments to assume responsibility for an obligation entered into by a customer if the latter is not satisfied with it. This includes guarantees given to government institutions and real estate guarantees, among others. les cautions immobilières, etc.
» Guarantee commitments received from credit and similar institutions
This entry includes guarantees, warranties and other guarantees received from credit and similar institutions.
» Guarantee commitments received from the State and other organisations
This entry relates to guarantees received from the State and other organisations.
VI. SALARY AND EMPLOYEE BENEFITS
6.1. DESCRIPTION OF CALCULATION METHOD
Employee benefits relate to long-service awards and end-of-career bonuses.
The method used for calculating the liability relating to both these benefits is the “projected unit credit” method as recommended by IAS 19.
» Caisse Mutualiste Interprofessionnelle Marocaine (CMIM) scheme
The Caisse Mutualiste Interprofessionnelle Marocaine (CMIM) is a private mutual insurance company. The company reimburses employees for a portion of their medical, pharmaceutical, hospital and surgical expenses. It is a post-employment scheme providing medical cover for retired employees.
The CMIM is a multi-employer scheme. As BMCE Bank is unable to determine its share of the overall liability (as is the case for all other CMIM members), under IFRS, expenses are recognised in the year in which they are incurred. No provision is recognised in respect of this scheme.
6.2. SUMMARY OF PROVISIONS AND DESCRIPTION OF EXISTING SCHEMES
6.2.1. Provisions in respect of post-employment and other long-term benefits provided to employees
2016 2015Retirement allowances and equivalents 329 668 323 091
Special seniority premiums allowancesOtherTOTAL 329 668 323 091
6.2.2. Basic assumptions underlying calculations
An analysis of sensitivity to the two main actuarial assumptions used to calculate the cost of benefit plans (post-employment benefits, long service awards) at 31 December 2015 is presented in the following table :
Post-employment benefits -50 bp change in the rate
+50 bp change in the rate
Discount rate -7 300 6 637 Wage growth 7 252 -7 924 Long service awards -50 bp change in
the rate+50 bp change in
the rateDiscount rate -10 615 9 842 Wage growth 12 118 -13 013
Economic assumptions 31/12/15Discount rate 3,75%Taux de croissance des salaires long terme (inflation Incluse)
3%
Long-term wage growth 10,61%
Demographic assumptionsRetirement terms Voluntary RetirementRetirement age 60 yearsMortality table Men 60/64 – Women 60/64
The discount rate is based on secondary market Treasury benchmark bond yields - Duration: about 22 years.
6.2.3. Cost of post-employment plans
2016 2015Normal cost 25 161 17 474 Interest cost 11 626 12 475 Expected returns of fundsAmortization of actuarial gains/ lossesAmortization of net gains/ lossesAdditional allowances 36 787 29 949 OtherNet cost of the period
6.2.4. Changes in the provision recognised on the balance sheet
2016 2015Actuarial liability, beginning of the period
323 091 230 928
Normal cost 25 161 17 474 Interest cost 11 626 12 475 Experience gains/ losses - - Other actuarial gains/ losses - 82 815 Depreciation of net gains/lossesPaid benefits -30 210 -20 601 Additional benefitsOtherActuarial liability, end of the period 329 668 323 091 Including fees related to retirement and similarIncluding others…
Con
solid
ated
Fin
anci
al S
tate
men
tsPA
GE 19
2/19
3
BMCE
BANK
OF
AFRICA

VII. ADDITIONAL INFORMATION
7.1. CHANGES IN SHARE CAPITAL AND EARNINGS PER SHARE
7.1.1. Share capital transactions
Transactions on capital In number Unit value In MAD
Number of shares outstandingat 31 December 2013 179 463 390 10 1 794 633 900
Number of shares outstandingat 31 December 2014 179 463 390 10 1 794 633 900
Number of shares outstandingat 31 December 2015 179 463 390 10 1 794 633 900
7.1.2. Earnings per share
Basic earnings per share is calculated by dividing the net income for the period attributable to holders of ordinary share s by the weighted average number of ordinary shares outstanding during the period.
2016 2015SHARE CAPITAL (IN MAD) 1 794 633 900 1 794 633 900 Number of common shares outstanding during the year
179 463 390 179 463 390
NET INCOME ATTRIBUTABLE TO THE SHARHOLDER’S OF THE PARENT (IN MAD)
2 036 185 656 1 955 534 700
BASIC ERNINGS PER SHARE (IN MAD)
11,35 10,90
DILUTED EARNING PER SHARE (IN MAD)
11,35 10,90
The Bank does not have any dilutive instruments for conversion into ordinary shares. As a result, diluted earnings per share equates to basic earnings per share.
7.2. SCOPE OF CONSOLIDATION
Company Activity% of
voting interests
% of own-
ership interests
Method
BMCE BANK Banking Parent CompanyBMCE CAPITAL Investment Bank 100,00% 100,00% Full ConsolidationBMCE CAPITAL GESTION
Asset management 100,00% 100,00% Full Consolidation
BMCE CAPITAL BOURSE
Financial intermediation 100,00% 100,00% Full Consolidation
MAROC FACTORING Factoring 100,00% 100,00% Full ConsolidationMAGHREBAIL Leasing 52,47% 52,47% Full ConsolidationSALAFIN Consumer loans 74,76% 74,76% Full Consolidation
BMCE EUROSERVICESFinancial intitution 100,00% 100,00% Full Consolidation
LCB BANK Banking 37,00% 37,00% Full ConsolidationBMCE BANK INTERNATIONAL HOLDING
Banking 100,00% 100,00% Full Consolidation
BANK OF AFRICA Banking 72,85% 72,85% Full ConsolidationLOCASOM Car rental 100,00% 97,39% Full ConsolidationRM EXPERTS Debt collection 100,00% 100,00% Full ConsolidationBANQUE DE DEVELOPPEMENT DU MALI
Banking 32,38% 32,38% Equity Method
EULER HERMES ACMAR Insurance 20,00% 20,00% Equity Method
EURAFRIC INFORMATION
Technology Service 41,00% 41,00% Equity Method
CONSEIL INGENIERIE ET DEVELOPPEMENT Study office 38,90% 38,90% Equity Method
BMCE Bank of Africa holds 37% of La Congolaise de Banque’s voting rights and has a controlling interest in this subsidiary as per the criteria outlined in IFRS 10.
Power: BMCE Bank of Africa derives its effective rights from the management contract entrusted to it by the other shareholders. It has a majority on the Board of Directors with three directors followed by the Congolese State which has two directors.
Returns: BMCE Bank of Africa is exposed, or has rights, to the profits generated by LCB pro-rata to its shareholding in the company.
Link between power and returns : BMCE Bank of Africa is responsible for appointing LCB’s senior management as well as being able to influence this entity’s returns.
7.3. COMPENSATION PAID TO THE MAIN EXECUTIVE COR-PORATE OFFICERSRemuneration paid to the main directors
By “main directors” is meant the members of the bank’s general management team
2016 2015Short-term benefits 14 342 21 971 Post-employment benefits 631 730 Other long-term benefits 5 298 4 442
Short-term benefits relate to the fixed remuneration inclusive of social security contributions received by the main Executive Corporate Officers in respect of the 2013 financial year.
Post-employment benefits relate to end-of-career bonuses and other long-term benefits relate to long-service awards.
Directors’ fees paid to members of the board of directors
2016 2015
Gross Amount
With holding
tax
Net amount
paidGross amout
Tax with holding
Net amount
paidNatural and legal persons Resident in Morocco
2 985 735 2 250 2 388 588 1 800
Physical and legal persons non Resident in Morocco
588 88 500 471 71 400
TOTAL 3 573 823 2 750 2 859 659 2 200
Loans granted to the main Executive Corporate Officers
2016 2015Consumer loans 19 765 2 285 Mortgage loans 12 393 15 361 Total 32 158 17 646

7.4. RELATIONS WITH RELATED PARTIES
Relations between BMCE Bank and fully-consolidated companies and the parent company
Transactions and period-end balances between fully-consolidated entities are of course eliminated. Period-end balances resulting from transactions between companies accounted for under the equity method and the parent company are maintained in the consolidated financial statements.
Related-party balance sheet items
Parent company (FINANCECOM)
Sister companies
Companies consolidated
under the equity
method
Fully consolidated companies
AssetsLoans, advances and securities 313 832 3 389 440 39 771 12 926 268 On demand accounts 313 832 1 827 319 13 341 12 193 309 Loans 836 921 26 430 363 782 Securities 725 200 369 177 Lease financingOther assets 7 365 Total 313 832 3 389 440 39 771 12 933 633 LiabilitiesDeposits - 1 866 341 35 607 12 365 095 On demand accounts 1 866 341 35 607 12 236 912 Other borrowings 128 183 Debt securities 349 662 Other liabilities 218 876 Total - 1 866 341 35 607 12 933 633 Financing and guarantee commitments givenCommitments given 1 166 184 Commitments received 1 166 184
Related party profit and loss items
Parent company
(FINANCE-COM)
Sister compa-
nies
Companies consolidated under the eq-uity method
Fully con-solidated
companies
Interest and similar income -1 396 -382 076 Interest and similar expenses 476 764 Fees (income) -48 413 -306 450 Fee (expenses) 43 525 Services providedServices procured 41 370 Lease income -70 587 -4 169 -158 620 Other 75 835 326 858
7.5. LEASES
Information concerning finance leases
Gross Investissement
Present value of minimum lease payments under
the lease
Unguaranteed residual value
accruing to the lessor
≤ 1 years 2 950 405 491 124 71 548 > 1 year ≤ 5 years 9 066 870 5 454 124 300 635 > 5 years 5 397 608 4 513 272 597 769 TOTAL 17 414 882 10 458 520 969 952
Information concerning operating leases
Present value of minimum lease
payments under the lease
Total contingent rents recognized as income in
the period
≤ 1 year 220 000 240 000 > 1 year ≤ 5 years 900 000 1 200 000 > 5 yearsTOTAL 1 120 000 1 440 000
The portion of the residual value in the total of the financing amounts is 58.11%.
Con
solid
ated
Fin
anci
al S
tate
men
tsPA
GE 19
4/19
5
BMCE
BANK
OF
AFRICA

47, rue Allal Ben Abdellah20 000 CasablancaMaroc
To shareholder’s of BMCE BANK140, Avenue Hassan IICasablanca
11, Avenue Bir Kacem SouissiRabat
STATUTORY AUDITORS’ GENERAL REPORT FOR THE FINANCIAL YEAR ENDED 31 DECMBER 2016
In compliance with the assignment entrusted to us by your Annual General Meeting of 27 May 2017, we have audited the attached financial statements of Banque Marocaine du Commerce Extérieur, ‘BMCE Bank’, comprising the balance sheet, the off-balance sheet statement, the income statement, the management accounting statement, the cash flow statement and the additional information statement for the financial year ended 31 December 2016. These financial statements show shareholders’ equity and equivalent of MAD 24,709,660 K, including net income of MAD 1,324,971 K.
Management’s responsibility
It is Management’s responsibility to draw up and present these financial statements to give a true and fair view of the company’s financial position in accordance with the generally-accepted accounting principles and procedures applicable in Morocco. This responsibility includes drawing up, implementing and maintaining internal control procedures regarding the drawing up and presentation of the financial statements to ensure that they free of material misstatement and for making accounting estimates that are reasonable under the circumstances.
Auditor’s responsibility
It is our responsibility to express an opinion on these financial statements based on our audit. We carried out our audit in accordance with Moroccan accounting standards. These standards require that we comply with ethical requirements and plan and perform the audit to obtain reasonable assurance that the financial statements are free from material misstatement.
An audit involves implementing procedures to obtain audit evidence about the amounts and disclosures in the financial statements. The proce-dures adopted depend on the auditor’s judgement, including an assessment of the risks of material misstatement in the financial statements.
In making those risk assessments, the auditor takes into consideration the internal control procedures adopted by the entity regarding the drawing up and presentation of the financial statements so as to determine appropriate audit procedures under the circumstances and not for the purpose of expressing an opinion on the effectiveness of the said procedures. An audit also consists of assessing whether the accounting policies adopted are appropriate and whether the accounting estimates made by senior management are reasonable, as well as assessing the overall presentation of the financial statements.
We believe that the audit evidence obtained is sufficient and appropriate to provide a basis for our audit opinion.
Opinion on the financial statements
In our opinion, the financial statements referred to above in the first paragraph give, in all material aspects, a true and fair view of the income from operations for the financial year ended 31 December 2016 and of the financial position of Banque Marocaine du Commerce Extérieur in accordance with the generally-accepted accounting principles and procedures applicable in Morocco.
Specific checks and information
We also carried out specific checks required by law and we are satisfied that the Bank’s financial statements are consistent with the information provided in the Board of Directors’ management report for shareholders.
Furthermore, in accordance with the provisions of Article 172 of Act 17-95 as amended and completed, we hereby inform you that, in 2016, the Bank acquired:
• An additional 37.5% stake in O TOWER for MAD 62 million. As a result of this acquisition, the Bank’s stake in this company is now 60%;
• An additional 30% stake in SONORMA for MAD 8.25 million. As a result of this acquisition, the Bank’s stake in this company is now 60%;
• A 20% stake in AFRICA CO-DEVELOPMENT GROUP for MAD 500 K.
• A 51% stake in AFRICA MOROCCO LINKS for MAD 510 K.
Casablanca, 12 April 2017
The Statutory Auditors
Statutory Auditors’ General Report

Spec
ial R
epor
t
STATUTORY AUDITORS’ SPECIAL REPORT FOR THE FINANCIAL YEAR ENDED 31 DECEMBER 2016
In our capacity as the statutory auditors of your company, we hereby present to you our report on related party agreements in accordance with the provisions of Articles 56-59 of Act No. 17-95 as amended and completed by Act No. 20-05 and Act No. 78-12 and their application decrees.
It is our responsibility to present to you the main terms and conditions of agreements that have been disclosed to us by the Chairman of the Board or that we may have discovered in carrying out our assignment, without our commenting on their relevance or substance or looking for any undisclosed agreements. Under the provisions of the above act, it is your responsibility to determine whether these agreements should be approved.
We performed the procedures that we deemed necessary in accordance with Moroccan accounting standards. These procedures consisted of checking that the information given to us is consistent with the underlying documents.
1. AGREEMENTS ENTERED INTO DURING 2016
1.1. Share sale agreement between BMCE BANK and BOA BENIN
Under the terms of this agreement entered into in January 2016, BOA Benin shall sell 175 BOA Group shares to BMCE Bank.
The sale is agreed at a price of 950 euros per share, amounting to a total sum of EUR 166,250.
The share sale shall take effect on the date that the shares are transferred to BMCE Bank.
This agreement did not have any impact on the Bank’s financial statements for the period ended 31 December 2016.
Persons concerned:
• Mr Brahim BENJELLOUN-TOUIMI, Chairman of BOA Group’s Board of Directors, is also Group Executive General Manager of BMCE BANK
• Mr Driss BENJELLOUN, Director of BOA Benin, is also Delegate General Manager of BMCE BANK
1.2. Agreement between BMCE Bank and BMCE Capital Bourse relating to the operational and technical handling of the latter’s custody business
Under the terms of this agreement entered into in February 2016, BMCE Capital Bourse will delegate to BMCE Bank the operational and technical handling of its asset custody business.
In exchange, BMCE Capital Bourse shall pay an annual fee of MAD 50,000 exclusive of taxes. Furthermore, it shall remain liable to Maroclear for all membership fees and taxes.
This is a one-year automatically-renewable agreement
This agreement did not have any impact on the Bank’s financial statements for the period ended 31 December 2016.
Person concerned:
• Mr Zouheir BENSAID, a member of BMCE Capital’s Supervisory Board, is also a Director of BMCE BANK
1.3. Financial advisory mandate between BMCE Bank and BMCE Capital Conseil
Under the terms of this mandate entered into in October 2016, BMCE Bank shall appoint BMCE Capital Conseil as financial advisor and global coordinator for the MAD 500 million Green Bond issue.
This agreement is for a 12-month period taking effect on the date that it is signed. It is automatically renewable by additional 3-month periods, if required, and shall end as soon as the deal is completed.
A flat-rate advisory and placing fee is charged at MAD 2 million exclusive of taxes.
Regarding this agreement, BMCE BANK recognised a total expense of MAD 2,072 K for the period ended 31 December 2016.
Persons concerned:
• Mr Brahim BENJELLOUN-TOUIMI, Chairman of BMCE Capital’s Supervisory Board, is also Group Executive General Manager of BMCE BANK
• Mr Zouheir BENSAID, a member of BMCE Capital’s Supervisory Board, is also a Director of BMCE BANK
• Mr Driss BENJELLOUN, a member of BMCE Capital’s Supervisory Board, is also Delegate General Manager of BMCE BANK
• Mr M’Fadel EL HALAISSI a member of BMCE Capital’s Supervisory Board, is also Delegate General Manager of BMCE BANK.
47, rue Allal Ben Abdellah20 000 CasablancaMaroc
To shareholder’s of BMCE BANK140, Avenue Hassan IICasablanca
11, Avenue Bir Kacem SouissiRabat
Statutory Auditors’ Special Report PAGE
196/
197
BMCE
BANK
OF
AFRICA

1.4. Lease agreement between BMCE Bank and Eurafric Information (EAI)
DATA CENTRE
Under the terms of this agreement entered into in January 2017, BMCE Bank shall lease to Eurafric Information a Data Centre covering a surface area of 1,735 m² located on the BMCE Bank campus in Bouskoura Green City, Casablanca.
In terms of compensation, the monthly rent shall be MAD 211,629.60 inclusive of taxes including the communal services tax charged at the current rate of 10.5%.
This agreement did not have any impact on the Bank’s financial statements for the period ended 31 December 2016.
OFFICE FLOORS AND CAR PARKING SPACES IN THE A2 OFFICE BUILDING
Under the terms of this agreement entered into in December 2016, BMCE Bank shall lease to Eurafric Information all office floors in the A2 Office Building covering a total surface area of 3,624 m² as well as all car parking spaces related to this building, located on the BMCE Bank campus in Bouskoura Green City, Casablanca.
In terms of compensation, the monthly rent shall be MAD 363,075.38 inclusive of taxes including the communal services tax charged at the current rate of 10.5%.
The effective date is 1 October 2016 for a 3-year period, automatically renewable for equal periods of 3 years. Furthermore, the Parties agree that the rent will be revised 1 March 2017 to 10%.
Regarding this agreement, BMCE BANK recognised a total expense of MAD 1,090 K for the period ended 31 December 2016.
OFFICE FLOORS AND CAR PARKING SPACES IN THE B2 OFFICE BUILDING
Under the terms of this agreement entered into in December 2016, BMCE Bank shall lease to Eurafric Information all office floors in the B2 Office Building covering a total surface area of 3,822 m² as well as all car parking spaces related to this building, located on the BMCE Bank campus in Bouskoura Green City, Casablanca.
In terms of compensation, the monthly rent shall be MAD 381,864.80 inclusive of taxes including the communal services tax charged at the current rate of 10.5%.
The effective date is 1 October 2016 for a 3-year period, automatically renewable for equal periods of 3 years. Furthermore, the Parties agree that the rent will be revised 1 March 2017 to 10%.
Regarding this agreement, BMCE BANK recognised a total expense of MAD 1,143 K for the period ended 31 December 2016.
Persons concerned :
• Mr Brahim BENJELLOUN-TOUIMI, Chairman of EAI’s Supervisory Board, is also Group Executive General Manager of BMCE BANK
• Mr Zouheir BENSAID, a member of EAI’s Supervisory Board, is also a Director of BMCE BANK
• Mr Driss BENJELLOUN and Mr Mounir CHRAIBI, members of EAI’s Supervisory Board, are also Delegate General Managers of BMCE BANK
1.5. Advisory mandate between BMCE Bank and BMCE Capital Titrisation relating to the securitisation of mortgage-backed secu-rities
Under the terms of this agreement, BMCE Bank shall entrust to BMCE Capital Titrisation the securitisation of the Group’s mortgage-backed securities.
This agreement is for a 12-month period taking effect on the date that it is signed and will be automatically renewed by further 3-month periods if required.
In terms of compensation, a flat-rate fee of MAD 1 million exclusive of taxes will be charged on the date that the agreement is signed and shall end as soon as the deal is completed.
Regarding this agreement, BMCE BANK recognised a total expense of MAD 1,036 K for the period ended 31 December 2016.
Persons concerned:
• Mr Brahim BENJELLOUN-TOUIMI, Chairman of BMCE Capital’s Supervisory Board, is also Group Executive General Manager of BMCE BANK
• Mr Zouheir BENSAID, a member of BMCE Capital’s Supervisory Board, is also a Director of BMCE BANK
• Mr Driss BENJELLOUN, a member of BMCE Capital’s Supervisory Board, is also Delegate General Manager of BMCE BANK
• Mr M’Fadel EL HALAISSI a member of BMCE Capital’s Supervisory Board, is also Delegate General Manager of BMCE BANK.
1.6. Mandate between BMCE Bank and BMCE Capital Titrisation to arrange a real estate asset securitisation deal
In a context of optimising limited resources, BMCE Bank intends to manage its balance sheet as effectively as possible in relation to its sizeable real estate assets.

By transferring its real estate assets, BMCE Bank will be able to: (i) free up a portion of the capital mobilised on its balance sheet under liabilities in respect of these assets and (ii) generate fresh cash reserves by ceding these assets.
Under the terms of this agreement, BMCE Capital Titrisation shall be appointed as arranger for the Group’s first real estate securitisation deal. This inaugural deal will be for a sum of between MAD 500 million and MAD 1 billion exclusive of taxes.
This agreement is for a 12-month period taking effect on the date that it is signed. It will be automatically renewed by additional 3-month periods, if required, and shall end as soon as the deal is completed.
As far as the structuring fee is concerned, a retainer fee of MAD 1 million exclusive of taxes will be charged on the date that the mandate is signed. A success fee of 0.4% exclusive of taxes will be paid in the event that the deal is completed successfully.
As far as the placing fee is concerned, compensation of 0.2% exclusive of taxes of the total deal size will be paid at the delivery/settlement date.
Regarding this agreement, BMCE BANK recognised a total expense of MAD 1,181 K for the period ended 31 December 2016.
Persons concerned:
• Mr Brahim BENJELLOUN-TOUIMI, Chairman of BMCE Capital’s Supervisory Board, is also Group Excecutive General Manager of BMCE BANK
• Mr Zouheir BENSAID, a member of BMCE Capital’s Supervisory Board, is also a Director of BMCE BANK
• Mr Driss BENJELLOUN, a member of BMCE Capital’s Supervisory Board, is also Delegate General Manager of BMCE BANK
• Mr M’Fadel EL HALAISSI a member of BMCE Capital’s Supervisory Board, is also Delegate General Manager of BMCE BANK
1.7. Financial advisory mandate between BMCE Bank and BMCE Capital Conseil
Under the terms of this mandate entered into in October 2016, BMCE Bank shall appoint BMCE Capital Conseil as financial advisor and global coordinator for a MAD 2 billion subordinated bond issue.
This agreement has been entered into for a 12-month period taking effect on the date that it is signed. Subsequently, it will be automatically renewed by additional 3-month periods, if necessary, and shall end as soon as the deal is completed.
A flat-rate advisory and placing fee is charged at MAD 2 million exclusive of taxes.
Regarding this agreement, BMCE BANK recognised a total expense of MAD 2,072 K for the period ended 31 December 2016.
Persons concerned:
• Mr Brahim BENJELLOUN-TOUIMI, Chairman of BMCE Capital’s Supervisory Board, is also Group Excecutive General Manager of BMCE BANK
• Mr Zouheir BENSAID, a member of BMCE Capital’s Supervisory Board, is also a Director of BMCE BANK
• Mr Driss BENJELLOUN, a member of BMCE Capital’s Supervisory Board, is also Delegate General Manager of BMCE BANK
• Mr M’Fadel EL HALAISSI a member of BMCE Capital’s Supervisory Board, is also Delegate General Manager of BMCE BANK
1.8. Management agreement between BMCE Bank and Maroc Factoring
BMCE Bank has embarked on a project aimed at revising its policy of distributing factoring products and services within the Group.
In such a context, factoring outstandings will be divided between BMCE Bank and Maroc Factoring based on a number of criteria including balance sheet size and capital. As a result, BMCE Bank will record the factoring transactions in its ledgers with management entrusted to Maroc Factoring.
This management agreement will consist of Maroc Factoring proposing factoring applications to BMCE Bank based on the existing delegated blueprint, providing the Bank with technical assistance in transactions such as checking invoices at the operational level, introducing legal mechanisms for substituting or ceding accounts receivable and monitoring the recovery of the factoring receivables financed.
In terms of compensation, Maroc Factoring will be paid in line with standard market rates.
Regarding this agreement, BMCE BANK recognised a total expense of MAD 830 K for the period ended 31 December 2016.
Persons concerned:
• Mr Brahim BENJELLOUN-TOUIMI, Chairman of Maroc Factoring’s Supervisory Board, is also Group Excecutive General Manager of BMCE BANK
• Mr Driss BENJELLOUN, a member of Maroc Factoring’s Supervisory Board, is also Delegate General Manager of BMCE BANK
• Mr M’Fadel EL HALAISSI, a member of Maroc Factoring’s Supervisory Board, is also Delegate General Manager of BMCE BANK
Spec
ial R
epor
tPA
GE 19
8/19
9
BMCE
BANK
OF
AFRICA
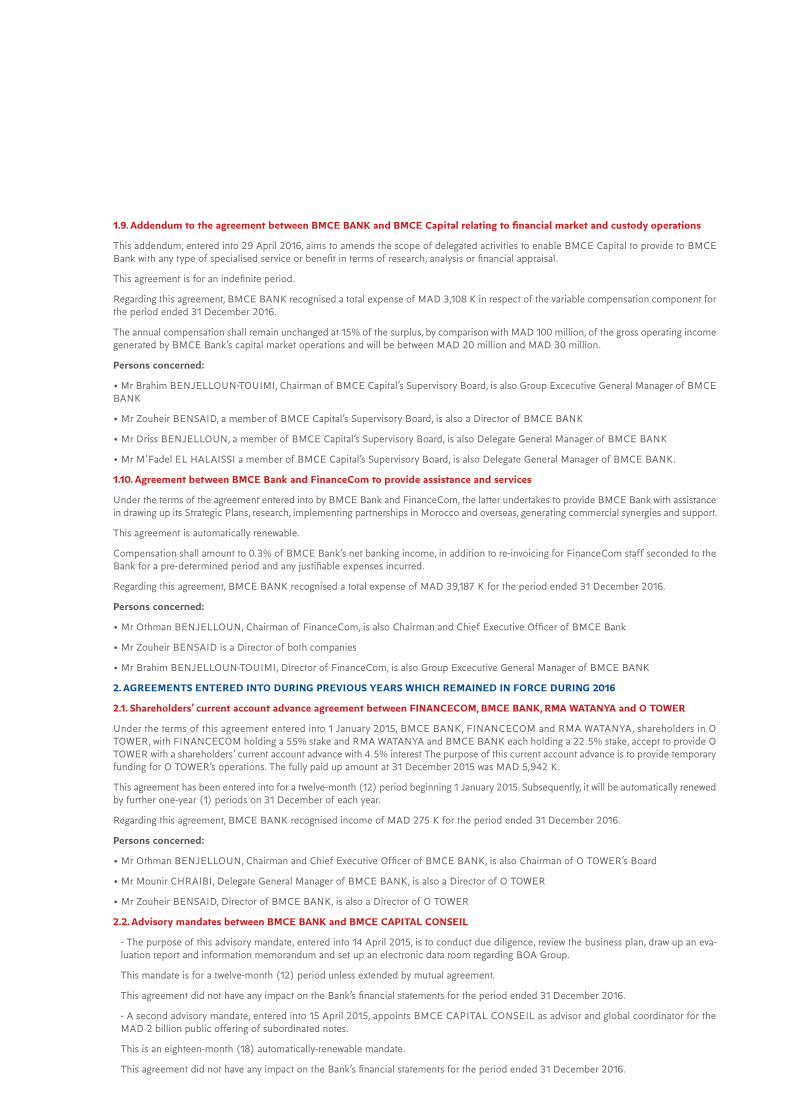
1.9. Addendum to the agreement between BMCE BANK and BMCE Capital relating to financial market and custody operations
This addendum, entered into 29 April 2016, aims to amends the scope of delegated activities to enable BMCE Capital to provide to BMCE Bank with any type of specialised service or benefit in terms of research, analysis or financial appraisal.
This agreement is for an indefinite period.
Regarding this agreement, BMCE BANK recognised a total expense of MAD 3,108 K in respect of the variable compensation component for the period ended 31 December 2016.
The annual compensation shall remain unchanged at 15% of the surplus, by comparison with MAD 100 million, of the gross operating income generated by BMCE Bank’s capital market operations and will be between MAD 20 million and MAD 30 million.
Persons concerned:
• Mr Brahim BENJELLOUN-TOUIMI, Chairman of BMCE Capital’s Supervisory Board, is also Group Excecutive General Manager of BMCE BANK
• Mr Zouheir BENSAID, a member of BMCE Capital’s Supervisory Board, is also a Director of BMCE BANK
• Mr Driss BENJELLOUN, a member of BMCE Capital’s Supervisory Board, is also Delegate General Manager of BMCE BANK
• Mr M’Fadel EL HALAISSI a member of BMCE Capital’s Supervisory Board, is also Delegate General Manager of BMCE BANK.
1.10. Agreement between BMCE Bank and FinanceCom to provide assistance and services
Under the terms of the agreement entered into by BMCE Bank and FinanceCom, the latter undertakes to provide BMCE Bank with assistance in drawing up its Strategic Plans, research, implementing partnerships in Morocco and overseas, generating commercial synergies and support.
This agreement is automatically renewable.
Compensation shall amount to 0.3% of BMCE Bank’s net banking income, in addition to re-invoicing for FinanceCom staff seconded to the Bank for a pre-determined period and any justifiable expenses incurred.
Regarding this agreement, BMCE BANK recognised a total expense of MAD 39,187 K for the period ended 31 December 2016.
Persons concerned:
• Mr Othman BENJELLOUN, Chairman of FinanceCom, is also Chairman and Chief Executive Officer of BMCE Bank
• Mr Zouheir BENSAID is a Director of both companies
• Mr Brahim BENJELLOUN-TOUIMI, Director of FinanceCom, is also Group Excecutive General Manager of BMCE BANK
2. AGREEMENTS ENTERED INTO DURING PREVIOUS YEARS WHICH REMAINED IN FORCE DURING 2016
2.1. Shareholders’ current account advance agreement between FINANCECOM, BMCE BANK, RMA WATANYA and O TOWER
Under the terms of this agreement entered into 1 January 2015, BMCE BANK, FINANCECOM and RMA WATANYA, shareholders in O TOWER, with FINANCECOM holding a 55% stake and RMA WATANYA and BMCE BANK each holding a 22.5% stake, accept to provide O TOWER with a shareholders’ current account advance with 4.5% interest The purpose of this current account advance is to provide temporary funding for O TOWER’s operations. The fully paid up amount at 31 December 2015 was MAD 5,942 K.
This agreement has been entered into for a twelve-month (12) period beginning 1 January 2015. Subsequently, it will be automatically renewed by further one-year (1) periods on 31 December of each year.
Regarding this agreement, BMCE BANK recognised income of MAD 275 K for the period ended 31 December 2016.
Persons concerned:
• Mr Othman BENJELLOUN, Chairman and Chief Executive Officer of BMCE BANK, is also Chairman of O TOWER’s Board
• Mr Mounir CHRAIBI, Delegate General Manager of BMCE BANK, is also a Director of O TOWER
• Mr Zouheir BENSAID, Director of BMCE BANK, is also a Director of O TOWER
2.2. Advisory mandates between BMCE BANK and BMCE CAPITAL CONSEIL
- The purpose of this advisory mandate, entered into 14 April 2015, is to conduct due diligence, review the business plan, draw up an eva-luation report and information memorandum and set up an electronic data room regarding BOA Group.
This mandate is for a twelve-month (12) period unless extended by mutual agreement.
This agreement did not have any impact on the Bank’s financial statements for the period ended 31 December 2016.
- A second advisory mandate, entered into 15 April 2015, appoints BMCE CAPITAL CONSEIL as advisor and global coordinator for the MAD 2 billion public offering of subordinated notes.
This is an eighteen-month (18) automatically-renewable mandate.
This agreement did not have any impact on the Bank’s financial statements for the period ended 31 December 2016.

Persons concerned:
• Mr Brahim BENJELLOUN-TOUIMI, Chairman of BMCE Capital’s Supervisory Board, is also Group Excecutive General Manager of BMCE BANK
• Mr Amine BOUABID, a member of BMCE Capital’s Supervisory Board, is also a Director of BMCE BANK
• Mr Zouheir BENSAID, a member of BMCE Capital’s Supervisory Board, is also a Director of BMCE BANK
• Mr Driss BENJELLOUN, a member of BMCE Capital’s Supervisory Board, is also Delegate General Manager of BMCE BANK
• Mr M’Fadel EL HALAISSI a member of BMCE Capital’s Supervisory Board, is also Delegate General Manager of BMCE BANK.
2.3. Loan contract between BMCE BANK and BOA GROUP
BMCE BANK entered into a contract 22 June 2015 to grant BOA Group a EUR 20 million loan with a 7-year maturity and an interest-free option to defer repayment of the capital by 2 years. The loan will earn annual interest at a variable rate equivalent to 6-month Euribor plus a 350 basis points margin excluding taxes.
The contract also specifies the main characteristics and repayment terms of the loan.
Regarding this agreement, BMCE BANK recognised income of MAD 7,738 K for the period ended 31 December 2016.
Persons concerned:
• Mr Brahim BENJELLOUN-TOUIMI, Chairman and Chief Executive Officer of BOA Group, is also Group Excecutive General Manager of BMCE BANK
• Mr Azeddine GUESSOUS is a Director of BOA Group and of BMCE BANK
• Mr Amine BOUABID, Chief Executive Officer of BOA Group, is also a Director of BMCE BANK
• Mr Driss BENJELLOUN, Director of BOA Group, is also Delegate General Manager of BMCE BANK
• Mr Mohamed AGOUMI, a Director of BOA Group, is also Delegate General Manager of BMCE BANK
2.4. Addendum to the agreement between Salafin and BMCE BANK relating to the adoption of a customer file recovery manage-ment system
As part of the project for adopting a joint approach to loan recovery, BMCE BANK and Salafin entered into a framework agreement 15 Sep-tember 2008, subsequently modified 5 June 2009, which defines the terms for establishing a dedicated loan recovery system.
The revised loan recovery policy at the commercial level recommends that the banking network becomes involved by assuming responsibility for the first and second missed payments for all types of product.
The purpose of this amendment is to define the new terms and remit of each party.
Regarding remuneration, since 1 July 2015, Salafin will intervene from the third missed payment and will invoice 13% of the amount recovered with a minimum payment of 60 dirhams excluding taxes per customer.
A customer file is managed on the Salafin system until all arrears have been recovered or transferred to those entities defined under the recovery strategy. In the event that the number of customers in arrears is halved, the remuneration will be 5% of the amount recovered with a minimum payment of 60 dirhams excluding taxes per customer.
Text messages are invoiced at the same rate as for customer files not managed by Salafin.
Regarding this agreement, BMCE BANK recognised income of MAD 8,305 K for the period ended 31 December 2016.
Persons concerned:
• Mr Brahim BENJELLOUN TOUIMI, Chairman of SALAFIN’s Supervisory Board, is also Group Excecutive General Manager of BMCE BANK
• Mr Mamoun BELGHITI and Mr Amine BOUABID, members of SALAFIN’s Supervisory Board
• Mr Driss BENJELLOUN and Mr Omar TAZI, members of SALAFIN’s Supervisory Board, are also Delegate General Managers of BMCE BANK.
2.5. Deed of sale of the current account between ALLIANCES DARNA and BMCE BANK
Previously, ALLIANCES DARNA held a shareholders’ current account with a balance of MAD 250,143 against RIYAD ALNOUR, a real estate developer in which BMCE BANK acquired a holding as part of a sale with a buy-back option.
A deed of transfer was signed 21 July 2015 by Alliances Darna and BMCE BANK, as a result of which the latter became owner of the said shareholder current account. The sale was agreed in the sum of MAD 250,143 K.
Regarding this agreement, BMCE BANK recognised income of MAD 10,172 K for the period ended 31 December 2016.
Spec
ial R
epor
tPA
GE 2
00/2
01
BMCE
BANK
OF
AFRICA

Person concerned:
• Mr M’Fadel ELHALAISSI, Delegate General Manager of BMCE BANK, is also a Director of RIYAD ALNOUR
2.6. Services agreement between BMCE BANK and BMCE Capital
BMCE BANK and BMCE Capital entered into a services agreement 27 November 2015 effective 1 January 2015.
This agreement provides for legal and regulatory assistance for carrying out specific transactions within BMCE BANK Group and drawing up deeds in the name and on behalf of BMCE BANK.
This is a one-year automatically-renewable agreement.
Regarding this agreement, BMCE BANK recognised a total expense of MAD 622 K for the period ended 31 December 2016.
Persons concerned:
• Mr Brahim BENJELLOUN-TOUIMI, Chairman of BMCE Capital’s Supervisory Board, is also Group Executive Managing Director of BMCE BANK
• Mr Amine BOUABID, a member of BMCE Capital’s Supervisory Board, is also a Director of BMCE BANK
• Mr Zouheir BENSAID, a member of BMCE Capital’s Supervisory Board, is also a Director of BMCE BANK
• Mr Driss BENJELLOUN, a member of BMCE Capital’s Supervisory Board, is also Delegate General Manager of BMCE BANK
• Mr M’Fadel EL HALAISSI, a member of BMCE Capital’s Supervisory Board, is also Delegate General Manager of BMCE BANK
2.7. Shareholder current account agreement between RIYAD ALNOUR and BMCE BANK
Under the terms of this agreement entered into 22 December 2015, BMCE BANK accepts to provide RIYAD ALNOUR with a shareholders’ current account advance of MAD 221,500 K with 4% interest. The purpose of this advance is to enable RIYAD ALNOUR to entirely clear its debts towards BMCE BANK regarding short- and medium-term loans and overdrawn balances. The amount advanced under the shareholders’ current account will be fully repaid in fine on exercising the buy-back option.
Regarding this agreement, BMCE BANK recognised income of MAD 9,008 K for the period ended 31 December 2016.
Person concerned:
• Mr M’Fadel ELHALAISSI, Deputy Chief Executive Officer of BMCE BANK, is also a Director of RIYAD ALNOUR
2.8. Addendum to the agreement between BMCE BANK and BMCE Capital relating to financial market and custody operations
This addendum, entered into 18 December 2014, amends the terms and conditions for remunerating BMCE Capital in respect of its manage-ment of BMCE BANK’s financial market and custody operations as stipulated in the initial contract of 1999 and in subsequent amendments.
This is a one-year automatically-renewable addendum.
Regarding this agreement, BMCE BANK recognised a total expense of MAD 3,108 K in respect of the variable compensation component for the period ended 31 December 2016.
Persons concerned:
• Mr Brahim BENJELLOUN TOUIMI, Chairman of BMCE Capital’s Supervisory Board, is also Group Executive Managing Director of BMCE BANK
• Mr Amine BOUABID, Director of BMCE BANK, is also Member of BMCE Capital’s Supervisory Board
• Mr Zouheir BENSAID, Director of BMCE BANK, is also Member of BMCE Capital’s Supervisory Board
• Mr Driss BENJELLOUN and Mr M’Fadel EL HALAISSI, Delegate General Managers of BMCE BANK, are also Members of BMCE Capital’s Supervisory Board
2.9. IT transfer and services agreement between BMCE BANK, BMCE BANK International and IT International Services
Under the terms of this agreement entered into 28 February 2014, BMCE BANK International Plc shall transfer its IT platform to IT Inter-national Services, a subsidiary of BMCE BANK, with the latter providing IT services in consideration.
In respect of 2014, the price relating to this transfer amounted to EUR 2,989,438.
This agreement did not have any impact on the Bank’s financial statements for the period ended 31 December 2016.
Persons concerned:
• Mr Brahim BENJELLOUN-TOUIMI is Group Executive Managing Director of BMCE BANK and Director of BMCE BANK international Plc
• Mr Mohammed AGOUMI, Director of BMCE BANK International Plc, is also Delegate General Manager of BMCE BANK and Director of IT International Services
• Mr Mounir CHRAIBI, Delegate General Manager of BMCE BANK, is also a Director of IT International Services
2.10. Shareholder current account advance agreement between BMCE BANK and BMCE IMMOBILIER (ex MABANICOM)
Under the terms of this agreement entered into 13 February 2014, BMCE BANK accepts to provide BMCE IMMOBILIER (ex MABANI-COM) with a shareholders’ current account advance in the total net sum of MAD 38,000,000 with 3.45% statutory interest in respect of the financial period 2013.
The advance has been agreed for a one-year renewable period and it will be repaid by appropriating income arising on the sale of property units acquired by means of the said advance to the company Pack Energy on a gradual basis.
Entered into for a renewable one-year period, the agreement shall expire when BMCE IMMOBILIER (ex MABANICOM) has repaid BMCE BANK in full.
Regarding this agreement, BMCE BANK recognised a total expense of MAD 977 K for the period ended 31 December 2016.
Persons concerned:
• Mr Mounir CHRAIBI, Chairman of the Board of BMCE IMMOBILIER (ex MABANICOM), is also Delegate General Manager of BMCE BANK
• Mr M’Fadel EL HALAISSI, Director of BMCE IMMOBILIER (ex MABANICOM), is also Delegate General Manager of BMCE BANK
• Mr Omar TAZI, Director of BMCE IMMOBILIER (ex MABANICOM), is also Delegate General Manager of BMCE BANK
2.11. Cooperation agreement between BMCE BANK and BMCE IMMOBILIER
Entered into 3 February 2014, the purpose of this agreement is to carry out the following assignments in consideration for remuneration on an individual assignment basis:
• Real estate brokerage services when requested or required by BMCE BANK in respect of leasing, purchasing or selling real estate assets owned by or on behalf of BMCE BANK and BMCE BANK Group;
• Collecting rents and lease payments due to BMCE BANK and BMCE BANK Group;
• Providing real estate valuation services, researching real estate projects, and notifying the customer of special conditions when requested or required in respect of valuing real estate assets on behalf of BMCE BANK and BMCE BANK Group.
This agreement shall be for a period of 3 years.
Regarding this agreement, BMCE BANK recognised an expense of MAD 4,899 K for the period ended 31 December 2016.
Persons concerned:
• Mr Mounir CHRAIBI, Chairman of the Board of BMCE IMMOBILIER (ex MABANICOM), is also Delegate General Manager of BMCE BANK
• Mr M’Fadel EL HALAISSI, Director of BMCE IMMOBILIER (ex MABANICOM), is also Delegate General Manager of BMCE BANK
• Mr Omar TAZI, Director of BMCE IMMOBILIER (ex MABANICOM), is also Delegate General Manager of BMCE BANK
2.12. Draft agreement between BMCE BANK and Medi Télécom SA relating to establishing an operational partnership regarding the Mobile Money service
This draft agreement, entered into 26 June 2012, prior to establishing a definitive contract, relates to this partnership and establishes the project’s strategic guidelines and principles for doing business.
This agreement did not have any impact on the Bank’s financial statements for the period ended 31 December 2016.
Persons concerned:
• Mr Othman BENJELLOUN, Chairman and Chief Executive Officer of BMCE BANK, is also a Director of MEDI TELECOM
• Mr Zouheir BENSAID, Director of MEDI TELECOM, is also a Director of BMCE BANK
2.13. Delegated responsibility agreement between BMCE BANK and BMCE International SAU relating to the management of BMCE Euroservices
The purpose of this contract, entered into 10 April 2012, is to formalise intra-Group relations between the parties regarding the responsibility assumed by BMCE INTERNATIONAL SAU in relation to services carried out by BMCE Euro Services, its wholly-owned subsidiary, under the orders of BMCE BANK, of which the former is indirectly a wholly-owned subsidiary.
This agreement did not have any impact on the Bank’s financial statements for the period ended 31 December 2016.
Persons concerned:
• Mr Mohamed AGOUMI, Chairman of BMCE International SAU’s Board, is also Delegate General Manager of BMCE BANK and Director of BMCE Euroservices
• Mr Azzedine GUESSOUS and Mr Mohammed BENNANI are Directors of BMCE BANK and of BMCE International SAU
• Mr Brahim BENJELLOUN-TOUIMI, Group Executive General Manager of BMCE BANK, is also a Director of BMCE International SAU and Chairman of the Board of BMCE Euroservices
Spec
ial R
epor
tPA
GE 2
02/2
03
BMCE
BANK
OF
AFRICA

2.14. Management mandate between BMCE BANK and BOA France
This agreement, entered into 6 June 2012 between BMCE BANK and BOA France, a subsidiary of BOA Group, establishes the terms and conditions by which BMCE BANK mandates BOA France, in consideration for the payment of fees, to handle on its behalf financial transac-tions for Moroccan customers living abroad. The contract also defines the operating terms and conditions of the BMCE BANK account held in the ledgers of BOA France.
This agreement did not have any impact on the Bank’s financial statements for the period ended 31 December 2016.
Persons concerned:
• Mr Brahim BENJELLOUN-TOUIMI, Chairman of BOA Group’s Board, is also Group Executive General Manager of BMCE BANK
• Mr Azeddine GUESSOUS is a Director of BOA Group and of BMCE BANK
• Mr Amine BOUABID, Chief Executive Officer of BOA Group, is also a Director of BMCE BANK
• Mr Driss BENJELLOUN, a Director of BOA Group, is also Delegate General Manager of BMCE BANK
• Mr Mohamed AGOUMI, a Director of BOA Group, is also Delegate General Manager of BMCE BANK
2.15. Agreement between BMCE BANK and BMCE Capital Gestion Privée to manage structured product margin calls
Under this agreement, entered into 29 June 2012, BMCE Capital Gestion Privée undertakes to monitor the risk of fluctuation in structured products contracted between the Parties by adopting a margin call system for the said structured products.
Remuneration for margin calls on behalf of BMCE BANK is based on dirham-denominated money market rates.
This agreement did not have any impact on BMCE BANK’s financial statements for the period ended 31 December 2016.
Persons concerned:
• Mr Brahim BENJELLOUN-TOUIMI, Chairman of BMCE Capital’s Supervisory Board, is also Group Executive General Manager of BMCE BANK
• Mr Amine BOUABID, a member of BMCE Capital’s Supervisory Board, is also a Director of BMCE BANK
• Mr Zouheir BENSAID, a member of BMCE Capital’s Supervisory Board, is also a Director of BMCE BANK
• Mr Driss BENJELLOUN, a member of BMCE Capital’s Supervisory Board, is also Delegate General Manager of BMCE BANK
• Mr M’Fadel EL HALAISSI, a member of BMCE Capital’s Supervisory Board, is also Delegate General Manager of BMCE BANK.
2.16. Services contract between BMCE BANK and RMA Watanya
Entered into in April 2012 effective 1 October 2011, this contract defines general and specific terms and conditions regarding the provision of premises, miscellaneous services and equipment by BMCE BANK to RMA WATANYA.
It also establishes the terms and conditions of use by the latter of the resources made available in consideration for a flat-rate payment.
Regarding this agreement, BMCE BANK recognised income of MAD 121 K for the period ended 31 December 2016.
Persons concerned:
• Mr Othman BENJELLOUN, Chairman of RMA WATANYA’s Supervisory Board is also Chairman and Chief Executive Officer of BMCE BANK
• Mr Zouheir BENSAID is Chairman of RMA WATANYA’s Supervisory Board and Director of BMCE BANK
• Mr Brahim BENJELLOUN-TOUIMI is a Member of RMA WATANYA’s Supervisory Board and is Group Executive General Manager of BMCE BANK
2.17. Technical support agreement between BMCE BANK and AFH Services
Under the terms of this one-year automatically-renewable agreement entered into in 2012, BMCE BANK provides intra-Group technical support to AFH aimed at providing BOA Group with business line expertise.
In consideration, AFH is invoiced for these services on the basis of man days at a rate of €1,200 excluding taxes per man day.
This agreement did not have any impact on BMCE BANK’s financial statements for the period ended 31 December 2016.
Persons concerned:
• Mr Brahim BENJELLOUN-TOUIMI, Chairman of BOA Group, is also Group Executive General Manager of BMCE BANK
• Mr Driss BENJELLOUN, Delegate General Manager of BMCE BANK, is also a Director of AFH Services

2.18. Services agreement between BMCE BANK and BMCE Capital
Entered into 20 November 2012 effective 1 January 2012, this one-year automatically-renewable agreement establishes the terms and condi-tions by which BMCE BANK remunerates BMCE Capital for technical support provided to BOA Group via its legal division.
Remuneration for the said services, invoiced on an annual basis, is calculated on the basis of man days at a rate of €100 per man day.
This agreement did not have any impact on BMCE BANK’s financial statements for the period ended 31 December 2016.
Persons concerned:
• Mr Brahim BENJELLOUN-TOUIMI, Chairman of BMCE Capital’s Supervisory Board, is also Group Executive General Manager of BMCE BANK
• Mr Amine BOUABID, Director of BMCE BANK, is also Member of BMCE Capital’s Supervisory Board
• Mr Zouheir BENSAID, Director of BMCE BANK, is also Member of BMCE Capital’s Supervisory Board
• Mr Driss BENJELLOUN, Delegate General Manager of BMCE BANK, is also Member of BMCE Capital’s Supervisory Board
• Mr M’Fadel EL HALAISSI, Delegate General Manager of BMCE BANK, is also Member of BMCE Capital’s Supervisory Board.
2.19. Amendment to a subordinated loan contract between BMCE BANK and BMCE International
Under this agreement entered into 30 May 2010, BMCE BANK shall make available to BBI a subordinated loan for the euro equivalent of £15,000,000 at an annual fixed rate of 4% in respect of Tier 2 capital.
The loan’s repayment date is ten years after the agreement’s effective date under the terms of an amendment entered into 25 July 2012.
Regarding this agreement, BMCE BANK recognised income of MAD 7,790 K for the period ended 31 December 2016.
Persons concerned:
• Mr Brahim BENJELLOUN-TOUIMI, Director of BMCE BANK International Plc, is also Group Executive General Manager of BMCE BANK
• Mr Mohammed AGOUMI, Director of BMCE BANK International Plc, is also Delegate General Manager of BMCE BANK
2.20. Agreements between BMCE BANK and SALAFIN
• Services contract between BMCE BANK and SALAFIN
This three-year automatically-renewable services contract, entered into in 2009, defines the terms and conditions by which BMCE BANK provides SALAFIN with a certain number of services and equipment as well as the terms governing usage.
BMCE BANK receives a flat royalty payment of MAD 1,000 including taxes per desk. Royalties are paid on a quarterly basis in advance.
Regarding this agreement, BMCE BANK recognised income of MAD 84 K for the period ended 31 December 2016.
• Agreement that SALAFIN establishes an on-demand credit compliance control system for BMCE BANK’s customer files as well as hosting a management system on an ASP basis (via its ORUS subsidiary)
Entered into in 2011, the purpose of this agreement between BMCE BANK and SALAFIN is to establish a back-office system to ensure cus-tomer file compliance, send reminders to the network to correct non-compliant customer files and report on operational risks. The system also centralises and processes customer declarations of death and disability insurance subscriptions and digitises and archives customer loan files that have been transferred to an entity appointed by the Bank.
The agreement also relates to hosting, running and maintaining on a daily basis a customer file management system based on the Immédiat system which is interfaced with the Bank’s information systems as well as providing BMCE BANK with a maintenance centre.
The remuneration paid by BMCE BANK is calculated on the basis of the number of customer files actually processed by the system based on a pricing structure.
Regarding this agreement, BMCE BANK recognised an expense of MAD 211 K for the period ended 31 December 2016.
- Agreement between BMCE BANK and Salafin relating to services, technical support and application hosting
Entered into 15 January 2009, this agreement relates to the implementation of a recovery service by which SALAFIN undertakes to carry out the assignments entrusted to it by BMCE BANK (recovery system support and set-up, provision of a user licence for the management module for attributing portfolios to agents and the telecommunications management module, development of interfaces with BMCE BANK’s infor-mation systems, dedicated hosting and running of the recovery software solution on a daily basis and the provision of a maintenance centre).
Regarding this agreement, BMCE BANK recognised an expense of MAD 1.081 K for the period ended 31 December 2016.
• Amendment to the agreement that SALAFIN establishes an on-demand credit compliance control system for BMCE BANK’s customer files
Entered into 1 July 2011, this amendment to the agreement between BMCE BANK and SALAFIN modifies the remuneration terms, establi-shed by the distribution agreement entered into in 2006, by ensuring joint management by both Parties in respect of new consumer loans distributed to retail customers. As a result, interest income will be split as follows: 80% to the entity which bears the risk and 20% to the other entity. This amendment also specifies the services provided by SALAFIN for all outstandings managed by one or both Parties.
Spec
ial R
epor
tPA
GE 2
04/2
05
BMCE
BANK
OF
AFRICA

Regarding this agreement and its amendment, BMCE BANK recognised an expense of MAD 106,526 K and total income of MAD 14,904 K for the period ended 31 December 2016.
Persons concerned :
• Mr Brahim BENJELLOUN TOUIMI, Chairman of SALAFIN’s Supervisory Board, is also Group Executive General Manager of BMCE BANK
• Mr Mamoun BELGHITI and Mr Amine BOUABID are members of Salafin’s Supervisory Board and Directors of BMCE BANK
• Mr Omar TAZI and Mr Driss BENJELLOUN are members of Salafin’s Supervisory Board and Delegate General Managers of BMCE BANK
2.21. Agreements between BMCE BANK and Eurafric Information (EAI)
• Draft agreement between BMCE BANK and Eurafric Information (EAI) relating to the invoicing of software licences and related services
Entered into 2 December 2011, the purpose of this agreement is for EAI to provide BMCE BANK with a certain number of licences as des-cribed in the contract (Briques GRC, E-Banking Cyber Mut, Poste Agence Lot 1) for use by the latter’s employees.
In consideration, BMCE BANK must pay EAI the dirham equivalent of €4,800,370.40 for CRM services, €3,303,063.20 for CRM licences, €201,976.60 for the Poste Agence Lot 1 licence, €729.504 for Poste Agence Lot 1 services, €500,000 for E-Banking licences and €768,672 for E-Banking services. These amounts exclude taxes, to which must be added an additional 10% in respect of a government withholding tax deducted at source.
BMCE BANK must also pay licence maintenance costs including €545,004.80 for CRM maintenance, €105,694 for the Poste Agence Lot 1 contract and €162,801 for maintenance of E-banking Cyber Mut.
• Amendment No.2 APPENDIX III to the services contract between BMCE BANK and Eurafric Information
Entered into 10 March 2011 effective 1 January, this amendment modifies the services provided by EAI to BMCE BANK as well as the pricing structure and the terms and conditions of payment. The amendment offers the possibility of revising on an annual basis the man-hour rate applicable to services provided under the initial contract.
In respect of both these agreements entered into with EAI in 2011, BMCE BANK recognised the following amounts for the period ended 31 December 2016:
• Recurring services (expenses): MAD 54,209 K
• Maintenance (expenses): MAD 9,204 K
• Non-recurring services (non-current assets): MAD 89,404 K
Persons concerned:
• Mr Brahim BENJELLOUN-TOUIMI, Chairman of EAI’s Supervisory Board, is also a Group Executive General Manager of BMCE BANK
• Mr Zouheir BENSAID, Director of BMCE BANK, is also a member of EAI’s Supervisory Board
• Mr Driss BENJELLOUN and Mr Mounir CHRAIBI, Directors of EAI, are also Delegate General Managers of BMCE BANK
2.22. Agreement between BMCE BANK and Global Network Systems SA (“GNS”) relating to Carte MPOST – Passport
Entered into 1 February 2011, the purpose of this agreement is for BMCE BANK to provide GNS with prepaid cards as well as determining the terms for recharging, personalising and using these cards.
For each card delivered, the Bank is credited an amount previously agreed by both Parties.
The cost of recharging the card is debited against the customer’s bank account held with BMCE BANK. All other expenses are debited against the card’s balance.
This agreement did not have any impact on the Bank’s financial statements for the period ended 31 December 2016.
Persons concerned:
• Mr Mounir CHRAIBI, Chairman of the Board of GNS Technologies, is also Delegate General Manager of BMCE BANK.
• Mr M’Fadel EL HALAISSI and Mr Driss BENJELLOUN, Delegate General Managers of BMCE BANK, are also Directors of GNS Techno-logies
2.23. Services contract between BMCE BANK and Eurafric GED Services SAS
Entered into in 2011 for an initial three-month automatically-renewable period prior to establishing a definitive contract when authorisation is obtained from Bank Al Maghrib, the purpose of this contract is to define the terms and conditions by which BMCE BANK entrusts to Eurafric GED Services document digitisation services.
Monthly invoices are issued based on volume. The cost is 0.86 dirhams per digitised page, 0.68 dirhams per video-encoded document, 5 dirhams per document for the return of any previously unreturned document to the service provider, 3 dirhams per document communicating the index in the event that the document has been returned to BMCE BANK (prices quoted exclude taxes).
Regarding this agreement, BMCE BANK recognised an expense of MAD 1.854 K for the period ended 31 December 2016.

Spec
ial R
epor
t
Persons concerned:
• Mr Brahim BENJELLOUN-TOUIMI, Chairman of EAI’s Supervisory Board, is also Group Executive General Manager of BMCE BANK.
2.24. Partnership agreement between BMCE BANK and BMCE BANK International Plc relating to sub-contracting clearing services
Under the terms of this agreement entered into 4 October 2011, BMCE BANK International provides BMCE BANK with a number of banking services including:
- Cheques drawn on French- or foreign-domiciled banks;
- Inter-bank transfers to BMCE BANK or its customers;
- International SWIFT transfers;
- Bills of exchange domiciled with BMCE BANK and payable in France;
- Documentary credit confirmations
This agreement did not have any impact on the Bank’s financial statements for the period ended 31 December 2016.
Persons concerned:
• Mr Brahim BENJELLOUN-TOUIMI, Director of BMCE BANK International Plc, is also Group Executive General Manager of BMCE BANK
• Mr Mohammed AGOUMI, Director of BMCE BANK International Plc, is also Delegate General Manager of BMCE BANK
2.25. Agreement between BMCE BANK and BMCE Capital Gestion to promote and market mutual funds via the BMCE BANK branch network
Entered into 1 March 2011 for an automatically-renewable 12-month period, the purpose of this agreement is to determine the terms and conditions for cooperation between the Parties relating to the marketing by BMCE BANK of a specific number of BMCE Capital Gestion products via the BMCE BANK branch network. In this regard, the Parties give a mutual undertaking to allocate the necessary human, material, technical and logistical resources to develop and promote the mutual funds.
BMCE BANK’s remuneration is calculated on the basis of the volume of subscriptions/redemptions generated by the branch network with BMCE CAPITAL GESTION retroceding a share of the entry/exit fees at the rates set out in an appendix to the agreement.
This agreement did not have any impact on the Bank’s financial statements for the period ended 31 December 2016.
Persons concerned:
• Mr Amine BOUABID, Director of BMCE Capital Gestion, is also a Director of BMCE BANK
• Mr Driss BENJELLOUN, Delegate General Manager of BMCE BANK, is also a Director of BMCE Capital Gestion
2.26. Agreements relating to leasing premises
These agreements relate to the leasing of premises or offices to the following companies:
COMPANY DATE NATURE LOCALISATION AMOUNT 2016 (MAD K)
EAI 01/03/2011 OFFICE SPACE
49 & 51 RUE ALI IBNOU ABI TALEB, GROUND FLOOR, 1ST TO 7TH FLOORS, CAR PARK AND BASEMENT, CASABLANCA
6.469 KDH
AU 30/09/2016
RM EXPERTS 01/01/2011 OFFICE SPACE
IMMEUBLE ZÉNITH, NO.2 AND 2 BIS, LOTISSEMENT TAOUFIK, ROUNDABOUT ROUTE DE MARRAKECH AND BOUSKOURA, CASABLANCA
1.095 KDH
BMCE CAPITAL 01/10/2009 OFFICE SPACE 142, AVENUE HASSAN II, 4TH, 7TH AND 8TH FLOOR, CASABLANCA 2.957 KDH
MEDITELECOM 01/08/2012 BUILDING PATIO ESSAOUIRA 99,8 KDHBMCE CAPITAL 01/07/2002 OFFICE SPACE BMCE BANK BRANCH, AGADIR VILLE 33,7 KDH
EURAFRIC INFORMATION 15/10/2009
279 M² APARTMENT TF NO.36929/C, PROPERTY KNOWN AS “GAMECOUR”
243 BD MOHAMED V, CASABLANCA
256 KDH
AU 30/09/2016
The leases are renewed automatically.
PAGE
206
/207
BMCE
BANK
OF
AFRICA

2.27. Three-party agreement relating to the transfer of leases in respect of the acquisition and development of office premises in Avenue Imam Malik, Rabat
Entered into 16 March 2011 between BMCE CAPITAL, the initial lessee, BMCE Bank, the current lessee and MAGHREBAIL, the lessor, this agreement provides for the transfer of leases to BMCE Bank in consideration for a monthly rental payment of MAD 68,453.70 excluding taxes and a total fixed cost of MAD 7,200,000 in relation to funding costs of which MAD 720,000 relates to the estimated land value.
This contract is for a period of 97 months from 25 April 2011 to 24 May 2019.
In respect of this contract, BMCE Bank recognised a total expense of MAD 851 K thousand for the period ended 31 December 2016.
Persons concerned:
• Mr Azeddine GUESSOUS, Chairman of the Board of Maghrebail, is also Director of BMCE Bank
• Mr Othman BENJELLOUN, Mr Zouheir BENSAID and Mr Brahim BENJELLOUN-TOUIMI, Directors of Maghrebail are also respectively Chairman and Chief Executive Officer, Director and Group Executive General Manager of BMCE Bank
• Mr Brahim BENJELLOUN-TOUIMI, Chairman of BMCE Capital’s Supervisory Board, is also Group Executive General Manager of BMCE Bank
• Mr Zouheir BENSAID, Director of BMCE Bank, is also a member of BMCE Capital’s Supervisory Board
• Mr Driss BENJELLOUN and Mr M’Fadel EL HALAISSI, members of BMCE Capital’s Supervisory Board are also Delegate General Managers of BMCE Bank
2.28. Amendment to the BMCE EDIFIN agreement between BMCE BANK and GLOBAL NETWORK SYSTEMS (GNS), now GNS TECHNOLOGIES SA
Entered into 2 April 2010 and effective 1 January 2010, the purpose of this amendment, as part of the Bank’s policy to extend BMCE EDIFIN services to all commercial relations and enhance profitability, is to revise the monthly payment for GNS’ Value-Added Network services. In this regard, BMCE BANK shall assume the role of wholesaler as well responsibility for marketing the services acquired from GNS.
A second amendment, entered into 30 December 2011 and effective January 2012, sees the annual payment made by BMCE BANK to the service provider reduced to MAD 2,750,000 excluding taxes which corresponds to the minimum volume that it undertakes to acquire from 2,000,000 transaction entries.
Regarding this agreement, BMCE BANK recognised an expense of MAD 2,870 K for the period ended 31 December 2016.
Persons concerned:
• Mr Mounir CHRAIBI, Chairman of the Board of GNS Holding, is also Delegate General Manager of BMCE BANK
• Mr M’Fadel EL HALAISSI and Mr Driss BENJELLOUN, Delegate General Managers of BMCE BANK, are also Directors of GNS Holding
2.29. Services contract between BMCE BANK and RM Experts relating to debt recovery
Entered into 24 December 2010 between RECOVERY INTERNATIONAL MANAGEMENT AND EXPERTISE (RM EXPERTS) and BMCE BANK, the agreement mandates RM EXPERTS on an exclusive basis to recover the non-performing loans entrusted to it by BMCE BANK.
The contract is for a five-year period which is automatically renewable in subsequent two-year periods.
BMCE BANK undertakes to make available to the service provider, on a secondment basis, all staff working in the Remedial Management Division from the contract date. These employees will be paid directly by BMCE BANK.
BMCE BANK will invoice the service provider for these employees’ salaries and other items of remuneration plus a 20% margin.
RM EXPERTS will invoice BMCE BANK for “managing its human resources”.
As part of this agreement, for each customer file for which the amount to be recovered is less than two hundred K dirhams, BMCE BANK will be invoiced for the sum of five hundred dirhams excluding taxes in respect of related expenses. RM EXPERTS also receives from BMCE BANK success fees payable on a quarterly basis depending on the sums repaid or recovered.
In the event of non-recovery, BMCE BANK undertakes to reimburse RM EXPERTS for all actual costs incurred by the latter.
BMCE BANK paid RM EXPERTS success fees of MAD 35,094 K and management fees of MAD 3,523 K for the period ended 31 December 2016.
Persons concerned:
• Mr Mamoun BELGHITI, Chairman of the Board of RM EXPERTS, is also a Director of BMCE BANK
• Mr Brahim BENJELLOUN-TOUIMI, Group Executive General Manager of BMCE BANK, is also a Director of RM Experts
• Mr M’Fadel EL HALAISSI, Delegate General Manager of BMCE BANK, is also a Director of RM Experts
2.30. Agreement between BMCE BANK and Maghrebail
Entered into 8 May 2009, the purpose of this agreement is to determine the terms and conditions governing BMCE BANK’s marketing of MAGHREBAIL’s formatted lease products, the BMCE Bail product, the BMCE Immobail Entreprise product and standard leasing products,

Spec
ial R
epor
t
regardless of whether or not they are severally and jointly backed by BMCE BANK.
The terms and conditions of this agreement are as follows:
• MAGHREBAIL pays BMCE BANK agency fees as set out in a price list;
• MAGHREBAIL undertakes to pay quarterly agency fees in respect of BMCE BANK’s remuneration;
• MAGHREBAIL undertakes to pay annual success fees calculated on the basis of achieving sales targets that are independently confirmed by a steering committee;
• MAGHREBAIL undertakes to remunerate BMCE BANK for its guarantee at the annual rate of interest in respect of formatted products. The rate of interest charged on the guarantee is determined on a case-by-case basis in respect of standard leasing products, regardless of whether or not they are severally and jointly backed; it is calculated annually on the amount of MAGHREBAIL’s financial outstandings guaranteed by BMCE BANK (financial outstandings x proportion of bank guarantee).
Regarding this agreement, BMCE BANK recognised income of MAD 11,920 K for the period ended 31 December 2016.
Persons concerned:
• Mr Azeddine GUESSOUS, Chairman of Maghrebail, is a Director of BMCE BANK
• Mr Othman BENJELLOUN, Mr Zouheir BENSAID and Mr Brahim BENJELLOUN TOUIMI, Members of the Board of Maghrebail, are respectively Chairman, Directors and Group Executive General Manager of BMCE BANK
• Mr M’Fadel EL HALAISSI, Director of Maghrébail, is also Delegate General Manager of BMCE BANK
2.31 Partnership agreement between BMCE BANK and Locasom
Entered into 29 May 2009, the purpose of this agreement is to determine the terms and conditions governing marketing by BMCE BANK of LOCASOM’s BMCE LLD product (a vehicle leasing product for acquiring and managing a fleet of vehicles). Under this agreement, BMCE BANK will steer its customers towards this product while LOCASOM will follow up with interested customers by providing the necessary support. This product will be marketed via the BMCE BANK branch network.
The terms and conditions of this agreement are as follows:
• BMCE BANK solely undertakes to encourage BMCE LLD customers to make regular lease payments (by directly debiting the customer’s account etc.)
• BMCE BANK receives a fee ranging from 0.15% to 0.40% calculated on the basis of the vehicle’s budgeted amount and the lease period.
This agreement did not have any impact on the Bank’s financial statements for the period ended 31 December 2016.
Persons concerned:
Mr Driss BENJELLOUN and Mr M’Fadel EL HALAISSI, Delegate General Managers of BMCE BANK and Mr Azzedine GUESSOUS, Director of BMCE BANK, are also Directors of Budget Locasom.
2.32. Services contract between BMCE BANK and BMCE EuroServices
Entered into in 2013, this contract aims to clarify the underlying terms and conditions by which BMCE BANK will pay half-yearly fees to the Service Provider in consideration for the latter developing the Moroccans living abroad customer segment in Morocco.
Remuneration of Head Office and Branch Offices will be based on two criteria: a percentage of the net banking income earned by BMCE BANK in the Moroccans living abroad segment and a percentage of the funds transferred to BMCE BANK accounts in Morocco.
Regarding this agreement, BMCE BANK recognised an expense of MAD 146,515 K for the period ended 31 December 2016.
Persons concerned:
• Mr Brahim BENJELLOUN TOUIMI, Chairman of the Board of BMCE EuroServices, is also Group Executive General Manager of BMCE BANK
• Mr Omar TAZI, Assistant Director of BMCE EuroServices, is also Delegate General Manager of BMCE BANK
• Mr Driss BENJELLOUN, Mr Mohamed AGOUMI and Mr Mounir CHRAIBI, Directors of BMCE EuroServices, are also Delegate General Managers of BMCE BANK
2.33. Commercial lease contract between BMCE BANK and GNS TECHNOLOGIES
Under the terms of this agreement, effective 1 January 2013 for an automatically-renewable 3-year period, BMCE BANK shall lease to GNS Technologies office space on the 2nd floor of a building located at 239 Boulevard Mohammed V in Casablanca whose land title number is No.36.829/C with a surface area of 276 m² whose land title number is in turn No.75.965/C, a property known as “GAMECOUR 4”.
The monthly rental payment relating to this office space is set at MAD 16.6 K for the first year, MAD 19.3 K for the second year and MAD 22 K for the third year. To that is added a local council tax of 10.5% payable monthly as well as rental charges to maintain and manage the building’s common areas which are invoiced pro-rata to the surface area rented.
Regarding this agreement, BMCE BANK recognised income of MAD 293 K for the period ended 31 December 2016.
PAGE
208
/209
BMCE
BANK
OF
AFRICA

Persons concerned:
• Mr Mounir CHRAIBI, Chairman of the Board of GNS Technologies, is also Deputy Chief Executive Officer of BMCE BANK
• Mr M’Fadel EL HALAISSI and Mr Driss BENJELLOUN, Delegate General Manager of BMCE BANK, are also Directors of GNS Techno-logies.
2.34. Commercial lease contract between BMCE BANK and RM EXPERTS
Under the terms of this agreement, effective 1 March 2013 for an automatically-renewable 3-year period, BMCE BANK shall lease to RM Experts office space on the 3rd floor of a building located at Casablanca Zénith No.2 et 2A Sidi Maarouf, Taoufik land plot, whose land title number is No.19.779/47 with a surface area of 235 m² whose land title number is in turn No. 19.779/47.
The monthly rental payment is MAD 31.2 K excluding management company and maintenance charges.
Regarding this agreement, BMCE BANK recognised income of MAD 200 K for the period ended 31 December 2016.
Persons concerned:
• Mr Mamoun BELGHITI, Chairman of the Board of RM EXPERTS is also a Director of BMCE BANK
• Mr Brahim BENJELLOUN TOUIMI, Group Executive General Manager of BMCE BANK, is also a Director of RM Experts
• Mr M’Fadel El HALAISSI, Delegate General Manager of BMCE BANK, is also a Director of RM Experts
Casablanca, 12 April 2017
The Statutory Auditors

1 - FUNDAMENTAL ACCOUNTING PRINCIPLES
1.1- Credit institutions are obliged to publish financial statements each financial year which give a true and fair view of their assets, financial position and results.
1.2- Providing a true and fair view will necessarily depend on compliance with seven fundamental accounting principles recommended under General Accounting Standards.
1.3- When transactions, events and positions are accounted for in compliance with fundamental accounting principles and recommendations from Accounting Standards for Credit Institutions, the financial statements are presumed to give a true and fair view of the credit institution’s assets, financial position, assumed risks and results.
1.4- In the event that, after applying these principles, the financial statements do not give a true and fair view, the credit institution is obliged to provide all necessary information in the additional information statement so as to be able to give a true and fair view.
1.5- In the exceptional event that, after strictly applying one of these principles or recommendations, the financial statements do not give a true and fair view, the credit institution is obliged to depart from established accounting principles.
Any eventual departure must be mentioned in the additional information statement and must be duly justified. It must also indicate the impact on the credit institution’s assets, financial position, assumed risks and results.
1.6- The main fundamental accounting principles adopted are listed hereafter:
- Going concern principle
- Consistency principle
- Historical cost principle
- Time period principle
- Prudence principle
- Objectivity principle
- Materiality principle
2.1. Presentation
The financial statements comprise:
- Head office accounts
- The accounts of domestic branches
- The accounts of overseas branches and representative offices (Paris branch, Tangier Offshore)
Any transactions or balances between group entities are eliminated on consolidation.
2.2 General principles
The financial statements have been prepared in accordance with generally accepted accounting principles applicable to credit institutions.
The presentation of BMCE Bank’s financial statements complies with Accounting Standards for Credit Institutions.
2.3 Amounts due from credit institutions and customers and signature loans
General presentation of amounts due
• Amounts due from credit institutions and customers are classified on the basis of their initial maturity or economic purpose:
- Demand or term deposits in the case of credit institutions;
- Operating loans, equipment loans, consumer loans, property loans and other loans in the case of customers.
• Off-balance sheet signature loans relate to irrevocable funding commitments and guarantees.
• Repurchase agreements involving securities are recognised under the relevant receivables entry (credit institutions, customers).
• Values awaiting collection, which are only credited to the remitter on actual receipt or after a contractual period, are not recognised on the balance sheet but are accounted for materially.
• Accrued interest on these receivables is recognised under “Related receivables” through the income statement.
Non-performing customer loans
• Non-performing customer loans and advances are recognised and measured in accordance with applicable banking regulations.
• The main applicable provisions can be summarised as follows:
- Non-performing loans and advances are, depending on the level of risk, classified as “substandard”, “doubtful” or “irrecoverable”.
- After deducting the proportion of the guarantee required under current legislation, provisions are recognised as follows:
- 20% in the case of substandard loans;
- 50% in the case of doubtful loans;
- 100% in the case of irrecoverable loans.
Impairment provisions for credit risks on assets are deducted from the assets’ carrying amount.
• On downgrading healthy loans and advances as non-performing loans, interest thereon is no longer calculated and recognised. It is only recognised as income when received.
• Losses on irrecoverable loans are recognised when the possibility of recovering non-performing loans is deemed to be nil.
• Provision write-backs for non-performing loans are recognised when the latter undergo an improvement, are effectively repaid or restructured with partial or total loan repayment.
2.4 Amounts owing to credit institutions and customers
Amounts owing to credit institutions and customers are classified in the financial statements on the basis of their initial maturity or type:
- Demand or term deposits in the case of credit institutions;
- Demand accounts in credit, savings accounts, term deposits and other customer accounts in credit.
Included under these various headings, depending on the category of counterparty, are repurchase agreements involving securities or movable assets.
Interest accrued on these payables is recognised under “Related payables” through the income statement.
Note Presenting the Rules, Accounting Principles and Valuation Methods Adopted
Pare
nt F
inan
cial
Sta
tem
ents
PAGE
210
/211
BMCE
BANK
OF
AFRICA

2.5 Securities portfolio
2.5.1 General presentation
Securities transactions are recognised and measured in accordance with the provisions of the Credit Institutions Accounting Plan.
Securities are classified according to their legal type (debt security or equity security) as well as the purpose for which they were acquired (trading securities, available-for-sale securities, held-to-maturity securities and long-term investment securities).
2.5.2 Trading securities
Securities are considered to be Trading securities if they are:
- Bought or sold with the express intention of selling them or repurchasing them in the near future to make a profit;
- Held by the credit institution in the context of its role as market-maker, their classification as trading securities being conditional on them seeing significant trading volume as a function of market conditions;
- Acquired or sold in the context of specialised portfolio management activity comprising derivative instruments, securities or other instruments managed together with recent evidence that a short-term profit-taking approach has been adopted;
- The subject of a sales undertaking in the context of arbitrage activity.
Trading securities are recognised at cost less dealing charges plus accrued interest, where applicable. Dealing charges are recognised directly through the income statement. Securities that have been sold are valued on the basis of the same rules.
2.5.3 Available-for-sale securities
Fixed income or floating rate securities are considered to be Available-for-sale securities if they are acquired with a view to being held for an indefinite period and that the institution may decide to sell them at any time.
By default, this category includes securities that fail to satisfy the criteria for recognition under another category of securities.
Available-for-sale securities are recognised at cost plus charges and accrued interest.
Securities transferred from the “Portfolio securities” and “Equity securities and Investments in related companies” categories are valued either prior to or at the time of transfer based on the rules relating to their original category. They are reclassified under Available-for-sale securities on the basis of this carrying amount.
Securities transferred from the “Held-to-maturity securities” category are reclassified at their net carrying amount at the time of transfer.
2.5.4 Held-to-maturity securities
Held-to-maturity securities are debt securities which are acquired or which have been transferred from another category of securities for the purpose of being held until maturity in order to generate regular income over the long-term.
These securities are recognised ex-coupon at the time of acquisition.
At each balance sheet date, the securities are valued at cost, regardless of their market value. Accordingly, unrealised profit or loss is not recognised.
2.5.5 Long-term investment securities
This category comprises securities whose long-term ownership is deemed useful to the Bank. These securities are categorised according to the provisions established by Accounting Standards for Credit Institutions as follows:
- Equity securities;
- Investments in related companies;
- Portfolio securities
- Other similar assets.
At each balance sheet date, they are valued on the basis of generally-accepted criteria such as utility value, share of net assets, future earnings prospects and share price performance. Impairment provisions are booked for unrealised losses on a case by case basis.
2.5.6 Repurchase agreements
Securities delivered under repurchase agreements are recognised on the balance sheet. The amount received, which represents the liability to the transferee, is recognised on the balance sheet under liabilities.
Securities received under reverse repos are not recognised on the balance sheet, although the amount received, which represents the receivable due from the transferor, is recognised on the balance sheet under assets.
2.6. Foreign currency-denominated transactions
Receivables, amounts owing and signature loans denominated in foreign currencies are translated into dirhams at the average exchange rate prevailing at the balance sheet date.
Foreign currency differences on contributions from overseas branches and on foreign currency borrowings hedged against exchange rate risk are recorded on the balance sheet under other assets or other liabilities as appropriate. Any translation gains and losses arising from the translation of non-current securities acquired in a foreign currency are recorded as translation differences under the category of securities in question.
Foreign currency differences on other accounts held in foreign currencies are recognised through the income statement.
Income and expenses in foreign currency are translated at the exchange rate prevailing on the day they are recognised.
2.7. Translation of financial statements denominated in foreign currencies
The ‘closing rate’ method is used to translate financial statements denominated in foreign currencies.
Translation of balance sheet and off-balance sheet items
All assets, liabilities and off-balance sheet items of the foreign entity (Paris Branch) are translated based on the exchange rate prevailing at the closing date.
Shareholders’ equity (excluding net income for the financial year) is measured at different historical rates (additional charges) and constitutes reserves. The difference arising from this correction (closing rate less historical rate) is recorded under “Translation differences” under shareholders’ equity.
Translation of income statement items except for depreciation and amortisation expenses and provisions, which are translated at the closing rate, are translated at the average exchange rate for the financial year. However, income statement items have been translated at the closing rate since this method does not result in any material difference by comparison with the average exchange rate method.

Pare
nt F
inan
cial
Sta
tem
ents
2.8. General risk provisions
These provisions are booked, at the discretion of the management, to address future risks relating to banking operations which cannot be currently identified or accurately measured.
Provisions booked are added back for taxation purposes.
2.9. Intangible assets and property, plant and equipment
Intangible assets and property, plant and equipment are recognised on the balance sheet at cost less accumulated amortisation and depreciation, calculated using the straight line method over the estimated life of the assets in question.
Intangible assets are categorised under operating and non-operating non-current assets and are amortised over the following periods:
Category Amortisation period
Lease rights Non-amortisable
Patents and brands For the period under patent protection
Research & development assets 1 year
IT software 5 years
Other goodwill items Non amortisable
Plant, property and equipment are categorised under operating and non-operating non-current assets and are amortised over the following periods:
Category Amortisation period
Land Non amortisable
Operating premises:
Built before 1986 20 years
Built after 1986 40 years
Office furniture 10 years
IT hardware 5 years
Vehicles 5 years
Fixtures, fittings and equipment 10 years
Shares in non-profit companies Non amortisable
2.10 Deferred charges
Deferred charges comprise expenses which, given their size and nature, are likely to relate to more than one financial year.
2.11 Statutory provisions
Statutory provisions, particularly those relating to taxation, are booked in application of statutory or regulatory requirements. The decision as to whether or not to book such provisions is effectively a management decision motivated, in particular, by a desire to derive a tax benefit.
If the criteria for booking and utilising such provisions are met and they have been booked to be able to benefit from a definite tax break, statutory provisions, with the exception of accelerated amortisation reserves, are treated as tax-free reserves.
2.12 Recognition of interest income and fee income on the income statement
Interest income
Income and expenditure earned on capital actually lent or borrowed are considered as interest income.
Income and expenditure earned on an accruals basis, which remunerates risk, are considered as interest equivalent. This category includes fees on guarantee and financing commitments (guarantees, collateral etc.).
Interest accrued on capital actually lent or borrowed is recognised under related receivables and payables accounts through the income statement.
Interest equivalent is immediately recognised through the income statement upon invoicing.
Fee income
Income and expenditure, calculated on a flat-rate basis, which remunerate a service provided, are recognised as fees upon invoicing.
2.13 Non-recurring income and expenditure
This consists exclusively of income and expenditure arising on an exceptional basis. Such items are rare, in principle, as they are unusual by nature and occur infrequently.
2.14 Retirement obligations
Retirement obligations (Wissam AI Choghl, compensation payments for early retirement) not covered by pension schemes and managed by external independent providers (non-mandatory) are not provisioned.
PAGE
212
/213
BMCE
BANK
OF
AFRICA

ASSETS 2016 2015
Cash, central banks, treasury, giro accounts 4 147 681 2 699 639 Loans to credit institutions and equivalent 24 562 762 24 495 193
. Demand 2 623 461 3 100 756
. Time 21 939 301 21 394 437 Loans and advances to customers 115 990 730 113 328 625
. Cash and consumer loans 40 791 247 39 141 837
. Equipment loans 19 100 535 16 069 234
. Mortgage loans 37 725 042 36 374 131
. Other loans 18 373 906 21 743 423 Advances acquired by factoring 668 926 - Transaction and marketable securities 38 601 321 25 429 973
. Treasury bonds and equivalent securities 15 957 201 5 325 413
. Other debt securities 3 313 509 709 167
. Title deeds 19 330 611 19 395 393 Other assets 1 948 439 1 877 269 Investment securities 4 059 152 5 587 659
. Treasury bonds and equivalent securities 1 559 544 1 642 527
. Other debt securities 2 499 608 3 945 132 Equity investments and equivalent uses 8 864 040 8 735 714 Subordinated loans 193 101 195 461 Fixed assets leased and rented 74 000 - Intangible fixed assets 516 958 464 103 Tangible fixed assets 5 295 196 4 418 365 Total Assets 204 922 306 187 232 001
(In thousand MAD)
LIABILITIES 2016 2015
Central banks, treasury, giro accounts - - Liabilities to credit institutions and equivalent 25 767 091 31 244 236
. Demand 7 412 683 8 527 146
. Time 18 354 408 22 717 090 Customer deposits 131 124 421 121 205 803
. Demand deposits 71 264 402 63 460 442
. Savings deposits 21 371 211 20 159 145
. Time deposits 32 746 734 31 043 262
. Other deposits 5 742 074 6 542 954 Debt securities issued 12 076 677 9 454 620
. Negociable debt securities 9 512 638 7 427 788
. Bond loans 2 564 039 2 026 832
. Other debt securities issued - - Other liabilities 10 695 318 2 433 750 Contingent liabilities 549 139 483 194 Regulated provisions - - Subsidies, assigned public funds and special guarantee funds - - Subordinated debts 10 085 536 8 206 900 Revaluation reserve - - Reserves and premiums related to capital 11 504 457 11 104 784 Capital 1 794 634 1 794 634 Shareholders Unpaid-up Capital (-) - - Retained earnings (+/-) 62 44 Net earnings being appropriated (+/-) - - Net earnings for the year (+/-) 1 324 971 1 304 036 Total Liabilities 204 922 306 187 232 001
(In thousand MAD)
Aggregated ActivityAS OF DECEMBER 31, 2016
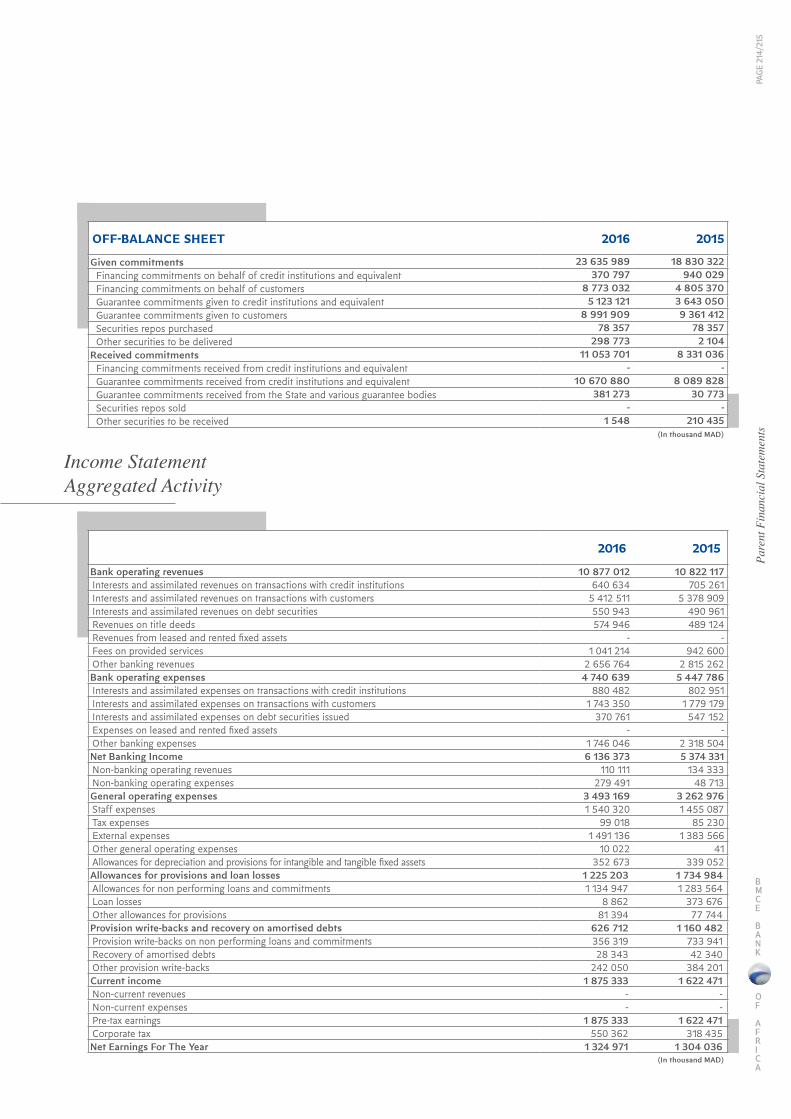
Pare
nt F
inan
cial
Sta
tem
ents
OFF-BALANCE SHEET 2016 2015
Given commitments 23 635 989 18 830 322 Financing commitments on behalf of credit institutions and equivalent 370 797 940 029 Financing commitments on behalf of customers 8 773 032 4 805 370 Guarantee commitments given to credit institutions and equivalent 5 123 121 3 643 050 Guarantee commitments given to customers 8 991 909 9 361 412 Securities repos purchased 78 357 78 357 Other securities to be delivered 298 773 2 104
Received commitments 11 053 701 8 331 036 Financing commitments received from credit institutions and equivalent - - Guarantee commitments received from credit institutions and equivalent 10 670 880 8 089 828 Guarantee commitments received from the State and various guarantee bodies 381 273 30 773 Securities repos sold - - Other securities to be received 1 548 210 435
(In thousand MAD)
2016 2015
Bank operating revenues 10 877 012 10 822 117 Interests and assimilated revenues on transactions with credit institutions 640 634 705 261 Interests and assimilated revenues on transactions with customers 5 412 511 5 378 909 Interests and assimilated revenues on debt securities 550 943 490 961 Revenues on title deeds 574 946 489 124 Revenues from leased and rented fixed assets - - Fees on provided services 1 041 214 942 600 Other banking revenues 2 656 764 2 815 262 Bank operating expenses 4 740 639 5 447 786 Interests and assimilated expenses on transactions with credit institutions 880 482 802 951 Interests and assimilated expenses on transactions with customers 1 743 350 1 779 179 Interests and assimilated expenses on debt securities issued 370 761 547 152 Expenses on leased and rented fixed assets - - Other banking expenses 1 746 046 2 318 504 Net Banking Income 6 136 373 5 374 331 Non-banking operating revenues 110 111 134 333 Non-banking operating expenses 279 491 48 713 General operating expenses 3 493 169 3 262 976 Staff expenses 1 540 320 1 455 087 Tax expenses 99 018 85 230 External expenses 1 491 136 1 383 566 Other general operating expenses 10 022 41 Allowances for depreciation and provisions for intangible and tangible fixed assets 352 673 339 052 Allowances for provisions and loan losses 1 225 203 1 734 984 Allowances for non performing loans and commitments 1 134 947 1 283 564 Loan losses 8 862 373 676 Other allowances for provisions 81 394 77 744 Provision write-backs and recovery on amortised debts 626 712 1 160 482 Provision write-backs on non performing loans and commitments 356 319 733 941 Recovery of amortised debts 28 343 42 340 Other provision write-backs 242 050 384 201 Current income 1 875 333 1 622 471 Non-current revenues - - Non-current expenses - - Pre-tax earnings 1 875 333 1 622 471 Corporate tax 550 362 318 435 Net Earnings For The Year 1 324 971 1 304 036
(In thousand MAD)
Income StatementAggregated Activity
PAGE
214
/215
BMCE
BANK
OF
AFRICA

EARNINGS FORMATION TABLE 2016 2015
+ Interests and assimilated revenues 6 604 087 6 575 131 - Interests and assimilated expenses 2 994 594 3 129 281 Net interest income 3 609 493 3 445 850 + Revenues from leased and rented fixed assets - - - Expenses on leased and rented fixed assets - - Profit from leasing and renting operations - - + Fees received 1 296 907 1 131 043 - Fees paid 301 734 213 808 Net fee income 995 173 917 235 ± Income from operations on transaction securities 933 900 358 569 ± Income from transactions on marketable securities 20 704 92 069 ± Income from exchange transactions 241 039 292 469 + Income from derivatives transactions 6 746 -27 076 Income from market transactions 1 202 389 716 031 + Other miscellaneous banking revenues 574 946 489 124 - Other miscellaneous banking expenses 245 633 193 910 Net banking income 6 136 373 5 374 330 ± Net income from equity investments 203 177 379 101 + Other non-banking operating revenues 110 043 134 333 - Other non-banking operating expenses 260 170 47 258 - General operating expenses 3 493 170 3 262 977 Gross operating income 2 696 248 2 577 529 ± Allowances for non performing loans and commitments (net of write-backs) -759 142 -880 960 + Other allowances net of provision write-backs -61 774 -74 098 Current income 1 875 332 1 622 471 Non-current income - - - Corporate tax 550 362 318 435 Net earnings for the year 1 324 971 1 304 036
(In thousand MAD)
CASH FLOW 2016 2015
+ Net earnings for the year 1 324 971 1 304 036 + Allowances for depreciation and provisions for intangible and tangible fixed assets 352 673 339 052 + Allowances for provisions for equity investments depreciation 6 800 - + Allowances for provisions for general risks 58 900 65 205 + Allowances for regulated provisions - - + Non-current allowances - - - Provisions write-backs 229 230 380 555 - Capital gains on disposals of intangible and tangible fixed assets 25 691 63 644 + Capital losses on disposals of intangible and tangible fixed assets - - - Capital gains on disposals of equity investments 67 - + Capital losses on disposals of equity investments 19 321 1 455 - Write-backs of investment subsidies received - - + Financing capacity 1 507 676 1 265 549 - Dividends distributed 897 317 789 639 + Cash-flow 610 359 475 910
(In thousand MAD)
Aggregated ManagementBalances Statement

Pare
nt F
inan
cial
Sta
tem
ents
STATEMENT OF CASH FLOW 2016 2015
1. (+) Operating income received from banking operations 9 786 279 9 884 270 2. (+) Recovery of amortised debts 28 343 42 340 3. (+) Non-banking revenues received 110 111 134 333 4. (+) Banking operating expenses paid 4 821 763 5 502 164 5. (+) Non-banking operating expenses paid 279 491 48 713 6. (+) General operating expenses paid 3 140 496 2 923 924 7. (+) Corporate tax paid 550 362 318 435 I - Net Cash Flows from the Income Statement 1 132 622 1 267 708 Change in :8. (+) Loans to credit institutions and equivalent -67 569 -5 305 274 9. (+) Loans to customers -2 662 105 -13 934 389 10. (+) Debt and marketable securities -11 642 841 1 987 571 11. (+) Other assets -71 170 -60 172 12. (+) Fixed assets leased and rented out - - 13. (+) Liabilities to credit institutions and equivalent -5 477 145 14 862 724 14. (+) Customer deposits 9 918 618 11 103 366 15. (+) Debt securities issued 2 622 057 -4 279 898 16. (+) Other liabilities 8 037 624 -1 531 270 II - Balance of Changes in Operating Assets and Liabilities 657 469 2 842 658 III - Net Cash Flows from Operating Activities ( I + II ) 1 790 091 4 110 366 17. (+) Revenues from equity investments 47 964 - 18. (+) Revenues from disposals of intangible and tangible fixed assets 43 039 95 103 19. (+) Acquisitions of equity investments 159 903 1 608 499 20. (+) Acquisitions of intangible and tangible fixed assets 1 638 835 2 565 211 21. (+) Interests received 579 088 514 412 22. (+) Dividends received 511 645 423 145 IV - Net Cash Flows from Investment Activities -617 002 -3 141 051 23. (+) Subsidies, public funds and guarantee funds received - 24. (+) Issues of subordinated debts - - 25. (+) Stock issues 1 878 636 1 903 833 26. (+) Repayment of shareholders equity and equivalent27. (+) Interests paid28. (+) Dividends paid 706 366 868 921 V - Net Cash Flows from Financing Activities 897 317 789 639 VI - Net Change In Cash ( III + IV + V ) 274 953 245 273 VII - Cash & Cash Equivalent at Beginning of Year 1 448 042 1 214 588 VIII - Cash & Cash Equivalent at Year-end 2 699 639 1 485 051 VIII. Cash at Year - end 4 147 681 2 699 639
(In thousand MAD) PA
GE 2
16/2
17
BMCE
BANK
OF
AFRICA

MAIN VALUATION METHODS APPLIED
VALUATION METHODS APPLIED BY BMCE BANKCf : Accounting Principles.
LOANS TO CREDIT INSTITUTIONS AND EQUIVALENT
Claims
Bank Al-Maghrib Treasury and giro accounts
Banksin Morocco
Other credit institutions and equiva-
lent in Morocco
Foreign credit insti-
tutionsTotal 2016 Total 2015
Ordinary accounts in debit 2 763 783 1 411 820 1 045 337 1 505 132 6 726 072 5 756 042 Securities received as pledges - - 2 844 215 - 2 844 215 2 554 737 - Overnight - - - - - - - Time - - 2 844 215 - 2 844 215 2 554 737 Short-term loans - - 5 565 352 - 5 565 352 5 474 311 - Overnight - - - - - - - Time - - 5 565 352 - 5 565 352 5 474 311 Financial loans - 995 794 9 368 418 20 165 10 384 377 10 224 031 Other loans 2 895 759 232 209 - 40 973 3 168 941 3 166 491 Receivables accrued interest 4 239 1 977 14 097 1 173 21 486 19 220 Non performing loans - - - - - - TOTAL 5 663 781 2 641 800 18 837 419 1 567 443 28 710 443 27 194 832 Comment : pl 480 MMAD : 2 895 759 included in « Other loans » (In thousand MAD)
LOANS TO CUSTOMERS
Claims Public sector
Private SectorTotal 2016 Total 2015Financial
companiesNon financial
companiesOther
customersShort-term loans 1 159 187 2 440 933 28 088 181 55 377 31 743 678 29 833 489 - Deposit accounts in debit 690 450 1 328 042 16 089 924 52 077 18 160 493 18 638 892 - Commercial loans in Morocco 25 283 - 4 154 880 3 300 4 183 463 3 366 936 - Export loans - - 765 296 - 765 296 545 927 - Other cash loans 443 454 1 112 891 7 078 081 - 8 634 426 7 281 734 Consumer loans - 9 742 758 9 742 758 9 328 888 Equipment loans 4 497 327 - 14 412 587 - 18 909 914 15 886 479 Mortgage loans 8 946 683 28 719 487 37 666 171 36 319 719 Other loans 885 376 11 324 900 2 943 397 - 15 153 673 18 885 215 Advances acquired by factoring 100 000 - 568 927 - 668 927 - Receivables accrued interest 37 999 77 591 320 175 218 539 654 304 716 626 Non performing loans 100 836 3 266 1 754 889 261 240 2 120 232 2 358 209 - Substandard loans - 72 199 168 464 240 662 266 751 - Doubtful loans 12 203 408 779 129 74 476 866 216 1 191 293 - Loss loans 88 633 2 858 903 561 18 301 1 013 353 900 165 TOTAL 6 780 725 13 846 691 57 034 839 38 997 401 116 659 656 113 328 625
(In thousand MAD)
BREAKDOWN OF TRANSACTION & MARKETABLE SECURITIES AND INVESTMENT SECURITIES BY CATE-GORY OF ISSUER
Credit Institutions
and Equivalent
Public Issuers
Private IssuersTotal 2016 Total 2015 Financial
companiesNon financial
companiesQuoted securities 2 461 728 17 419 266 19 382 486 786 875 40 050 355 28 399 578 - Treasury bonds and equivalent securities - 17 410 813 - - 17 410 813 6 938 416 - Bonds 793 753 8 453 51 875 786 875 1 640 956 2 065 769 - Other debt securities 1 667 976 - - - Title deeds - - 19 330 611 - 19 330 611 19 395 393 Unquoted securities 2 027 741 155 762 118 461 308 154 2 610 118 2 618 055 - Treasury bonds and equivalent securities - - - - - Bonds 2 000 036 - - - 2 000 036 2 025 839 - Other debt securities 433 49 000 - 301 502 350 935 389 914 - Title deeds - - - - - Accrued interest 27 272 106 762 118 461 6 652 259 147 202 302 TOTAL 4 489 469 17 575 028 19 500 947 1 095 029 42 660 473 31 017 632
(In thousand MAD)
Statement of Additional Information

Pare
nt F
inan
cial
Sta
tem
ents
BREAKDOWN OF TRANSACTION & MARKETABLE SECURITIES AND INVESTMENT SECURITIES
Gross book value
Current value
Redemption price
Unrealised capital gains
Unrealised capital losses
Provisions
Transaction securities 38 385 887 38 369 891 38 369 891 - - 15 996 Treasury bonds and equivalent securities 15 872 007 15 856 136 15 856 136 - - 15 871 Bonds 1 515 209 1 515 209 1 515 209 - - - Other debt securities 1 667 935 1 667 935 1 667 935 - - - Title deeds 19 330 736 19 330 611 19 330 611 - - 125 Marketable securities 231 430 231 430 231 430 - - - Treasury bonds and equivalent securities 101 064 101 064 101 064 - - - Bonds - - - - - - Other debt securities 130 366 130 366 130 366 - - - Title deeds - - - - - - Investment securities 4 065 563 4 059 152 3 988 341 - 70 811 6 411 Treasury bonds and equivalent securities 1 559 544 1 559 544 1 502 210 - 57 334 - Bonds 2 155 084 2 148 673 2 135 196 - 13 477 6 411 Other debt securities 350 935 350 935 350 935 - - - TOTAL 42 682 880 42 660 473 42 589 662 - 70 811 22 407
(In thousand MAD)
DETAIL OF OTHER ASSETS 2016 2015
Optional instruments 25 806 4 089 Miscellaneous transactions on securities 57 401 91 776 Other Debtors 638 436 560 921 - Sums due by the state 471 412 405 921 - Sums due by provident companies - - - Receivables from staff 78 918 81 578 - Receivable for non-banking services - - - Other debtors 88 106 73 422 Other securities and assets 7 425 4 822 Adjustment accounts 1 219 371 1 215 661 Off-balance sheet adjustment accounts 102 135 78 753 Currency discrepancy accounts - - Derivatives discrepancy accounts - - Securities discrepancy accounts - - Currency and securities Goodwill - - Income on hedging transactions - - Deferred expenses 235 046 182 255 Liaison accounts between the head office, subsidiaries and branches in Morocco 326 815 308 147 Accrued income and prepayment 185 124 210 163 Accrued income 4 227 1 468 Prepayment 180 897 208 695 Transitory accounts - - Other adjustment accounts 370 251 436 343 Non performing loans on miscellaneous transactions - - TOTAL 1 948 439 1 877 269
(In thousand MAD)
PAGE
218
/219
BMCE
BANK
OF
AFRICA

Nam
e of
the
issu
ing
com
pany
Sect
or o
f ac
tivi
tyN
umbe
r of
shar
esSh
are
capi
tal
Equi
tyho
ldin
g as
%
Ove
rall
acqu
isit
ion
pric
ePr
ovis
ions
Net
bo
ok v
alue
Equi
ty In
vest
men
t Sec
uriti
esRA
DIO
MED
ITER
RAN
EEM
edia
708
260
196
650
000
36,0
270
827
070
827
O T
OW
ERD
evel
opm
ent c
ompa
ny1
560
000
260
000
000
60,0
062
595
062
595
CASA
BLAN
CA F
INAN
CE C
ITY
AUTH
ORI
TYCa
sabl
anca
Fin
anci
al C
ente
r Man
agem
ent
500
000
400
000
000
12,5
050
000
050
000
TANG
ER M
ED Z
ON
ESD
evel
opm
ent c
ompa
ny44
3 39
650
6 65
0 00
08,
7544
340
044
340
EMAT
Hol
ding
Com
pany
80 4
718
047
300
100,
0030
365
30 3
650
FON
CIER
E EM
ERGE
NCE
Real
Est
ate
290
087
360
050
600
8,06
25 7
210
25 7
21EC
OPA
RC D
E BE
RREC
HID
Dev
elop
men
t com
pany
120
000
55 0
00 0
0021
,82
12 0
000
12 0
00CE
NTR
E M
ON
ETIQ
UE
INTE
RBAN
CAIR
EEl
ectro
nic
paym
ent m
anag
emen
t10
9 98
498
200
000
11,2
011
000
011
000
FON
DS
DE
GARA
NTI
E D
E LA
CO
MM
AND
E PU
BLIQ
UE
Fond
s d'
inve
stiss
emen
t10
0 00
010
0 00
0 00
010
,00
10 0
000
10 0
00M
ORO
CAN
INFO
RMAT
ION
TEC
HN
O P
ARC
CIE
Real
est
ate
man
agem
ent
56 5
0046
000
000
12,2
85
650
05
650
MAR
TKO
(MAG
HRE
B AR
AB T
RAD
ING
C°)
Fina
ncial
insti
tutio
n12
000
600
000
USD
20,0
097
197
10
AFRI
CA C
O-D
EVEL
OPM
ENT
GRO
UP
1000
0000
20 0
0110
000
000
20,0
050
00
500
MIT
C CA
PITA
LFu
nd M
NF
4 00
02
000
000
20,0
040
00
400
STE
RECO
URS
Deb
t col
lect
ion
3 75
02
500
000
15,0
037
537
50
511
Equi
ty A
ffilia
tes
324
743
31 7
1029
3 03
3Se
curit
ies
rela
ted
com
pani
esBO
A GR
OU
PFo
reig
n cr
edit
inst
itutio
n43
7 83
793
154
535
72,8
52
901
957
02
901 9
57BB
IFo
reig
n cr
edit
inst
itutio
n15
7 65
9 51
315
7 65
9 51
310
0,00
1 96
6 88
20
1 96
6 88
2ST
E SA
LAFI
NC
onsu
mm
er c
redi
t1
790
432
239
449
700
74,7
762
8 63
50
628
635
LITT
ORA
L IN
VEST
Real
Est
ate
26 0
002
600
000
100,
0045
0 00
00
450
000
MAG
HRE
BAIL
Leas
ing
726
220
138
418
200
52,4
737
0 77
00
370
770
LOCA
SOM
Long
Ter
m C
ar R
enta
l78
4 76
883
042
900
94,5
033
6 88
20
336
882
BAN
QU
E D
E D
EVEL
OPP
EMEN
T D
U M
ALI
Fore
ign
cred
it in
stitu
tion
121
723
10 0
00 4
29 6
00 F
CFA
32,3
813
4 37
90
134
379
HAN
OU
TYD
istrib
utio
n76
486
16 7
67 9
0045
,60
121
815
121
815
0BM
CE C
APIT
ALIn
vest
men
t Ban
k1
000
000
100
000
000
100,
0010
0 00
00
100
000
STE
CON
SEIL
INGE
NIE
RIE
ET D
EVEL
OPP
EMEN
TSt
udy
Offi
ce15
5 43
740
000
000
38,8
590
192
090
192
RIYA
D A
LNO
UR
Hot
el3
000
300
000
100,
0078
357
078
357
CONG
OLA
ISE
DES
BAN
QU
ESFo
reig
n cr
edit
inst
itutio
n37
0 00
010
000
000
000
FC
FA37
,00
74 8
440
74 8
44M
ARO
C FA
CTO
RING
Fact
orin
g45
0 00
045
000
000
100,
0051
817
051
817
GLO
BAL
NET
WO
RK S
YSTE
MS
HO
LDIN
GD
ata
proc
essi
ng11
6 00
011
600
000
100,
0046
591
046
591
EURO
SERV
ICES
Serv
ice
com
pany
3 76
84
831
000
78,0
040
144
040
144
BMCE
IMM
OBI
LIER
SCI
200
000
20 0
00 0
0010
0,00
29 7
000
29 7
00RM
EXP
ERT
Deb
t col
lect
ion
199
996
20 0
00 0
0010
0,00
20 0
000
20 0
00D
OCU
PRIN
T (S
TA)
Serv
ice
com
pany
50 0
005
000
000
100,
0019
000
019
000
ACM
ARSe
rvic
e co
mpa
ny10
0 00
050
000
000
20,0
010
001
010
001
SON
ORM
ARe
ak e
stat
e60
010
0 00
060
,00
8 28
00
8 28
0BM
CE C
APIT
AL B
OU
RSE
(MAR
OC
INTE
R TI
TRES
)St
ock
brok
erag
e67
500
10 0
00 0
0067
,50
6 75
00
6 75
0ST
E FI
NAN
CIER
E IT
ALIE
Fina
ncia
l ins
titut
ion
600
000
600
000
EUR
O10
0,00
6 39
26
392
0BM
CE C
APIT
AL G
ESTI
ON
(MAR
FIN
)M
utua
l fun
d m
anag
emen
t25
0 00
025
000
000
100,
006
443
06
443
EURA
FRIC
INFO
RMAT
IQU
ESe
rvic
e co
mpa
ny40
998
10 0
00 0
0041
,00
4 10
00
4 10
0BM
CE A
SSU
RAN
CES
Insu
ranc
e15
000
1 50
0 00
010
0,00
3 02
50
3 02
5AF
RICA
MO
ROCC
O L
INKS
Tran
spor
t Mar
itim
e5
100
1 00
0 00
051
,00
510
051
0IT
Inte
rnat
iona
l ser
vice
IT3
100
31 0
00 E
UR
O10
0,00
330
512
Equi
ty In
vest
men
ts7
507
798
128
208
7 379
591
Equi
ty in
vest
men
ts a
nd e
quiv
alen
tA
S O
F D
ECE
MB
ER
31ST
, 201
6
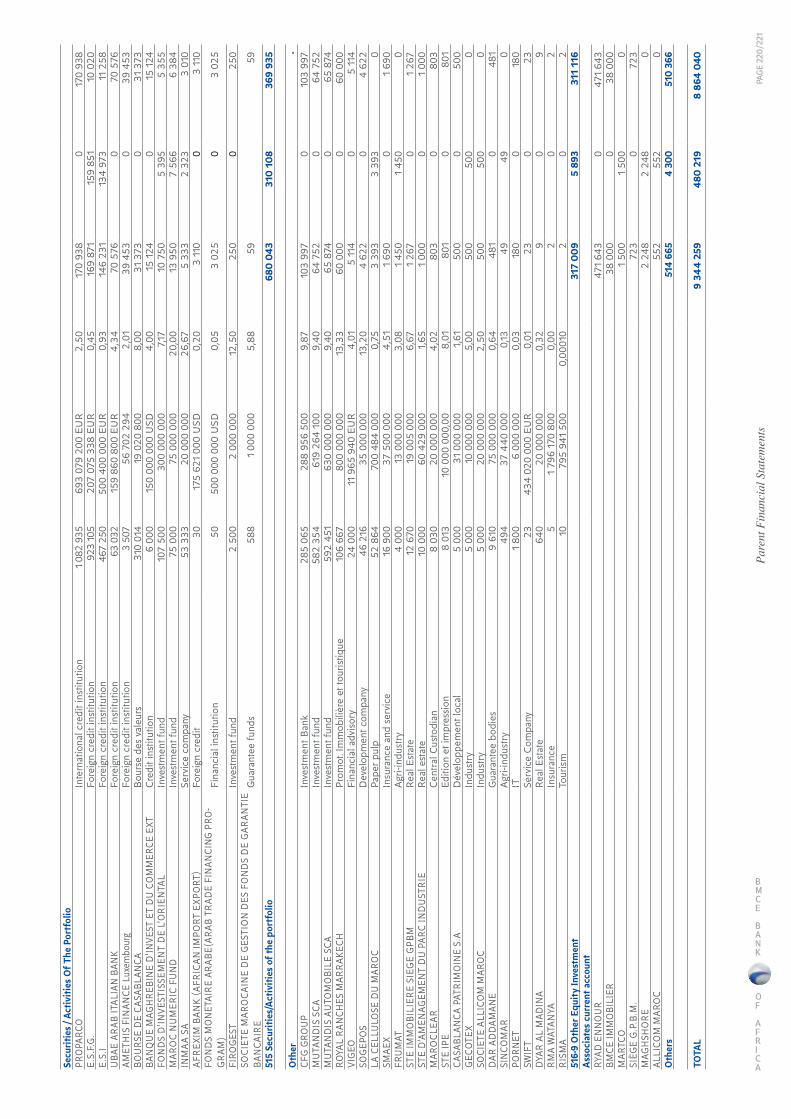
Pare
nt F
inan
cial
Sta
tem
ents
Secu
ritie
s / A
ctiv
ities
Of T
he P
ortf
olio
PRO
PARC
OIn
tern
atio
nal c
redi
t ins
titut
ion
1 082
935
693
079
200
EUR
2,50
170
938
017
0 93
8E.
S.F.
G.Fo
reig
n cr
edit
inst
itutio
n92
3 10
520
7 07
5 33
8 EU
R0,
4516
9 87
115
9 85
110
020
E.S.
IFo
reig
n cr
edit
inst
itutio
n46
7 25
050
0 40
0 00
0 EU
R0,
9314
6 23
113
4 97
311
258
UBA
E AR
AB IT
ALIA
N B
ANK
Fore
ign
cred
it in
stitu
tion
63 0
3215
9 86
0 80
0 EU
R4,
3470
576
070
576
AMET
HIS
FIN
ANCE
Lux
embo
urg
Fore
ign
cred
it in
stitu
tion
3 50
756
702
294
2,01
39 4
530
39 4
53BO
URS
E D
E CA
SABL
ANCA
Bou
rse
des
vale
urs
310
014
19 0
20 8
008,
0031
373
031
373
BAN
QU
E M
AGH
REBI
NE
D'IN
VEST
ET
DU
CO
MM
ERCE
EXT
Cre
dit i
nstit
utio
n6
000
150
000
000
USD
4,00
15 1
240
15 1
24FO
ND
S D'
INVE
STIS
SEM
ENT
DE
L'O
RIEN
TAL
Inve
stm
ent f
und
107
500
300
000
000
7,17
10 7
505
395
5 35
5M
ARO
C N
UM
ERIC
FU
ND
Inve
stm
ent f
und
75 0
0075
000
000
20,0
013
950
7 56
66
384
INM
AA S
ASe
rvic
e co
mpa
ny53
333
20 0
00 0
0026
,67
5 33
32
323
3 01
0AF
REXI
M B
ANK
(AFR
ICAN
IMPO
RT E
XPO
RT)
Fore
ign
cred
it30
175
621
000
USD
0,20
3 11
00
3 11
0FO
ND
S M
ON
ETAI
RE A
RABE
(ARA
B TR
ADE
FIN
ANCI
NG P
RO-
GRAM
)Fi
nanc
ial i
nstit
utio
n50
500
000
000
USD
0,05
3 02
50
3 02
5
FIRO
GEST
Inve
stm
ent f
und
2 50
02
000
000
12,5
025
00
250
SOCI
ETE
MAR
OCA
INE
DE
GEST
ION
DES
FO
ND
S D
E GA
RAN
TIE
BAN
CAIR
EG
uara
ntee
fund
s58
81
000
000
5,88
5959
515
Secu
ritie
s/Ac
tiviti
es o
f the
por
tfol
io68
0 04
331
0 10
836
9 93
5
Oth
er-
CFG
GRO
UP
Inve
stm
ent B
ank
285
065
288
956
500
9,87
103
997
010
3 99
7M
UTA
ND
IS S
CAIn
vest
men
t fun
d58
2 35
461
9 26
4 10
09,
4064
752
064
752
MU
TAN
DIS
AU
TOM
OBI
LE S
CAIn
vest
men
t fun
d59
2 45
163
0 00
0 00
09,
4065
874
065
874
ROYA
L RA
NCH
ES M
ARRA
KECH
Prom
ot. I
mm
obili
ère
et to
urist
ique
106
667
800
000
000
13,3
360
000
060
000
VIGE
OFi
nanc
ial a
dviso
ry
24 0
0011
965
940
EU
R4,
015
114
05
114
SOGE
POS
Dev
elop
men
t com
pany
46
216
35 0
00 0
0013
,20
4 62
20
4 62
2LA
CEL
LULO
SE D
U M
ARO
CPa
per p
ulp
52 8
6470
0 48
4 00
00,
753
393
3 39
30
SMAE
XIn
sura
nce
and
serv
ice
16 9
0037
500
000
4,51
1 69
00
1 69
0FR
UM
ATA
gri-i
ndus
try
4 00
013
000
000
3,08
1 45
01
450
0ST
E IM
MO
BILI
ERE
SIEG
E GP
BMRe
al E
stat
e12
670
19 0
05 0
006,
671
267
01
267
STE
D'AM
ENAG
EMEN
T D
U P
ARC
IND
UST
RIE
Real
est
ate
10 0
0060
429
000
1,65
1 00
00
1 00
0M
ARO
CLEA
RC
entra
l Cus
todi
an8
030
20 0
00 0
004,
0280
30
803
STE
IPE
Editi
on e
t im
pres
sion
8 01
310
000
000
,00
8,01
801
080
1CA
SABL
ANCA
PAT
RIM
OIN
E S.
AD
ével
oppe
men
t loc
al5
000
31 0
00 0
001,
6150
00
500
GECO
TEX
Indu
stry
5 00
010
000
000
5,00
500
500
0SO
CIET
E AL
LICO
M M
ARO
CIn
dust
ry5
000
20 0
00 0
002,
5050
050
00
DAR
ADDA
MAN
EG
uara
ntee
bod
ies
9 61
075
000
000
0,64
481
048
1SI
NCO
MAR
Agr
i-ind
ustr
y49
437
440
000
0,13
4949
0PO
RNET
IT1
800
6 00
0 00
00,
0318
00
180
SWIF
TSe
rvic
e C
ompa
ny23
434
020
000
EUR
0,01
230
23DY
AR A
L M
ADIN
ARe
al E
stat
e64
020
000
000
0,32
90
9RM
A W
ATAN
YA
Insu
ranc
e5
1 79
6 17
0 80
00,
002
02
RISM
ATo
uris
m10
795
941
500
0,00
010
20
251
6-9
Oth
er E
quity
Inve
stm
ent
317
009
5 89
331
1 11
6As
soci
ates
cur
rent
acc
ount
RYAD
EN
NO
UR
471
643
047
1 64
3BM
CE IM
MO
BILI
ER38
000
038
000
MAR
TCO
1 50
01
500
0SI
ÈGE
G.P.
B.M
.72
30
723
MAG
HSH
ORE
2 24
82
248
0AL
LICO
M M
ARO
C55
255
20
Oth
ers
514
665
4 30
051
0 36
6
TOTA
L9
344
259
480
219
8 86
4 04
0
PAGE
220
/221
BMCE
BANK
OF
AFRICA

TANGIBLE AND INTANGIBLE FIXED ASSETS
Fixed Assets
Gross amount
at the begin-ning
of the year
Gross reclassi-fication of the year
Acquisi-tionsof theyear
Dispos-als or with-
drawlsof theyear
Gross amount
at the end
of the year
Depreciation and/or Provisions
Netamount
at the end of the year
Depreci-ation
and/orprovi-sions at the begin-ning
of the year
Reclassi-fication of the year
Allow-ances
for theyear
Depreci-ation
on fixedassetswith-drawn
Toral
Intangible fixed assets 1 111 384 -36 207 335 26 577 1 292 106 647 280 - 127 867 - 775 147 516 959 Leasehold rights 94 906 - 1 000 - 95 906 - - - - - 95 906 Investment in research and development - - - - - - - - - - - Other operating intangible fixed assets 1 016 478 -36 206 335 26 577 1 196 200 647 280 - 127 867 - 775 147 421 053 Non-operating intangible fixed assets - - - - - - - - - - - Tangible fixed assets 7 684 428 36 1 431 499 334 638 8 781 325 3 266 062 - 224 688 4 620 3 486 130 5 295 195 Operating buildings 1 112 071 28 388 410 217 262 954 1 287 722 330 341 - 22 823 595 352 569 935 153 Operating land 185 559 - 700 860 185 399 - - - - - 185 399 Operating buildings offices 926 512 28 388 409 517 262 094 1 102 323 330 341 - 22 823 595 352 569 749 754 Operating buildings. Staff housing - - - - - - - - - - -
Operating furniture and equipment 1 668 176 -1 366 162 136 55 864 1 773 082 1 442 663 - 58 168 1 848 1 498 983 274 099
Operating office furniture 451 634 - 83 440 55 842 479 232 322 340 - 18 836 1 826 339 350 139 882 Operating office equip-ment 177 241 - 15 759 - 193 000 161 100 - 7 613 - 168 713 24 287
Computer equipment 917 365 -1 366 27 980 - 943 979 870 049 - 23 415 - 893 464 50 515 Operating vehicles 21 897 - 32 397 - 54 294 12 087 - 5 139 - 17 226 37 068 Other operating equip-ment 100 039 - 2 560 22 102 577 77 087 - 3 164 22 80 229 22 348
Other operating tangible fixed assets 1 904 584 -26 986 105 505 - 1 983 103 1 289 398 - 113 709 - 1 403 107 579 996
Non operating tangible fixed assets 2 999 597 - 753 641 15 820 3 737 418 203 660 - 29 988 2 177 231 471 3 505 947
Non-operating land 2 544 343 - 460 600 6 395 2 998 548 - - - - - 2 998 548 Non-operating buildings 340 057 - 283 405 9 425 614 037 112 922 - 24 355 2 177 135 100 478 937 Non-operating furniture and equipment 50 496 - 6 372 - 56 868 40 345 - 2 580 - 42 925 13 943 Other non-operating tangible fixed assets 64 701 - 3 264 - 67 965 50 393 - 3 053 - 53 446 14 519 TOTAL 8 795 812 - 1 638 834 361 215 10 073 431 3 913 342 - 352 555 4 620 4 261 277 5 812 154
(In thousand MAD)
SUBORDINATED DEBTSAmount Included linked and
related Companies31/12/2016 31/12/2015 31/12/2016 31/12/2015
Gross Provisions Net Net Net NetSubordinated loans to credit institutions and similar 188 576 188 576 190 859 190 859 Subordinated loans to customersTOTAL 188 576 188 576 190 859 190 859
(In thousand MAD)

Pare
nt F
inan
cial
Sta
tem
ents
DISPOSAL OF TANGIBLE AND INTANGIBLE FIXED ASSETS
Sale or withdrawal date
NatureGross book value
Accumu-lated
deprecia-tion and/or provi-
sions
Netbookvalue
Revenues from dis-
posals
Capital gain on dispos-
als
Capital loss on
disposal
11/04/16 VILLA 405 RTE EL JADIDA QUARTIER OASIS 4 300 595 3 705 7 200 3 495 04/05/16 IMMEUBLE TIZNIT RACHAT MAGHREBAIL 857 - 857 2 200 1 343 10/05/16 IMMEUBLE MOUHCINE CASABLANCA 5 152 1 137 4 015 6 800 2 785 16/12/16 PARC-CYCLES 22 22 - 2 2
31/12/16 IMMEUBLE ZONE INDUSTRIELLE 12A SUEDE MAROC MARZIPAN 5 773 1 041 4 732 10 500 5 768
31/12/16 MATERIEL ET MOBILIER DE BUREAU REFORMES 1 826 1 826 183 183 31/12/16 TERRAIN TARGA 11 MARRAKECH 1 316 1 316 5 266 3 950 31/12/16 TERRAIN TARGA 9 MARRAKECH 1 363 1 363 5 452 4 089 31/12/16 TERRAIN TARGA 13 MARRAKECH 1 359 1 359 5 436 4 077
21 968 4 621 17 348 43 039 25 691 - (In thousand MAD)
DEBTS TO CREDIT INSTITUTIONS AND EQUIVALENT
Debts
Credit institutions and equivalent in Morocco
Creditinstitutions
abroad Total 2016 Total 2015
Bank Al-Maghrib,
Treasury and giro current
account
Banksin Morocco
Other credit institutions and
equivalent in Morocco
Ordinary credit accounts - 2 596 33 951 514 544 551 091 283 444 Securities pledged 6 899 893 7 174 974 499 968 - 14 574 835 14 407 687 - Overnight 4 000 847 1 207 379 499 968 - 5 708 194 5 366 250 - Time 2 899 046 5 967 595 - - 8 866 641 9 041 437 Cash Borrowings 2 700 000 1 457 837 3 495 509 2 326 042 9 979 388 14 919 447 - Overnight - 1 100 000 53 270 - 1 153 270 3 584 126 - Time 2 700 000 357 837 3 442 239 2 326 042 8 826 118 11 335 321 Financial borrowings 79 281 - 436 363 284 515 928 1 513 342 Other debts 9 248 399 96 691 - 106 338 45 022 Payable accrued interests 14 879 13 262 7 007 4 363 39 511 75 294 TOTAL 9 703 301 8 649 068 4 569 489 2 845 233 25 767 091 31 244 236
(In thousand MAD)
CUSTOMER DEPOSITS
Deposits Public sector
Private SectorTotal 2016 Total 2015Financial
companies
Nonfinancial
companies
Othercompanies
Demand acredit accounts 1 873 737 1 124 750 15 199 108 49 674 054 67 871 649 61 704 447 Saving accounts - - - 22 062 817 22 062 817 20 735 340 Time Deposits 4 243 957 5 910 192 3 484 707 17 017 639 30 656 495 29 137 736 Other credit accounts (*) 2 948 195 4 304 849 2 437 585 266 775 9 957 404 9 024 699 Payable accrued interests 40 004 50 038 93 200 392 814 576 056 603 581 TOTAL 9 105 893 11 389 829 21 214 600 89 414 099 131 124 421 121 205 803 Comment : ( * ) Including PL 480 for MAD 2 895 759 (In thousand MAD)
PAGE
222
/223
BMCE
BANK
OF
AFRICA

DEBT SECURITIES ISSUED
Type of securities Starting Date Maturity Date CharacteristicsNominal unit value Rate
CD BMCE 18/04/14 18/04/17 4.25% 420 000 CD BMCE 09/04/14 09/04/18 3.00% 65 000 CD BMCE 07/04/14 07/04/17 4.25% 443 000 CD BMCE 30/04/14 30/04/17 4.20% 310 000 CD BMCE 30/04/14 30/04/18 4.40% 170 000 CD BMCE 30/04/14 30/04/19 4.55% 365 000 CD BMCE 08/05/14 08/05/17 4.15% 70 000 CD BMCE 08/05/14 08/05/19 4.50% 12 000 CD BMCE 15/05/14 15/05/17 4.20% 210 000 CD BMCE 19/01/15 19/01/17 2.95% 105 000 CD BMCE 04/02/15 04/02/18 3.10% 430 000 CD BMCE 11/04/16 11/04/18 2.45% 690 000 CD BMCE 11/04/16 10/04/17 2.40% 441 000 CD BMCE 18/04/16 17/04/17 2.40% 350 000 CD BMCE 18/04/16 18/04/18 2.45% 220 000 CD BMCE 14/07/16 12/01/17 2.30% 120 000 CD BMCE 14/07/16 13/07/17 2.50% 1 138 000 CD BMCE 15/07/16 16/07/18 2.63% 350 000 CD BMCE 15/07/16 13/01/17 2.30% 170 000 CD BMCE 24/11/16 23//11/2017 2.53% 1 103 000 CD BMCE 24/11/16 25/05/17 2.35% 117 000 CD BMCE 24/11/16 23/02/17 2.25% 206 000 CD BMCE 28/11/16 28/11/18 2.70% 120 000 CD BMCE 15/12/16 15/06/17 2.45% 235 000 CD BMCE 20/12/16 20/12/19 3.00% 350 000 CD BMCE 26/12/16 09/01/17 2.25% 110 000 CD BMCE 26/12/16 06/01/17 2.25% 230 000 CD BMCE 26/12/16 25/12/17 2.70% 550 000 CD BMCE 28/12/16 09/01/17 2.25% 130 000 CD BMCE 29/12/16 29/12/17 2.25% 130 000
9 360 000
DETAIL OF OTHER LIABILITIESLIABILITIES 2016 2015 Optional Instruments Sold 6 445 9 253 Miscellaneous Transactions on Securities 7 535 825 414 092 Other Creditors 1 364 281 1 193 397 State debt 789 529 598 259 Social security and provident societies debts 52 852 49 996 Staff debt 189 594 181 879 Shareholders and partners debt 3 610 3 599 Supply of goods and services 18 044 38 861 Other creditors 310 652 320 803 Accrual Accounts 1 788 767 817 007 Adjustment accounts of off-balance sheet transactions 171 191 24 725 Currencies and securities differential accounts - - Profit on hedging instruments - - Liaison accounts between the head office, branches and Moroccan branches 162 939 73 406 Expenses payable and prepaid income 234 471 211 733 Other accruals 1 220 166 507 143 TOTAL 10 695 318 2 433 750
(In thousand MAD)

Pare
nt F
inan
cial
Sta
tem
ents
PROVISIONS Amount2015 Allowances Write backs Other
changesEncours
2016Provisions, deducted from assets, on : 5 566 151 1 157 740 629 799 27 6 094 119 Loans to credit institutions and equivalent 58 616 5 - - 58 621 Loans and advances to customers 4 744 298 1 134 942 356 320 220 5 523 140 Doubtful interest 9 733 - - - 9 733 Marketable securities 43 556 15 993 44 249 695 15 995 Equity investments and equivalent assets 703 001 6 800 228 561 -1 021 480 219 Leased and rented fixed assets - - - - - Other assets 6 947 - 669 133 6 411 Provisions Recorded under liabilities 483 193 74 594 12 819 4 172 549 140 Provisions for risks of fulfilment of commitments 182 8 643 10 - 8 815 Contingent liabilities - - - - - Provisions for general risks 455 805 58 900 - - 514 705 Provisions for retirement pensions and similar obligations - - - - - Other contingent liabilities (E.C) 27 206 7 051 12 809 4 172 25 620 Regulated provisions - - - - - TOTAL 6 049 344 1 232 334 642 618 4 199 6 643 259
(In thousand MAD)
SUBORDINATED DEBTS AS OF DECEMBER 31ST 2016
Currency Debt amountclosing ex-
changerate (1)
Interest rate Term(2)
Conditions for anticipated
reimbursement, subordinated
and convertibility
Debt amount in thousands MAD
MAD 1 000 000 1 2.51% 10 years 1 000 000 MAD 150 000 1 5.95% Perpetual 150 000 MAD 850 000 1 3.63% Perpetual 850 000 MAD 950 000 1 2.90% Perpetual 950 000 MAD 50 000 1 5.30% Perpetual 50 000 MAD 160 000 1 6.18% 10 years 160 000 MAD 50 000 1 6.18% 10 years 50 000 MAD 790 000 1 3.85% 10 years 790 000 MAD 154 500 1 5.64% 10 years 154 500 MAD 845 500 1 3.45% 10 years 845 500 MAD 626 000 1 4.74% 10 years 626 000 MAD 1 374 000 1 3.98% 10 years 1 374 000 MAD 526 100 1 3.74% 10 years 526 100 MAD 1 473 900 1 2.77% 10 years 1 473 900 EUR 70 000 10.654 5.86% 10 years 745 780 EUR 15 000 10.654 5.90% 10 years 159 810
PAGE
224
/225
BMCE
BANK
OF
AFRICA
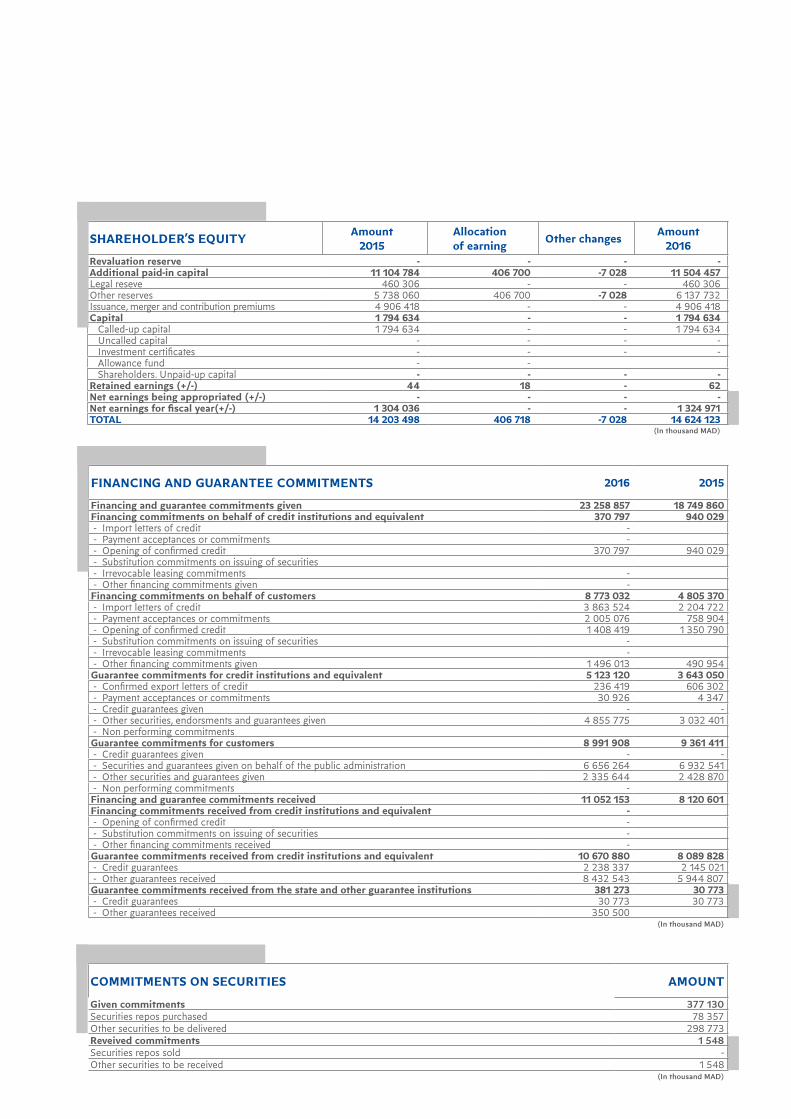
SHAREHOLDER’S EQUITY Amount2015
Allocationof earning Other changes Amount
2016Revaluation reserve - - - - Additional paid-in capital 11 104 784 406 700 -7 028 11 504 457 Legal reseve 460 306 - - 460 306 Other reserves 5 738 060 406 700 -7 028 6 137 732 Issuance, merger and contribution premiums 4 906 418 - - 4 906 418 Capital 1 794 634 - - 1 794 634 Called-up capital 1 794 634 - - 1 794 634 Uncalled capital - - - - Investment certificates - - - - Allowance fund - - Shareholders. Unpaid-up capital - - - - Retained earnings (+/-) 44 18 - 62 Net earnings being appropriated (+/-) - - - - Net earnings for fiscal year(+/-) 1 304 036 - - 1 324 971 TOTAL 14 203 498 406 718 -7 028 14 624 123
(In thousand MAD)
FINANCING AND GUARANTEE COMMITMENTS 2016 2015
Financing and guarantee commitments given 23 258 857 18 749 860 Financing commitments on behalf of credit institutions and equivalent 370 797 940 029 - Import letters of credit - - Payment acceptances or commitments - - Opening of confirmed credit 370 797 940 029 - Substitution commitments on issuing of securities - Irrevocable leasing commitments - - Other financing commitments given - Financing commitments on behalf of customers 8 773 032 4 805 370 - Import letters of credit 3 863 524 2 204 722 - Payment acceptances or commitments 2 005 076 758 904 - Opening of confirmed credit 1 408 419 1 350 790 - Substitution commitments on issuing of securities - - Irrevocable leasing commitments - - Other financing commitments given 1 496 013 490 954 Guarantee commitments for credit institutions and equivalent 5 123 120 3 643 050 - Confirmed export letters of credit 236 419 606 302 - Payment acceptances or commitments 30 926 4 347 - Credit guarantees given - - - Other securities, endorsments and guarantees given 4 855 775 3 032 401 - Non performing commitmentsGuarantee commitments for customers 8 991 908 9 361 411 - Credit guarantees given - - - Securities and guarantees given on behalf of the public administration 6 656 264 6 932 541 - Other securities and guarantees given 2 335 644 2 428 870 - Non performing commitments - Financing and guarantee commitments received 11 052 153 8 120 601 Financing commitments received from credit institutions and equivalent - - Opening of confirmed credit - - Substitution commitments on issuing of securities - - Other financing commitments received - Guarantee commitments received from credit institutions and equivalent 10 670 880 8 089 828 - Credit guarantees 2 238 337 2 145 021 - Other guarantees received 8 432 543 5 944 807 Guarantee commitments received from the state and other guarantee institutions 381 273 30 773 - Credit guarantees 30 773 30 773 - Other guarantees received 350 500
(In thousand MAD)
COMMITMENTS ON SECURITIES AMOUNT
Given commitments 377 130 Securities repos purchased 78 357 Other securities to be delivered 298 773 Reveived commitments 1 548 Securities repos sold - Other securities to be received 1 548
(In thousand MAD)

Pare
nt F
inan
cial
Sta
tem
ents
FORWARD EXCHANGE TRANSACTIONS AND COMMITMENTS ON DERIVATIVES
Holding transaction Other transaction of BMCE Paris and Offshore bank
2016 2015 2016 2015Forward exchange transactions 29 613 493 23 271 896 14 118 430 17 383 899 Currency to be received 12 981 829 10 657 909 3 810 970 4 406 126 Currency to be delivered 1 230 698 1 771 813 2 643 575 3 221 145 Dirhams to be received 13 549 691 9 841 559 4 406 225 5 448 309 Dirhams to be delivered 1 851 275 1 000 615 3 257 660 4 308 319 Of which financial currency swaps - - - - Commitments on derivatives 5 072 202 6 627 031 300 879 269 265 Commitments on regulated interest rate markets - - - - Commitments on OTC interest rate markets 3 735 623 3 137 597 277 003 242 731 Commitments on regulated exchange rate markets - - - - Commitments on OTC exchange rate markets 1 251 017 2 594 819 - - Commitments on regulated markets for other instruments - - - - Commitments on OTC markets for other instruments 85 562 894 615 23 876 26 534
(In thousand MAD)
SECURITIES RECEIVED AND GIVEN AS COLLATERAL
Securities received as collateral Net book valueLoans or given committments
posted to assets or to off balance sheet
Amount of loans and given
commitments Treasury bills and equivalent 8 141 919 Other securities 2 006 289 Mortgages 68 850 326 Other securities received as collateral 175 697 198 TOTAL 254 695 732
Securities given as collateral Net book valueLoans or given committments
posted to assets or to off balance sheet
Amount of loans and given
commitments Treasury bills and equivalent 10 781 179 T. Bills repoOther securities 5 164 771 Mortgages - Other securities delivered on repoOther securities received as collateral - TOTAL 15 945 950
(In thousand MAD)
BREAKDOWN OF USES AND RESOURCES ACCORDING TO RESIDUAL MATURITIESD< 1 month 1 month<D<
3 months3 months<D<
1 year1 year <D< 5
years D> 5 years Total
AssetsLoans to credit institutions and equivalent 9 407 234 1 649 442 2 018 331 7 864 458 999 836 21 939 301 Loans and advances to customers 12 406 255 6 525 575 10 515 932 39 925 275 28 568 708 97 941 745 Debt securities 30 244 305 443 052 1 586 766 7 576 453 2 809 897 42 660 473 Subordinated loans - - - - - - Leasing and equivalent - - - - - - TOTAL 52 057 794 8 618 069 14 121 029 55 366 186 32 378 441 162 541 519 LiabilitiesLiabilities to credit institutions and equivalent 7 968 644 5 969 309 3 147 821 1 188 835 79 799 18 354 408 Debts to customers 5 650 907 6 956 404 14 626 476 5 510 109 2 838 32 746 734 Debt securities issued 865 000 206 000 5 517 000 2 772 000 - 9 360 000 Subordinated borrowings - - - 1 905 590 6 000 000 7 905 590 TOTAL 14 484 551 13 131 713 23 291 297 11 376 534 6 082 637 68 366 732
(In thousand MAD)
CONCENTRATION RISK ON THE SAME BENEFICIARY
Number Total amount of risks
Amount of risk by passing 5% of capital
Operating loans Contracting loans
Amount of securities held in th capital of the beneficiary
21 55 844 980 39 528 159 7 204 343 492 665 (In thousand MAD)
PAGE
226
/227
BMCE
BANK
OF
AFRICA

BREAKDOWN OF TOTAL ASSETS, LIABILITIES AND OFF-BALANCE SHEET IN FOREIGN CURRENCY 2016
Assets 37 466 593 Cash, central banks, treasury, giro accounts 89 255 Loans to credit institutions and equivalent 21 876 951 Loans and advances to customers 7 367 376 Transaction, marketable and investment securities 2 572 122 Other assets 147 012 Equity investments and equivalent uses 5 223 178 Subordinated loans 188 576 Fixed assets leased and rented - Intangible and tangible fixed assets 2 123 Liabilities 33 995 416 Central banks, treasury, giro accounts - Liabilities to credit institutions and equivalent 25 503 707 Customer deposits 5 027 823 Debt securities issued 2 064 039 Other liabilities 494 257 Subordinated debts - Subsidies, assigned public funds and special guarantee funds 905 590 Off-Balance Sheet 9 894 341 Given commitment 8 428 061 Received commitment 1 466 280
(In thousand MAD)
NET INTEREST INCOME 2016 2015
Interest received 6 604 088 6 575 131 Interest and similar income on transactions with credit institutions 640 634 705 261 Interest and similar income on transactions with customers 5 412 511 5 378 909 Interest and similar income on debt securities 550 943 490 961 Interest paid 2 994 593 3 129 281 Interest and similar fees on transactions with credit institutions 880 482 802 951 Interest and similar fees on transactions with customers 1 743 350 1 779 179 Interest and similar fees on debt securities 370 761 547 152
(In thousand MAD)
REVENUES FROM INVESTMENT SECURITIES 2016 2015
Equity Securities 17 106 22 108 Equity in affiliates 511 645 423 435 Equity in portfolio - - Other securities 46 196 43 582 TOTAL 574 947 489 126
(In thousand MAD)
NON-PERFORMING LOANS TO SOCIAL CUSTOMERS Credit lines Sigmed Com-
mitments Total Provisions for credit lines
Pre-doubtful loans 268 374 268 374 27 711 Non performing loans 1 628 870 1 628 870 762 654 Doubtful debts 5 814 482 5 814 482 4 801 129 TOTAL 7 711 725 - 7 711 725 5 591 494
(In thousand MAD)

Pare
nt F
inan
cial
Sta
tem
ents
COMMISSIONS 2016 2015
Fees received 1 296 907 1 131 043 On transactions with credit institutions - On transactions with customers 517 972 444 409 Concerning operations on the primary securities markets 255 693 188 443 On derivatives 35 300 34 687 On transactions on securities under management and custody - - On means of payment 26 940 27 269 On consulting and assistance 318 759 308 911 On sales of insurance products - - On other services 48 413 50 306 Fees paid 93 830 77 018 On transactions with credit institutions 301 735 213 808 On transactions with customersConcerning operations on the primary securities markets - - On derivatives 187 926 129 718 On transactions on securities under management and custody - - On means of payment 1 143 4 591 On consulting and assistance 23 197 1 778 On sales of insurance products 55 191 49 012 On other services - - On sales of insurance products - - On other services 34 278 28 707
(In thousand MAD)
INCOME FROM MARKET TRANSACTIONS 2016 2015
Revenues 2 401 073 2 626 818 Gains on transactions securities 984 856 469 773 Capital gains on disposals of marketable securities 94 472 356 831 Provision write-backs on depreciation of marketable securities 44 249 - Gains on derivatives 482 826 952 418 Gains on exchange transactions 794 670 847 796 Expenses 1 198 684 1 910 787 Losses on transaction securities 50 955 111 204 Capital losses on disposals of marketable securities 102 021 221 205 Provisions for depreciation of marketale securities 15 996 43 557 Losses on derivatives 476 081 979 494 Losses on exchange transactions 553 631 555 327 Earning 1 202 389 716 031
(In thousand MAD)
GENERAL OPERATING EXPENSES 2016 2015
Staff expenses 1 540 320 1 455 087 Taxes 99 018 85 230 External expenses 1 501 158 1 383 607 Allowances for depreciation and provision for intangible and tangible fixed assets 352 673 339 052
(In thousand MAD)
PAGE
228
/229
BMCE
BANK
OF
AFRICA

FROM NET BOOK EARNINGS TO NET FISCAL EARNINGS Amount
I- Net Book earningNet gain 1 324 971 Net lossII- Tax Reintegration 841 982 1- Current 291 620
Diverses charges non dédudctibles 232 720 Provision for general risks 58 900 2- Non courantes 550 362 Impôts sur les sociétés 550 362
III- Tax deductions 511 645 1- Current 511 645 Dividends 511 645
2- Non-current - VI- Net earnings 1 655 309
Corporate tax 550 362 VI- Net Income
Provisions Write-backs for investments
DETERMINATION OF CURRENT EARNINGS AFTER-TAX Amount
I. Earnings determination . Current earnings according to the income statement 1 875 333 . Tax reintegrations on current transactions 291 620 . Tax deductions on current transactions 511 645 . Current earnings theoretically taxable 1 655 309 . Theoretical tax on current earnings 612 464 . Current earnings after tax 1 262 869 II. Indications of the tax system and the incentives Granted by the investment codes or by specific provisions
(In thousand MAD)
OTHER REVENUES AND EXPENSES 2016 2015
Revenues and expensesOther banking revenues and expenses 910 718 496 758 Other banking revenues 2 656 764 2 815 262 Other banking expenses 1 746 046 2 318 504 Non-banking operating revenues and expenses -169 380 85 620 Non-banking operating revenues 110 111 134 333 Non-banking operating expenses 279 491 48 713 Other expensesAllowances for provisions and loan losses 1 225 203 1 734 984 Other revenuesProvision write-backs and recoveries on amortised debts 626 712 1 160 482
(In thousand MAD)

Pare
nt F
inan
cial
Sta
tem
ents
DETAIL ON VALUE ADDED TAX
CategoryBalance at the be-
ginning of the fiscal year 1
Accounting opera-tions of the fiscal
year 2
VAT claims for the fiscal year 3
VAT claims for the fiscal year 3
A. VAT Collected 93 014 688 739 683 058 98 694 B. VAT to be Recovered 99 356 483 825 513 335 69 846 * On expenses 88 648 381 440 411 185 58 903 * On fixed assets 10 707 102 385 102 150 10 943 C. T.V.A = (A - B ) -6 342 204 913 169 724 28 848
(In thousand MAD)
DISTRIBUTION OF THE SHARE CAPITAL AS OF DECEMBER 31ST, 2016Amount of the capital : 1 794 633 900 Amount of the uncalled committed capital : - Nominal value : 10,00
Name of the main shareholders Address
Number of shares (%) of capital
held
(%) of voting rights2015 2016
A- Morrocan shareholdersRMA* 67 Avenue des FAR - Casablanca 53 559 056 53 541 983 29,83% 29,83%SFCM 239, Bd Mohamed V 907 205 907 205 0,51% 0,51%FINANCECOM 69 Avenue des FAR - Casablanca 10 705 351 10 705 351 5,97% 5,97%CIMR 100, Bd Abdelmoumen - Casablanca 7 348 804 7 348 804 4,09% 4,09%CDG ** 17 138 328 17 138 328 9,55% 9,55%MAMDA/ MCMA 16 Rue Abou Inane -Rabat 9 220 533 8 112 366 4,52% 4,52%Personnel BMCE 2 355 167 2 330 943 1,30% 1,30%Free Float 26 565 784 32 349 356 18,03% 18,03%TOTAL (1) 127 800 228 132 434 336 73,79% 73,79%B- Foreign shareholdersBES VIDA COMPAHNIA DE SEGUROS SA 4 634 108 - Banque Fédérative du Crédit Mutuel 47 029 054 47 029 054 26,21% 26,21%TOTAL 179 463 390 179 463 390 100% 100%* Y compris OPCVM DE RMA WATANYA** Suivant confirmation CDG datée du 12/05/2014
ALLOCATION OF EARNINGS THAT OCCURED DURING THE FISCAL YEARA- Origin of the earnings allocated Amount B- Results allocation AmountDecision of 27 May 2015Retained earnings 43 legal reserves - Net earnings being allocated - Dividends 897 317 Net earnings for the fiscal year 1 304 036 Other allocations 406 762 Withdrawals from earningsOther withdrawals - TOTAL A 1 304 079 TOTAL B 1 304 079
(In thousand MAD)
PAGE
230
/231
BMCE
BANK
OF
AFRICA
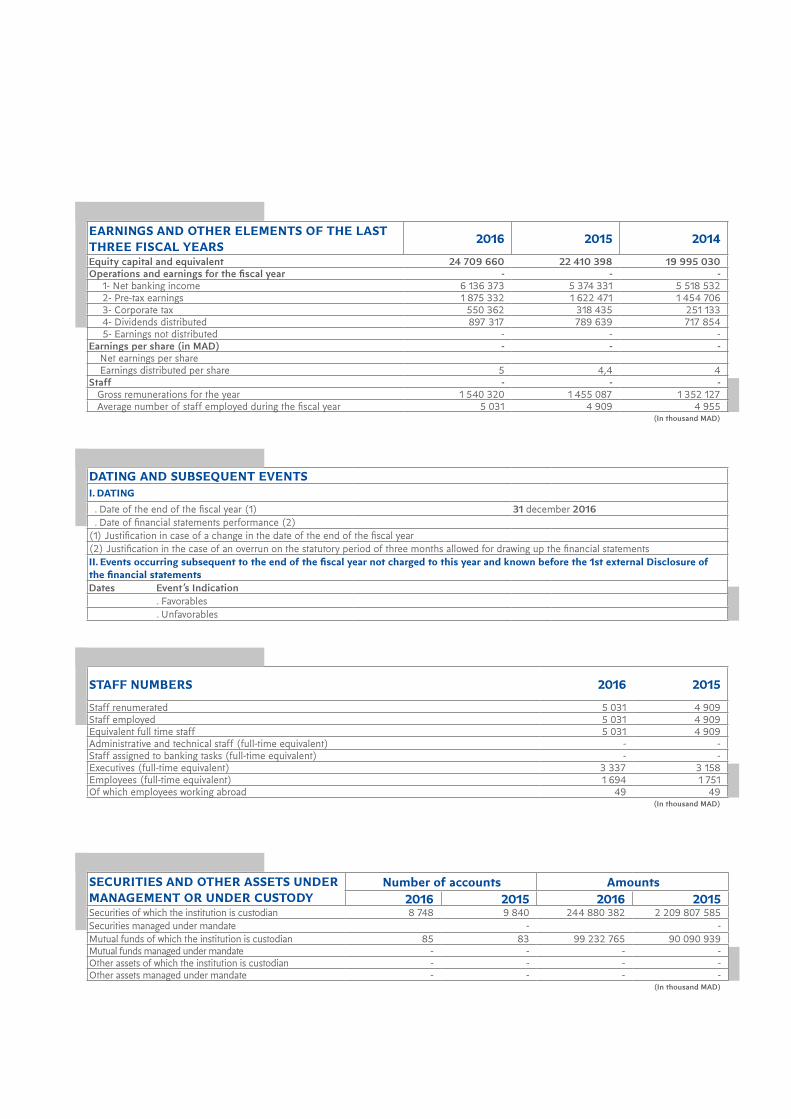
EARNINGS AND OTHER ELEMENTS OF THE LAST THREE FISCAL YEARS 2016 2015 2014
Equity capital and equivalent 24 709 660 22 410 398 19 995 030 Operations and earnings for the fiscal year - - - 1- Net banking income 6 136 373 5 374 331 5 518 532 2- Pre-tax earnings 1 875 332 1 622 471 1 454 706 3- Corporate tax 550 362 318 435 251 133 4- Dividends distributed 897 317 789 639 717 854 5- Earnings not distributed - - - Earnings per share (in MAD) - - - Net earnings per share Earnings distributed per share 5 4,4 4 Staff - - - Gross remunerations for the year 1 540 320 1 455 087 1 352 127 Average number of staff employed during the fiscal year 5 031 4 909 4 955
(In thousand MAD)
DATING AND SUBSEQUENT EVENTSI. DATING . Date of the end of the fiscal year (1) 31 december 2016 . Date of financial statements performance (2)(1) Justification in case of a change in the date of the end of the fiscal year(2) Justification in the case of an overrun on the statutory period of three months allowed for drawing up the financial statementsII. Events occurring subsequent to the end of the fiscal year not charged to this year and known before the 1st external Disclosure of the financial statementsDates Event’s Indication
. Favorables
. Unfavorables
STAFF NUMBERS 2016 2015
Staff renumerated 5 031 4 909 Staff employed 5 031 4 909 Equivalent full time staff 5 031 4 909 Administrative and technical staff (full-time equivalent) - - Staff assigned to banking tasks (full-time equivalent) - - Executives (full-time equivalent) 3 337 3 158 Employees (full-time equivalent) 1 694 1 751 Of which employees working abroad 49 49
(In thousand MAD)
SECURITIES AND OTHER ASSETS UNDER MANAGEMENT OR UNDER CUSTODY
Number of accounts Amounts2016 2015 2016 2015
Securities of which the institution is custodian 8 748 9 840 244 880 382 2 209 807 585 Securities managed under mandate - - Mutual funds of which the institution is custodian 85 83 99 232 765 90 090 939 Mutual funds managed under mandate - - - - Other assets of which the institution is custodian - - - - Other assets managed under mandate - - - -
(In thousand MAD)

Pare
nt F
inan
cial
Sta
tem
ents
The following statements post ‘‘non applicable’’ mention for the 2016 fiscal year :
Derogatory statements
Summary of changing methods
Subsidies, assigned public funds and special guarantee funds
NETWORK 2016 2015
Permanent branches 723 697 Temporary branches - - ATMs 848 824 Main branches and branches abroad 1 1 Representative offices abroad 39 39
(In number)
NUMBER OF CUSTOMER ACCOUNTS 2016 2015
Customer accounts 101 319 91 571 Current accounts 281 612 268 489 Check accounts excluding Moroccan expatriates 1 139 063 1 051 872 Moroccan expatriates accounts - - Factoring accounts 840 156 780 521 Savings accounts 10 810 11 214 Time deposits 1 521 1 965 Interest-bearing notes - -
(In number)
PAGE
232
/233
FIXED ASSETS ON LEASING, WITH OPTION TO PURCHASE, AND WITH SIMPLE LEASE
Ending FY : 31 December 2016
NATURE
Gross amount
beginning of the year
Acquisi-tions of the year
Cessions of the year
Gross Amount
year ended
Depreciation Provisions Net Amount
year ended
Deprecia-tion
Total Deprecia-
tionsProvi-sions
Write-backs
Total pro-visions
Fixed Leasing Assets - - - - - - - - - - Leasing on intangible assets - - - - - - - - - - Furniture leasing - 74 000 - 74 000 - - - - - 74 000
- In progress - 74 000 - 74 000 - - - - - 74 000 - Leased - - - - - - - - - - - Non Leased after termination - - - - - - - - - -
Real leased leasing - - - - - - - - - - - In progress - - - - - - - - - - - Leased - - - - - - - - - - - Non leased after termination - - - - - - - - - -
Leased to perceive - - - - - - - - - - Restructured leases - - - - - - - - - - Non paid leases - - - - - - - - - - Non performing loans - - - - - - - - - - Fixed assets given on simple lease - - - - - - - - - - Furniture given on simple lease - - - - - - - - - - Real-estate given on simple lease - - - - - - - - - - Leases to perceive - - - - - - - - - - Restructured leases - - - - - - - - - - Non paid leases - - - - - - - - - - Non performing loans - - - - - - - - - - TOTAL - 74 000 - 74 000 - - - - - 74 000
BMCE
BANK
OF
AFRICA

ASSETS 2016 2015
Cash, central banks, treasury, giro accounts 4 145 522 2 696 160 Loans to credit institutions and equivalent 28 616 951 26 834 499 . Demand 2 148 282 3 149 726 . Time 26 468 669 23 684 773 Loans and advances to customers 113 572 633 112 128 523 . Cash and consumer loans 40 200 395 38 846 783 . Equipment loans 17 282 066 15 171 241 . Mortgage loans 37 725 042 36 374 131 . Other loans 18 365 130 21 736 368 Advances acquired by factoring 668 926 - Transaction and marketable securities 36 834 750 24 393 296 . Treasury bonds and equivalent securities 14 394 967 4 315 981 . Other debt securities 3 313 509 709 167 . Title deeds 19 126 274 19 368 148 Other assets 2 115 446 2 079 546 Investment securities 2 036 226 3 561 820 . Treasury bonds and equivalent securities 1 559 544 1 642 527 . Other debt securities 476 682 1 919 293 Equity investments and equivalent uses 8 338 825 8 160 611 Subordinated loans 193 101 195 461 Fixed assets leased and rented 74 000 - Intangible fixed assets 516 315 462 997 Tangible fixed assets 5 293 716 4 416 862 TOTAL ASSETS 202 406 411 184 929 775
(In thousand MAD)
LIABILITIES 2016 2015
Central banks, treasury, giro accounts - - Liabilities to credit institutions and equivalent 25 204 383 30 652 736 . Demand 7 413 143 8 537 607 . Time 17 791 240 22 115 129 Customer deposits 129 888 105 120 251 764 . Demand deposits 70 445 511 62 765 534 . Savings deposits 21 371 211 20 159 145 . Time deposits 32 376 779 30 796 912 . Other deposits 5 694 604 6 530 173 Debt securities issued 12 076 677 9 454 620 . Negotiable debt securities 9 512 638 7 427 788 . Bond loans 2 564 039 2 026 832 . Other debt securities issued - - Other liabilities 10 917 583 2 764 747 Contingent liabilities 548 576 482 629 Regulated provisions - - Subsidies, assigned public funds and special guarantee funds - - Subordinated debts 10 085 536 8 206 900 Revaluation reserve - - Reserves and premiums related to capital 10 892 004 10 485 304 Capital 1 794 634 1 794 634 Shareholders unpaid-up capital (-) - - Retained earnings (+/-) 62 44 Net earnings being appropriated (+/-) - - Net earnings for the year (+/-) 998 851 836 397 TOTAL LIABILITIES 202 406 411 184 929 775
(In thousand MAD)
Domestic ActivityBalance Sheet

Pare
nt F
inan
cial
Sta
tem
ents
OFF-BALANCE SHEET 2016 2015
Given commitments 23 029 364 17 993 220 Financing commitments on behalf of credit institutions and equivalent 370 797 940 029 Financing commitments on behalf of customers 8 773 032 4 805 077 Guarantee commitments given to credit institutions and equivalent 4 784 658 2 812 887 Guarantee commitments given to customers 8 962 052 9 354 766 Securities repos purchased 78 357 78 357 Other securities to be delivered 60 468 2 104 Received commitments 10 281 321 6 661 049 Financing commitments received from credit institutions and equivalent - - Guarantee commitments received from credit institutions and equivalent 9 898 500 6 419 841 Guarantee commitments received from the State and various guarantee bodies 381 273 30 773 Securities repos sold - - Other securities to be received 1 548 210 435
(In thousand MAD)
2016 2015
Bank operating revenues 9 971 197 9 998 694 Interests and assimilated revenues on transactions with credit institutions 470 114 524 896 Interests and assimilated revenues on transactions with customers 5 348 873 5 333 961 Interests and assimilated revenues on debt securities 393 093 357 491 Revenues on title deeds 574 526 488 610 Revenues from leased and rented fixed assets - - Fees on provided services 1 034 788 936 609 Other banking revenues 2 149 803 2 357 127 Bank operating expenses 4 185 001 4 949 106 Interests and assimilated expenses on transactions with credit institutions 850 283 740 583 Interests and assimilated expenses on transactions with customers 1 740 154 1 773 754 Interests and assimilated expenses on debt securities issued 370 761 547 152 Expenses on leased and rented fixed assets - - Other banking expenses 1 223 803 1 887 617 Net banking income 5 786 196 5 049 588 Non-banking operating revenues 110 111 134 333 Non-banking operating expenses 266 867 48 713 General operating expenses 3 488 022 3 237 226 Staff expenses 1 537 315 1 451 934 Tax expenses 99 018 85 230 External expenses 1 489 855 1 361 845 Other general operating expenses 10 022 41 Allowances for depreciation and provisions for intangible and tangible fixed assets 351 812 338 176 Allowances for provisions and loan losses 1 225 185 1 734 958 Allowances for non performing loans and commitments 1 134 947 1 283 564 Loan losses 8 844 373 650 Other allowances for provisions 81 394 77 744 Provision write-backs and recovery on amortised debts 540 025 991 563 Provision write-backs on non performing loans and commitments 354 630 733 941 Recovery of amortised debts 28 343 42 340 Other provision write-backs 157 052 215 282 Current income 1 456 258 1 154 584 Non-current revenues - - Non-current expenses - - Pre-tax earnings 1 456 258 1 154 584 Corporate tax 457 407 318 187 Net earnings for the year 998 851 836 397
(In thousand MAD)
Domestic ActivityIncome Statement
PAGE
234
/235
BMCE
BANK
OF
AFRICA

EARNINGS FORMATION TABLE 2016 2015
+ Interests and assimilated revenues 6 212 080 6 216 348 - Interests and assimilated expenses 2 961 199 3 061 489 Net interest income 3 250 881 3 154 859 + Revenues from leased and rented fixed assets - - - Expenses on leased and rented fixed assets - - Profit from leasing and renting operations - - + Fees received 1 290 101 1 124 802 - Fees paid 299 296 211 921 Net fee income 990 805 912 881 ± Income from operations on transaction securities 933 774 358 449 ± Income from transactions on marketable securities 35 622 64 677 ± Income from exchange transactions 240 032 289 489 + Income from derivatives transactions 6 159 -25 524 Income from market transactions 1 215 587 687 091 + Other miscellaneous banking revenues 574 526 488 610 - Other miscellaneous banking expenses 245 606 193 854 Net banking income 5 786 196 5 049 587 ± Net income from equity investments 118 179 210 182 + Other non-banking operating revenues 110 043 134 333 - Other non-banking operating expenses 247 546 47 258 - General operating expenses 3 488 023 3 237 226 Gross operating income 2 278 846 2 109 618 ± Allowances for non performing loans and commitments (net of write-backs) -760 814 -880 934 + Other allowances net of provision write-backs -61 774 -74 098 Current income 1 456 258 1 154 584 Non-current income - - - Corporate tax 457 407 318 187 Net earnings for the year 998 851 836 397
(In thousand MAD)
CASH-FLOW 2016 2015
+ Net earnings for the year 998 851 836 397 + Allowances for depreciation and provisions for intangible and tangible fixed assets 351 812 338 176 + Allowances for provisions for equity investments depreciation 6 800 - + Allowances for provisions for general risks 58 900 65 205 + Allowances for regulated provisions - - + Non-current allowances - - - Provisions write-backs 144 232 211 636 - Capital gains on disposals of intangible and tangible fixed assets 25 691 63 644 + Capital losses on disposals of intangible and tangible fixed assets - - - Capital gains on disposals of equity investments 67 - + Capital losses on disposals of equity investments 19 321 1 455 - Write-backs of investment subsidies received - - ± Financing capacity 1 265 694 965 953 - Dividends distributed - - + Cash-flow 1 265 694 965 953
(In thousand MAD)

BMCE BANK OF AFRICANotre Monde est Capital
PAGE
236
/237

FRANCEAsnières 43 Rue Pierre Brossolette92600 - Asnières Sur SeineTel. : +33 1 46 13 43 40Fax : +33 1 46 13 43 44
Bordeaux35 Avenue Charles de Gaulle33200 - BordeauxTel. : +33 5 56 02 62 60Fax : +33 5 56 17 09 52
Dijon 64 bis Avenue du drapeau21000 - DIJONTel. : +33 3 80 60 59 00Fax : +33 3 80 60 59 01
Lille48 Boulevard de la liberté59800 - LILLETel. : +33 3 20 40 12 00Fax : +33 3 20 12 98 08
Lyon1 Rue Carry69003 - LYONTel. : +33 4 72 34 38 07Fax : +33 4 78 54 24 04
Mantes-la-jolie 34 Boulevard du Marechal Juin78200 - MANTES LA JOLIETel. : +33 1 39 29 25 30Fax : +33 1 39 29 25 44
Marseille20 Boulevard Dugommier13001 - MARSEILLETel. : 33 4 91 64 04 31Fax : 33 4 91 64 88 47
Montpellier59 Cours Gambetta34000 - MONTPELLIERTel. : +33 4 67 58 06 18Fax : +33 4 67 58 58 06
Orléans6/8 Place de l’indien45100 - ORLEANS La SourceTel. : +33 2 38 25 31 90Fax : +33 2 38 25 31 99
Paris 175 bis Avenue de Clichy75017 - PARISTel. : +33 1 44 69 96 77Fax : +33 1 42 93 90 98
Strasbourg13 Avenue du Général de Gaulle 67000 - STRASBOURGTel. : +33 3 88 61 00 18Fax : +33 3 88 61 45 73
Toulouse64 bis Avenue Jean Rieux31500 - TOULOUSETel. : +33 5 61 20 08 79Fax : +33 5 61 20 06 92
SPAINAlmériaAvenida Del Mediterráneo176, 04007 - AlmeríaTel. : +34 950 28 23 28
BarcelonaCalle Tarragona n° 84 – 90, local 4 08015 - BarcelonaTel. : +34 933 25 17 50Fax : +34 934 23 26 05
CrevillentCarrer Virgen Del Pilar Núm. 10-Bajo A03330 CrevillentTel. : +34 966 68 24 73
LorcaAvenida de Europa Num°6 Local 2.30 800-LorcaTel. : +34 968 477 740
MadridPlaza Cataluna n° 128002 - MadridTel. : +34 915 64 57 63Fax : +34 915 64 59 11
MalagaCalle Manuela Nogales, 1 - Local n°3 Edif. Las Perlas Esquina C/ La unión conC/Edison, C.P.29006 MalagaTel. : +34 951 56 07 00Fax : +34 951 76 72 22
MurciaCalle Bolos 6 bajo 2 30005 - MurciaTel. : +34 968 29 06 73Fax : +34 968 29 12 63
TarragonaRambla Nova 125 bajo 3 43001 - Tarragona Tel. : +34 977 24 85 24Fax : +34 977 21 37 32
ValenceCalle Jorge Comin N°12,Bajo 46015 - ValenciaTel. : +34 963 53 44 41Fax : +34 963 94 24 39
ITALYBolognaViale Pietro Pietramellara, 3540121 - BolognaTel. : +39 5 12 49 824Fax : +39 2 89 69 16 283
MilanoViale Nazario Sauro 5 20124 - MILANOTel. : +39 2 89 28 17 00Fax : +39 2 89 69 16 28
PadovaCorso Del Popolo, 135131 - PADOVATel. : +39 4 97 80 03 01Fax : +39 4 97 80 61 94
TorinoPiazza della Repubblica, 1910152 - TORINOTel. : +39 1 14 36 77 89Fax : +39 1 14 36 75 18
UNITED KINGDOMLondon19 Craven Road W23Bp - LondonTel. : +44 20 75 18 82 52Fax : +44 20 76 29 05 96
UNITED ARAB EMIRATESBMCE Bank office in united arab emirates733, Hazza Bin Zayed - the first street(91th Street) Tel. : +971 24 41 55 61/62
GERMANYDüsseldorfEller Strasse 10440227 - DUSSELDORFTel. : +49 21 18 63 98 64Fax : +49 21 18 63 98 70
FrankfurtBASELER Str 35-3760329 - FRANKFURTTel. : +49 6 92 74 03 40Fax : +49 6 92 74 03 44
BELGIUM Bruxelles30 Boulevard Maurice Lemonnier 1000 - BruxellesTel. : +32 22 13 19 90Fax : +32 22 13 19 99
Bruxelles Molenbeek139, chaussée de Gand1080 Molenbeek - BruxellesTel. : +32 24 41 49 45
AnversBorgerhout, Drink 7/32140 - AntwerpenTel. : +32 32 70 04 13
CANADABMCE Bank office in Canada1241 rue Peel (coin Sainte Catherine)H3B 5L4Montréal (Québec)CANADATel. : +1 514 224 1451
CHINABMCE Bank office in BeijingHenderson Center, Tower One,Units 1202/1203/120418, Jian Guo Men Nei Avenue100 005 Beijing, PR ChinaTel. : +861 065 18 23 63 Fax : +861 065 18 23 53
NETHERLANDS Amsterdam183 Johan Huizingalaan1065 JAAMSTERDAMTel. : +31 (0) 203 54 63 30
Rotterdam Vieroombachtstraat 98 b,3023AS, RotterdamTel. : +31 1 02 37 18 53
BMCE Bank Branch Network,Representative Offices and Desks Abroad

Gro
up S
ubsi
diar
ies
BMCE CAPITAL CHAIRMAN OF THE EXECUTIVE BOARDM. Khalid NASR BUSINESS PURPOSEInvestment bank HEAD OFFICETour BMCE, rond point Hassan II,20 039 Casablanca TEL : 0522 49 89 78 FAX : 0522 22 47 41/48 WEBSITEwww.bmcecapital.com
SECRETARY GENERALM. Mohamed IDRISSI TEL : 0522 46 20 01FAX : 0522 22 47 48
BMCE CAPITAL MARKETSM. Abdelmalek BENABDELJALIL TEL : 0522 49 82 04FAX : 0522 43 01 34
BMCE CAPITAL BOURSEMANAGING DIRECTORM. Anas MIKOU BUSINESS PURPOSESecurities brokerHEAD OFFICETour BMCE, rond point Hassan II,20 039 Casablanca TEL : 0522 49 81 01 FAX : 0522 48 10 07 WEBSITEwww.bmcecapital.com
BMCE CAPITAL GESTIONMANAGING DIRECTORM. Amine AMOR BUSINESS PURPOSEAsset management HEAD OFFICETour BMCE, rond point Hassan II,20 039 Casablanca TEL : 0520 36 43 00 FAX : 0522 47 10 97 WEBSITEwww.bmcecapital.com
BMCE CAPITAL GESTION PRIVÉEMANAGING DIRECTORMme. Meryem BOUAZZAOUI BUSINESS PURPOSEPortfolio managementHEAD OFFICETour BMCE, rond point Hassan II,20 039 Casablanca TEL : 0522 49 89 65FAX : 0522 48 13 77WEBSITEwww.bmcecapital.com
BMCE CAPITAL CONSEILCHAIRMAN OF THE EXECUTIVE BOARDM. Mehdi Jalil DRAFATEBUSINESS PURPOSE Corporate financeTEL : 0522 42 91 00 FAX : 0522 43 00 21WEBSITEwww.bmcecapital.com
BMCE EUROSERVICESMANAGING DIRECTORM. Adil MESBAHIBUSINESS PURPOSE Banking for Moroccans living abroadHEAD OFFICE6, Rue Cambacérès, 75008TEL : 01 42 66 60 70 FAX : 01 42 66 60 50
BMCE BANK INTERNATIONAL UK/FRANCEMANAGING DIRECTORM. Mohammed AFRINEHEAD OFFICE/London26 Upper Brook StMayfairLondon W1K 7QE United KingdomTel.: 00 44 207 429 55 50Fax : 00 4 207 248 85 95HEAD OFFICE/France33/41 Rue Cambon 75 001 Paris - FranceTel : 00 33 1 70 36 94 00Fax : 00 33 1 70 36 94 37WEBSITEwww.bmce-intl.co.uk
BMCE INTERNATIONAL MADRIDMANAGING DIRECTORM. Radi HAMUDEHHEAD OFFICECelle Serrano, N°59 28 006 Madrid - EspagneTel : 00 34 915 75 68 00Fax : 00 34 914 31 63 10WEBSITEwww.bmce-intl.com
BANK OF AFRICADIRECTOR AND CHIEF EXECUTIVE OFFICERM. Amine BOUABIDBUSINESS PURPOSEBankHEAD OFFICEAgora Mali Bureau de Représentationde Dakar - Sénégal 3, place de l’indépen-dance, ImmeubleTel. : 00 2213 38 89 55 00
00 2213 38 23 41 96Fax : 00 3491 431 63 10
LA CONGOLAISE DE BANQUE MANAGING DIRECTORM. Mohamed TAHRIHEAD OFFICEAvenue Amilcar CabralTel : 00 242 222 81 09 78/222 81 09 56Fax : 00 242 222 81 09 77/222 81 10 30WEBSITEwww.lacongolaisedebanque.com
BANQUE DE DEVELOPPEMENT DU MALIMANAGING DIRECTORM. Bréhima Amadou HAïDARAHEAD OFFICEAvenue Modibo KéitaBP 94 Bamako MaliTEL : +223 20 22 20 50 22/20 22 53 36 FAX : +223 20 22 50 85/20 22 42 50WEBSITEwww.bdm-sa.com
BMCE CAPITAL TUNISIEMANAGING DIRECTORAbdelmalek BENABDELJALIL BUSINESS PURPOSEInvestment bankingHEAD OFFICE67, Avenue Mohamed V - 1002 Tunis Tunisie TEL : +216 71 901 250 +216 25 901 901FAX : +216 71 904 522
MAGHREBAIL CHAIRMAN AND CHIEF EXE-CUTIVE OFFICERM. Azeddine GUESSOUSBUSINESS PURPOSELeasing HEAD OFFICE45, Bd Moulay Youssef, 20 000 Casablanca TEL : 0522 48 65 00 FAX : 0522 27 44 18WEBSITEwww.maghrebail.co.ma
RM EXPERTS CHAIRMAN AND CHIEF EXE-CUTIVE OFFICERM. Mamoun BELGHITIBUSINESS PURPOSELoan recoveryHEAD OFFICELotissement Zénith Millenium - Immeuble 2 bis 3ème étage - Sidi Maârouf CasablancaTEL : 05 22 20 42 91 78 / 79FAX : 05 22 58 09 87
SALAFIN CHAIRMAN OF THE EXECU-TIVE BOARDM. Aziz CHERKAOUI BUSINESS PURPOSEConsumer creditHEAD OFFICEZenith MilleniumImmeuble 8, Sidi MaâroufCasablancaTEL : 0522 97 44 55FAX : 0522 97 44 77WEBSITEwww.salafin.com
MAROC FACTORING CHAIRMAN OF THE EXECU-TIVE BOARDM. Youssef HAMIRIFOU BUSINESS PURPOSEFactoring HEAD OFFICEBd. Moulay Youssef, n° 63, résidence Adriana, 1er étageTEL : 0520 42 76 32/37 FAX : 0522 20 62 77 WEBSITEwww.maroc-factoring.co.ma
BMCE Bank Group Subsidiaries PAGE
238
/239
BMCE
BANK
OF
AFRICA

2016 • Contributed to Morocco’s alliance with China, assuming the role of investor and banker as part of the Cité Mohammed VI Tanger-Tech project, presided over by His Majesty the King, following the signing of a partnership agreement with HAITE Group, a Chinese group and the region of Tangier Tétouan-Al Hoceima;
• Participated in the official launch of ‘Principles for positive impact finance’, organised by Europlace and UNEP FI; this is a common global framework to help the finance community assess the sustainability of their assets;
• ‘Let’s Dream of a New World’, an advertising film, won the award for Best Film in the Corporate category at the US International Film & Video Festival, Gold Camera awards for Cinematography and Direction and a Silver Screen award for Music;
• More recognition for ‘Let’s Dream of a New World’, the advertising film, at the Mobius Awards for Advertising in Los Angeles in the ‘Visual Effects’ and ‘Art Direction’ categories. It was also nominated in the Best Film category at the American Advertising Festival.
• ‘Top Performer, CSR Morocco’, awarded by Vigeo-Eiris, a non-financial ratings agency, for the 4th consecutive year in the ‘Environment’ category
• BMCE Bank of Africa became the first Moroccan bank to issue green bonds by public offering to help finance eco-responsible projects at home and abroad and support private and public sector initiatives aimed at preserving natural resources.
• First Moroccan bank to sign up to the United Nations Global Compact, underlining its commitment and support for the ten principles relating to human rights, labour standards, environmental protection and anti-corruption.
• Signed up to the ‘Mainstreaming Climate Action within Financial Institutions’ initiative in conjunction with the EIB, the AfDB, the EBRD, HSBC, Yes Bank and others financial institutions.
• BMCE Bank Of Africa included in the Eiris‐Vigeo Emerging 70 Index specialising in emerging countries in recognition of best practice in CSR
• BMCE Capital Gestion Privée became the first financial institution in Morocco to obtain ISO 9001:2008 certification for its private portfo-lio management operations;
• BMCE Capital Gestion obtained Service Commitments and ISO 9001: 2015 certifications in May 2016; • BMCE Bank Of Africa an award winner for the 3rd consecutive year at the CSR Arabia Awards 2016 • First bank in the MENA region to obtain ISO 50001 certification for its Energy Management System • First Moroccan bank and the second in Africa to be awarded HEQ certification from Cerway International Certification for the new BMCE
Bank Of Africa Academy head office – design and implementation phases • MOU signed with the AfDB and the EIB for Africa’s first ever credit facility totalling EUR 20 million for financing Climate Change Adap-
tation.
2015 • BMCE Bank OF AFRICA’ adopted as the group’s new corporate name, emphasising its African profile • Celebrating the 55th anniversary since the Bank was founded and the 20th anniversary since BMCE Bank Foundation was founded • Stake raised in boa group to 75%, in banque de développement du mali to 32.4% and in la congolaise de banque to 37% • BANK OF AFRICA expands into Rwanda in November 2015, through the acquisition of agaseke bank • Mandarin chinese introduced into the BMCE Bank Foundation’s Medersat.Com schools network • Expansion of the Medersat.Com network with a new school opened in Béni Chiguer in Nador, thereby strengthening the Foundation’s
schools network within the region • Inaugural african entrepreneurship award sees BMCE Bank award prizes to 10 winners in Africa in recognition of their best ideas for
entrepreneurial projects • BMCE Bank named “Bank Socially Responsible Bank of the Year “ at the 9th edition of the African Banker Awards • «Top Performer CSR» awarded by Vigeo for the 2nd time • CSR Arabia Awards 2015 - Category Financial Services – the only company listed on the Casablanca Stock Exchange to obtain the
highest scores in 7 Social Responsibility topics • ISAE 3402 Type II Certification of BMCE Capital Gestion assigned by PWC and this for the second time in dedication to safe work
environment • Issue of a subordinated note of 2 billion MAD
2014 • Representative office opened in Canada • Two BMCE Euroservices branches opened in the Netherlands • Organization of the first edition of the China Africa Investment Meetings in coopertion with the China Africa Joint Chamber of Com-
merce and Industry • Launching of BOA Capital with the CFC status in partnership with BMCE Capital • Issue of a subordinated note of 2 billion MAD • Launch of the African Entrepreneurship Award, a 1 million dollard distinction for young african entrepreneurs
2013 • Strengthening the participation of BMCE Bank in the capital of the Pan African Group Bank of Africa from 65% to 72.6% in 2013 • Restructuring BMCE International Holding now combining the two European subsidiaries BBI London and Madrid, in the service of
Africa • Creating BMCE Euroservices subsidiary which offers to MLA a diverse range of products & services • Successful Issue of the first Moroccan Corporate Eurobond, subscribed by sixty foreign investors for the amount of $ 300 million.
2012 • Capital increase of 1.5 billion dirhams for the benefit of shareholders in November 2012 • BMCE Bank acquired additional capital in Bank of Africa Group to 65% • Obtaining for the second consecutive year, the label «BMCE Bank- No Tobacco Company » Gold Level, awarded by the Lalla Salma
Association against Cancer • BMCE Bank awarded «Best Trade Finance Bank in Morocco» by the magazine Global Trade Review and «Socially Responsible Bank of
the Year» by The African Awards • « Top Performers CSR Morocco » awarded by Vigeo for the environmental strategy of BMCE Bank and its social commitment in January
2012 • Issue of a subordinated debt of 1 billion MAD in the local market
2011 • Increase of the bank’s equity stake in BOA to 59,39% • Reinforcement of the bank’s holding in Maghrebail and Locasom to 51% and 89,5%, respectively • BMCE Bank named for the second time “Best Bank in Morocco” by the British Magazine EMEA Finance • First bank in Morocco and the MENA Region to be ISO 14001 certified for the environment
2010 • Aquisition by CDG Group of a 8% equity stake in BMCE Bank • Capital increase of 2.5 billion MAD, issue premium included, reserved to Credit Mutuel - CIC, through its Holding BFCM • Launch of the first tranche of capital increase of 500 mMAD, issue premiuim included, reserved to BMCE Bank employees • Takeover of Bank of Africa , following the increase of BMCE Bank’s stake to 55.8% • Increase of BMCE Bank’s stake in Maghrébail from 35.9% to 51%
History

His
tory
2009 • Reinforcement of CIC Group’s equity stake in the capital of BMCE Bank, through its holding company, BFCM, from 15.05% to 19.94% • Issue of a MAD 1 billion perpetual subordinated debt on the local market
2008 • Acquisition of an additional equity stake of 5% by CIC in BMCE Bank, bringing it to 15,04%. • Issue of a 70 million Euros perpetual subordinated debt to International Financial Corporation (IFC) • Issue of a 50 million Euros Subordinated debt to Proparco • Issue of a MAD 1 billion Perpetual Subordinated debt • BMCE Bank’s stock split, bringing the nominal value of shares from MAD 100 to MAD 10 • Increase of the Group’s equity stake in Bank of Africa from 35 % to 42.5% • Transfer of CIC’s equity stake in BMCE Bank through its holding, La Banque Fédérative du Crédit Mutuel
2007 • Acquisition of a 5% stake in the Bank’s capital by Caja Mediterraneo following a strategic partnership agreement • Alliance between BMCE Bank and AFH/Bank of Africa ; BMCE Bank being the reference shareholder in the capital of Bank of Africa
with an equity stake of 35% • Start of the business activities of MediCapital Bank, the London based affiliate of BMCE Bank Group • Award of the first prize in Human Resources for BMCE Bank by «HR Management and Training Association» (AGEF). • Winning for the second time in a row of the first prize in financial communication, awarded by the Moroccan Financial Analysts Associa-
tion to BMCE Bank as the first ranked bank and listed company, all categories combined.
2006 • Obtaining of the « Investment Grade » rating on Banking deposits denominated in dirhams, awarded by the international rating agency Moody’s
• ISO 9001 Certification for project Finance & Recovery activities • «Bank of the year-Morocco» granted for th 5th time since 2000 and the 3rd consecutive time, by the Banker Magazine • Inauguration of Axis Capital, the Tunisian Investment Bank • Obtaining by BMCE Bank Foundation of the « Excellence » prize for the sustained Development, granted by the Morocco-Switzerland
Founation2005 • BMCE Bank creating a new visual identity on the occasion of its 10th anniversary celebrations since privatisation • Launch of a branch opening programme with 50 branch to be opened each year • Signing of an agreement with the BEI for the establishment of a 30 million euros credit line without sovereign guarantee • Launch of BMCE Bank Group of its 2nd stock employee programme • Issue of the second tranche of a MAD 500 million subordinated bond • BMCE Bank awarded the title of «Bank of the Year - Morocco» by «The Banker» magazine
2004 • Acqusiition of CIC of a 10% stake in BMCE Bank • 1st non-European bank to receive a social responsibility rating in Morocco • BMCE Bank awarded «Bank of the Year - Morocco» by the magazine «The Banker»
2003 • Launch of the CAP CLIENT interprise project • Issue od a stock employee programme of 4.72% of the Bank’s share capital • Isssue of MAD 500 million subordinated debt • Inauguration of BMCE Capital Dakar
2002 • Implementation of a new customer-oriented organisation • ISO 9001 certification for all activities related to custody • Change of status of the Tangier Free Zone Branch, becoming an offshore bank • Stock repurchase Programme of 1.5 million BMCE shares, representing 9.45% of the Bank’s share capital
2001 • Opening of the Barcelona Representative Office • ISO 9001 certification for the quality management system introduced for foreign activity and electronic banking. • BMCE Bank awarded the title of «Bank of the Year - Morocco» by «The Banker» magazine
2000 • Opening of Representative Offices in London and Beijing • Creation of the holding company FinanceCom • BMCE Bank awarded the title of «Bank of the Year - Morocco» by «The Banker» magazine
1999 • Equity investment in AL WATANIYA, giving birth to a leading insurance company • Equity investment of 20% in the first private telecoms operator MEDI TELECOM
1998 • Creation of BMCE CAPITAL, the Group’s investment bank
1997 • Creation of SALAFIN, a consumer credit company
1996 • Launching of a 60 million dollar issue of GDR shares, the first of its kind, in international financial markets
1995 • Privatisation of the Bank
1994 • Creation of BMCE Bank’s first capital market companies : MIT and MARFIN
1989 • Opening of BMCE Internacional in Madrid
1988 • Creation of a factoring company, MAROC FACTORING
1975 • Listing on the Stock Exchange
1972 • BMCE becomes the first Moroccan bank to establish an overseas presence by opening a branch in Paris
1965 • Opening of the Tangier Free Zone Branch
1959 • Creation of BMCE Bank by the Public Authorities
PAGE
240
/241
BMCE
BANK
OF
AFRICA

BMCE BANK
BP 20 039 Casa PrincipaleTel : 05 22 20 04 92 / 96Fax : 05 22 20 05 12Capital : 1 794 633 900 dirhamsSwift : bmce ma mcTelex : 21.931 - 24.004Trade register : casa 27.129PO checking account : Rabat 1030Social security : 10.2808.5Fiscal ID N° : 01085112Trading license : 35502790
GOVERNANCE AND DEVELOPMENT GROUP - FINANCIAL COMMUNICATIONTel : 05 22 49 80 03 / 05 22 49 80 04Fax : 05 22 26 49 65E-mail : [email protected]
BMCE BANK WEB SITEwww.bmcebank.ma
INTERNATIONAL TRADE WEB SITEwww.bmcetrade.com
INVESTMENT BANK WEB SITEwww.bmcecapital.com
GRAPHIC DESIGN : AMINA BENNANI - PRINT : DIRECT PRINT

