content effectiveness and functionalism, v - web … fall 2006, and i have a new assignment (at a...
TRANSCRIPT

Content Effectiveness
And Functionalism, v.2
By Chris Todd
CONTENT EFFECTIVENESS ..............................................................................1
Introduction.................................................................................................................................... 2
Functionalism ................................................................................................................................ 3
Functionalism: Mapping to Customer Support Site .................................................................. 4
The next step in our process is to examine the KPIs for each of our categories................. 11
Functionalism: Page Category KPIs.......................................................................................... 11 Engagers ................................................................................................................................... 11 Routers...................................................................................................................................... 12 Re-Assurers .............................................................................................................................. 13 Explainers.................................................................................................................................. 14 Explainers (for search) .............................................................................................................. 15 Converters................................................................................................................................. 16 Closer/Converter ....................................................................................................................... 16 Completer.................................................................................................................................. 17 Additional Site KPIs................................................................................................................... 18
Content Effectiveness Measures ............................................................................................... 18
Putting It All Together ................................................................................................................. 21 KPI Examples............................................................................................................................ 23
Missing Components .................................................................................................................. 25
Copyright © 2006 10-Oct-06 Page 1 of 26

Introduction
Having highly effective content for a support site is critical to its success. I think it
goes without saying that poor and/or missing content will lead to customer
dissatisfaction and higher phone calls and emails to your support specialist. Let
us not forget that the same can occur with good content when your customers
cannot find it.
Think of it as if you were going to see one of your favorite performers. For
example, say you were going to a U2 concert. Perhaps you got in an accident, or
simply just got lost. If you never made the show, the show still went on (good
content), but you never made it (you never found the content), so overall this
would be an unsatisfactory experience. Likewise, suppose you had no problems
traveling to the show, but there was a substitute for Edge that night or Bono’s
voice was particularly hoarse. In this case, you found the content, but the content
did not live up to your expectations (it did not meet your needs). So, we can say
that delivery (navigation and search) and the content itself make up the
components of content effectiveness.
Notice that I started this by referring content effectiveness, and not call
deflection. I believe effective content will lead to call deflection, but trying to
compare customer support website success to closing a job ticket in a call center
is difficult if not impossible. I will talk about why this is such a difficult task some
other time. For right now though, by ignoring the comparison from website to call
center, we can actually identify when we are successfully delivering usable
content to our customers.
In 2003, I began an RFP process to acquire a new web measurement and
analytics tool. One of my requirements for the successful vendor was to be able
to demonstrate experience in the customer support space. None of the vendors
were able to do that, including Web Trends, Omniture, and Web Side Story. It is
Copyright © 2006 10-Oct-06 Page 2 of 26

now fall 2006, and I have a new assignment (at a new company) to develop a
content effectiveness strategy. With the research that I have done for the past
few months, I still have not been able to find very much information related to
web analytics and customer support.
I did run across an interesting whitepaper from SEMphonic, Functionalism: A New Approach to Web Analytics. The authors of Functionalism have
developed a new way to approach web analytics (they have tried many different
approaches over the last 10 years) – through categorizing web pages by their
purpose, and measuring each page on how well they serve their designated
function. This paper will apply the Functionalism methodology to a customer
support website, and more specifically, content effectiveness.
Functionalism
Before we go deeper into figuring out our content effectiveness strategy, let us
explore Functionalism further. As I said, Functionalism uses the concept of
categorizing each page by its function. Once a page type is assigned, the success of a page is measured by Key Performance
Indicators (KPI’s) specific to the functions it was designed for. Central to Functionalism is
the concept that a measure of success for one page can be a measure of failure for a
different page. By categorizing and grouping pages by function, calculating and assigning
KPI’s makes the failure or success of a page more straightforward and transparent. It is
in this assignment of type-specific, easily measurable KPI’s that the power of
Functionalism resides. So the next obvious questions are “What are the page categories?” and “What
KPIs do we measure for each of the categories?” Again going back to the
whitepaper, these are the most common page classifications identified by
SEMphonic. • Engagers: Pages whose primary purpose is to interest the visitor and get them to do
something/anything on the site.
• Routers: Pages whose function is to move visitors into specific places on the site.
One of the differences between an Engager and a Router page is that the latter is
built with the expectation that the visitor has come to the page looking for a particular
Copyright © 2006 10-Oct-06 Page 3 of 26

type of information/service. Search should often be treated as a special class of
Router page.
• Convincers: Pages whose function is to “sell” the visitor on a product or service.
• Explainers: Pages whose job is to help the visitor understand some aspect of a
product or service.
• Informers: Pages whose primary objective is to provide basic news and information
about a product or industry. This differs from Explainers in that content is not specific
to your own particular product or service.
• Billboards: Pages providing various content to visitors, but whose primary business
objective is to display third-party advertisements on a Cost-per-Impression basis.
• Sponsors: Pages or series of pages which are themselves revenue-producing,
whose content is mostly provided by a third-party who pays for inclusion within your
website.
• Closers: Pages that are supposed to get visitors to enter a conversion process.
• Converters: Pages that are part of whatever is necessary to gather
information/agreements and get a finished lead/sale/transaction.
• Re-Assurers: Pages built to re-assure the visitor about some potentially problematic
issue or concern (privacy policies are a common example).
• Tools: Pages that are designed to collect or provide information as part of a
nonsales process (like checking an account status or finding a location). There are
many different kinds of tools and for a tool-rich site tool pages need to be subdivided
into more granular types.
• Completers: Thank-you pages – designed to signal the completion of a process and
– in some cases – drive to additional engagement.
Functionalism: Mapping to Customer Support Site
Now we understand a bit more about Functionalism, so let us now map it to our
customer support site. I will start with a simple site, having separate pages for
each stage through the site. At a later time, I’ll look at this from the perspective of
a more complex site. To begin, we will look at the logical flow of our site.
Copyright © 2006 10-Oct-06 Page 4 of 26
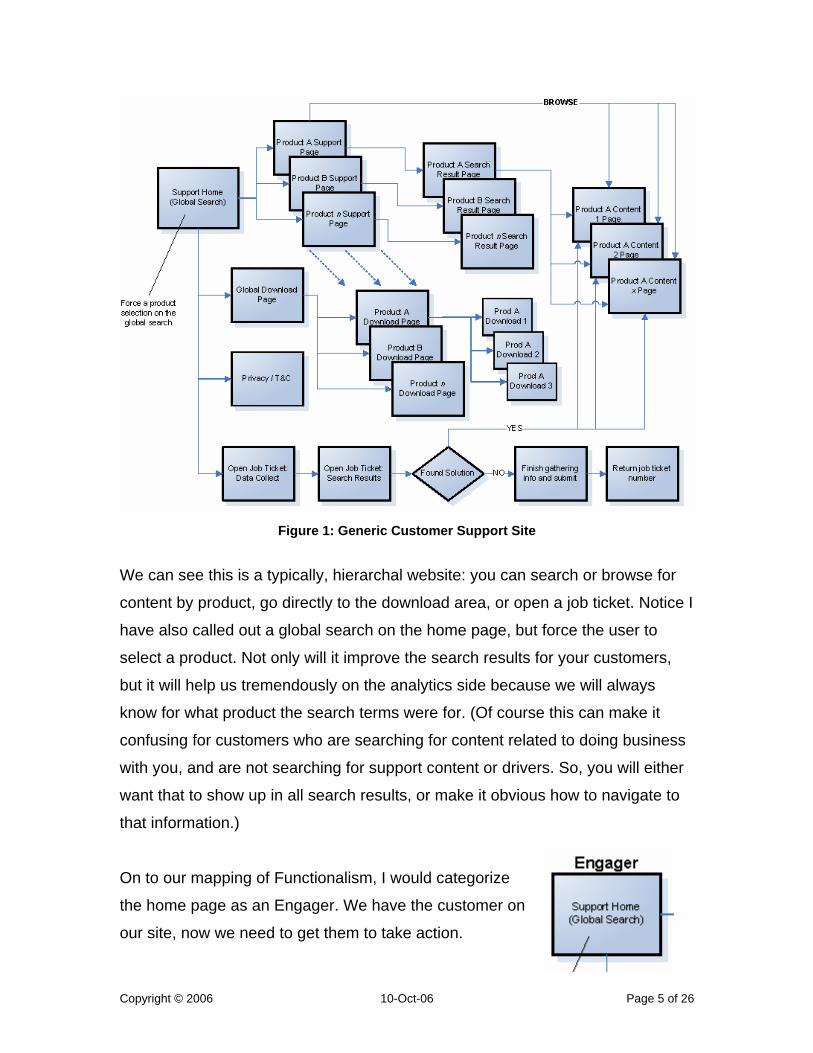
Figure 1: Generic Customer Support Site
We can see this is a typically, hierarchal website: you can search or browse for
content by product, go directly to the download area, or open a job ticket. Notice I
have also called out a global search on the home page, but force the user to
select a product. Not only will it improve the search results for your customers,
but it will help us tremendously on the analytics side because we will always
know for what product the search terms were for. (Of course this can make it
confusing for customers who are searching for content related to doing business
with you, and are not searching for support content or drivers. So, you will either
want that to show up in all search results, or make it obvious how to navigate to
that information.)
On to our mapping of Functionalism, I would categorize
the home page as an Engager. We have the customer on
our site, now we need to get them to take action.
Copyright © 2006 10-Oct-06 Page 5 of 26

Hopefully we have presented enough information for them to pickup the scent to
fulfill their intended goal or in other words, we should be engaging our users on
the home page.
From the home page we can go to our secondary
level pages, starting with the product specific
support pages. These pages have support content
specific for a single product. From here, your user
can get downloads specific to the product, they can
search content specific to the product, and they can
browse specific content, and read other content
specific data. This definition seems to match well
with that of a Router, “Pages whose function is to
move visitors into specific places on the site.”
Also linked from the home page is the global download
page. The purpose for this page is to assist the site
visitors who specifically came to the site to get a
download. From this page the visitor would select a
specific product to reach the product download page.
This is another form of a Router page.
We have a third type of Router page coming from the
home page, and that is the page where a user can initiate
the process to open a job ticket. This is the first of a multi-
step process. Do not confuse this page with a Tool
classification. If the intent was to examine the status of a job ticket, it would be
classified as a Tool page. But with this page, if the user came from the home
page, his or her intention was to open a job ticket. Through this process, we will
run a search for these users, and to try to “up sell” them on “buying” some
content instead.
Copyright © 2006 10-Oct-06 Page 6 of 26
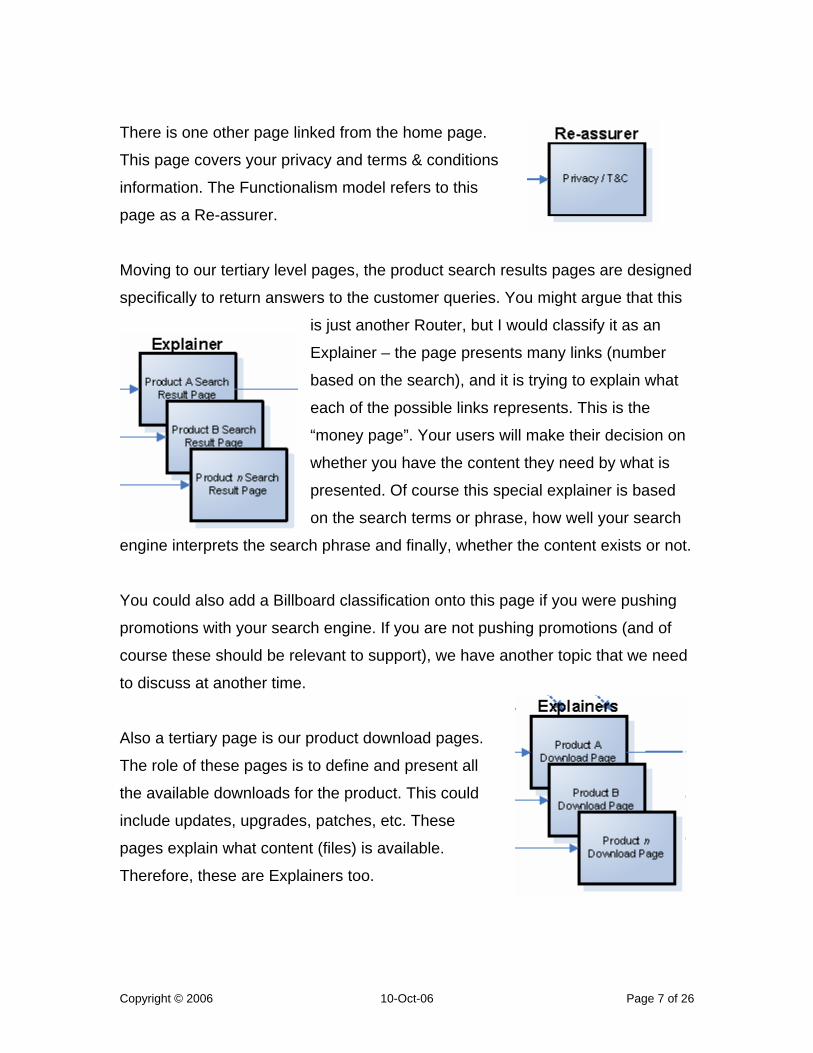
There is one other page linked from the home page.
This page covers your privacy and terms & conditions
information. The Functionalism model refers to this
page as a Re-assurer.
Moving to our tertiary level pages, the product search results pages are designed
specifically to return answers to the customer queries. You might argue that this
is just another Router, but I would classify it as an
Explainer – the page presents many links (number
based on the search), and it is trying to explain what
each of the possible links represents. This is the
“money page”. Your users will make their decision on
whether you have the content they need by what is
presented. Of course this special explainer is based
on the search terms or phrase, how well your search
engine interprets the search phrase and finally, whether the content exists or not.
You could also add a Billboard classification onto this page if you were pushing
promotions with your search engine. If you are not pushing promotions (and of
course these should be relevant to support), we have another topic that we need
to discuss at another time.
Also a tertiary page is our product download pages.
The role of these pages is to define and present all
the available downloads for the product. This could
include updates, upgrades, patches, etc. These
pages explain what content (files) is available.
Therefore, these are Explainers too.
Copyright © 2006 10-Oct-06 Page 7 of 26
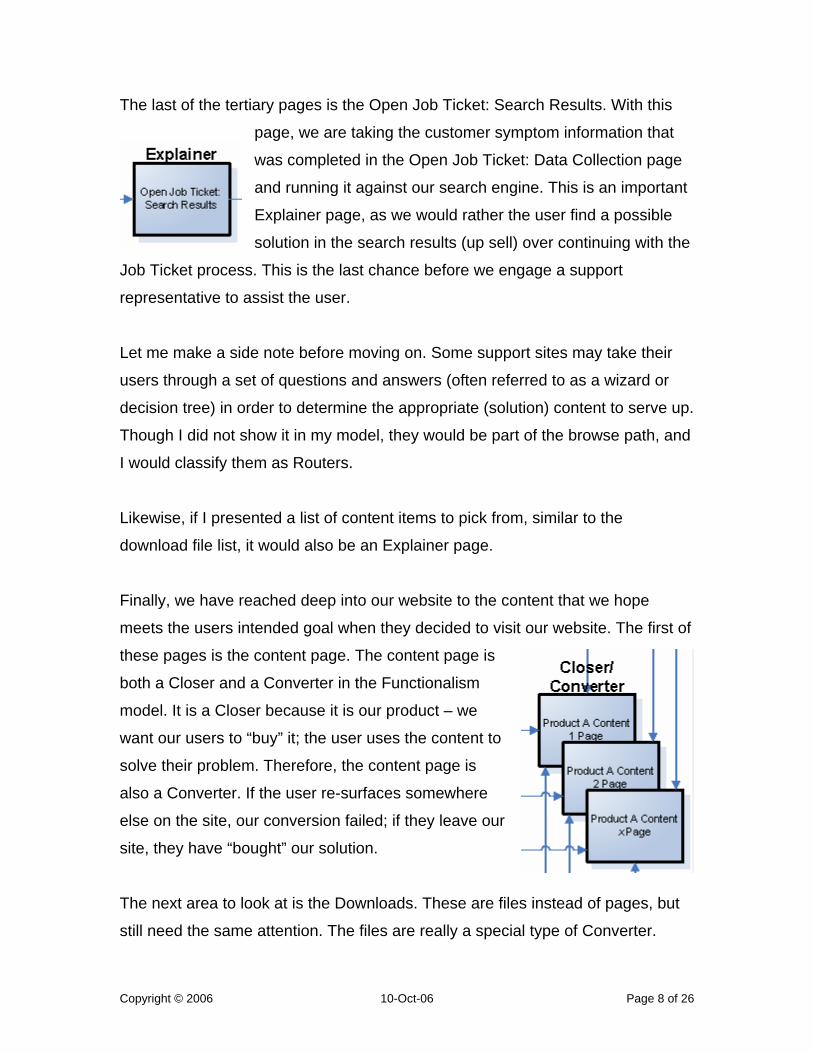
The last of the tertiary pages is the Open Job Ticket: Search Results. With this
page, we are taking the customer symptom information that
was completed in the Open Job Ticket: Data Collection page
and running it against our search engine. This is an important
Explainer page, as we would rather the user find a possible
solution in the search results (up sell) over continuing with the
Job Ticket process. This is the last chance before we engage a support
representative to assist the user.
Let me make a side note before moving on. Some support sites may take their
users through a set of questions and answers (often referred to as a wizard or
decision tree) in order to determine the appropriate (solution) content to serve up.
Though I did not show it in my model, they would be part of the browse path, and
I would classify them as Routers.
Likewise, if I presented a list of content items to pick from, similar to the
download file list, it would also be an Explainer page.
Finally, we have reached deep into our website to the content that we hope
meets the users intended goal when they decided to visit our website. The first of
these pages is the content page. The content page is
both a Closer and a Converter in the Functionalism
model. It is a Closer because it is our product – we
want our users to “buy” it; the user uses the content to
solve their problem. Therefore, the content page is
also a Converter. If the user re-surfaces somewhere
else on the site, our conversion failed; if they leave our
site, they have “bought” our solution.
The next area to look at is the Downloads. These are files instead of pages, but
still need the same attention. The files are really a special type of Converter.
Copyright © 2006 10-Oct-06 Page 8 of 26
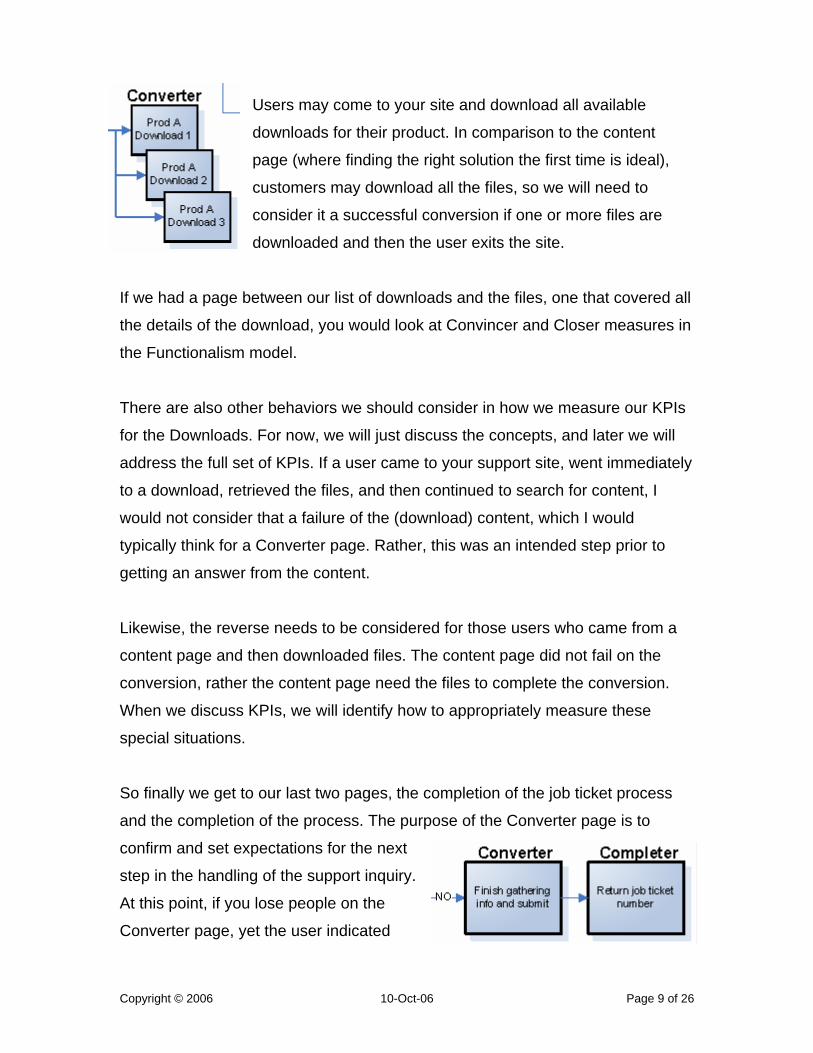
Users may come to your site and download all available
downloads for their product. In comparison to the content
page (where finding the right solution the first time is ideal),
customers may download all the files, so we will need to
consider it a successful conversion if one or more files are
downloaded and then the user exits the site.
If we had a page between our list of downloads and the files, one that covered all
the details of the download, you would look at Convincer and Closer measures in
the Functionalism model.
There are also other behaviors we should consider in how we measure our KPIs
for the Downloads. For now, we will just discuss the concepts, and later we will
address the full set of KPIs. If a user came to your support site, went immediately
to a download, retrieved the files, and then continued to search for content, I
would not consider that a failure of the (download) content, which I would
typically think for a Converter page. Rather, this was an intended step prior to
getting an answer from the content.
Likewise, the reverse needs to be considered for those users who came from a
content page and then downloaded files. The content page did not fail on the
conversion, rather the content page need the files to complete the conversion.
When we discuss KPIs, we will identify how to appropriately measure these
special situations.
So finally we get to our last two pages, the completion of the job ticket process
and the completion of the process. The purpose of the Converter page is to
confirm and set expectations for the next
step in the handling of the support inquiry.
At this point, if you lose people on the
Converter page, yet the user indicated
Copyright © 2006 10-Oct-06 Page 9 of 26

their problem was not solved, you likely have workflow problems – maybe you
gather all the information upfront, and if the user says “no”, complete the
transaction for them.
Finally, when we return a job ticket number, we classify the page as a Completer.
SEMphonic makes a great point about this type of this page – it is often a wasted
page. This would be a good time to push information – to re-engage your user.
Most importantly, this user was not successful in solving their problem this time.
Make sure they still understand that more times than not; the website is a quicker
and more efficient way to solving their problem than to wait for you to contact
them each and every time.
Now we have completed our categorization, and here is what we have done.
Figure 2: Categorized Generic Customer Support Site
Copyright © 2006 10-Oct-06 Page 10 of 26
The next step in our process is to examine the KPIs for each of our categories.
Functionalism: Page Category KPIs
Before I start, I want to add some clarifications. First, many organizations will
have KPIs that reflect the few key indicators to check the health of various parts
of their business. In this context, we are looking at the key indicators for a
particular category. Second, remember that my goals it to focus on content
effectiveness. If I was focusing on the entire support website, I would likely have
some additional KPIs on some of the pages. Finally, you will find that I list KPIs
used to detect potential problems (typically % based KPIs) as well as there are
KPIs that are used to identify specific causes.
With that being said, I will go through each category one at a time. Finally, do not
forget to return to Figure 2 often to remind your self how the categories and
pages fit within the overall site.
Engagers
The only page within the Engager category is the sites home page. The “primary
job is to grab the visitor’s interest and get them to do something (almost
anything!) on the web site.”
• Exit Rate: This number should be low. For those who do exit, check to
see if they are coming from somewhere else within your company’s site –
if so, perhaps better labeling the link(s) is required. If you exit rate is from
those who were in other places on the site, re-surfacing here, group them
by those pages, and do the analysis to see where those pages are failing.
• Exit Propensity: Functionalism uses a weighted exit rate based on depth
through the site. The propensity of exiting a site should be greater at the
higher level pages than the lower. Compare exit propensity across all your
pages – this one is likely going to be higher than most – those that we
expect users to exit from.
Copyright © 2006 10-Oct-06 Page 11 of 26

• % Engagement Links: I would recommend you look at your primary
content sources, group by path taken (product page, downloads, job
ticket, and search). If you exclude re-surfaces, you can get a good idea of
intent: product page = content; downloads = drivers and patches; and job
ticket = I want personal assistance. My forth group was search, which
intent is much more difficult to determine (a good reason to not have it on
the Engager). Either lump search into content or cluster search questions
and answers to categorize (I would opt for the former for now.)
• Subsequent Page Consumption: So if users are not exiting from the
home page, how well are they doing? Are they deeply engaged? If we
look at this by our 3 (or 4) Routers (product pages, downloads, job ticket,
plus possibly search), perhaps we can see which areas are doing the best
or which areas need more attention.
• Subsequent Success: This is what it is all about – did our users make it
from our home page to the content they required to meet their intent or
goal?
• % of Home Page Searches to Convert: If you have opted for the open
search on your home page, this is the number which will tell you if it is
working.
• % Re-surface: How many users are coming back to the home page on
the same session.
Routers
These are the Global Download page, the Open Job Ticket Data Collection page,
and the Product Support pages. These are your most important pages, routing
your users to specific content, either through a link or via a search.
• % of Body Routers: This is fairly simple – what are the percentages of
users who follow the intent of the Router page.
• % Routes by Group: This is looking at all your routes, body, top, and
back.
Copyright © 2006 10-Oct-06 Page 12 of 26
• Exit Rate: Users leaving here have probably lost the scent – they do not
see how to find the content they need or have re-surfaced after being
unsuccessful.
• Exit Propensity: Functionalism uses a weighted exit rate based on depth
through the site. The propensity of exiting a site should be greater at the
higher level pages than the lower. Compare exit propensity across all your
pages of the same category. If one is higher than others from the same
level (secondary, tertiary, and so on), this may be an indication that the
page is not fulfilling its function.
• % Re-surface: The % of visitors who drill-down then come back up to the
router page. Take a careful look at these – these users are not finding
what they are looking for.
• % Re-surface Body Routes: This is the % of Re-surfacers that took body
routes – are they taking the same path twice, and therefore lost? Or, is the
path not intuitive enough where it was missed the first time? It is also
possible this user is solving more than one problem.
• % Re-surface Routes by Group: Look at where users are going – is
there a reason they did not take that path the first time? Did they get lost?
Are they still lost or are they taking sideways navigation paths?
• % Re-surface Exits: This is a sub-set of the % Re-surface who left the
site.
Re-Assurers
Remember the Re-assureres are Privacy and Terms & Conditions page(s).
Currently we are not going to examine these as there is not much correlation to
content.
• Process Re-Join Rate: Watch this rate – if users are not re-joining, you
likely have an issue with your terms of doing business.
• Exit Rate: The opposite of your re-join rate
• Exit Propensity: Functionalism uses a weighted exit rate based on depth
through the site. The propensity of exiting a site should be greater at the
Copyright © 2006 10-Oct-06 Page 13 of 26
higher level pages than the lower. Compare exit propensity across all your
pages of the same category. If one is higher than others from the same
level (secondary, tertiary, and so on), this may be an indication that the
page is not fulfilling its function
• Percent Process Viewers / Percent Re-Assurers: How many users are
coming from a process, for example before completing information for a
job ticket vs. total Re-Assurers.
Explainers
We have three types of Explainers:
1. The search result page – this will need some additional KPIs to evaluate
the search
2. The search results specific to the job ticket flow – for all intents and
purpose, this is the same as the standard search results, but the users’
context is different. Be sure to contrast this in your analysis.
3. The product download page – it is going to explain the files for the specific
product
These are the KPIs for all the Explainers.
• Exit Rate: If this is high, your users are not finding the patch or driver they
were expecting.
• Exit Propensity: Functionalism uses a weighted exit rate based on depth
through the site. The propensity of exiting a site should be greater at the
higher level pages than the lower. Compare exit propensity across all your
pages of the same category. If one is higher than others from the same
level (secondary, tertiary, and so on), this may be an indication that the
page is not fulfilling its function
• % of Body Routers: This is fairly simple – what are the percentages of
users who follow the intent of the page (in our example, download one or
more files).
Copyright © 2006 10-Oct-06 Page 14 of 26
• % Routes by Group: This is looking at all your routes, body, top, and
back. You may see a high level of users navigating sideways or up if they
do not find the file they expect or need assistance after getting the file(s).
Explainers (for search)
For search result pages, add these KPIs to the KPIs already discussed.
• Rate of immediate drives to Convert: This KPI will tell us how many
users are successful in finding their answers through search.
• Re-Surface: o % Re-surface: % of visitors who drill-down then come back up to
the router page. In the support space, this means the user did not
find there answer from the search result – if you are lucky, they will
try again. o % Re-surface Exits: These are users who viewed at least one
search result, came back, and then left the site.
o % Re-surface Routes by Group: Use this to understand where re-
surface users are going.
• % of No Results: This is a great indication of no content and/or poorly
tuned search engine.
• % Refine Search: How often do users have to refine searches?
• Many Search Result, Low % Click-Through: Possible issues include
poor titles and outdated content. (You need to determine what the
threshold is for “many” and click-through rate)
• Search Terms o Search Terms that led to Convert: identify what is working
Convert Search Terms for Two+ Page Views: These are
the search terms where users viewed more than one page to
find an answer, but were still successful. You may be able to
use these to drive results higher in the result set.
o Search Terms and Answer Followed by Re-Surfacer: What
search result did the user follow (and fail with) causing them to re-
Copyright © 2006 10-Oct-06 Page 15 of 26

surface? Either good title, poor content or a better result needs to
surface based on search.
o Search Terms and Answers for Many Search Result, Low % Click-Through: What was being searched on frequently, with high
number of search matches, yet few users clicked-through.
o Failed Searches: Whether no results or if the user refined without
clicking through. Use categories to help tune search engine or fill
content gaps.
Search Terms Prior to Refine Search: This would help
provide specific terms
Search Terms for No Results
Converters
The converters in our example are the files downloaded and the completion of
the job ticket process.
• Exit Rate: This could be a good indication that the user got what they
intended and left.
• % Cancel (for downloads): This would be a last-second exit, after the
link has been clicked.
• % Error
• Re-assurer Exit Rate: How many of your customers decide they need to
understand your terms and conditions and/or privacy policies, and decide
to leave. I higher number here could be a problem.
Closer/Converter
These are the pages our users are looking for – the content pages (knowledge
content, whitepapers, video/animation, and documentation).
• Exit Rate: This could be a good indication that the user got what they
intended and left.
• Exit Propensity: This is the opposite from others, as we are favoring exits
from an Explainer/Converter. Compare exit propensity across all your
Copyright © 2006 10-Oct-06 Page 16 of 26

pages of the same category. If one is lower than others from the same
level (secondary, tertiary, and so on), this may be an indication that the
page is not fulfilling its function.
• % Routes by Group: This is looking at all your routes, body, top, and
back.
• % Routes by Group by Content Type: An extension to the above
measure, but additional grouping by content types (if this exists on your
site, i.e. text and video)
• Time on page for non-exits by Group: You really cannot get time when
user exits (converts), but we can by which categories they re-surface to.
It can be very difficult to correlate time to action, but you can usually interpret
a short time to mean the content did not meet expectation. For a long length
in time, in general terms, it means the content was read and consumed but
did not meet the user’s need. The real challenge is in determining what time
range to use. For example, less than 10 seconds for a short time period
threshold (did not meet expectation) may be good for a document, but it could
take longer than that just to open a page with several graphics or a video file,
so it would not be a good threshold for those content types.
Completer
In our example, the only Completer page is the end of the job ticket process
(includes any expectations and a thank you).
• Exit Rate: The opposite of re-engagement.
• Site Re-Engagement: high site re-engagement could mean many users
are visiting with multiple problems or perhaps they are going to try and
solve on their own, once the ball is rolling on their trouble ticket.
• % of Opportunity: This can vary based on how implemented, but
generally, take the number who completed and divide into the number of
users that were offered a search result based on their problem statement.
The lower the number, the more users you diverted.
Copyright © 2006 10-Oct-06 Page 17 of 26
Additional Site KPIs
This is where I will list some other global KPIs across the site. Most of these
should be familiar.
• Unique visitors
• % Return Visitors: This should be a familiar measure. If we were selling
products, we would want people coming back to buy more products all the
time. In the support area, we want to see this number be great in
comparison to calling or emailing us. But obviously too much required
support could mean loss of future business. With that being said, this
number will vary – you want to see repeat visitors because it shows
confidence in finding support on your site (unless they go directly to
opening a job ticket),
• Site availability %: any downtime can lead to lower confidence. Enough
and your customers will go else where.
Content Effectiveness Measures
Now we understand Functionalism and how it applies to a basic support site. The
next step is to understand our content effectiveness measures – what we want to
learn to improve our content. I will begin with the basics, “What is success?” and
“What is failure?” I have divided this into actually three stages: success, failure,
and abandonment.
1. Failure: Anyone session where a job ticket was opened
2. Success: Any session where the last access was a content item. This is
our Converter (file downloaded) and Explainer/Converter categories. In
our simple example, there were no reasonable next pages. In your site,
consider that after the content, you may offer a promotion or survey. If this
is clicked-through, do not discount the success.
3. Abandonment: This is all other sessions where the user did not exit the
site after accessing a content item or open a job ticket.
I would make one exception to items two and three – if your user completes a
survey at the end of their session, then I would allow it to override the success or
Copyright © 2006 10-Oct-06 Page 18 of 26
abandonment score. I would not override when a job ticket is open, as some
users will categorize successfully opening a job ticket as a successful experience
– I would not. These three combined should equal all exits and therefore your
total sessions.
Moving on, why do people fail on your site or why do they abandon? Remember
in the introduction, I used the U2 concert metaphor to help demonstrate that
content effectiveness is more than content – it is also the navigation to find it and
the systems it resides in. Well, keep this in mind as I have separated content
effectiveness into four areas, with a total of 15 attributes. These are described
below:
1. Content Gap o Does Not Exist: Simply, if the content does not exist, your users will
not find it.
2. Search Failure o Writing Issues: Writing issues refer to things such as mismatch in
terms or written at the wrong level, which is explained and covered
in more detail in the next section. The relevancy for this category is
that if the content title and/or description is not written appropriately,
the user may not find it within their searching and/or browsing.
o Search Failure: The content exists, but it was never presented.
Typically taxonomy, ontology, or synonym.
o Content Out-of-Date: This would be apparent relevant content, but
it is out-dated, forcing the user to sort through. If the user clicks-
through, this would manifest itself as inaccurate, incomplete and/or
wrong content.
o User Search Terms: The terms used by the users are not
significant to return appropriate results. You could also have a
problem that appears search term based, but is more search
engine caused – the classic example the use of keywords in a
natural language search engine.
Copyright © 2006 10-Oct-06 Page 19 of 26
3. Content Usability o Customer Intent: What the user wants and what is available do not
align. When this occurs, you will never be able to meet the user’s
intended goal. For example, if the user came to your site to figure
out how to perform a function in your product, yet your product
does not support the function – your content would never meet their
expectation. (Likewise though, if there was a work-around, perhaps
you should have that content available.)
o Writing Issues
Mismatch of Terms: A mismatch in terms would be related to
taxonomy and possibly language. A good example is the
terms of the health care industry. Doctors use terms like
pulmonary and cardiac, while we use terms such as lungs
and heart, respectively.
Wrong Level: related to mismatch terms, if the user reading
the content does not have the education to understand it,
then we have failed to have effective content. This is very
similar to mismatch of terms and is analyzed using the same
methods.
Grammar: Poor grammar can be a big issue when
describing a process or series of steps, particularly for non-
native speaking users.
o Inaccurate, Incomplete, and/or Wrong: Of course your user will fail
if your content is inaccurate, incomplete or wrong.
o Content Length: Do I need to read “War and Peace” or can I read
three or four paragraphs? Do not lose your visitor because the
content is not concise.
o Wrong Medium: I will demonstrate this concept through an
example. Perhaps I learn best with a short demonstration that is
visual, yet all you offer is a three page outline with the steps to
solve a problem – the information could be accurate, but it may be
Copyright © 2006 10-Oct-06 Page 20 of 26

too difficult for me to successfully execute the steps just by reading
the text.
4. System and Design o Site Design:
Templates: This is all about presentation. Issues that occur
include inability to see the link on a page to the font being to
small to having to scroll too much.
Navigation: Similar to search, if the navigation is not intuitive
and easy to “follow the scent”, users will never find that
content you worked so hard to develop.
o Technology: This can manifest itself in various ways. For example,
if you require me to download a 20 MB file, and I only have a dial-
up connection, I am going to fail. With the higher adoption of video
and Flash, as well as sites that only work with Internet Explorer, if
you are not careful, you could exclude many of your customers.
o System Failure: Just as it says – if the system fails, your customers
are not reading your content.
Putting It All Together
With our categories, and our KPIs, I have put this in a table that defines their
relationships. Please note that this table will not help with file download related
issues, though you can use it as an aid in looking at your Product Download
page (Convincer).
Content Effectiveness KPIs Comments
Failure % (Completer Exit Rate +
Completer Site Re-
Engagement) / Total
Sessions
Any open job ticket is a failure.
You could count a re-
engagement after opening a
job ticket as a second session,
but it may be more effort than it
is worth.
Copyright © 2006 10-Oct-06 Page 21 of 26

Success % (Closer/Converter Exit Rate
+ Download Converter Exit
Rate) / Total Sessions
Remember, if you have a
survey and it indicates failure, it
should supersede this.
Abandon % (Engagers Exit Rate +
Routers Exit Rate + Re-
Assurers Exit Rate +
Explainers Exit Rate + Job
Ticket Converter Exit Rate)
/ Total Sessions
All other exit points. You need
to balance the size of this
group with failures to help
determine where to put your
efforts to increase your success
rate.
Content Gap Examine the KPIs on the
Search Explainer page:
• Exit Rate
• Exit Propensity
• % No Results
• % Refine Search
• Many Search Results,
Low % Click-Through
Search Failure Examine the KPIs on the
Search Explainer page:
• Exit Rate
• Exit Propensity
• % No Results
• % Refine Search
• Many Search Results,
Low % Click-Through
The KPI measures for content
Gap and Search Failure are
much the same. In both cases,
users will not have a high-rate
of click through and there will
be a greater tendency to refine
searches. The difference
between the two is that for
search failure, users may still
find needed content. And of
course if the content does not
exist (a gap), they never will.
See figures 3 and 4 below –
you will see that by using
multiple KPIs, you can identify
different issues.
Content Usability Examine the KPIs on the
Search Explainer page:
• % Re-Surface
• % Re-Surface Exits
Look at the KPIs on the
High re-surface rate will usually
mean the topic looked
promising, but the content
missed its mark. Very low time
on Explainer/Converter pages
Copyright © 2006 10-Oct-06 Page 22 of 26

Closer/Converter page:
• % Routes by Group
• Time on Page for Non-
Exit by group
indicates the user is able to
make a quick judgment that the
content was not what was
expected.
System and
Usability Issues • Examine % Re-Surface
KPIs from Engagers and
Routers
• Sudden high failure rate
in finding content across
many or all products
• Error logs
This is a balance between the
re-surface KPIs and other
system monitoring tools.
KPI Examples
Figure 3: Search Explainer KPIs - 1
Figure 4: Search Explainer KPIs - 2
Copyright © 2006 10-Oct-06 Page 23 of 26
Take a look at figures 3 and 4 – both figures have the same Exit Rate and the
same Refine Search results. What do you think is causing the problems? In
comparing Click-Through Rate and No Results, figure 3 is likely more of an
indication of some content gaps, while figure 4 is an indication of search engine
problem. Of course this did not tell you what content is missing or how search is
failing – this only helps to identify areas of trouble.
Many of the content effectiveness measures will take additional analysis, which
means time. So our next steps are to determine where we might focus, and how
we can get to the specific problem area. First consider whether you want to focus
on Failure and Abandon groups together or separate. For those who abandoned,
where did they go? Did they come back later? Did they find the answer from a
third-party? Did the experience impact loyalty to your product and brand?
Consider whether this is a big enough issue compared to failures that you want
to focus exclusively around these users.
For the Failures, how much of the group tried to find an answer? Those who did
may offer you an easy view into your content gaps. If you have a high number of
viewers who did not try and help themselves before opening a job ticket, could
indicate a fundamental issue with your site design and/or your business strategy
around opening job tickets.
Though you may leave some opportunity on the table, I will consider the both
groups in the discussion – through content effectiveness improvements, both
groups should see improvement. At this point, I want to clarify one other
assumption – I am assuming you have a reasonable content creation process. If
you have a high rate of content quality issues or even content gaps, you may
want to look at that part of your business further. That discussion is outside the
scope of this document.
Copyright © 2006 10-Oct-06 Page 24 of 26

Your users’ ability to your existing content should be your top priority. The reason
is rather simple – putting forth effort to create more content that cannot be found
is more expensive than not creating content (which will also not be found). So
therefore, I would recommend, always focus on the ability to find content as your
top priority.
In considering whether to make new content or fix existing content, I believe it is
a toss up between the two. The good news is, if you find you have a lot of
problems with existing content, by correcting your creation process you can
reduce the possibility of it continuing to occur, and therefore it does not have to
be an ongoing problem to fix.
Missing Components
There is much more I could have covered – this is a brief description of the topics
to further expand on at a later date.
• Customer survey: As indicated with Success and Abandon, I would
consider a survey more relevant than what the KPIs measured. You must
also take into consideration when looking at a survey after content viewed
that the content is no longer the last page. Oh, and this would be a
Completer.
• Wizard or Decision Trees: This is an expanded browsing path, narrowing
down possible content solutions as the customer answers questions. Exit
from these pages indicate one of the following: too many clicks, questions
unclear, or a content gap. If you use these, classify as Routers.
• Internal use: This can be very helpful to identify problems with existing
content and possibly searching. If you have customers calling you on
topics after reading the content, then the content is not meeting your
users’ needs. If the agents use this content without a problem, then you
likely have an issue with it being written to the wrong level or possibly it is
an incomplete solution (assumes too much information)
Copyright © 2006 10-Oct-06 Page 25 of 26
• Exit Rate by Page Category: This is another way to express Exit
Propensity. Which pages are having the most user exits? Use this to drive
attention priority to specific category pages.
Conclusion There is much more to content effectiveness and functionalism than can possibly
be covered in a whitepaper. This should serve as a guide to getting your
organization thinking about how to measure your website to drive content
improvements. Finally, I will borrow some guidance I heard from Avinash
Kaushik, Senior Manger, Web Research and Analytics, Intuit, use the 10/90
Rule: for every $10 you spend in a web analytics solution, you need to spend $90
in brains [people]. You can go to:
http://video.google.com/videoplay?docid=1839220297665871408&q=genre%3Ae
ducational, and play at the 36:53 mark to hear Avinash explain it, or read his blog
entry, The 10 / 90 Rule for Magnificent Web Analytics Success.
Copyright © 2006 10-Oct-06 Page 26 of 26