contents€¦ · contents five year selected financial data ... 2000 and 1999 were positively...
TRANSCRIPT


Contents
Five Year Selected Financial Data
Letter to Stockholders
Stock and Financial Data
Consolidated Balance Sheets
Consolidated Statements of Income
Consolidated Statements of Changes in Stockholders’ Equity
Consolidated Statements of Cash Flows
Notes to Consolidated Financial Statements
Management’s Discussion and Analysis
Report of Independent Auditors and Corporate Information
The Family of Businesses
Company Profile
Commendation for Assistance: 9/11/2001 Emergency
1
2
4
5
6
7
8
9
15
17
19
20
21

Five Year Selected Financial Data
1
Percent2001 Change 2000 1999 1998 1997
Net Sales1 $379,407,075 +8.7 $348,967,486 $328,987,099 $301,831,128 $286,638,316
Income Before Income Taxes 17,142,193 -64.0 47,565,673 40,269,981 33,590,229 35,723,277
Net Income2 8,787,193 -68.8 28,135,673 23,927,981 19,474,229 21,350,277
Total Assets 232,780,365 +4.5 222,721,466 215,990,877 198,982,290 188,974,415
Return on Assets (percent) 3.8 -70.0 12.6 11.1 9.8 11.3
Noncurrent Liabilities 40,520,140 +40.0 28,946,453 27,525,033 25,246,269 24,577,547
Stockholders’ Equity 159,898,075 +0.0 159,912,465 150,039,989 142,934,735 139,925,387
Return on Average Equity (percent) 5.4 -71.0 18.6 16.5 13.5 16.0
Per Share of Common Stock:
Basic Net Income $0.91 -68.1 $2.85 $2.29 $1.77 $1.91
Diluted Net Income 0.91 -68.1 2.85 2.29 1.76 1.91
Stockholders’ Equity3 16.51 +1.8 16.22 14.37 12.97 12.55
Cash Dividends Declared .64 +6.7 .60 .57 .56 .54
Basic Weighted Average Shares Outstanding 9,684,510 –1.8 9,859,610 10,444,076 11,023,934 11,153,091
Diluted Weighted Average Shares Outstanding 9,708,299 –1.7 9,873,680 10,445,836 11,041,819 11,175,232
1 Net sales for the years 2001, 2000 and 1999 were positively impacted by the acquisition of ACS/SIMCO in the third quarter of 1999. In addition, net sales for 2001were also positively impacted by the acquisition of the North American Industrial Products and Kent Automotive Divisions in March 2001.
2 In 2001, the Company recorded non-recurring charges for the write-off of capitalized software and implementation costs related to an enterprise information system project which the Company decided to discontinue as well as a promotional program related to the acquisition of Premier operations. These charges reduced net income by $5,138,000 and $2,021,000, respectively. During 2000, the Company recorded a gain of $2,136,000 as a result of the sale of the Company’s interest in a real estate investment. In 1999 and 1998, the Company recorded special charges for compensation arrangements related to management personnelreductions and retirements which reduced net income by $1,760,000 and $1,520,000, respectively. Additionally, in 1999, a gain of $554,000 was recorded on the sale of marketable securities.
3 These per share amounts were computed using basic weighted average shares outstanding for all periods presented.
Lawson Products, Inc. and Subsidiaries

To Our StockholdersLast year was the most significant year for ourCompany in many years. It was a period in which we implemented a new long-term strategy to ensuregrowth for years to come.
Sales increased 9% to $379.4 million, a new record. However, net profits were down as we continued with our plan of reinvestment to enhancethe long-term performance of the "Family ofBusinesses." We also recognized a $5.1 million non-cash charge for a discontinued software project.At the same time, we clarified the direction of oursales and distribution efforts, successfully managedour capital resources and positioned the Company to gain increased market share, and to do wellunder difficult economic conditions.
Much of 2001 was spent on the integration of experienced field and inside sales people who came to us through the March, 2001 acquisition of certainassets of one of Lawson’s primary competitors. Over320 experienced field sales agents increased ourfield sales force to approximately 2,000 people. And, our new 70-person inside sales and customerrelationship group brought a new dimension to theways in which we go to market with our productsand services.
The sales generated as a result of the acquisitionhave already surpassed expectations. Yet, we believewe have just begun to benefit from its potential. Our inside sales force will help us penetrate geographic areas which our field sales agents arenot yet servicing. This will facilitate the expansion of each of our businesses into those areas andenhance our customer service capabilities.
The fact that we have successfully integrated theCompany’s largest acquisition, only begins to tell the story of reinvigorated growth in our "Family ofBusinesses." In the past year, we:
• Added 10,000 square feet of space to our Dallas facility.
• Commenced construction of an additional 10,000square feet at our Fairfield, New Jersey facility.
• Planned a 25,000 square foot expansion of ourMississauga, Ontario facility.
2
• Leased 25,000 square feet of office space inCleveland for occupancy April 1, 2002.
• Began a search for an additional 50,000 squarefoot facility in Reno.
• Leased 114,000 square feet of additional space in Des Plaines near our corporate headquarters for occupancy April 1, 2002.
These new or expanded facilities will provide the physical space we need to support the needs of our current customers, and allow us to grow. The new space near our corporate headquarters inDes Plaines, Illinois will provide additional capacityfor the distribution activities of Lawson and ACS. It will also provide a Midwest distribution point for products of Kent Automotive and Cronatron, and allow us to consolidate slower moving itemsinventoried by our businesses as part of a strategy to increase inventory turns. In Reno, we are planning an expansion to serve as a blending facilityfor Drummond, and as a distribution center forproducts sold by Drummond, Kent, Cronatron andACS. In Cleveland, we are relocating and planningfor the expansion of our newly acquired inside sales force.
We have a growing operation in Canada.Construction is scheduled to start this Spring at our Mississauga facility to meet the distributionrequirements for products of Lawson, Cronatron,ACS and Kent in the Canadian market. Our plans also allow for the distribution of Drummond products in the Canadian market, which we intend to serve in the near future.
Our business is also growing in Mexico and theUnited Kingdom. In Mexico, we completed a reorganization of our operation, enhanced our talent base, and realized increased sales. In theUnited Kingdom, we have entered into supply contracts which are expected to enhance our growth over the near term. Toward the end of 2001,we negotiated the acquisition of the existing productline and customer base of a small distribution business in the United Kingdom. We completed the acquisition of certain assets of BirminghamProducts, Limited during March, 2002.
3
Continued profitable growth will depend primarilyupon increasing sales. We recognize that our salesforces are among the most professional and bestequipped in our industry, and the single greatestasset of each of our businesses. For this reason, the Company continued to invest heavily in its sales forces during 2001.
We have expanded our National Accounts Group.Now numbering 19 seasoned professionals, thisgroup is working to secure multi-location and multi-national customers which, in the past, weregenerally inaccessible to us. Product education was another focus of our investments during 2001.Additional education programs were necessitated by rapid growth in product lines and further specialization at each of our businesses.
Incentive-based programs for field agents now encourage and facilitate ownership of computersand software solutions. These programs aredesigned to computerize and simplify the lives ofevery sales agent, allowing each person to be moreproductive. We also reorganized the product development, marketing, and revenue managementgroups to make each of them more efficient andmore accountable.
Despite all of these costs, our balance sheet remains healthy. In the twelve months since closingthe acquisition, we have repaid approximately $16 million, or two-thirds, of the debt we incurredto finance the acquisition. Additionally, we increasedthe dividend payable to our stockholders and repurchased shares of Lawson stock from time totime. Profitable growth and sound financial practiceswill help to ensure the future for our colleagues,their families, our customers, our vendors, and forour stockholders.
Investment in our businesses and our people werethe main themes of the Lawson Family of Businessesin 2001. No event epitomized that spirit more thanthe response of our colleagues to the events ofSeptember 11. A generous spirit has been on displaythroughout our Family of Businesses, includingdonations of blood, money, time, effort and product.
I am particularly proud of the way the entire Lawson Family rose up as one to support our national community in its time of need. Please seethe inside back cover of this Report reflecting anexample of the letters of appreciation received as a result of this effort.
For 2002, our focus is on improving the efficiencyand productivity of our sales forces and distributiongroups. We plan to continue our current programsof providing tools to assist in the growth of all of those in our sales forces - from vice presidents to the newest field agents and inside sales representatives. Our distribution and operationsgroups will continue to refine their activities toachieve increased performance goals.
Economic downturns offer strong, nimble companiesthe opportunity to gain market share. Entering our50th year, we are not only weathering a tough economy, but also improving our business and reinforcing our Company’s ability to face up to and conquer new challenges.
We could not have succeeded without the dedicated efforts of each of our colleagues within the "Family of Businesses." As we embark upon ournext 50 years, it will be this level of dedication andcommitment by our people which will enable us tocontinue achieving even greater successes.
Respectfully,
Robert J. WashlowChairman of the BoardChief Executive Officer
April, 2002

Stock and Financial Data
4
MARKET PRICES FOR COMMON STOCK
The Company’s Common Stock is traded in the over-the-counter market under the NASDAQ symbol of “LAWS.” The approximate
number of stockholders of record at December 31, 2001 was 908. The following table sets forth the High and Low closing sale
prices as reported on the NASDAQ National Market System during the last two years.
2001 2000
High Low High Low
First Quarter $28.69 $23.38 $24.50 $21.50
Second Quarter 29.30 24.64 24.88 22.00
Third Quarter 29.47 22.79 25.88 23.75
Fourth Quarter 27.80 22.55 27.75 22.88
CASH DIVIDENDS PAID PER SHARE
2001 2000
First Quarter $.16 $.15
Second Quarter .16 .15
Third Quarter .16 .15
Fourth Quarter .16 .15
$.64 $.60
CLASSES OF SIMILAR PRODUCTS
The Company’s products may be grouped into the following classes of similar products, each of which accounted for the indicated
percentages of consolidated revenues:
Percent of Consolidated Revenues
2001 2000 1999
Fasteners, fittings and related parts 45% 47% 46%
Industrial supplies 47 49 50
Automotive and equipment maintenance parts 8 4 4
100% 100% 100%
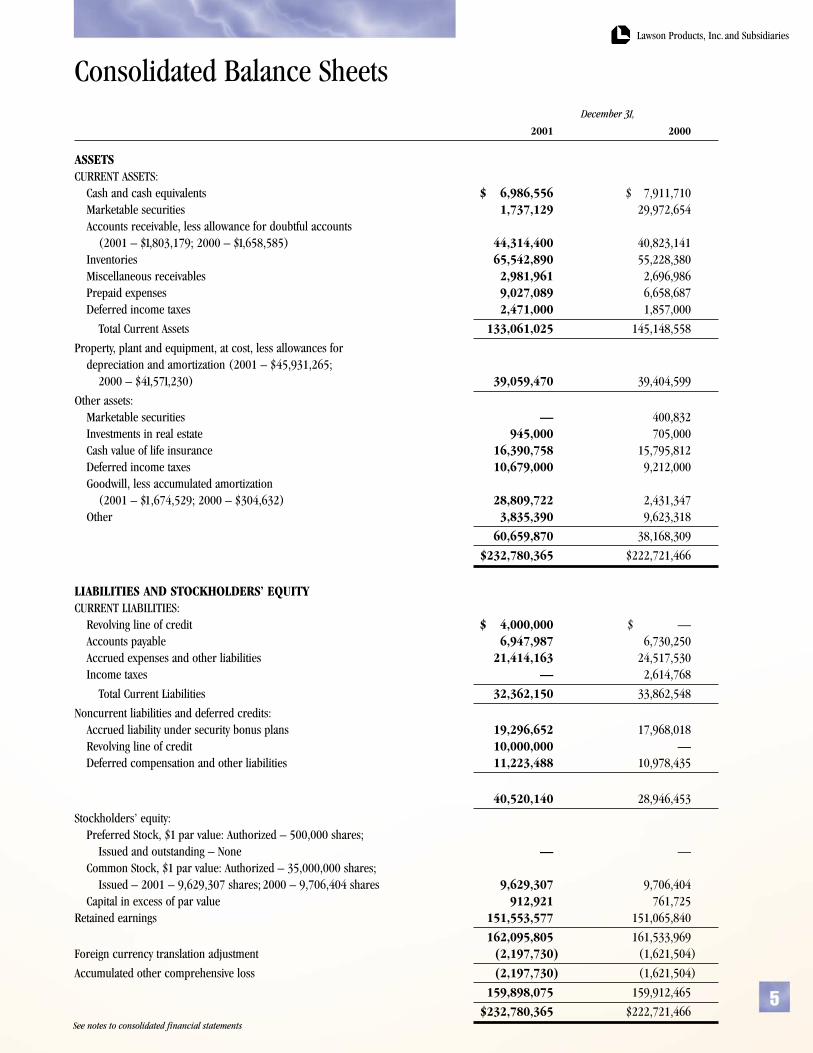
Consolidated Balance Sheets
5
December 31,
2001 2000
ASSETSCURRENT ASSETS:
Cash and cash equivalents $ 6,986,556 $ 7,911,710Marketable securities 1,737,129 29,972,654Accounts receivable, less allowance for doubtful accounts
(2001 – $1,803,179; 2000 – $1,658,585) 44,314,400 40,823,141Inventories 65,542,890 55,228,380Miscellaneous receivables 2,981,961 2,696,986Prepaid expenses 9,027,089 6,658,687Deferred income taxes 2,471,000 1,857,000
Total Current Assets 133,061,025 145,148,558
Property, plant and equipment, at cost, less allowances for depreciation and amortization (2001 – $45,931,265;
2000 – $41,571,230) 39,059,470 39,404,599
Other assets:Marketable securities — 400,832Investments in real estate 945,000 705,000Cash value of life insurance 16,390,758 15,795,812Deferred income taxes 10,679,000 9,212,000Goodwill, less accumulated amortization
(2001 – $1,674,529; 2000 – $304,632) 28,809,722 2,431,347Other 3,835,390 9,623,318
60,659,870 38,168,309
$232,780,365 $222,721,466
LIABILITIES AND STOCKHOLDERS’ EQUITYCURRENT LIABILITIES:
Revolving line of credit $ 4,000,000 $ —Accounts payable 6,947,987 6,730,250Accrued expenses and other liabilities 21,414,163 24,517,530Income taxes — 2,614,768
Total Current Liabilities 32,362,150 33,862,548
Noncurrent liabilities and deferred credits:Accrued liability under security bonus plans 19,296,652 17,968,018Revolving line of credit 10,000,000 —Deferred compensation and other liabilities 11,223,488 10,978,435
40,520,140 28,946,453
Stockholders’ equity:Preferred Stock, $1 par value: Authorized – 500,000 shares;
Issued and outstanding – None — —Common Stock, $1 par value: Authorized – 35,000,000 shares;
Issued – 2001 – 9,629,307 shares; 2000 – 9,706,404 shares 9,629,307 9,706,404Capital in excess of par value 912,921 761,725
Retained earnings 151,553,577 151,065,840
162,095,805 161,533,969Foreign currency translation adjustment (2,197,730) (1,621,504)
Accumulated other comprehensive loss (2,197,730) (1,621,504)
159,898,075 159,912,465
$232,780,365 $222,721,466
Lawson Products, Inc. and Subsidiaries
See notes to consolidated financial statements

Consolidated Statements of IncomeYear ended December 31,
2001 2000 1999
Net sales $379,407,075 $348,967,486 $328,987,099
Cost of goods sold 131,064,519 117,256,150 109,370,225
Gross profit 248,342,556 231,711,336 219,616,874
Selling, general and administrative expenses 221,712,271 188,468,661 178,210,549
Special charges 8,527,101 — 2,932,365
Provision for doubtful accounts 1,901,379 1,419,120 1,065,811
Operating Income 16,201,805 41,823,555 37,408,149
Interest and dividend income 654,257 1,072,730 1,312,312
Interest expense (705,756) (7,959) (7,351)
Gain from sale of partnership interest — 3,502,336 —
Other income – net 991,887 1,175,011 1,556,871
940,388 5,742,118 2,861,832
Income Before Income Taxes 17,142,193 47,565,673 40,269,981
Federal and state income taxes (benefit):
Current 10,126,000 20,012,000 18,275,000
Deferred (1,771,000) (582,000) (1,933,000)
8,355,000 19,430,000 16,342,000
Net Income $ 8,787,193 $ 28,135,673 $ 23,927,981
Net Income Per Share of Common Stock:
Basic $0.91 $2.85 $2.29
Diluted $0.91 $2.85 $2.29
See notes to consolidated financial statements
6

Consolidated Statements of Changes in Stockholders’ Equity
7
AccumulatedCommon Capital Other
Stock, in excess of Retained Comprehensive Comprehensive$1 par value par value Earnings Loss Income
Balance at January 1, 1999 $10,663,822 $749,320 $132,208,664 $ (687,071) $ —
Net income 23,927,981 23,927,981
Other comprehensive income, net of tax:Unrealized loss on marketable securities (696,000) (696,000)
Adjustment for foreign currency translation 301,567 301,567
Other comprehensive loss for the year (394,433)
Comprehensive income for the year $23,533,548
Cash dividends declared (5,908,594)
Purchase and retirement of common stock (459,900) (32,316) (10,027,484)
Balance at December 31, 1999 10,203,922 717,004 140,200,567 (1,081,504)
Net income 28,135,673 $28,135,673
Other comprehensive income, net of tax:Unrealized gain on marketable securities 28,000 28,000
Adjustment for foreigncurrency translation (568,000) (568,000)
Other comprehensive loss for the year (540,000)
Comprehensive income for the year $27,595,673
Cash dividends declared (5,875,305)
Stock issued under employee stock plans 3,750 80,625
Purchase and retirement of common stock (501,268) (35,904) (11,395,095)
Balance at December 31, 2000 9,706,404 761,725 151,065,840 (1,621,504)
Net income 8,787,193 $8,787,193
Other comprehensive income, net of tax:Adjustment for foreign
currency translation (576,226) (576,226)
Other comprehensive loss for the year (576,226)
Comprehensive income for the year $8,210,967
Cash dividends declared (6,190,716)
Stock issued under employee stock plans 7,400 159,100
Purchase and retirement of common stock (84,497) (7,904) (2,108,740)
Balance at December 31, 2001 $ 9,629,307 $912,921 $151,553,577 $(2,197,730)
See notes to consolidated financial statements
Lawson Products, Inc. and Subsidiaries

Consolidated Statements of Cash FlowsYear ended December 31,
2001 2000 1999
Operating activitiesNet income $ 8,787,193 $ 28,135,673 $ 23,927,981Adjustments to reconcile net income to net cash
provided by operating activities:Depreciation 5,740,752 5,986,466 5,977,205Amortization 2,405,261 677,197 550,254Provision for allowance for doubtful accounts 1,901,379 1,419,120 1,065,811Deferred income taxes (1,771,000) (582,000) (1,933,000)Deferred compensation and security bonus plans 3,399,366 3,922,781 4,651,635Payments under deferred compensation
and security bonus plans (2,395,036) (2,420,361) (2,263,293)Losses (Gains) from sale of marketable securities (13,276) 803 (902,960)Income from investments in real estate (480,000) (695,000) (544,000)Gain from sale of investment in real estate — (3,502,336) —Changes in operating assets and liabilities
(Exclusive of effect of acquisition):Accounts receivable (5,392,638) (1,134,140) (4,276,788)Inventories (3,093,011) 256,152 (2,886,074)Prepaid expenses and other assets 3,258,709 (3,730,055) (5,757,891)Accounts payable and accrued expenses (2,970,360) (2,770,387) 4,290,592Income taxes payable (2,614,768) (1,717,167) 1,049,135
Other (315,698) (961,691) 368,539
Net Cash Provided by Operating Activities 6,446,873 22,885,055 23,317,146
Investing activitiesAdditions to property, plant and equipment (5,228,929) (3,392,458) (6,462,348)Purchases of marketable securities (13,267,926) (75,344,146) (122,774,913)Proceeds from sale of marketable securities 41,916,388 61,987,598 130,451,955Proceeds from sale of investment in real estate — 7,400,000 —Acquisition of businesses, net of cash acquired (36,890,933) — (10,519,909)Other 240,000 200,000 490,000
Net Cash Used in Investing Activities (13,231,400) (9,149,006) (8,815,215)
Financing ActivitiesProceeds from revolving line of credit 71,800,000 — —Payments on revolving line of credit (57,800,000) — —Purchases of common stock (2,201,140) (11,932,267) (10,519,700)Proceeds from exercise of stock options 166,500 84,375 —Dividends paid (6,105,987) (5,951,058) (5,879,340)
Net Cash Provided by (Used in) Financing Activities 5,859,373 (17,798,950) (16,399,040)
Decrease in Cash and Cash Equivalents (925,154) (4,062,901) (1,897,109)Cash and Cash Equivalents at Beginning of Year 7,911,710 11,974,611 13,871,720
Cash and Cash Equivalents at End of Year $ 6,986,556 $ 7,911,710 $ 11,974,611
See notes to consolidated financial statements
8

Notes to Consolidated Financial Statements
9
NOTE A – DESCRIPTION OF BUSINESSLawson Products, Inc. and subsidiaries principally are distributors of expendable parts and supplies for maintenance,repair and operation of equipment.
NOTE B – SUMMARY OF MAJOR ACCOUNTING POLICIESPrinciples of Consolidation: The accompanying consolidated financial statements include the accounts of the Company and its subsidiaries, each of which is wholly owned. All inter-company accounts and transactions have been eliminated in consolidation.
Revenue Recognition: Sales and associated cost of goods sold are recognized when products are shipped and title passes to customers.
Shipping and Handling Fees and Costs: In the fourth quarterof 2000, the Company adopted Emerging Issues Task Force(EITF) No. 00-10 “Accounting for Shipping and Handling Fees and Costs.” EITF No. 00-10 requires companies to reflect all amounts billed to customers in sales transactions as part of net sales. Costs related to shipping and handling fees are included on the Income Statement in the captionSelling, general and administrative expenses and totaled$11,460,000, $10,521,000, and $10,017,000 in 2001, 2000 and 1999, respectively.
Use of Estimates: The preparation of financial statements in conformity with generally accepted accounting principlesrequires management to make estimates and assumptions that affect the amounts reported in the financial statements and accompanying notes. Actual results could differ from these estimates.
Investment in Real Estate: The Company’s investment in realestate representing a limited partnership interest is carried onthe basis of the equity method.
Marketable Securities: Marketable equity and debt securities are classified as available-for-sale and are carried at fair value,with the unrealized gains and losses, net of tax, recorded in stockholders’ equity. Realized gains and losses, declines invalue judged to be other-than-temporary, and interest and dividends are included in investment income. The cost of securities sold is based on the specific identification method.
Inventories: Inventories (principally finished goods) are stated at the lower of cost (first-in, first-out method) or market.
Property, Plant and Equipment: Provisions for depreciation and amortization are computed by the straight-line method for buildings using useful lives of 20 to 30 years and by the double declining balance method for machinery and equipment, furniture and fixtures and vehicles using usefullives of 3 to 10 years.
Investment Tax Credits: Investment tax credits on assetsleased to others (see Investment in Real Estate) are deferredand amortized over the useful life of the related asset.
Cash Equivalents: The Company considers all highly liquid investments with a maturity of three months or less when purchased to be cash equivalents.
Stock Options: Stock options are accounted for under Accounting Principles Board (APB) Opinion No. 25,“Accounting For Stock Issued to Employees.” Under APB 25,no compensation expense is recognized because the exerciseprice of the stock options granted equals the market price ofthe underlying stock at the date of grant.
Goodwill: Goodwill represents the cost of business acquisitions in excess of the fair value of identifiable net tangible assets acquired. Goodwill is amortized over 20 years using the straight-line method and the carrying value is reviewed for impairment annually. If this review indicatesthat goodwill is not expected to be recoverable based on the undiscounted cash flows of the entity acquired over the remaining amortization period, the Company’s carrying value of the goodwill will be reduced. (See New Accounting Standards)
Foreign Currency Translation: The financial statements of foreign entities have been translated in accordance withStatement of Financial Accounting Standards No. 52 and,accordingly, unrealized foreign currency translation adjustments are reflected as a component of stockholders’equity. Realized foreign currency transaction gains and losseswere not significant for the years ended December 31, 2001,2000 and 1999.
Income per share: Basic EPS is computed by dividing netincome by the weighted average number of common sharesoutstanding during the period. Diluted EPS reflects the potential dilution from the exercise or conversion of securities into common stock, such as stock options.
Reclassifications: Certain amounts have been reclassified inthe 2000 and 1999 financial statements to conform with the2001 presentation.
New Accounting Standards: In June 1998, the FinancialAccounting Standards Board (FASB) issued Statement No. 133,“Accounting for Derivative Instruments and Hedging Activities.”The Company adopted the new Statement effective January 1,2001. Statement No. 133 required the Company to recognizeall derivatives on the consolidated balance sheet at fair value.The adoption of Statement No. 133 did not have a significanteffect on its results of operations or financial position.
In June 2001, the FASB issued Statement No. 141, “BusinessCombinations” and Statement No. 142 “Goodwill and OtherIntangibles,” effective for fiscal years beginning after December15, 2001. Under the new rules, goodwill and intangible assetsdeemed to have indefinite lives will no longer be amortized butsubject to annual impairment tests. The Company will apply the new rules of accounting for goodwill and other intangibleassets beginning in the first quarter of 2002. Application of thenonamortization provisions of the statement is expected toresult in an increase in operating income of approximately$1.3 million for 2002. During 2002, the Company will perform the first of the required impairment tests of goodwilland indefinite lived intangible assets as of January 1, 2002. The Company has not determined what the effect of these testswill be on earnings and the financial position of the Company.
Lawson Products, Inc. and Subsidiaries

NOTE C – BUSINESS COMBINATIONOn March 30, 2001, the Company purchased certain assets of Premier Farnell’s Cleveland based North American Industrial Products (IPD) and Kent Automotive (Kent)Divisions for approximately $28.4 million plus approximately$7.2 million for related inventories. This all-cash transactionwas accounted for as a purchase; accordingly, the accountsand transactions of the acquired business have been includedin the consolidated financial statements since the date ofacquisition. Under the agreement, the Company acquired thefield sales, inside sales and customer service professionals, the customer accounts, certain administrative executives, and various intellectual properties, including trademarks and trade names of the divisions in certain territories.
The identifiable intangibles acquired in the acquisitions were recorded at an independent appraised value of approximately $1.4 million, which is recorded as a component of otherassets. These intangibles are being amortized over a weightedaverage estimated life of 15.1 years. The remaining excess of purchase price over net assets acquired of approximately$27 million represents goodwill. The assets acquired wererecorded at estimated fair values as determined by theCompany’s management based on information currently available. Accordingly, the allocation of the purchase price is subject to revision. As the Company only acquired inventoryand sales professionals of the IPD and Kent businesses, theCompany is unable to provide any meaningful pro forma information of prior period results. Net sales attributed to theacquired division represented approximately $41,252,000 for 2001.
On July 1, 1999, the Company purchased substantially all of the assets and liabilities of SunSource Inventory ManagementCompany, Inc. (SunSource) and Hillman Industrial Division(Hillman), at a cost of approximately $10.5 million with certain contingent purchase price adjustment features basedon future operating results. This all-cash transaction wasaccounted for as a purchase; accordingly, the accounts andtransactions of the acquired company have been included in the consolidated financial statements since the date ofacquisition. The purchase price exceeded tangible net assetsacquired by approximately $3.7 million. This goodwill was being amortized over 20 years using the straight-line method.SunSource and Hillman are distributors of fasteners to theoriginal equipment marketplace. The former business operations of SunSource and Hillman are being conducted by Assembly Component Systems.
NOTE D – SPECIAL CHARGESIn the fourth quarter of 2001, the Company wrote-off capitalized software and implementation costs of a discontinued enterprise information system project. This write-off represents a non-cash charge of $8,527,000($5,138,000 net of tax benefits).
In the second and fourth quarter of 1999, the Companyrecorded special charges of $2,053,000 and $879,000,respectively. These charges were for severance and early retirement benefits to several members of management. These benefits will be paid through 2004. Payments against
these accruals of approximately $575,000, $1,033,000 and$323,000 were made in 2001, 2000 and 1999, respectively. In addition, an adjustment to reduce the accrual for approximately $31,000 was made in 2001 to reflect a change in the estimated total severance payments required.
In the fourth quarter of 1998, the Company recorded a specialcharge of $2,621,000 for severance and early retirement benefits for several members of management. These benefitswill be paid through 2003. Payments of approximately$309,000, $626,000 and $1,069,000 were made in 2001,2000 and 1999 against this accrual, respectively. In addition,an adjustment to reduce the accrual for approximately$129,000 was made in 1999 to reflect a change in the estimated total severance payments required.
NOTE E – MARKETABLE SECURITIESThe following is a summary of the Company’s investments at December 31 which are classified as available-for-sale. The contractual maturity of all marketable securities atDecember 31, 2001 is less than one year.
Gross Gross EstimatedUnrealized Unrealized Fair
(In thousands) Cost Gains Losses Value2001
Obligations of states andpolitical subdivisions $ – $ – $ – $ –
Foreign government securities 1,737 – – 1,737Other debt securities – – – –Total debt securities $1,737 $ – $ – $1,737
2000
Obligations of states andpolitical subdivisions $ 3,454 $5 $5 $ 3,454
Foreign government securities 7,797 – – 7,797Other debt securities 19,122 – – 19,122Total debt securities $30,373 $5 $5 $30,373
The gross realized gains on sales of marketable securitiestotaled: $13,000, $1,000 and $992,000 in 2001, 2000 and1999, respectively, and the gross realized losses totaled $0,$2,000 and $89,000, respectively. The net adjustment to unrealized holding gains included as a separate component of stockholders’ equity, net of taxes, totaled $28,000 in 2000while in 1999, the net adjustment to unrealized holding lossesincluded as a separate component of stockholders’ equity, net of taxes, totaled $696,000.
NOTE F – PROPERTY, PLANT AND EQUIPMENTThe cost of property, plant and equipment consists of:
2001 2000
Land $ 6,597,182 $ 6,649,440Buildings and improvements 40,905,512 39,145,917Machinery and equipment 31,214,970 28,955,498Furniture and fixtures 5,557,969 5,231,947Vehicles 252,251 217,345Construction in Progress 462,851 775,682
$84,990,735 $80,975,82910

NOTE G – INVESTMENT IN REAL ESTATEThe Company is a limited partner in one real estate limited partnership. An officer and member of the Board of Directors of the Company has a 1.5% interest as a general partner inthis partnership. This interest is subordinated to theCompany’s interests in distributable cash.
In the fourth quarter of 2000, the Company sold its interest in a real estate partnership for $7,400,000 to the general partners, of which one is an officer and member of the Boardof Directors, resulting in an after-tax gain to the Company of$2,136,000. A special committee of outside directors of theBoard of Directors approved the sales price after receivingindependent appraisals of the property sold.
NOTE H – ACCRUED EXPENSES AND OTHER LIABILITIESAccrued expenses and other liabilities consist of the following:
2001 2000
Salaries, commissions and other compensation $ 5,547,617 $ 7,490,351
Accrued special charges 1,458,054 2,671,088Accrued and withheld taxes,
other than income taxes 2,607,879 2,344,955Accrued profit sharing
contributions 2,843,621 2,606,254Accrued self-insured health benefits 1,300,000 1,300,000Cash dividends payable 1,540,689 1,455,961Other 6,116,303 6,648,921
$21,414,163 $24,517,530
NOTE I – LINE OF CREDITOn February 21, 2001, the Company entered into a $50 million unsecured multi-currency line of credit. The Companyhad $14 million outstanding under the line at December 31,2001 at an interest rate of 3.06 percent. Amounts outstandingunder the line carried interest at 1.5% below the prime rateor .75% over the LIBOR rate as determined by the Company.The line matures on February 21, 2006. Since the line’s interest rate floats on a variable basis with either prime orLIBOR, the carrying value of the debt approximates fair value.The Company has classified $4 million of the amount outstanding as current based on the Company’s ability andintent to satisfy this portion of the line amount within the next year. The line requires the Company to meet certaincovenants, all of which were met on December 31, 2001. The Company paid interest of $605,000 in 2001.
NOTE J – STOCK PLANSIn 2001 and 2000, the Company granted Stock PerformanceRights (SPRs) pursuant to an incentive plan adopted in 2000.These SPRs have an exercise price ranging from $24.60 to$28.50 per share. These SPRs vest at 20% per year and entitle the recipient to receive a cash payment equal to the difference between the SPR price and the market value of the Company’s common stock when the SPRs are surrendered. No significant compensation expense for the SPRs wasincurred in 2001 and 2000.
Additional information with respect to SPRs is summarized as follows:
Average SPR Exercise Price # of SPRs
Outstanding January 1, 2000 $ — —Granted 26.50 71,250 *
Outstanding December 31, 2000 26.50 71,250Granted 27.08 149,000
Outstanding December 31, 2001 $26.90 220,250* Includes 14,250 SPRs vested at December 31, 2001
The Company also has an Incentive Stock Plan As Amended(Plan), which provides for the issuance of shares of CommonStock to non-employee directors, officers and key employees pursuant to stock options, SPRs, stock purchase agreementsand stock awards. 636,627 shares of Common Stock were available for issuance under the Plan as of December 31, 2001.
The Plan permits the grant of incentive stock options, subject to certain limitations, with substantially the same terms as non-qualified stock options. Non-employee directors are not eligible to receive incentive stock options. Stock options arenot exercisable within six months from date of grant and maynot be granted at prices less than the fair market value of theshares at the dates of grant.
Benefits may be granted under the Plan through December 16, 2006.
Additional information with respect to the Plan is summarized as follows:
Average Price Option Shares
Outstanding January 1, 1999 $23.34 270,890Granted 22.44 9,000Exercised — —Canceled or expired 23.56 (9,700)
Outstanding December 31,1999 24.18 270,190Granted 23.56 11,000Exercised 22.50 (3,750)Canceled or expired 27.50 (97,050)
Outstanding December 31,2000 22.86 180,390Granted — —Exercised 22.50 (7,400)Canceled or expired — —
Outstanding December 31, 2001 $22.87 172,990
Exercisable options atDecember 31, 2001 $22.79 157,990December 31, 2000 $22.71 157,890December 31, 1999 $24.44 216,139
As of December 31, 2001, the Company had the following outstanding options:Exercise Price $22.44-$23.56 $26.75 $27.00
Options Outstanding 162,990 9,000 1,000Weighted Average Exercise Price $23.24 $26.75 $27.00
Weighted Average Remaining Life 4.6 6.3 5.6Options Exercisable 150,240 6,750 1,000
Weighted Average Exercise Price $23.52 $26.75 $27.00 11
Lawson Products, Inc. and Subsidiaries

Disclosure of pro forma information regarding net income and net income per share is required by FASB Statement No. 123,“Accounting for Stock-Based Compensation,” and has been determined as if the Company had accounted for its employeestock options under the fair value method of that Statement.The fair value of these options was estimated at the date ofgrant using the Black-Scholes options pricing model.
The Company’s weighted average fair value of options grantedand assumptions used, were as follows:
2001 2000 1999
Risk-free interest rate – 5.22% 6.79%Dividend yield – 2.00% 2.00%Stock price volatility factor – .19 .18Weighted average expected life (years) – 8 8Weighted average fair value of options granted – $6.25 $6.95
For purposes of pro forma disclosures, the estimated fair value of options granted is amortized to expense over the option’s vesting period. The pro forma effect on net income is not representative of the pro forma effect on net income in futureyears because grants made in 1996 and later years have anincreasing vesting period.
The Company’s pro forma information consisted of the following:
2001 2000 1999
Net income – as reported $8,787,193 $28,135,673 $23,927,981Net income – pro forma 8,738,000 27,968,000 23,565,000Basic earnings per share – as reported .91 2.85 2.29Diluted earnings per share – as reported .91 2.85 2.29Basic earnings per share – pro forma .90 2.84 2.26Diluted earnings per share – pro forma .90 2.83 2.26
NOTE K – PROFIT SHARING AND SECURITY BONUS PLANSThe Company and certain subsidiaries have a profit sharing plan for office and warehouse personnel. The amounts of the companies’ annual contributions are determined by therespective boards of directors subject to limitations basedupon current operating profits (as defined) or participants’compensation (as defined).
The plan also has a 401(k) defined contribution saving feature.This feature, available to all participants, was provided to giveemployees a pre-tax investment vehicle to save for retirement. The Company does not match the contributions made by plan participants.
The Company and its subsidiaries also have in effect securitybonus plans for the benefit of their regional managers and independent sales representatives, under the terms of which participants are credited with a percentage of their yearly earnings (as defined). Of the aggregate amounts credited to participants’ accounts, 25% vests after five years and an additional 5% vests each year thereafter. For financial reporting purposes, amounts are charged to operations over the vesting period.
12
Provisions for profit sharing and security bonus plans aggregated $5,363,000, $5,222,000 and $5,051,000 for theyears ended December 31, 2001, 2000 and 1999, respectively.
NOTE L – INCOME TAXESDeferred income taxes reflect the net tax effects of temporary differences between the carrying amounts of assets and liabilities for financial reporting purposes and the amountsused for income tax purposes. In addition, deferred incometaxes include net operating loss carryforwards of a foreignsubsidiary which do not expire. The valuation allowance hasbeen provided since there is no assurance that the benefit ofthe net operating loss carryforwards will be realized.Significant components of the Company’s deferred tax assetsand liabilities as of December 31 are as follows: Deferred Tax Assets: 2001 2000
Compensation and benefits $11,938,000 $12,257,000Inventory 2,363,000 1,847,000Net operating loss carryforwards
of subsidiary 5,106,000 4,718,000Accounts receivable 557,000 519,000Other 1,183,000 873,000
Total Deferred Tax Assets 21,147,000 20,214,000Valuation allowance for
deferred tax assets (5,106,000) (4,718,000)
Net Deferred Tax Assets 16,041,000 15,496,000
Deferred Tax Liabilities:
Property, plant & equipment 675,000 883,000Investment in real estate 1,767,000 1,949,000Other 449,000 1,595,000
Total Deferred Tax Liabilities 2,891,000 4,427,000
Total Net Deferred Tax Assets $13,150,000 $11,069,000
Net deferred tax assets include the tax impact of items in comprehensive income of $1,183,000 and $873,000 atDecember 31, 2001 and 2000, respectively.Income (loss) before income taxes for the years endedDecember 31, consisted of the following:
2001 2000 1999
United States $18,522,707 $49,259,320 $41,494,677Foreign (1,380,514) (1,693,647) (1,224,696)
$17,142,193 $47,565,673 $40,269,981
The provisions for income taxes for the years ended December 31, consisted of the following:
2001 2000 1999
Current:Federal $8,348,000 $16,945,000 $15,187,000State 1,778,000 3,067,000 3,088,000
10,126,000 20,012,000 18,275,000Deferred benefit (1,771,000) (582,000) (1,933,000)
$ 8,355,000 $19,430,000 $16,342,000

13
The reconciliation between the effective income tax rate andthe statutory federal rate is as follows:
2001 2000 1999
Statutory federal rate 35.0% 35.0% 35.0%Increase (decrease)
resulting from:State income taxes, net of
federal income tax benefit 6.7 4.2 5.0Foreign losses 5.1 1.5 1.5Other items, net 1.9 .1 (.9)
Provision for income taxes 48.7% 40.8% 40.6%
Income taxes paid for the years ended December 31, 2001,2000, and 1999 amounted to $13,399,000, $21,212,000 and$17,157,000, respectively.
NOTE M – COMMITMENTSThe Company’s minimum rental commitments, principally for equipment, under noncancelable leases in effect atDecember 31, 2001, amounted to approximately $13,490,177.Such rentals are payable as follows: 2002 – $2,657,673; 2003 – $1,871,082; 2004 – $1,624,366; 2005 – $1,312,326;2006 – $932,460; and 2007 and thereafter – $5,092,270.
Total rental expense for the years ended December 31, 2001,2000 and 1999 amounted to $3,090,000, $2,783,000 and$2,203,000, respectively.
NOTE N – INCOME PER SHAREThe computation of basic and diluted earnings per share consisted of the following:
Year ended December 31(In thousands, except per share data) 2001 2000 1999
Numerator:Net income $8,787 $28,136 $23,928
Denominator:Denominator for basic income per
share – weighted average shares 9,684 9,860 10,444Effect of dilutive securities:
Stock option plans 25 14 2
Denominator for diluted income per share –
adjusted weighted average shares 9,709 9,874 10,446
Basic income per share $0.91 $2.85 $2.29
Diluted income per share $0.91 $2.85 $2.29
NOTE O – SEGMENT REPORTINGThe Company has three reportable segments: Maintenance, Repair and Replacement (MRO) distribution, OriginalEquipment Manufacturer (OEM) distribution and manufacturing, and international distribution. The operationsof the Company’s MRO distribution segment distribute a widerange of MRO parts to repair and maintenance organizationsby the Company’s force of independent sales agents.
The operations of the Company’s OEM segment manufacture and distribute component parts to large OEM manufacturersthrough a network of independent sales agents as well as internal sales employees.
The international distribution segment consists of theCompany’s distribution businesses in Canada, Mexico, and theUnited Kingdom of principally MRO parts.
The Company’s reportable segments are distinguished by the nature of products distributed and sold, types of customers,and geographical location.
The Company evaluates performance and allocates resources to reportable segments primarily based on operating income. The accounting polices of the reportable segments are thesame as those described in the summary of significant policiesexcept that the Company records its federal and state deferredtax assets and liabilities at corporate. Intersegment sales arenot significant.
Financial information for the Company’s reportable segments consisted of the following:
Year ended December 312001 2000 1999
Net salesMRO distribution $306,917,045 $283,969,540 $274,040,132OEM distribution 52,350,227 52,001,028 42,435,187International distribution 20,139,803 12,996,918 12,511,780
Consolidated total $379,407,075 $348,967,486 $328,987,099
Operating Income (loss)MRO distribution $15,167,119 $39,336,157 $35,084,960OEM distribution 2,165,731 4,052,210 3,465,508International distribution (1,131,045) (1,564,812) (1,142,319)
Consolidated total $16,201,805 $41,823,555 $37,408,149
Capital expendituresMRO distribution $4,496,163 $2,761,755 $5,681,211OEM distribution 683,937 570,225 520,536International distribution 48,829 60,478 260,601
Consolidated total $5,228,929 $3,392,458 $6,462,348
Depreciation and amortizationMRO distribution $6,553,422 $5,176,344 $5,074,905OEM distribution 1,060,392 1,130,394 1,011,618International distribution 532,199 356,925 440,936
Consolidated total $8,146,013 $6,663,663 $6,527,459
Total assetsMRO distribution $165,126,824 $160,169,065 $155,376,398OEM distribution 34,183,609 32,181,862 32,763,599International distribution 20,319,932 19,301,539 17,677,880
Segment total 219,630,365 211,652,466 205,817,877
Corporate 13,150,000 11,069,000 10,173,000
Consolidated total $232,780,365 $222,721,466 $215,990,877
Lawson Products, Inc. and Subsidiaries

NOTE P – SUMMARY OF UNAUDITED QUARTERLY RESULTS OF OPERATIONSUnaudited quarterly results of operations for the years endedDecember 31, 2001 and 2000 are summarized as follows:
Quarter ended2001 Mar. 31 Jun. 30 Sept. 30 Dec. 311,2
(In thousands, except per share data)
Net sales3 $83,650 $98,980 $100,000 $96,777Cost of goods sold3 29,937 33,888 35,256 31,984Income (loss)
before income taxes3 5,825 6,927 5,838 (1,448)Provision for income taxes 2,587 2,939 2,525 304Net income (loss) 3,238 3,988 3,313 (1,752)Net income (loss) per share
of common stockBasic .33 .41 .34 (.18)Diluted .33 .41 .34 (.18)
Diluted weighted average shares outstanding 9,730 9,740 9,715 9,652
Quarter ended2000 Mar. 31 Jun. 30 Sept. 30 Dec. 311, 4
(In thousands, except per share data)
Net sales $86,280 $89,632 $88,064 $84,991Cost of goods sold 29,946 30,458 30,094 26,758Income before income taxes 10,908 11,381 10,736 14,541Provision for income taxes 4,463 4,664 4,358 5,945Net income 6,445 6,717 6,378 8,596Net income per share
of common stockBasic .64 .68 .66 .89Diluted .64 .68 .65 .88
Diluted weighted average shares outstanding 10,093 9,895 9,718 9,729
1 Inventories and cost of goods sold during interim periods are determined through the use of estimated gross profit rates. The difference between actual and estimated gross profit rates used for interim periods is adjusted in the fourth quarter. This adjustment increased net income by approximately$2,055,000 and $1,349,000 in 2001 and 2000, respectively.
2 The fourth quarter included non-recurring charges for the write-off of capitalized software and implementation costs of an enterprise information system project which the Company decided to discontinue as well as a non-recurring promotional program related to the acquisition of Premier operations. These charges reduced net income by $5,138,000 and $2,021,000, respectively.
3 The Company acquired the business of Premier as of March 30, 2001. The results of the acquisition are included in the quarterly results since the date of the acquisition.
4 The fourth quarter includes a gain of $2,136,000, net of income taxes, relative to the sale of the Company’s interest in a real estate investment.
14
The reconciliation of segment profit to consolidated incomebefore income taxes consisted of the following:
Year ended December 312001 2000 1999
Total operating income for reportable segments $16,201,805 $41,823,555 $37,408,149
Interest and dividend income 654,257 1,072,730 1,312,312Interest expense (705,756) (7,959) (7,351)Gain from sale of
partnership interest — 3,502,336 —Other - net 991,887 1,175,011 1,556,871
Income before income taxes $17,142,193 $47,565,673 $40,269,981
Financial information related to the Company’s operations by geographic area consisted of the following:
Year ended December 312001 2000 1999
Net salesUnited States $359,267,272 $335,970,568 $316,475,319Canada 13,998,416 7,980,367 7,154,424Other foreign countries 6,141,387 5,016,551 5,357,356
Consolidated total $379,407,075 $348,967,486 $328,987,099
December 312001 2000 1999
Long-lived assetsUnited States $61,173,006 $39,155,963 $42,509,070Canada 6,300,247 2,154,539 2,312,377Other foreign countries 395,939 525,444 778,652
Consolidated total $67,869,192 $41,835,946 $45,600,099
Net sales are attributed to countries based on the location of customers. Long-lived assets consist of total property, plant andequipment and intangible assets such as goodwill.

Management’s Discussion and Analysis ofResults of Operations and Financial Condition
15
RESULTS OF OPERATIONSNet sales for 2001 and 2000 increased 8.7% and 6.1%, respectively, over the immediately preceding years. In 2001,Maintenance, Repair and Replacement (MRO) distributionnet sales increased by $22.9 million, including $34.9 millionin sales generated by the addition of the field and inside salesrepresentatives from the Industrial Products Division (IPD)and Kent Automotive Division (Kent), of the North Americanbusiness of Premier Farnell (Premier), acquired March 30,2001. These sales gains more than offset reduced contributions by other MRO units. International distributionsales were also positively impacted by the sales of IPD andKent, representing $6.3 million of the segment increase of$7.1 million. Lawson’s Original Equipment Manufacturer(OEM) distribution net sales were relatively flat for 2001.
The sales gains realized by our MRO and OEM distribution segments for 2000 resulted from the addition of new customers, a higher average order size throughout Lawson’sbusinesses and from the full year impact of the mid-year1999 acquisition of our subsidiary, ACS/SIMCO, now combined with Assembly Component Systems (ACS).
Operating income for 2001 decreased $25.6 million, or 61%.The year and MRO results were adversely impacted by the$8.5 million write-off of an enterprise information systemwhich the Company discontinued. Also impacting 2001 wasthe $3.4 million non-recurring promotional program put inplace to support the newly acquired Premier business.Excluding these amounts, the MRO segment’s 2001 operatingprofit was approximately $27.1 million compared to $39.3million in 2000. The decrease, excluding special items, was due to slightly lower gross margins due to pricing inconsistencies on certain Premier product lines and higherselling, general and administrative expenses (S,G&A). In2001, the Company incurred significantly higher S,G&A coststo expand the Company’s national sales group, integrateapproximately 400 sales professionals, absorb over $1 million of transition costs to integrate acquired inventory, and to realign existing warehouses and upgrade informationsystems. The Company also had $1 million of additionalgoodwill amortization expense. OEM operating income wasdown due to lower gross margins resulting from significantpricing pressures.
Operating income for 2000 was up approximately $4.4 million, or 11.8% over 1999. The MRO segment drove theoperating income growth due to higher sales and cost containment efforts. OEM distribution also contributed to the earnings improvement.
Net income for 2001 declined 68.8% from 2000 to $8.8 million, while diluted net income per share in 2001decreased 68.1% to $.91 from $2.85 in 2000. Results for2001 were negatively impacted by the special charges andincreased S,G&A expenses discussed above. Net income for2000 increased 17.6% over 1999 to $28.1 million, whilediluted net income per share in 2000 advanced 24.5% to$2.85 from $2.29 in 1999. Sales gains from our MRO distribution segment discussed above, the after tax gain of
$2.1 million on the sale of the Company’s interest in a realestate investment, and cost containment efforts were primarily responsible for the increase in net income in 2000 over 1999. Excluding the $2.1 million gain notedabove, net income for 2000 was approximately $26.0 million ($2.63 per diluted share), an advance of 3.4% over 1999 net income, exclusive of a $1.8 million special charge, for compensation arrangements related to management personnel retirements and a gain of $600,000 from the saleof marketable securities. Per share net income for 2001,2000 and 1999 was positively affected by the Company’sshare repurchases discussed below.
LIQUIDITY AND CAPITAL RESOURCESCash flows provided by operations for 2001, 2000 and 1999 were $6.4 million, $22.9 million and $23.3 million,respectively. The decline in 2001 was due primarily to thedecrease in net income noted above, as well as the impact of increases in accounts receivable and inventories largelyassociated with additional sales generated by the outside sales representatives of IPD and Kent, and lower operating liabilities. The slight decrease in 2000 was due primarily to the impact of lower operating liabilities which more than offset the gain in net income noted above. Currentinvestments, cash flows from operations and the new $50 million unsecured line of credit have continued to besufficient to fund operating requirements, cash dividends and capital improvements. Such internally generated fundsand the new line of credit are also expected to finance theCompany’s future growth.
Capital expenditures for 2001, 2000 and 1999, respectively, were $5.2 million, $3.4 million and $6.5 million. Consistent with prior years, capital expenditures were incurred primarily for new facilities, improvement of existing facilities and for the purchase of related equipment. Capital expenditures during 2001 primarily reflect purchasesof computer related equipment and improvement of existingfacilities and for the purchase of related equipment. Capitalexpenditures during 2000 primarily reflect purchases ofcomputer related equipment, while in 1999, reflected costs incurred relative to the construction of a new Lawsonoutbound facility in Suwanee, Georgia and purchases of computer related equipment.
Future oblgations and commitments to make future paymentsunder contracts consisted of the following as of December31, 2001:
On March 30, 2001, the Company purchased certain assets of Premier Farnell’s Cleveland based North American
Lawson Products, Inc. and Subsidiaries
2007 and(In thousands) 2002 2003 2004 2005 2006 thereafter Total
Revolving line of credit $4,000 $ — $ — $ — $10,000 $ — $14,000
Rental commitments 2,658 1,871 1,624 1,312 933 5,092 13,490Total contractual
cash obligations $6,658 $1,871 $1,624 $1,312 $10,933 $5,092 $27,490

Industrial Products and Kent Automotive Divisions forapproximately $28.4 million plus approximately $7.2 millionfor related inventories. The all-cash transaction was accounted for as a purchase; accordingly the accounts andtransactions of the acquired business have been included in the consolidated financial statements since the date ofacquisition. Under the agreement, the Company acquired thefield sales, inside sales and customer service professionals,the customer accounts, certain administrative executives,and various intellectual properties, including trademarks
and trade names of the divisions in certain territories. TheCompany incorporated into its existing operations, PremierFarnell’s Premier Fastener, Rotanium Products, CertainiumAlloys, CT Engineering, JI Holcomb and Kent Automotivebusiness units in the United States, Canada, Mexico, CentralAmerica and the Caribbean.
The assets acquired were recorded at fair values based onactual purchase cost of inventories and valuations of variousintellectual properties, including trademarks and tradenames of the IPD and Kent divisions. This acquisition did notrequire a significant investment by the Company in facilitiesor equipment. The acquisition generated approximately$41.2 million of incremental sales. As the Company onlyacquired portions of the inventory and sales professionals of the IPD and Kent businesses, the Company is unable toprovide any meaningful pro forma information of operatingresults for 2001 or sales and operating results from theprior period.
In the third quarter of 1999, the Company purchased, for cash, substantially all of the assets and liabilities of SunSource Inventory Management Company, Inc.(SunSource) and Hillman Industrial Division (Hillman),headquartered in Lenexa, Kansas, at a cost of approximately$10.5 million. SunSource and Hillman are distributors of fasteners to the original equipment marketplace. The former business operations of SunSource and Hillman areconducted by ACS.
During 2001, the Company purchased 84,497 shares of its own common stock for approximately $2.2 million. These shares were acquired pursuant to the 1999 Boardauthorization to purchase up to 500,000 shares. During2000, the Company purchased 501,268 shares of its owncommon stock for approximately $11.9 million. Of thesepurchases, 412,668 shares were acquired pursuant to the1999 Board authorization and 88,600 shares represented theremaining shares authorized for purchase under the 1998Board authorization to purchase up to 500,000 shares.During 1999, the Company purchased 459,900 shares of itsown common stock for approximately $10.5 million. Ofthese purchases, 411,400 shares were acquired pursuant tothe 1998 Board authorization and 48,500 shares representedthe remaining shares authorized for purchase under the1996 Board authorization to purchase up to 1,000,000shares. At December 31, 2001, 502,835 shares were available for purchase pursuant to Board authorizations in2000 and 1999. No shares have been purchased pursuant tothe 2000 Board authorization of 500,000 shares and 2,835shares remain, relative to the 1999 Board authorization.Funds to purchase these shares were provided by investments and cash flows from operations.
CRITICAL ACCOUNTING POLICIESThe Company has disclosed its accounting policies in Note B to the consolidated financial statements. The following provides supplemental information to theseaccounting policies as well as information on the accountsrequiring more significant estimates.
ALLOWANCE FOR DOUBTFUL ACCOUNTS –METHODOLOGYWe evaluate the collectibility of our accounts receivablebased on a combination of factors. In circumstances wherewe are aware of a specific customer’s inability to meet its financial obligations to us (e.g., bankruptcy filings, substantial down-grading of credit ratings), we record a specific reserve for bad debts against amounts due to reducethe net recognized receivable to the amount we reasonablybelieve will be collected. For all other customers, we recognize reserves for bad debts based on our historicalexperience of bad debt write-offs as a percent of outstandingaccounts receivable. If circumstances change (i.e., higherthan expected defaults or an unexpected material adversechange in a major customer’s ability to meet its financialobligations to us), our estimates of the recoverability ofamounts due us could be revised by a material amount.
INVENTORIES – SLOW MOVING AND OBSOLESCENCEThe Company carries a significant amount of inventories,which provides a competitive advantage in the Company’sability to fulfill the vast majority of its customers’ orders thesame day received. However, this strategy also increases therisk that portions of the inventory have decreased in valuebelow their carrying cost. To reduce inventory to a lower ofcost, or market value, the Company records a reserve forslow-moving and obsolete inventory. The Company definesobsolete as those inventory parts on hand which theCompany plans to discontinue to offer to its customers. Slow-moving inventory is monitored by examining reports of parts which have not been sold for extended periods. TheCompany records the reserve needed based on its historicalexperience of how much the selling prices must be reducedto dispose of such obsolete or slow-moving products. Ifexperience or market conditions change, estimates of thereserves needed could be revised by a material amount.
IMPACT OF INFLATION AND CHANGING PRICESThe Company has continued to pass on to its customers most increases in product costs and, accordingly, gross margins have not been materially impacted. The impact frominflation has been more significant on the Company’s fixedand semi-variable operating expenses, primarily wages andbenefits, although to a lesser degree in recent years due tomoderate inflation levels.
Although the Company expects that future costs of replacing warehouse and distribution facilities will rise due to inflation, such higher costs are not anticipated to have a material effect on future earnings.
16

ANNUAL MEETINGThe annual meeting of stockholders will be held at 10:00 a.m.Tuesday, May 14, 2002 at Corporate Headquarters.
FORM 10-KA copy of the Company’s 2001 Annual Report on Form 10-K to the Securities and Exchange Commission is available withoutcharge to stockholders upon written request to the Secretary of the Company.
CORPORATE HEADQUARTERSLawson Products, Inc.1666 East Touhy AvenueDes Plaines, Illinois 60018847-827-9666www.lawsonproducts.com
PROFESSIONAL SERVICESAuditorsErnst & Young LLP
Legal CounselMcDermott, Will & EmeryVedder, Price, Kaufman & Kammholz
Report of Independent Auditors
17
SHARE OWNER SERVICESFirst Chicago Trust Company, a Division of EquiServeP.O. Box 2500 • Jersey City, NJ 07303-2500Telephone: In the United States: 1-800-446-2617(Operators are available Monday-Friday, 8:30 a.m. to 7:00 p.m.Eastern time. An interactive automated system is available aroundthe clock every day.)Internet: http://www.equiserve.comAccess your account via the internet: http://gateway.equiserve.com
To the Stockholders and Board of Directors
Lawson Products, Inc.
We have audited the accompanying consolidated balancesheets of Lawson Products, Inc. and subsidiaries as ofDecember 31, 2001 and 2000, and the related consolidatedstatements of income, changes in stockholders’ equity, andcash flows for each of the three years in the period endedDecember 31, 2001. These financial statements are the responsibility of the Company’s management. Our responsibility is to express an opinion on the financial statements based on our audits.
We conducted our audits in accordance with auditing standards generally accepted in the United States. Thosestandards require that we plan and perform the audit toobtain reasonable assurance about whether the financialstatements are free of material misstatement. An auditincludes examining, on a test basis, evidence supporting the amounts and disclosures in the financial statements. An audit also includes assessing the accounting principlesused and significant estimates made by management, as well as evaluating the overall financial statement presentation. We believe that our audits provide a reasonable basis for our opinion.
In our opinion, the financial statements referred to abovepresent fairly, in all material respects, the consolidated financial position of Lawson Products, Inc. and subsidiariesat December 31, 2001 and 2000, and the consolidatedresults of their operations and their cash flows for each of the three years in the period ended December 31, 2001in conformity with accounting principles generally accepted in the United States.
Chicago, IllinoisFebruary 28, 2002
NASDAQ NATIONAL MARKETThe common stock of Lawson Products is part of the NASDAQNational Market System. Stock quotations are included in theNational Market system table in The Wall Street Journal and in leading daily newspapers across the country. These provide thesame high, low and closing transaction prices as are shown forsecurities traded on the New York and other stock exchanges.
Corporate Information

SUBSIDIARY OFFICERS
LAWSON DOMESTIC DISTRIBUTION CENTERS
GROUP OFFICERS
18
Robert BlechaVice President, Revenue Management - MRO
George H. BuckinghamVice President, Sales - MRO
Dennis CoomesVice President, Sales - MRO
James DegnanVice President, Operations
John M. Del SassoVice President, Distribution - MRO
George GoffVice President, Manpower Development - MRO
Barney RuehlVice President, Sales Education - MRO
Ronald O. KleinVice President, Sales - Kent Automotive
Warren LudvigsenVice President, National Accounts Group
Alan H. MoonVice President, International
James L. SchmidtVice President, Administration - MRO
Robert J. SpedaleVice President, Purchasing
CRONATRON WELDING SYSTEMS INC.Susan CollinsPresident and Chief Operating Officer
Robert DavisVice President - Sales
DRUMMOND AMERICAN CORPORATIONDaniel J. JozwiakPresident and Chief Operating Officer
ASSEMBLY COMPONENT SYSTEMSRichard SchwindPresident and Chief Operating Officer,Distribution
AUTOMATIC SCREW MACHINEPRODUCTS COMPANYClint SnyderVice President and General ManagerManufacturing
C.B. LYNN COMPANYScott McCulloughVice President and General Manager
LAWSON PRODUCTS, INC.ONTARIOScott R. AimersVice President and General Manager
LAWSON PRODUCTS DE MEXICOCarlos LopezManaging Director
LAWSON PRODUCTS LIMITED - UKVernon PearceDirector UK Operations
RENO, NEVADAFrank J. CapallupoVice President and General Manager
FAIRFIELD, NEW JERSEYGerard CropaneseGeneral Manager
SUWANEE, GEORGIATodd HenryGeneral Manager
DALLAS, TEXASDean KeithVice President and General Manager
ADDISON, ILLINOISMichele SchneiderGeneral Manager
DES PLAINES, ILLINOISRobert W. Tucibat, IIGeneral Manager
BOARD OF DIRECTORS EXECUTIVE OFFICERSSidney L. PortChairman, Executive Committee
Robert J. WashlowChairman of the BoardChief Executive Officer
James T. Brophy(Private Investor)Chairman, Audit Committee
Bernard Kalish(Retired CEO, Lawson Products, Inc.)
Robert M. Melzer(Business Consultant)Chairman, Nominating Committee
Ronald B. Port, M.D.(Retired Physician)Chairman, Variance Committee
Robert G. Rettig(Consultant)Chairman, Compensation Committee
Mitchell H. Saranow(James M. Collins, Senior LecturerHarvard Business School)Chairman, Financial Strategies Committee
Jerome ShafferVice President and Treasurer
Sidney L. PortChairman, Executive Committee
Robert J. WashlowChairman of the BoardChief Executive Officer
Jeffrey B. BelfordOffice of the PresidentChief Operating Officer
Roger F. CannonOffice of the PresidentChief Sales Officer
John J. MurrayVice President, Corporate Affairs
Stanley BelskyChief Executive Officer, OEM Businesses
Jerome ShafferVice President and Treasurer
Joseph L. PawlickChief Financial Officer
Neil E. JenkinsSecretary and Corporate Counsel
James J. SmithVice President, Human Resources
Daniel N. LuberVice PresidentCorporate Planning and Development
Victor GalvezController
William HolmesAssistant Treasurer
INSIDE SALES CENTERINDEPENDENCE, OHIOJanet M. MeyerDirector
19
Systems, Services and ProductsKeeping Industry RunningEvery Minute - Every Day
LAWSON PRODUCTS, INC.and named subsidiaries in Canada, Mexico and the United Kingdom: Provides abrasives, electrical items, fasteners, fittings, hardware, hose, hydraulics, pneumatics, supplies and tools, together with engineering consultations and inventory control solutions for the maintenance and repair requirements of customers.
CRONATRON WELDING SYSTEMS, INC.Provides maintenance and repair operations with metallurgical solutions, welding equipment and supplies, wearplate, rod and powders along with inventory control systems.
DRUMMOND AMERICAN CORPORATIONProvides specialty chemical solutions and inventory control systems to maintenance andrepair operations.
ASSEMBLY COMPONENT SYSTEMS, INC.Provides original equipment manufacturers with just-in-time inventories of custom-orderedcomponent parts and with in-plant or electronic vender-managed inventory systems throughelectronic commerce mechanisms.
AUTOMATIC SCREW MACHINE PRODUCTS COMPANY, INC.Manufacturer of specialized screw machine parts for the OEM and MRO marketplacesincluding ACS and Lawson.
C.B. LYNN COMPANYA custom solutions provider for obtaining special items and non-stock items supplemental to those products, parts and supplies regularly inventoried by the Family of Businesses.
KENT AUTOMOTIVEKent Automotive offers a broad range of specialty, high performance, problem-solvingproduct systems for the automotive collision and mechanical repair aftermarket.
The Family of Businesses

20
Lawson Products is an international seller and distributor of
systems, services and products to the industrial, commercial
and institutional maintenance, repair and replacement marketplace.
The Company also manufactures, sells and distributes production
and specialized component parts to the original equipment
marketplace including the automotive, appliance, aerospace,
construction and transportation industries.
The Company offers to customers over 400,000 products including
fasteners, parts, chemical specialties, hardware, welding supplies
and accessories, pneumatics, hydraulic and other flexible hose
fittings, tools, safety items and electrical and shop supplies.
Customers are currently served from seventeen strategically
located facilities by approximately 2,000 independent sales agents
and 70 inside sales and customer service representatives in the
United States, Puerto Rico, Canada, Mexico and the United Kingdom.
Lawson Products was founded in 1952 by Sidney L. Port, Chairman
of the Executive Committee.
Profile of Lawson Products
This report is printed on recycled paper.

21
Above is a letter received from the Officers of the Emergency Service Unit of the New York City Police Departmentexpressing their gratitude for the assistance provided by the Lawson Family of Businesses during the time followingthe tragedy of September 11, 2001. Led by the direct personal involvement of our sales representatives in the areaand the support of our colleagues in our distribution and operations groups, the Family of Businesses provided and hand delivered needed supplies and equipment to assist in the rescue efforts at the World Trade Center, all in the form of donations. We are proud to be a part of this effort.

Lawson Products, Inc.Corporate Headquarters
1666 East Touhy AvenueDes Plaines, Illinois 60018www.lawsonproducts.com