contents uap and old mutual, forming one of the largest financial services groups with a growing...
TRANSCRIPT


CONTENTSABOUT US03 UAP Old Mutual Tower Highlights04 UAP Old Mutual at a Glance05 Old Mutual Plc at a Glance
DIRECTORS06 UAP Holdings Board of Directors’ Profiles10 UAP Old Mutual Subsidiaries Directors
KEY STATEMENTS16 Chairman’s Statement22 Group CEO’s Statement
CORPORATE REVIEW26 Corporate Governance Report44 Sustainability and CSR Report 201652 Five-Year Financial Highlights54 Directors’ Report56 Directors’ Remuneration Report57 Statement of Directors’ Responsibilities
FINANCIAL STATEMENTS58 Report of the Independent Auditors’ to the Members of
UAP Holdings Limited63 Consolidated Statement of Profit or Loss64 Consolidated Statement of Other Comprehensive Income65 Consolidated Statement of Financial Position66 Company Statement of Financial Position67 Consolidated Statement of Changes in Equity69 Company Statement of Changes in Equity70 Consolidated Statement of Cash Flows71 Notes to the Financial Statements
AGM139 Notice of Annual General Meeting (AGM)142 Form of Proxy
OUR CONTACTS143 Contacts


THE UAP OLD MUTUAL TOWER
Located along Upper Hill Road in Upper Hill, Nairobi, the UAP Old Mutual Tower adds some 324,881 sq ft of grade A letting space in Upper Hill Commercial District.
It stands 163m tall at an altitude of 5,700ft above sea level.

The UAP Old Mutual Kenya Group is comprised of Faulu, UAP and Old Mutual, forming one of the largest financial services groups with a growing footprint in East and Central Africa. The Group was formed in 2015 as a result of the acquisition of a controlling stake by Old Mutual in Faulu Microfinance Bank in 2014 and UAP Holdings in 2015.
The Group pursues an integrated financial services model to avail to customers a comprehensive range of financial solutions which include Investment, Insurance, Banking and Savings through a wider and more accessible distribution network.
UAP OLD MUTUAL GROUP EAST AFRICA
Our customers can now be assured of holistic solutions and unrivalled convenience to enable them realise their dreams.PETER MWANGI | GROUP CEO, UAP OLD MUTUAL GROUP
The UAP Old Mutual Group is part of the Old Mutual Emerging Markets (OMEM). As part of OMEM, UAP Old Mutual is able to leverage technology, technical expertise and the ability to offer broad career growth prospects for employees.
THE UAP OLD MUTUAL GROUP WILLOPERATE UNDER THE BANNER OF:
THE BUSINESS WILL DRIVE TWO KEY BRANDS IN THE MARKET.
NON-BANKING BUSINESS
BANKING BUSINESS

QUICK FACTS ABOUT THE GROUP
1.2M
4K
CUSTOMERSEGMENTS
160+
COUNTRIES
CUSTOMERS
SERVICE & DISTRIBUTIONOUTLETS
PROPERTIES IN 4 COUNTRIES
EMPLOYEES& AGENTS
KENYA, UGANDA, SOUTH SUDAN,RWANDA, DR CONGO & TANZANIA.
RETAIL BUSINESSCORPORATE
12
6
OLD MUTUAL PLC AT A GLANCE
OLD MUTUAL IS AN INTERNATIONAL INVESTMENT, SAVINGS, INSURANCE & BANKING GROUP
Old Mutual began in Cape Town in 1845 as South Africa’s first mutual life insurance company, offering financial security in uncertain times. Today, 172 years on, Old Mutual plc is made up of four strong businesses comprising Old Mutual Emerging Markets, Nedbank, Old Mutual Wealth and Old Mutual Asset Management serving a combined 18.9 million customers.
HEADQUARTERED IN LONDON, WE DO BUSINESS IN AFRICA, EUROPE, THE AMERICAS AND ASIA. FROM OUR ORIGINS IN SOUTH AFRICA, WE HAVE EXPANDED THROUGH ORGANIC GROWTH AND STRATEGIC ACQUISITIONS.
Our customers are at the heart of everything we do. We know that we can only be successful with their continued support and trust – we aim to be their most trusted financial partner, helping them achieve their lifetime financial goals, while investing their funds in ways that will secure a positive future for themselves and their families.
19.4M 68,527
£394.9 BN30CUSTOMERS EMPLOYEES
COUNTRIES FUNDS UNDER MANAGEMENT
THE BUSINESS MODEL:
NEDBANK
7.7M CUSTOMERS IN 9 AFRICAN COUNTRIES
OLD MUTUALEMERGING MARKETS
15 COUNTRIES ACROSS AFRICA
OLD MUTUALWEALTH
3,000 UK FINANCIALADVISORS
OLD MUTUAL ASSET MANAGEMENT
£195.2BN FUNDS UNDERMANAGEMENT
5ANNUAL REPORT & FINANCIAL STATEMENTS 2016

DR JB WANJUI | CHAIRMAN
Dr. JB Wanjui cbs, the Chairman of the Board has had a long and illustrious career in the Kenyan corporate scene, the most prominent being the Chief Executive of East Africa Industries (which later became Unilever). He is a graduate of Ohio Wesleyan University, (BA Physics and Mathematics) and Columbia University, (MSC Engineering). Dr. Wanjui was the Chancellor of the University of Nairobi and was previously the Chairman of CfC Stanbic Bank Limited. He is also Chairman and Board member of a number of other Kenyan and international organizations. Dr. Wanjui has been a director of the Company since 1986 and the Chairman of the Board since 1998. In recognition of his exemplary contributions to positive change in society, he received the Chief of the Order of the Burning Spear (CBS) of the Republic of Kenya award.
PETER DE BEYER | DEPUTY CHAIRMAN
Peter De Beyer was appointed as Deputy Chairman of the Board in June 2005. He joined wider Old Mutual Group in 1978 and has served the business in various capacities including Development Actuary and Executive General Manager. In September 2000, Peter became Deputy Managing Director, South Africa, responsible for all Retail Business. Mr De Beyer retired from Old Mutual Group in November 2008 and continues to serve on its several boards. Peter holds a Bachelors in Business Science and he is a Fellow Institute of Actuaries South Africa. He also has an Advanced Management Program qualification from INSEAD. Peter has significant wealth in corporate leadership and in addition to serving on the OMLAC Board, he currently serves several Boards namely: Autumn Skies Trading 306 CC, South Africa; Oceana Group Limited, South Africa; Old Mutual (Malawi) Limited; Old Mutual (Blantyre) Nominees Limited; OMLAC; Old Mutual Investment Group (SA) Holdings (Proprietary) Limited; Old Mutual Life Assurance Company (Malawi) Limited; Old Mutual Life Assurance Company (Namibia) Limited; Old Mutual (Malawi) Unit Trust Limited; Real People Investment Holdings (Pty) Limited; Old Mutual Life Assurance Company (South Africa) Limited; Old Mutual Life Holdings (South Africa) Limited; Old Mutual Unit Trust Managers Limited; Marriott Unit Trust Management Company Limited; and Old Mutual Nigeria Life Insurance Company Limited
JONAS MUSHOSHO | DIRECTOR
Jonas Mushosho was appointed Chief Executive Officer for Old Mutual Rest of Africa in February 2017, a position covering 13 countries in Africa except South Africa. He is the current Group Chief Executive Officer of Old Mutual Zimbabwe. He brings with him a wealth of strategic experience and maturity to contribute to the development of the group. Prior to this, he headed the Old Mutual Zimbabwe Life Company as Managing Director, a position he held since June 2009. Jonas is a Chartered Accountant CA (Z), CA (SA) and holds a B. Accounting, B. Compt (Hons) and an MBA. He is a fellow of the Institute of Chartered Secretaries and Administrators (FCIS). A former Zimbabwe Deputy Commissioner of Taxes, Jonas joined Old Mutual in 1990 as a Tax Planning Accountant having worked for the Zimbabwe Tax Department for 10 years. Part of his track record in the Group includes, heading the Retail Business as General Manager (2001 - 2004) prior to his promotion to Finance Director (2004 - 2009). He was appointed to the Board of UAP Holdings on 24th August, 2016.
UAP HOLDINGS BOARD OF DIRECTORS’ PROFILES
6 UAP OLD MUTUAL GROUP

DR. PETER MUTHOKA | INDEPENDENT DIRECTOR
Dr. Peter Muthoka Ebs, Mbs, FKIb, FKIM, is an Independent Director of the Board, and he is the current Chairman of the Faulu Micro Finance Bank, which is a member of the UAP Old Mutual Group. He is also the Chairman of the UAP Old Mutual Foundation. He previously served as the Group Chairman of Kenya Commercial Bank. He is the Chairman of the Board of Fellows of the Kenya Institute of Management (KIM) and Chairman of the Board of Trustees of the Management University of Africa (MUA). He has been a corporate leader and an entrepreneur with long and varied experience in public and private sectors in the fields of management, education, finance, investment, export promotion, agriculture, real estate, corporate governance, international diplomacy and community voluntary work. In recognition of his exemplary service rendered to the Kenyan Public Service and international organizations, he was awarded the medal of Moran of the Burning Spear (MBS) in 2004 and the medal of Elder of the Burning Spear (EBS) in 2012 by H.E The President of the Republic of Kenya.
PAUL TRUYENS | INDEPENDENT DIRECTOR
Paul is a non-executive Director of the Board. He commenced his working career in 1978 as CFO and Chief Actuary, World-Wide Re (UK), a position he left in 1979. In 1980 he joined Southern Life (South Africa) as GM Product Development. In 1995 he was promoted to Executive Director, CFO & Appointed Actuary of Southern Life and subsequently rose in 1998 to become a member of the executive management team and appointed actuary of the Southern Life fund, Momentum Life which positions he served until 2001. In 2002 he took up an appointment as senior manager PwC Netherlands and served as such up to 2007. In 2008 he took up a role with Metlife in Ireland as Senior Finance Actuary. Paul currently serves on the Board of Old Mutual South Africa, where he is chairman of the Risk Committee and of the Committee for Customer Affairs; a member of the audit committee, and on the board of OMH. He holds BSc Mathematical Statistics, University of Cape Town and BA Economics, University of Cape Town. He is a fellow of the Institute of Actuaries (UK) and Fellow of the Actuarial Society of South Africa. He is also a non-executive director of Infrastructure Finance Corporation (INCA), where he has been on the board since its inception in 1996. His experience spans 38 years.He currently sits on the boards of Old Mutual Emerging Markets, Old Mutual Life Assurance Company of South Africa, Mutual and Federal Insurance Company (South Africa), Mutual and Federal Risk Finance Company and Infrastructure Finance Corporation (INCA). He has in the past served as Independent non-Executive Director of African Life (now Sanlam), Southampton Life (Zimbabwe) and Outsurance (Non-Life Insurance) SA.
JAMES MUGUIYI | DIRECTOR
James Muguiyi is a Non-Executive Director at UAPHL, having previously served as Group Managing Director. During his tenure as the Group MD he oversaw the growth of the Group’s business in Kenya and expansion into Uganda, South Sudan, Rwanda and Tanzania. He presided over the group restructuring in 2008 and the demerger of the Life Insurance Business from General Insurance Business in Kenya. Between 1988 and 2001, he was the Deputy Managing Director. During this time, he oversaw the merger of Provincial Insurance with Union Insurance to form UAP Provisional Insurance in 1994. Mr. Muguiyi is a director of several other companies and is the former Chairman of Centum Investment Company Limited, a company listed on the Nairobi Securities Exchange. He is a Fellow of the Institute of Certified Public Accountants of Kenya (FCPA (K)) where he was at one time the Chairman. He is also a Certified Company Secretary (CPS (K)) and a Chartered Management Accountant (ACMA).
UAP HOLDINGS BOARD OF DIRECTORS’ PROFILES
7ANNUAL REPORT & FINANCIAL STATEMENTS 2016

ROSE OGEGA | INDEPENDENT DIRECTOR
Rose is a qualified accountant who also serves on the Board of OMH. She is currently the Managing Director of Bloom Consultancy. Prior to assuming this role, she had served as Finance Director at Skynet Worldwide Express Ltd. She has a strong background in accounting and financial management spanning over 25 years. She started her career at PWC Kenya where she worked in Corporate Finance, Business Management and Management consulting. Rose holds a Bachelor of Commerce (Accounting Option) from University of Nairobi. She is a holder of a CPA (K) and a Fellow Member of the Institute. She is also a fellow of the African Leadership initiative; Member of the Aspen Global Leadership Network and a Coach-Academy of Executive Coach. Rose has held several non-executive directorships in the various arms of the Old Mutual Kenya businesses and also served as a non-executive Director for Barclays Bank of Kenya.
SUSAN OMANGA | INDEPENDENT DIRECTOR
Susan Omanga is the CEO and founder of Exclamation Marketing Ltd. She previously served in senior marketing positions at Colgate Palmolive, Boots Kenya, Barclays Bank, and Standard Chartered. From 2004 -2012 she served as a non-executive Director in the Group Board of KCB where she was also Chairman of KCB Foundation, Director S & L Mortgages and Director KCB Uganda. Susan sits on the Board of Longhorn Publishers and Kenya Tea Packers Limited (KETEPA). She is also an advisory board Member at the University of Nairobi’s Green Horn Mentorship programme, a member of the Marketing Society of Kenya, the Public Relations Society of Kenya (PRSK) and the International Advertising Association (IAA). Susan holds an Associate of Applied Science Degree in Business Management from North West Community College, Powel, Wyoming and a Bachelor of Science Degree in Business Management with a Minor in Advertising from Rocky Mountain College in Billings Montana.
JAMES WAMBUGU | EXECUTIVE DIRECTOR
James Wambugu is the Group Managing Director, General Insurance for UAP Old Mutual and an Executive Director of UAP Holdings. Mr. Wambugu joined UAP in July 2003 and has been involved in the development of the Group’s risk and quality management systems, business expansion and strategy development. He previously worked for PricewaterhouseCoopers in Kenya and the UK, Lonrho Africa and African Lakes Corporation in the fields of audit, transaction structuring and support and risk management. Mr. Wambugu has extensive experience across many countries in Africa. He holds an MBA and Bachelor of Commerce degrees from the University of Nairobi and a diploma in Advanced Management Programme (AMP) from IESE Business School, Barcelona and Strathmore Business School, Nairobi. He is a Qualified Risk Manager (MIRM) and a Certified Public Accountant of Kenya (CPA (K)).
DAVID MARSHALL | DIRECTOR
David Marshall is a qualified accountant with a wealth of corporate finance skills and experience in the Americas, Europe and Asia, and he is highly regarded in merchant and investment banking circles. He is a South African by birth and a graduate of Hilton College and the University of Cape Town. Before to joining Old Mutual, Mr Marshall was the Managing Director for Credit Suisse’s Southern Africa ultra-high net worth business in London, and has worked for many global companies, including UBS, Deloitte, Standard Corporate and Merchant Bank. At UBS Wealth Management he advised the board on its global strategic acquisitions. Earlier in his career he was involved in the LSE listing of Anglo American and the unbundling of De Beers from Anglo.
UAP HOLDINGS BOARD OF DIRECTORS’ PROFILES
8 UAP OLD MUTUAL GROUP

ANISHA ARCHARY | DIRECTOR
Anisha Archary is the Human Resources Director of Old Mutual Emerging Markets. The Emerging Markets portfolio spans South Africa, the rest of Africa, Colombia, Mexico, India & China and has a combined workforce of 31 000 employees. Previously Anisha held the position of Executive Vice President Global Passenger Services, Product & Marketing of SAA where she spent 12 years. She holds a Masters Degree in Psychology and has completed Leadership Programmes in Switzerland, South Africa and Harvard Business School. She has spent the last 28 years in the Corporate World learning & contributing across the Transport, Retail and Financial Services sectors. She has lived and worked in South Africa and India and her work has allowed for extensive travel across the African continent where her passion for building teams across boundaries and integrating new acquisitions into the Old Mutual business can be seen.
A.K. MAINA | INDEPENDENT DIRECTOR
A.K. Maina is the Managing Director of Kenya Railways. He previously served as General Counsel and Group Secretary & Head of Legal Services for UAP Holdings; a role that saw him provide legal advisory and company secretarial services to the twelve(12) operational businesses in East Africa. He attained a Bachelor of Laws at University of Nairobi and subsequently admitted as an advocate of the High Court. He is a Certified Public Secretary and holds various professional memberships. These include: Law society of Kenya, East Africa Law Society and is a Fellow at Institute of Certified Public Secretaries of Kenya (ICPSK).
PETER MWANGI | GROUP CEO
Peter Mwangi is a director in the company and also the Group Chief Executive Officer of the UAP Old Mutual Group in East Africa. He was appointed to this position on 1st July 2015. Before this appointment he was the Group Chief Executive Officer of the Old Mutual Group in Kenya from October 2014. Prior to joining the Old Mutual Group he had served as the CEO for the Nairobi Securities Exchange from 2008 to 2014. He had joined the NSE after serving as the Managing Director for Centum Investment Company Limited (2004 – 2008). Between 2000 and 2004 he was an Investment Manager at Centum. Between 1999 and 2000, he had worked for Economic Intelligence as an Investment Analyst. He started his working career with the Kenya Air Force where he worked for 5 years and left having attained the rank of Captain in 1999. Peter holds a Bachelor of Science Degree in Electrical Engineering from the University of Nairobi. He is a member of the CFA Institute, CFA Society of East Africa, Institute of Certified Investment and Securities Analysts, Institute of Certified Public Accountants of Kenya, Institute of Certified Public Secretaries of Kenya, Institute of Directors of Kenya and the Kenya Institute of Management. Besides serving on various Boards of UAPHL entities as well as Old Mutual entities, he also serves as a non-executive director on the boards of the Central Depository and Settlement Corporation, British American Tobacco Kenya and Funguo Investments Ltd.
MIKE HARPER | INDEPENDENT DIRECTOR
Mike Harper was appointed Chairman of Mutual & Federal in May 2012. Having worked in the Old Mutual Group since 1979, Mike has served in several executive positions including Strategy Director for Old Mutual Emerging Markets, leading strategic work across Asia, Latin America, South Africa and Africa markets. He also served as Distribution Executive on the OM Group Long Term Savings executive in London. Mike served on the Boards of Old Mutual Unit Trust, Old Mutual Investment Group and the Council of the Botanical Society of South Africa.
UAP HOLDINGS BOARD OF DIRECTORS’ PROFILES
9ANNUAL REPORT & FINANCIAL STATEMENTS 2016

UAP INSURANCE KENYA
UAP LIFE ASSURANCE KENYA
UAP PROPERTIES KENYA LIMITED BOARD
JAMES MUGUIYIKENYAN \ CHAIRMAN
JAMES MUGUIYIKENYAN \ CHAIRMAN
KAMAU KURIAKENYAN \ CHAIRMAN
GEORGE ODOKENYAN
PETER MWANGIKENYAN
PETER MWANGIKENYAN
JAMES WAMBUGUKENYAN
JACKSON THEURIKENYAN
PAUL TRUYENSDUTCH
PETER LEVETTSOUTH AFRICAN
PROF. PATRICK WEKEKENYAN
BETTY ANN MBOCHEKENYAN
WAINAINA KENYANJUIKENYAN
HANNAH G. MWANGIKENYAN
LOTFI BACCOUCHEAUSTRALIAN
PATRICIA KIWANUKAKENYAN
JOSEPH LESIEWKENYAN
PROF. J. H. KIMURAKENYAN
GARY PALSERSOUTH AFRICAN
UAP OLD MUTUAL SUBSIDIARIES DIRECTORS
10 UAP OLD MUTUAL GROUP | ANNUAL REPORT & FINANCIAL STATEMENTS 2016

UAP INSURANCE UGANDA
UAP FINANCIAL SERVICES LIMITED (UGANDA) BOARD
UAP LIFE ASSURANCE UGANDA
JAMES MUGUIYIKENYAN
JAMES MUGUIYIKENYAN
KAMAU KURIAKENYAN
PROF. G. WAVAMUNNOUGANDAN \ CHAIRMAN
DR. WILLIAM KALEMAUGANDAN \ CHAIRMAN
JAMES WAMBUGUKENYAN
MARY B. KYEYUNEUGANDAN
SOPHIE NKUUTUUGANDAN
SUZANNE BATWALAUGANDAN
PETER MWANGIKENYAN
JOHANNES !GAWAXABNAMIBIAN
DR GEORGE MUTEMAUGANDAN
ANTHONY GITHUKAKENYAN
DAVID KURIAKENYAN
DAVID KURIAKENYAN
ANDREW KASIRYEUGANDAN
PROF. SAM SEJJAAKAUGANDAN
PROF. SAM SEJJAAKAUGANDAN \ CHAIRMAN
PATRICIA KIWANUKAKENYAN
UAP OLD MUTUAL SUBSIDIARIES DIRECTORS (Cont’d)
11

UAP PROPERTIES LIMITED (UGANDA) BOARD
UAP INSURANCE SOUTH SUDAN LIMITED BOARD
UAP PROPERTIES LIMITED (SOUTH SUDAN) BOARD
JAMES MUGUIYIKENYAN \ CHAIRMAN
PETER MWANGIKENYAN
PETER MWANGIKENYAN
JOHN LAKOSOUTH SUDANESE
NICHOLAS CORBISHLEYSOUTH AFRICAN
KRIS MBAYAKENYAN
PROF. SCOPAS DIMASOUTH SUDANESE
PROF. SCOPAS DIMASOUTH SUDANESE \ CHAIRMAN
WAINAINA KENYANJUIKENYAN
WAINAINA KENYANJUIKENYAN
PHILIP COULSONKENYAN
JAMES MUGUIYIKENYAN
JAMES MUGUIYIKENYAN
PROF. G WAVAMUNNOUGANDAN \ CHAIRMAN
DR. WILLIAM KALEMAUGANDAN
ANDREW KASIRYEUGANDAN
DAVID KURIAKENYAN
BALLA NYERERESOUTH SUDANESE
UAP OLD MUTUAL SUBSIDIARIES DIRECTORS (Cont’d)
12 UAP OLD MUTUAL GROUP

UAP INSURANCE TANZANIA LIMITED BOARD
UAP INSURANCE RWANDA LIMITED BOARD
JAMES MUGUIYIKENYAN / CHAIRMAN
MOSES S KALUWATANZANIAN
YVONNE MAKOLORWANDESE
RICHARD MUGISHARWANDESE \ CHAIRMAN
KEVIN TERRYZIMBABWEAN
WILLIAM ASIKOKENYAN
PERIS KAHUKOKENYAN
NICK ITUNGAKENYAN
PERECE KIRIGITITANZANIAN
JOHN BOSCO BIRUNGIRWANDESE
CHARLES WASHOMATANZANIAN
JOSEPH WEREMATANZANIAN
TICHAONA MAKONESEZIMBABWEAN
SIMON TUMAWAKUDRC
GEORGE ODOKENYAN
JAMES WAMBUGUKENYAN
JACKSON THEURIKENYAN / CHAIRMAN
UAP DRC SARL BOARD
GRANT POTESOUTH AFRICAN
UAP OLD MUTUAL SUBSIDIARIES DIRECTORS (Cont’d)
13ANNUAL REPORT & FINANCIAL STATEMENTS 2016

EXECUTIVE MANAGEMENT
UAP MAURITIUS ENTITIES
SUBSIDIARIES LEADERSHIP TEAM
PETER MWANGIGROUP CEO
ASSAD ABDULLATIFFMAURITIAN / CHAIRMAN
JAMES WAMBUGUMANAGING DIRECTOR,UAP INSURANCE KENYA
TICHAONA MAKONESEMANAGING DIRECTOR,UAP INSURANCE DRC
ISAAC NZYOKAGROUP MD - HEALTH INSURANCE
NICK ITUNGAMANAGING DIRECTOR,UAP INSURANCE TANZANIA
CHARITY WAINAINAHEAD OF MARKETING
JAMES WAMBUGUGROUP MD - GENERAL INSURANCE
FELISTUS KARANJAPRINCIPAL OFFICER,UAP INVESTMENTS KENYA
GRANT POTEGROUP CHIEF OPERATIONS OFFICER
MWANZO MOSETIPRINCIPAL OFFICER,UAP LIFE ASSURANCE KENYA
JERIM OTIENOGROUP MD - LIFE ASSURANCE
SIMON MWEBAZEMANAGING DIRECTOR,UAP FINANCIAL SERVICES UGANDA
JOE MUTUGUGROUP CHIEF FINANCIAL OFFICER
JEAN-CLAUDE PERMAL MAURITIAN
KRIS MBAYAMANAGING DIRECTOR,UAP INSURANCE SOUTH SUDAN
NKIROTE MWORIA NJIRUGROUP COMPANY SECRETARY &LEGAL COUNSEL
JAMES MUGUIYIKENYAN
DAVID KURIAMANAGING DIRECTOR,UAP INSURANCE UGANDA
APOLLO NJOROGEMD - FAULU
KEVIN TERRYZIMBABWEAN
ANTHONY GITHUKAMANAGING DIRECTOR,UAP LIFE ASSURANCE UGANDA
UAP OLD MUTUAL SUBSIDIARIES DIRECTORS (Cont’d)
14 UAP OLD MUTUAL GROUP

You make me feel so alive I can conquer all.
KEEP GOOD COMPANY

Dear Shareholder,
I am pleased to present our financial statements and reports for the year. The group has managed to grow profitability before tax despite operating in a challenging environment.
DR. JOSEPH B. WANJUI CBS

Political EnvironmentIn 2017, Kenya will have its second general election under the Constitution of Kenya promulgated in 2010. The 2013 election process was peaceful marked by steady macroeconomic conditions and decent capital markets performance. In fact, the Kenyan economy registered a GDP growth of 5.9% in 2013 in comparison to a GDP growth of 4.5% in 2012. This illustrates the strengthened capacity of the electoral agencies and dispute resolution mechanisms. Our institutions continue to grow in strength and capacity and we are heartened to note gradual improvements in governance. We are confident that the 2017 election process will be concluded with minimal disruption to business. Additionally, the devolution of governance to the 47 counties in Kenya has created tremendous opportunities for the Group to service Kenyans and we are working to make it as easy as possible for our customers to access our products countrywide.
South SudanViolence broke out in South Sudan in July 2016 plunging the nation into a crisis and disrupting normal business activities. Fortunately, we were able to maintain operations and to support our South Sudanese employees in the immediate aftermath of the fighting and throughout the remainder of 2016. A tentative calm has been restored, but the economic environment has experienced a large decline. In spite of these difficulties, we continue to invest in South Sudan. As a testament to our commitment and support, we have also relocated the head office for the UAP Insurance South Sudan business to UAP Equatoria Tower. UAP Equatoria Tower is our flagship property in Juba, South Sudan and we plan to have an official opening as soon as normality resumes. We remain committed to our customers, employees and stakeholders in South Sudan.
Macroeconomic Environment
1. East AfricaThe East African states experienced mixed fortunes with the latest 2016 GDP statistics indicating a broad slowdown. In Kenya, 2016 GDP growth was 5.8%compared to a revised growth of 5.7% for the same period in 2015 with a rise in economic activity noted in the accommodation and food services, information and communication, real estate and transport and storage sectors. In Tanzania, expansion in the transportation, mining, agriculture and construction sectors contributed to economic growth but Q3 2016 growth was lower at 6.2%compared to 7.3% for the same period in 2015. Similarly, Uganda’s growth in Q2 2016/17 was 0.8% compared to 1.5% in 2015; growth was adversely impacted by poor weather conditions and a struggling banking sector on the back of the Bank of Uganda’s takeover of Crane Bank. Rwanda’s economy grew by 5.9% in 2016, less than the 6.9% growth recorded in 2015 driven by growth in the agriculture, industry and services sectors. The worst economic performance was in South Sudan which contracted with large investors pulling out and non-oil revenues decreasing. Inflation was largely contained in the region with the exception of South Sudan and the DRC.
2. KenyaThe Kenyan economy grew by 5.8% in 2016. Key factors that contributed to the strong growth include adequate rainfall for the better part of the year, consistent agricultural production, low international oil prices and infrastructural development. The CBK and the Treasury were also able to maintain a supportive
Kenya’s GDP is estimated to have grown 5.8% according to the Economic survey 2017 published by the Kenya National Bureau of Statistics (KNBS)
CHAIRMAN’S STATEMENT
17UAP OLD MUTUAL GROUP | ANNUAL REPORT & FINANCIAL STATEMENTS 2016

monetary and fiscal regime that was of particular importance in managing inflation and foreign currency volatility. Leading indicators for the economy signalled underlying resilience throughout the year. The Government of Kenya (GOK) continued its execution of strategic infrastructure projects which will create a more conducive business environment.
However, 2016 also had its fair share of challenges some of which included:
a) The depreciation of the Kenya Shilling towards the end of the year;b) A slow-down in private sector credit growth driven by the passing of the Banking Amendment Act 2016 and a
sharp rise in Non-Performing Loan (“NPL”) ratios for the banking sector; c) The beginning of the drought towards the end of 2016; d) And, a second year of negative performance for the equity markets. The NSE 20 and NASI indices shed 21.1%
and 8.5% respectively in 2016.
Moreover, the Banking Amendment Act 2016 further dampened investor enthusiasm for equities because the Banking sector comprises a significant proportion of the market capitalization of the stock exchange.
The inflation rate in 2016 was within the CBK’s band of 2.5% - 7.5% driven by stable food prices and low oil prices. The annual inflation rate trended downwards from 7.78% in January 2016 to 6.35% in December 2016. With a steady inflation rate, the yield curve normalised in 2016 and fixed income securities provided relief for investors. The government’s appetite for borrowing to finance the budget deficit and increased risk aversion saw investors realign their portfolios and shift to low risk government paper.
Finally, the receivership of Chase Bank in 2016 substantially eroded investor and depositor confidence in Tier II and III banks, as well as microfinance institutions. This, followed soon after by the Banking Amendment Act 2016 was a stress event for the banking sector and the overall economy. Although fewer listed companies issued profit warnings in 2016 compared to 2015, earnings for bellwether corporates illustrate the magnitude of economic challenges facing Kenyan businesses in 2016.
Financial PerformanceI am glad to note that our financial performance was robust marked by continued growth in total income and a recovery in profit. Gross Written Premium grew by 15.0% to close at KES 19.4 billion in 2016. Similarly, our total income grew to KES 19.4 billion, increasing by 17.6% over the prior year due to growth in our revenues and steady investment income. Good expense management resulted in our operational expense growth generally tracking the inflation rate. Our recovery in financial performance in 2016 compared to the previous period enabled us to restore our track record of growing shareholder returns. We registered a 76.1% growth in Profit before Tax (PBT) with 2016 PBT of KES 1.2 billion compared to KES 693 million in 2015. The UAP Old Mutual Group is on a sound footing to support our customers and play a leading role in our country’s development, and in the development of the regional economies.
DividendsThe Board of Directors recommends a dividend of KES 1.70 per share (KES 359 million total payment) with respect to the financial year ended 31st December 2016. I am pleased to note that we have restored our dividend payment in line with our improved financial performance in 2016.
Changes to the Board of DirectorsOur Board of Directors is committed to elevating corporate governance standards so as to support management and staff to fulfil shareholder and stakeholder expectations. I would like to thank our departing Directors, Mr.Ralph Mupita and Mr. Tavaziva Madzinga, for their contribution to the Board. They were instrumental in the successful merger of UAP and Old Mutual and they showed us their continued support throughout the process. We wish them all the best in their future endeavours. I also take this opportunity to welcome Mr. Jonas Mushosho to the Board. Mr. Mushosho is the Chief Executive of the Old Mutual business in the Rest of Africa outside South Africa.
CHAIRMAN’S STATEMENT (CONT’D)
2. Kenya (continued)
18 UAP OLD MUTUAL GROUP

UAP Old Mutual Merger UpdateThe integration of the UAP and Old Mutual entities in East Africa continues apace and we have made substantial gains in beginning the realisation of revenue and cost synergies. To this end, we wish to conclude the shareholder and regulatory approval processes for the merger and I ask for your support. Our ultimate goal is to reorganise the UAP and Old Mutual businesses under one holding company, UAP Holdings Limited (UAPHL), so that we can augment our operating and financing capacity. This process entails the acquisition of the Old Mutual subsidiaries and the merger of some of these entities particularly the Life and Asset Management businesses. The merger will position us as a leading provider of Integrated Financial Services in East Africa.
We anticipate that we shall table the full details of the transaction including the rationale, consideration, valuation and timelines through a Shareholders’ Circular to be distributed to all shareholders and thereafter, an extra-ordinary general meeting will be called during the second half of 2017 to approve these transactions.
We believe these transactions will enhance shareholder returns and better position the Group for future initiatives including an eventual listing on the Nairobi Securities Exchange (NSE).
An Update on Managed SeparationThe business strategy announced in 2016 aimed at conducting a managed separation of the wider Old Mutual Group’s four businesses remains on track to be substantially completed by the end of 2018. The process will result in four standalone businesses which will include Old Mutual Emerging Markets (“OMEM”), US-based Old Mutual Asset Management (“OMAM”), Old Mutual Wealth (“OMW”) and Nedbank.
Managed Separation aims to deliver value through:
1. the removal of Old Mutual Plc central operational costs;2. unlocking the conglomerate discount; 3. delivering enhanced performance of the underlying businesses.
Old Mutual Emerging Markets’ (OMEM) future focus will be on sub-Saharan Africa and, following a review of its business, OMEM will be implementing a new target operating model designed to deliver meaningful cost savings and build a foundation for cost discipline while delivering business growth. We welcome the renewed focus from Old Mutual Plc and OMEM and look forward to a beneficial collaboration to reward our shareholders.
OutlookKenya’s investment profile continues to rise with a better governance framework, a more inclusive democracy, stable fiscal and monetary management, efficient regulation and a growing middle class among others. Furthermore, our insurance penetration rate currently stands at approximately 3% meaning that with consumer education and the development of good products we will grow our revenues and profits. Other opportunities include Marine insurance in Kenya following the Government of Kenya directive that importers insure their marine cargo locally.
Rwanda’s outlook is positive with the only possible risk being the general election in 2017. Additionally, the Rwandan Government’s reliance on external funding means that its relations with donors will determine its ability to invest in the economy. For Uganda, continued investment in infrastructure, good weather and the restoration of credit growth could catalyse economic performance. With regards to Tanzania, the extraction of the enormous reserves of natural gas has the potential to radically transform the economy by providing a cheap source of power. Improvements in the political and security conditions in South Sudan will restore stability and confidence. As a whole, East Africa has significant potential and the Group plans to participate fully in the region’s economic development.
CHAIRMAN’S STATEMENT (CONT’D)
19ANNUAL REPORT & FINANCIAL STATEMENTS 2016

I wish to thank my fellow directors for their effective oversight throughout the year; management and staff for their hard work; and, our intermediaries, partners, regulators and other stakeholders. I also thank our customers for their continuous support.
AppreciationIn closing, I thank our shareholders for their patience as we work to increase our returns. We look forward to a vibrant 2017 and wish our customers, shareholders, intermediaries and other stakeholders all the best.
Dr. J. B. Wanjui CBSGroup ChairmanUAP Old Mutual Group
CHAIRMAN’S STATEMENT (CONT’D)
20 UAP OLD MUTUAL GROUP

You make me do everythingthat was once but just a dream.
KEEP GOOD COMPANY

CHAIRMAN’S STATEMENT
“I am glad to report that we have made substantial progress in the combination of our UAP and Old Mutual businesses.”
PETER MWANGI

Dear Shareholder,It is my pleasure to present this report on the progress we have made over the last year. The FY2016 was the first full financial year since the acquisition of our business by Old Mutual in June 2015. Over the course of 2016 we have made significant progress in the execution of our strategy, making operational improvements across the Group and improving financial performance. Our business proved resilient in the face of significant challenges in the Kenyan economy particularly in the banking sector and the capital markets, and political instability in South Sudan. Despite the difficult operating environment, we posted solid financial performance with strong recovery in profit before tax driven by continued revenue growth, disciplined cost control and steady investment income.
Strategic ReviewOur strategic intent is to create an East African financial services champion. We have developed a 5-year strategy spanning the period to 2020 and 2016 was the first year of implementation. The strategy will focus on:
• Maintaining current growth to improve market share across all our lines of business;
• Strengthening key areas of the value chain in our core businesses;
• Rationalization of our operations to focus on the key profit generators and exiting from marginal businesses;
• Strengthening our balance sheet to ensure we are well capitalised to support our growth ambitions;
• Acceleration of the realisation of both revenue and cost synergies from the combination of the UAP and Old Mutual businesses; and
• Innovation for growth by introducing new products and distribution models.
A key plank of our strategy is completion of the merger process for our businesses and rationalization of our marginal operations. On the merger front we have made substantial progress in the combination of the UAP and Old Mutual businesses.
As mentioned in the Chairman’s Statement and as is also explained in detail in the shareholder circular we expect to complete these transactions in the course of the second half of this year subject to your approval as shareholders at an extra-ordinary general meeting and the approval of our various regulators. It is our expectation that these transactions when complete will support the creation of increased shareholder value and therefore I urge you to support the proposals.
Gross Written Premium (“GWP”) – KES Bn
Net Earned Premium (“NEP”) – KES Bn
Net Claims Payable – KES Bn
Profit Before Tax – KES Bn
GCEO’S STATEMENT
23ANNUAL REPORT & FINANCIAL STATEMENTS 2016

On the rationalization front we have undertaken a review of the operations within the Group and identified the insurance brokerage business in the Democratic Republic of Congo as non-core given that it is not aligned to our core underwriting offering. For this reason we will be seeking your approval for us to exit from this business.
We achieved several notable milestones in our journey towards the creation of an integrated financial services group. We are now able to better provide our customers with seamless access to financial products and services that meet all their needs under one roof. The following achievements were key steps towards the realisation of a “one-stop shop” for our customers:
• The establishment of a branch in Kimathi House in Nairobi manned by staff from UAP, Old Mutual and Faulu who are able to sell our entire range of insurance and banking products;
• The expansion of Faulu product offerings to include Visa branded debit cards and countrywide ATMs;• The completion of UAP Old Mutual Tower and the phased relocation of our head office staff starting in December
2016 which is expected to be complete within the first half of 2017;• The launch of the UAP Old Mutual Brand thematic campaign dubbed “Keep Good Company” which was well
received by the market;• And, the launch of M-Tiba, a mass market health product developed in collaboration with Safaricom and Carepay.
M-Tiba has had good customer uptake and will be enhanced and ramped up in 2017.
Operating Environment2016 was a challenging year for the financial services sector especially in Kenya. Although industry Gross Premiums increased for both General and Life Insurance – 8.51% and 19.30% respectively – underwriting profits for the industry declined and investment income supplemented underwriting activities. Capital markets also performed poorly with equities experiencing negative returns for the second consecutive year but returns from interest bearing assets offset the declines from equities. Despite these challenges, we managed to grow our revenues putting us in a good position within the industry. Even so, we recognise that we must work harder to translate top-line growth to better bottom-line performance and improved shareholder returns.
South SudanNotwithstanding the deterioration in the security situation of the country, our South Sudan business contributed strongly to our revenue and profits for 2016 and remains an integral part of our East African strategy. The UAP Old Mutual Group operates a full-fledged insurance business with complementary investments in property within the capital Juba. We remain committed to our business and look forward to harnessing the investment and business potential of South Sudan and its people.
Financial PerformanceOur financial performance was resilient with continued growth in revenues, investment income, good expense control and a recovery in Profit Before Tax (PBT).
PBT recovered to Kes. 1.2 billion in 2016, a growth of 76.1% from Kes. 0.7 billion in 2015. The improvement in PBT is attributed to the following:
i. Actions to support overall business growth including diversifying the product portfolio particularly growing of the non-motor insurance book;
ii. Although our net claims increased, short term loss ratios declined as a result of claims review exercises, review of underwriting practices and better claims management;
iii. Tactical asset allocation that saw us increase our allocation to interest bearing assets and decrease our equities exposure.
These actions mitigated the impact of the tough business environment. However, our Profit After Tax (PAT) dipped slightly by 7.9% to Kes. 825.8 million compared to Kes. 896.6 million in 2015. The main reason for the decline was a significant tax credit in 2015 not enjoyed in 2016. All in all, the Group has delivered a robust set of results for 2016.
GCEO’S STATEMENT (CONT’D)
24 UAP OLD MUTUAL GROUP

OutlookWe are cautiously optimistic that the operating environment going forward will be supportive of growth. The regulatory regime is stable and we have good rapport with key regulatory bodies in the East African region. We will work with the regulators to participate in the development of the insurance sector and the overall investment climate. We are adequately capitalized and able to meet the capital requirements as stipulated by the Insurance Regulatory Authority (IRA) in Kenya particularly as it rolls out the Risk Based Capital (RBC) framework. We are similarly well prepared in the other countries as other insurance regulators adopt this framework across East Africa.
Our key areas of focus in the period ahead will include:
iv. Building out the Integrated Financial Services construct – Enrichment of our value propositions and customer experience improvements as we execute our one-stop shop strategy for financial services;
v. Completing the Merger Transactions – Finalisation of the acquisition of the Old Mutual subsidiaries followed by the mergers of our Life and Asset Management businesses in Kenya;
vi. Improving Efficiency – Making strategic investments in technology and prudent cost management to improve cost-to-income ratios across all our businesses;
vii. Continuous Innovation – Developing more relevant products and services delivered through convenient and cost effective distribution channels;People – Prioritize having the right people because talent is a key enabler of our business strategy.
It is our expectation that successful execution of these strategic initiatives will move us closer to realising our ambition to grow into the pre-eminent Integrated Financial Services provider in East Africa.
AppreciationI wish to thank management and staff for their dedication and hard work. I thank the Board of Directors, the regulators, our partners, intermediaries and other stakeholders. I thank our customers for trusting us as their financial partner, to assist them plan to for their future and to meet their needs for financial services. Finally, I thank you the shareholder and reiterate our commitment to meet your expectations in 2017 and beyond.
Peter K. MwangiGroup Chief Executive OfficerUAP Old Mutual Group
GCEO’S STATEMENT (CONT’D)
25ANNUAL REPORT & FINANCIAL STATEMENTS 2016

2016

CORPORATE GOVERNANCE REPORTFOR THE YEAR ENDED 31 DECEMBER 2016

INTRODUCTION
2016 marked the first full year of operation post Old Mutual’s acquisition of a 60.67% stake in UAP Holdings Limited (“The Group”).
During the year, the Group’s strategic focus was “Becoming the Financial Services Champion in Eastern Africa”. In approving this strategic direction, the Board determined that the execution of the strategy would only be enabled by adherence to the robust corporate governance framework and practices that were rolled out and adopted in 2015. The Group Strategy was impacted by the macro-economic developments in the East African region and in particular, one of the commercial banks in Kenya being put under receivership - Chase Bank (K) Limited (In Receivership) and the increased focus and scrutiny from the Regulators emanating from the introduction of the risk based supervision regime and the increasing impetus to ensure financial stability in the region. The Board and senior management remained intently focused on these emerging issues.
The Group’s corporate governance practices provide the foundations for effective decision making and accountability. We are pleased to present our 2016 Corporate Governance Statement which details our key governance practices at UAP Holdings Limited. This statement has been approved by the Board and is current as at 8th March 2017. In 2016, the Group complied with the Companies Act 2015 and the Capital Markets Authority Corporate Governance Principles and Regulations.
References in this Statement to 2016 mean the year ended 31st December, 2016. Unless otherwise indicated, references to the UAP Holdings Group, mean UAP Holdings Limited and all its subsidiaries. In connection with our Financial Statements for 2016, the Board has received an audit opinion from the auditors of the company, KPMG East Africa.
CORPORATE GOVERNANCE REPORTFOR THE FINANCIAL YEAR ENDED 31 DECEMBER 2016
Directors following the proceedings during the UAP Old Mutual Group Board Engagement and Strategy session on 21st June 2016.
28 UAP OLD MUTUAL GROUP

CORPORATE GOVERNANCE REPORT (CONT’D)
2.1. Board Functions and Responsibilities
The Board is responsible for the formulation, implementation and monitoring of the Group’s Strategic Plan thus providing appropriate strategic direction for the Group. In the same vein, the Board defines the Vision, Mission and Core Values to enable realisation of the set strategic plan. The Board has delegated the day to day operations of the Group to Management which is headed by the Group Chief Executive Officer. The Group’s business is therefore conducted in accordance with a carefully formulated strategy, annual business plans and budgets which set out clear objectives. Roles and responsibilities have been clearly defined with approved authority delegated. Performance against the objectives is reviewed and discussed monthly and quarterly by the management teams in the Group.
The Managing Directors/Chief Executive Officers and General Managers as well as their respective Management teams prepare an annual business review report which is presented to the Group Board during its annual retreat for consideration and approval. Each subsidiary board is expected to monitor the performance of each subsidiary. Consolidation of the financial position is undertaken on a quarterly basis and presented to the Board. Through this processes performance trends, forecasts as well as actual performance against budgets and prior periods are closely monitored by Management.
The Board ensures that the Group espouses proper corporate governance practices by confirming that the requisite codes of conduct, procedures and practices are existent, relevant and adhered to. The Board also achieves this by ensuring that the Group complies with all the statutory requirements.
The Board is responsible for managing the Group’s risks and the Board and Management have been trained on risk management.The Board recognises and honours its responsibility to its stakeholder and in this case Board Members are fully aware of their responsibility to discharge their function in good faith, with prudence, diligence and due care. The overall functions of the Board are as follows:
FUNCTION DETAILSStakeholder Management Enhancing long-term shareholder returns and safeguarding the
interests of stakeholders including customers, suppliers, employees and the communities in which we operate.
Strategy Ensuring that the Group has the appropriate resources to deliver the strategy and business plans.
Performance Reviewing Business Results.Monitoring Budgets.
Integrity of External Reporting Reviewing and monitoring - with the guidance of the Audit Committee, the processes - controls and procedures in place to maintain the integrity of accounting and financial records and statements.
Risk Management and Compliance Reviewing and monitoring with the guidance of the Risk Committee, the risk management profile and processes for compliance in line with regulatory requirements.
Executive Review and Succession Planning Approving key executive appointments and remuneration, monitoring and reviewing executive succession planning and diversity.Reviewing and monitoring the performance of the Group CEO and senior management.
29ANNUAL REPORT & FINANCIAL STATEMENTS 2016

Our Board provides overall strategic direction for the UAP Old Mutual Group, and represents and serves the interests of our shareholders through the creation of sustainable value.
UAP HOLDINGS BOARD OF DIRECTORS
30 UAP OLD MUTUAL GROUP

STANDING FROM LEFT TO RIGHTPeter De Beyer | Dr Peter W Muthoka | Paul Truyens | Susan Omanga | Peter MwangiDr. Joseph Barrage Wanjui | James Muguiyi | James Wambugu | Anisha ArcharyMike Harper | Rose Ogega | David Marshall
SEATED FROM LEFT TO RIGHTJonas Mushosho | AK Maina
31ANNUAL REPORT & FINANCIAL STATEMENTS 2016

The Board’s composition is driven by the following Principles which are set out in the Board Charter:
• The Board will be of an appropriate size to allow efficient decision making;• The Board must be comprised of at least one third independent non-executive directors;• The Board should consist of directors with a broad range of expertise, skills and experience from a diverse range
of backgrounds, including sufficient skill and experience appropriate to the Group’s business.
Newly appointed directors are required to stand for re-election by the Shareholders at the next Annual General Meeting. Re-election of a director is undertaken in accordance with UAP Holdings’ Memorandum and Articles of Association.
The following changes to the composition of the Board have occurred within 2016:
2.2. Board Composition & Board Skills Matrix
NAME OF BOARD MEMBER
MEMBERSHIP PROFESSION NATIONALITY
Dr. Joseph Barrage Wanjui Chairman Engineer/ Entrepreneur KenyanMr. Peter De Beyer Deputy Chairman Actuary South AfricanMr. James Muguiyi Non-Executive Member Finance/Insurer KenyanDr. Peter Wanyaga Muthoka Independent, Non-Executive Member Management Consultant KenyanMr. Ralph Mupita Non-Executive Member Engineer ZimbabweanMr. Tavaziva Madzinga Non-Executive Member Actuary ZimbabweanMr. David Marshall Non-Executive Member Accountant South African/BritishMs. Rose Ogega Independent, Non-Executive Member Accountant/ Financial Consultant KenyanMs. Susan Omanga Independent, Non-Executive Member Marketer Kenyan Mr. Paul Truyens Independent, Non-Executive Member Actuary DutchMr. Mike John Harper Independent, Non-Executive Member Actuarial Science South AfricanMr. James Wambugu Executive Member Audit and Risk Management KenyanMr. Atanas Kariuki Maina Non-Executive Member Advocate KenyanMr. Peter King’ori Mwangi Group Chief Executive Officer/Executive
MemberEngineer Kenyan
Ms. Anisha Archary Non-Executive Member Human Resource Specialist South African
APPOINTMENTSMr. Jonas Mushosho Non-Executive Member Accountant Zimbabwean
RESIGNATIONSMr. Tavaziva Madzinga Effective 30th September 2016Mr. Ralph Mupita Effective 31st January 2017
CORPORATE GOVERNANCE REPORT (CONT’D)
32 UAP OLD MUTUAL GROUP

Board Skills MatrixThe Board’s Corporate Governance and Nominations (CGN) Committee undertakes a continuous review of Board composition using a matrix to assess the skills and experience of each director and the combined capabilities of the Board. Where a Board vacancy is anticipated, the CGN Committee assesses the skills and experience required and then identifies suitable candidates using external consultants as appropriate. The most suitable candidate is appointed by the Board after appropriate checks are undertaken. The Group has formal letters of appointment for its directors, setting out the key terms and conditions of their appointment.
During the year under review, the Committee with the assistance of an external consultant, undertook a Non-Executive Director search process to provide a pipeline of potential candidates the Group could tap into for appointment across the East Africa business.
The skills matrix below demonstrates alignment of the Board’s responsibilities with the current skills mix. The Board is confident that this mix results in an appropriate mix of experience and expertise, and a diverse range of views and perspectives for effective governance, oversight and strategic leadership of the Group.Candidates were solicited based on the following and other relevant considerations:
SKILL CATEGORY EXPLANATIONStrategy Development and oversight of execution of strategic objectives.
Financial Acumen Analysis of key financial statements, assessment of financial viability and performance, contribution to strategic financial planning, ability to oversee funding arrangements and accountability.
Actuarial Management Provide oversight and steer development of risk management strategies in respect of the long and short-term businesses.
Risk Management Oversight of risk frameworks and practices which identify and manage key risks.
Marketing Brand promotion and preservation, strategic planning and providing oversight on organisationsal crisis management plans.
People and Remuneration Oversight over the Group’s talent management framework including reward and succession planning.
Legal and Compliance Oversight of operations and obligations in a highly complex and regulated environment.
Corporate Governance Commitment to the highest standards of governance.
CORPORATE GOVERNANCE REPORT (CONT’D)
33ANNUAL REPORT & FINANCIAL STATEMENTS 2016

2.3. Board CommitteesIn order to discharge its mandate, the Board has established the following committees:
• Audit Committee;• Risk and Compliance Committee;• Remuneration Committee;• Corporate Governance and Nominations Committee;• Customer Affairs Committee;• Integration Committee;• UAP Tower Committee (ad hoc);• Project Saffron Independent Oversight Committee (ad hoc).
The Board has adopted Terms of Reference for each Committee setting out its responsibilities and composition. The Board receives a copy of the Committee’s report and minutes of each Committee meeting.
AUDIT COMMITTEE
RISK COMMITTEE
REMUNERATION COMMITTEE
CORPORATE GOVERNANCE & NOMINATIONS COMMITTEE
CUSTOMER AFFAIRS COMMITTEE
INTEGRATION COMMITTEE
Membership as at 31st December 2016
Rose Ogega (Chair)Peter De BeyerPaul TruyensSusan Omanga
Paul Truyens (Chair)Peter De BeyerRose OgegaJames MuguiyiPeter Mwangi
Dr. Peter Muthoka (Chair)Jonas MushoshoJames MuguiyiAnisha Archary
Peter De Beyer (Chair) Dr. JB WanjuiDr. Peter MuthokaA K MainaAnisha Archary
Mike Harper (Chair)Anne MutahiJames Wambugu
Jonas Mushosho (Chair)Dr. JB WanjuiJames MuguiyiDavid Marshall
CORPORATE GOVERNANCE REPORT (CONT’D)
Standing from Left to Right: Dr. P. Muthoka, P. De Beyer, Hon. Ngenye Kariuki, C.S. Joe Mucheru, CBK D.G. Sheila M’Mbijjewe and Group Chairman Dr. JB. Wanjui at the farewell cocktail for outgoing UAP Old Mutual Directors Hon. Ngenye Kariuki, Joe Mucheru and Sheila M’Mbijjewe at the Crowne Plaza Hotel on 22nd June, 2016.
34 UAP OLD MUTUAL GROUP

The Board has two ad hoc Committees: The UAP Tower Committee and the Project Saffron Independent Oversight Committee. The UAP Tower Committee was set up to provide oversight to the construction of the largest capital investment in the Group: The UAP Old Mutual Tower. Upon full handover of the project, the Committee shall be considered to have duly discharged its mandate. As such in November 2016 the Board decided to stand down its UAP Tower Committee as the construction of the UAP Tower, which it was established to monitor was largely complete.
The Project Saffron Independent Oversight Committee was set up as part of requirements under the Capital Markets Act which requires that an independent committee should be set up where a company intends to undertake transactions between related parties. During the year in review, the UAP Holdings Board, through the Project Saffron Committee, considered reorganisation of the legal structures of the UAP and Old Mutual Kenya entities. The exercise is expected to come to an end within 2017 at which point the Committee shall be considered to have duly discharged its mandate.
2.3.1. Audit Committee The Chair of the Audit Committee, Ms. Rose Ogega, is a Certified Public Accountant [CPA (k)]. The Chair is not an auditor nor accountant for the Company. The Committee meets at least four (4) times a year or at such other times as the Chairman of the Committee shall require.
In addition to the foregoing, the Audit Committee is responsible for the selection, evaluation, compensation and where appropriate, replacement of the external auditor. The external auditor, KPMG (East Africa) attends the Annual General Meeting (AGM) and is available to answer shareholder questions regarding aspects of the external audit and their report. Details of the fees paid to the External Auditors are set out within the 2016 Annual Financial Report.
The Audit Committee is also responsible for assessing whether the Internal Audit function is independent of management and is adequately resourced and funded. Internal and External Audit operate, perform and report as separate, independent functions.
Roles and ResponsibilitiesThe Audit Committee Charter sets out the responsibilities of the Committee members. The key responsibilities are to provide oversight on the following:
a) The integrity of the financial statements;b) The auditor’s qualifications and independence;c) The performance of the Group’s Internal Audit Function and the external auditors;d) The compliance by the Group with legal and regulatory requirements;e) The effective management by the Group of financial risks;f) Review the adequacy and effectiveness of UAP’s Internal Control and financial controls systems.
Key Activities Undertaken During 2016The Audit Committee met six (6) times in the year 2016 with senior representatives from KPMG and Internal Audit attending every scheduled meeting, and the key activities undertaken included:
• Review and approval of the 2016 plans of the external and internal auditor and providing oversight on the work performed throughout the year;
• Review of Audit reports from all subsidiary Audit and Risk Committees within the Group;• Review of significant accounting, financial reporting and other issues raised by management, Internal Audit and
the External Auditor;• Review and recommendations to the Board for the adoption of the Group’s half-year and annual financial
statements;• Consideration and recommendations to the board on significant accounting policies and areas of accounting
and judgment including those related to accounting for provisions for bad and doubtful debt.
CORPORATE GOVERNANCE REPORT (CONT’D)
35ANNUAL REPORT & FINANCIAL STATEMENTS 2016

2.3.2. Risk and Compliance Committee The Group’s Risk Committee supports the Board by providing oversight to the Group’s risk profile in the context of the Board approved risk appetite and making recommendations regarding future risk appetite and in particular risks or risk management practices. This includes reviewing (at least annually) management’s plans for risk mitigation, monitoring the implementation and operation of the risk management framework and internal compliance and control systems, and stress testing the risk portfolio through scenario and sensitivity analysis. The Board through the risk Committee promotes awareness of a risk based culture within the Group. Mr. Paul Truyens is the current Chair of the Committee.
The Chief Risk Officer attends every scheduled Risk Committee Meeting to provide a report which includes updates on identified material risk categories, the Group’s capital and liquidity position. In addition, the Committee also receives and reviews the Risk Committees reports from all subsidiary companies within the Group.
CORPORATE GOVERNANCE REPORT (CONT’D)
36 UAP OLD MUTUAL GROUP

Roles and ResponsibilitiesAs set out in the Risk Committee Charter, the key obligations of the Committee include:• To review, approve and recommend to the Board for approval the system of governance, including the risk
management system, processes, methodologies and tools, and the Combined Group’s internal model, including the internal capital model;
• To monitor and express an opinion to the Board on the adequacy and effectiveness of the systems of governance and risk management, and the internal model;
• To review and express an opinion to the Board on annual operating plans for the Group’s overall risk management, forensics, compliance and second line of defence actuarial function, ensuring these functions are adequately resourced and have appropriate standing within the organization;
• To review, approve and recommend to the Board for approval the methodologies used to identify, assess, measure, monitor and report on risks, including methods used for the calculation of risk exposures, capital requirements, scenario analysis and stress testing, and the identification and recording of actual losses;
• To Review, monitor and challenge the actual assessment and reporting of risks, trends and concentrations, including risk profiles, exposures, capital requirements, risk events, assessments and indicators and any associated attestations and letters of representation.
Key Activities Undertaken During 2016The Risk Committee met four (4) times during the year. The key activities included:
• Review of the key risks and risk management framework;• Review of the Group’s Capital Adequacy framework;• Review of declarations and assurances from Internal Audit in relation to effectiveness of internal controls and
risk management framework;• Review of Risk Reports from subsidiary Board Committee meetings.
2.3.3. Remuneration Committee The Remuneration Committee supports the Board by reviewing and assessing the Group’s remuneration policies and practices in the context of the regulatory environment and the enhancement of corporate and individual performance. Dr. Peter Muthoka is the current Chair of the Committee. The Committee meets at least four (4) times a year or at such other times as the Chairman of the Committee shall require.
Roles and ResponsibilitiesAs set out in the Remuneration Committee Charter, the key roles and responsibilities of the Committee are as follows:a) Set review and make recommendations to the Board on the remuneration and benefits arrangements of non-
executive directors; b) Set, review and make recommendations to the Board for approval, the Combined Group remuneration and
benefits philosophy, policies and practices;c) In conjunction with the Board, approve the Directors’ Remuneration Policy and/or Annual Remuneration Statement
to be included in the Annual Financial Statements report having regard to the fulfilment of the provisions of the Capital Markets Authority or securities disclosure requirements;
CORPORATE GOVERNANCE REPORT (CONT’D)
37ANNUAL REPORT & FINANCIAL STATEMENTS 2016

a) Determine the remuneration, incentive structure and benefits of the Group Chief Executive Officer and members of the Executive Leadership Team as recommended by the Group Chief Executive Officer based on an evaluation of their performance;
b) Establishing annual and long-term performance goals and objectives for the Group Chief Executive Officer and reviewing the goals approved by the Group Chief Executive Officer for the members of the Executive Leadership Team.
Key Activities Undertaken in 2016• Review and recommendation to the Board on the incentives, including long term incentive plan payable to
senior executives;• Review and recommendation to the Board of non-executive directors’ fees, including for subsidiary companies;• Approval of harmonized Human Resource Policies for implementation across the Group;
• Oversight of the Group’s performance management framework.
2.3.4. Corporate Governance and Nominations CommitteeThe Corporate Governance and Nominations Committee supports the Board by monitoring the size and composition including succession planning for directors and senior management, evaluation Board Committee and individual director performance and providing oversight to the Board’s professional development. Mr Peter De Beyer is the current Chairman of Corporate Governance and Nominations’ Committee.
Roles and ResponsibilitiesAs set out in the Corporate Governance and Nominations Committee Charter, the key roles and responsibilities of the Committee are as follows:a) Assist the Board in its determination and evaluation of the adequacy, efficiency and appropriateness of the
corporate governance structure and practices of the Combined Group;b) Provide guidance to the Board on strategy in regard to sound Corporate Governance in the Group’s investments
as deemend appropriate and relevant;c) Make recommendations to the Board on sound Corporate Governance practices in the Combined Group, and
to the extent relevant or appropriate;d) Promote the overall effectiveness of Corporate Governance within the Group, and to the extent appropriate
or relevant, its investments, in accordance with the recommendations of the relevant local and international reports on best practice corporate governance and other requirements of good corporate practice other than in respect of risk management, compliance and internal control which remain the remit of the Audit and Risk and Compliance Committee.
Principal Activities Undertaken in 2016i) Assessment of the appropriate size and composition of the Board and its Committees;ii) Succession planning for non-executive directors, together with making recommendations to the Board on the
appointment of new directors;iii) Approval of methodology for the annual Board performance review.
CORPORATE GOVERNANCE REPORT (CONT’D)
38 UAP OLD MUTUAL GROUP

2.3.5. Customer Affairs CommitteeThe Customer Affairs Committee supports the Board by assisting in the identification, evaluation and monitoring of customer trends, issues and concerns in a bid to position the Group to anticipate and adjust to customer needs and preferences. The Committee Chair is Mr. Mike Harper.
Roles and ResponsibilitiesThe Customer Affairs Charter sets out the Key Roles and Responsibilities as follows:
a. Provide input into the development and the monitoring of the Group Customer Strategy, and review and report to the Board on the impact of such on customer value and fair treatment of customers;
b. Play an important role at the time of strategy and plan creation by reviewing and providing input into the consideration of the customer environment, as part of the strategy creation and plan formulation processes for the Group Customer Strategy;
c. Provide oversight regarding the extent to which the UAP Old Mutual Group is implementing fair treatment of its customers through the implementation of applicable Treating Customers Fairly Frameworks;
d. Review the practical results of the implementation of TCF outcomes to ascertain whether they are aligned with the TCF goals;
e. Consider the market conduct Principles and explicit rules underpinning TCF and ensure that measures implemented by UAP Old Mutual Group pursuant to TCF requirements, generate the benefits envisaged.
Key Activities Undertaken Within the Year1. The Committee adopted the Terms of Reference and defined its key objectives.2. Members reviewed the Treating Customers Fairly Principals as they apply to the Group and set out action items,
monitoring framework and key reporting items.
CORPORATE GOVERNANCE REPORT (CONT’D)
39ANNUAL REPORT & FINANCIAL STATEMENTS 2016

2.4. Board Meetings and Information to DirectorsThe Board meets at least once every quarter but the business may warrant the convening of special meetings from time to time. All Board meetings are scheduled in advance of the respective year through an Annual Calendar of Board Meetings including a rolling calendar, which facilitates planning and availability of the members. Board Committee meetings are scheduled in advance of the Board Meeting so that all technical matters are appropriately addressed and reported to the Board for ratification or approval.
The directors are given appropriate and timely information on key activities of the business regularly and on request in order to carry out their roles. Specifically the directors are provided with all available information in respect of items to be discussed at a meeting of the Board or Committee prior to the meeting. They may also seek independent professional advice, at the Company’s expense, concerning the affairs of the Group in consultation with the Group Chief Executive Officer and the Group Company Secretary.
2.5. Director IndependenceThe Board’s composition adheres to the requirements of independence as set out in the Capital Markets Act, Code of Corporate Governance Practices. The Board is satisfied that each non-executive director who has served on the Board during 2016 has retained independence of character and judgement.
2.6. Conflicts of Interests The Group Board Charter places an obligation on Directors to make declarations on their personal or commercial interests with a view of avoiding any action, position or interest that conflicts or appears to conflict with a Group interest. This is a matter for active and ongoing consideration by all directors, and thus a standard declaration form has been developed for recording and updating directors’ interests as they occur and on an annual basis.
2.7. Director Induction Each new director is provided with an orientation program which includes discussions with executives and management, briefings and workshops on the Group’s strategic plans, risk management strategy and framework, significant financial accounting and risk management matters, compliance programs, internal and external audit programs and director’s duties and responsibilities.
2.8. Board Performance Directors are expected to prepare adequately for, attend and participate in Board and Committee Meetings. The Board has put in place a performance evaluation system to enable it set its objectives and review its performance annually against these objectives. Due to the number of changes effected in the governance structures during the period under review, the Board held a strategy session on 21st and 22nd June 2016 to set out the strategic objectives against which it would be evaluated in 2017. The performance and evaluation tools were developed and approved in the period under review and the exercise would be conducted and the results communicated to the Board through the approved process.
2.9. Board AttendanceDuring the Financial Year under review eight (8) Board Meetings [4 being ordinary board meetings and 4 being special board meetings] and forty (40) Committee Meetings were held. A review of attendance to meetings by individual members during the period under review indicates that all members gave sufficient time and attention to the affairs of the Board. The highest level of individual attendance was 100% of eligible board meetings and the lowest level of attendance was 55% of eligible meetings, with an average of 78.97% attendance across the current membership of the Board. This marks an 8.23% improvement in the average attendance for the Board compared to prior year.The Board members gave prior notice of inability to attend and gave meaningful input on the agenda items as appropriate.
CORPORATE GOVERNANCE REPORT (CONT’D)
40 UAP OLD MUTUAL GROUP

2.10. Board Development Board development needs were identified and/or analysed for each Member and for the Board as a whole during the period under review. Thereafter, the Board would be developed in accordance with the Board induction and development plan to address areas of improvement for individual members and to provide up to date information on new areas of business and risk for the group including: - corporate governance training, risk management training, training on anti-money laundering legislation as well as training on the Group Operating Model.
The Company values the input of the shareholders and engages directly with them when making any revisions to the Board remuneration package which is approved by the shareholders at the Annual General Meeting of Members.
2.11. Statement of Compliance The Board is satisfied that the Group has, to the best of their knowledge, complied with all applicable laws and conducted its business affairs in accordance within the law. In accordance with the Group Operating Model, the Board has reviewed the attestation of Management in this regard and to the knowledge of the Board no director, employee or agent of the Group acted or committed any indictable offence under the Anti-Corruption laws in conducting the business of the Group in the period under review nor was involved or been used as a conduit for money laundering or any other activity incompatible with the relevant laws.
The Board continues to abide by its Charter, the internal codes of conduct, the Memorandum and Amended Articles of Association of the Company and the Terms of Reference of Board Committees. The Group continues to comply with all the statutory requirements relevant to its operation as a body corporate and complies with relevant regulatory guidelines as issued from time to time.
2.12. Group Company SecretaryThe Group Company Secretary co-ordinates the Board activities and ensures, in conjunction with the Chairman and Group Chief Executive Officer, that the Board meetings are held procedurally. The Group Company Secretary links flow of information between the Management and the Board as well as ensures the Board receives adequate and timely information and that Management receives feedback in a similar manner.
All Board Members have direct access to the Group Company Secretary who is also responsible for implementing and monitoring good corporate governance practices at the Board. The Secretary ensures that the business of the Board meets all statutory requirements, keeps all legal and regulatory requirements under review and briefs the Board accordingly about these developments. In the year under review, the Group Company Secretary assisted by the Deputy Group Company Secretary performed this function.
CORPORATE GOVERNANCE REPORT (CONT’D)
41ANNUAL REPORT & FINANCIAL STATEMENTS 2016

2.13. ShareholdingAt 31 December 2016, the top ten shareholders in the Company were:
NO. OF SHARES HOLDINGS %1 OLD MUTUAL HOLDINGS LIMITED 78,919,889 37.33%
2 OLD MUTUAL LIFE ASURANCE COMPANY (SOUTH AFRICA) 49,332,445 23.33%
3 BAWAN LTD 43,258,299 20.46%
4 JAMES NGATIA MUGUIYI 12,611,247 5.97%
5 ESTATE OF THE LATE WILLIAM KIMUTAI MARTIN 2,341,480 1.11%
6 ANDREW STEPHEN GRAY SMITH 1,789,189 0.85%
7 GENGHIS NOMINEES A/C 017 1,544,900 0.73%
8 STANDARD CHARTERED NOMINEES A/C 9230 1,403,000 0.66%
9 TIMOTHY MICHAEL JOHN OWEN-BURKE 1,371,562 0.65%
10 SAYANI INVESTMENTS LIMITED 1,194,957 0.57%
CORPORATE GOVERNANCE REPORT (CONT’D)
42 UAP OLD MUTUAL GROUP

Distribution of Shareholders as at 31-Dec-2016
CORPORATE GOVERNANCE REPORT (CONT’D)
SHARES RANGE SHAREHOLDERS SHARES SHARES %
01 - 100000 1,035 7,359,380 3.48
100001 - 1000000 26 9,175,081 4.34
>1000000 11 194,885,428 92.18
TOTALS 1,072 211,419,889 100
Shareholder Analysis by Domicile
Individual Investors
KENYA 877 29,746,059 14.07
EAST AFRICAN 27 99,000 0.05
FOREIGN 19 941,865 0.45
TOTALS 923 30,786,924 14.56
Shareholder Analysis by Domicile
Corporate Investors
KENYA 145 131,236,245 62.07
EAST AFRICAN 02 49,200 0.02
FOREIGN 02 49,347,520 23.34
TOTALS 149 180,632,965 85.44
The directors’ direct and indirect interest in the ordinary share capital of the Company on 31 December 2016was as follows:
NO. OF SHARES HOLDINGS %
1 OLD MUTUAL HOLDINGS LIMITED 78,919,889 37.33%2 OLD MUTUAL LIFE ASSURANCE (SOUTH AFRICA) 49,332,445 23.33%
By order of the Board
Nkirote Mworia NjiruSecretary
8 March 2017
43ANNUAL REPORT & FINANCIAL STATEMENTS 2016


SUSTAINABILITY & CSR REPORT 2016

From a nondescript village track 13 years ago, our partnership with the Ndakaini Dam Environmental Conservation Association (NDEKA) has impacted millions of lives through environmental conservation, job creation and nurturing athletic talent.
The annual event has converted the UAP Old Mutual Ndakaini Half Marathon into one of the best breeding grounds for Kenya’s record breaking athletes.
The marathon has in successive years continued to attract an increasing number of participants, spectators, fun-lovers and tourists thereby growing in leaps and bounds from 297 runners in 2004, to over 10,000 athletes and spectators, in 2016. Last year, our staff in collaboration with the Ndakaini community and other
corporate sponsors managed to plant over 100,000 seedlings of indigenous trees around Ndakani area.
These efforts have not only restored the tree cover but also created thousands of jobs at the local level. A similar initiative was also undertaken in conjunction with the Kenya Wildlife Services in the expansive Mt Kenya forest.
Our staff joined hands with the Kenya Wildlife Services rangers to plant a record 19,000 seedlings in the Aberdares forest in December 2016.
This goes to demonstrate our commitment to supporting the environment, a key pillar in the Old Mutual Responsible Business initiative.
“In the year under review, we are proud to have positively impacted the lives of the communities in which we operate in the areas of special education, healthcare and environmental conservation. Going forward, the Old Mutual Foundation will continue supporting communities across East Africa”Dr. PETER MUTHOKA EBS, MBS, FKIB, FKIM
CHAIRMAN, OLD MUTUAL FOUNDATION
Over 100,000 Indigenous trees were planted in the Ndakaini catchment area.
Athletes taking part in the Annual UAP Old Mutual Ndakaini Half Marathon.
SUSTAINABILITY AND CSR REPORT 2016
46 UAP OLD MUTUAL GROUP

Head Office Relocation
The iconic UAP Old Mutual Tower is the home of the Group, and plans are currently underway to relocate the head office team to the Tower on the hill. The branch merger project, which is expected to be completed in 2018, will see the investment and insurance service branches of UAP and Old Mutual sit under one roof. This will not only increase staff synergy but make our services conveniently accessible. The Nakawa Business Park in Kampala, Uganda and the UAP Equatoria Tower in Juba, South Sudan are also opened for tenancy.
Staff at the newly opened Integrated Financial Services centre in Nairobi.
Staff at the newly opened Integrated Financial Services centre in Nairobi
Official Opening of the Integrated Financial Services centre located at the Old Mutual Building – Kimathi Street.
Group Chairman Dr. JB Wanjui and Board Director James Muguiyi during the official commissioning of the dot lighting at the UAP Old Mutual Tower.
Staff at a branch merger event.
Staff at a branch merger event.
SUSTAINABILITY AND CSR REPORT 2016 (CONT’D)
47ANNUAL REPORT & FINANCIAL STATEMENTS 2016

UAP Old Mutual Foundation is the channel we use to give back to the community. With a strategic focus on environment, education and health, we work with our communities and other partners to build a better world. Last year, our staff in collaboration with the Ndakaini community and other corporate sponsors managed to plant over 10,000 seedlings of indigenous trees around Ndakani Dam. These efforts have not only restored the tree cover but also created thousands of jobs at the local level. A similar environmental initiative was also undertaken in collaboration with the Kenya Wildlife Services in the expansive Mt Kenya forest. Our staff joined hands with the Kenya Wildlife Services to plant a record 19,000 seedlings in the Aberdares National Park in December 2016 thus planting approximately 159,000 trees to date. This goes to demonstrate our commitment in supporting the environment, a key pillar in the UAP Old Mutual Foundation. Through the special education programme, we partnered with the Kenya Society for the Blind (KSB) to donate learning devices for pupils with visual impairment in 5 schools. The beneficiaries were five schools in five counties: Mombasa, Meru, Kisumu, Bomet and Kitui. Over 600 pupils will now have access to various assistive devices that include: Braille machines, books and braille geometrical sets to support their education. Our commitment to supporting access to quality education was also demonstrated through our scholarship programme for students in: Starehe Boys Centre, Starehe Girls School and Gatanga Girls School. Our 2016 students exceled in the Kenya Certificate of Secondary Education exam and will proceed to university this year. In 2016, we completed the refurbishment of Kenyatta National Hospital Accident & Emergency (A&E) wing. This project significantly reduced the average time spent per patient at the A&E wing from 7 hours to 5 hours. It also improved health-care attendants’ satisfaction with work environment through renovation of the nurses’ rest and changing rooms which impacts the quality of care given to the patients. Our staff have continued to partner with the Foundation to support projects in the community. Through the Care and Share month in October 2016, staff contributed their time, food, clothing and stationery. These were distributed to various beneficiaries such as rescue centres, children homes and feeding programmes between November and December 2016.
Staff take part in the Care and Share Day.Hand Over of Assistive Devices to the Kenya Society for the Blind.
Impacting the Community
SUSTAINABILITY AND CSR REPORT 2016 (CONT’D)
48 UAP OLD MUTUAL GROUP

Official hand over of the refurbished Accident & Emergency Wing at the Kenyatta National Hospital.
SUSTAINABILITY AND CSR REPORT 2016 (CONT’D)
49ANNUAL REPORT & FINANCIAL STATEMENTS 2016

Celebrating our people…the core of Good Company
Our employee welfare initiative seeks to give a wholesome experience which enhances a sense of belonging and recognises individual as well as team contributions to the Group vision.
Staff engagement activities were held each month against a selected theme on the 1st Friday. The engagement activities were dubbed ‘Purposeful casual Friday’ and saw the introduction of casual wear on Fridays. The themes included community, customer celebration amongst others. In addition, staff came together to celebrate diversity day, which was a commemoration of Old Mutual’s 172 birthday. In the theme of Rwandan culture, staff across East Africa donned the umushanana to highlight the Group’s diverse culture.
In the same breadth, through peer to peer nominations the Group participated in the wider Old Mutual Emerging Markets(OMEM) reward scheme; Stars of Africa. Staff recognised through this programme won trips to various destinations globally.
Diversity day celebrations across the Group in East Africa.
SUSTAINABILITY AND CSR REPORT 2016 (CONT’D)
50 UAP OLD MUTUAL GROUP

Best Employer Award and Staff Well Being
The Group believes in adhering to best market place practices in its engagements with stakeholders.
The Top Employers Institute named the UAP Old Mutual Group, as the leading Top Employer in Financial Services and Insurance sector in: Kenya, South Sudan, Tanzania and Uganda. The Institute globally certifies excellence in the conditions organisations create for the development of their employees after conducting months of research into an organization’s Human Resource (HR) environment.
The HR Team displays the TOP Employer Trophy.
SUSTAINABILITY AND CSR REPORT 2016 (CONT’D)
51ANNUAL REPORT & FINANCIAL STATEMENTS 2016

2016 2015 2014 2013 2012
KES ‘000’ KES ‘000’ KES ‘000’ KES ‘000’ KES ‘000’
Gross Written Premium 19,391,413 16,868,231 14,832,735 12,737,286 9,054,770
Gross Earned Premium 18,735,006 15,332,794 14,158,444 11,559,860 8,462,797
Net Earned Premium 15,427,036 12,069,426 11,263,533 9,014,382 6,533,244
Investment and Other Income 3,990,973 4,441,502 5,424,470 3,726,954 2,957,379
Total Income 19,418,009 16,510,928 16,688,003 12,741,336 9,490,623
Net claims payable and policy owners’ benefit payable (9,835,963) (7,986,649) (8,074,794) (5,754,811) (3,938,295)
Commissions payable and Operating and Other expenses
(8,361,413) (7,831,123) (6,316,980) (4,774,785) (3,804,377)
Profit before income tax 1,220,633 693,156 2,296,229 2,211,740 1,747,951
Income tax expense (394,858) 203,443 (629,042) (401,339) (366,920)
Profit after income tax 825,775 896,599 1,667,187 1,810,401 1,381,031
Non-controlling interests (111,327) (251,115) (181,211) (152,825) (99,025)
Net Profit Attributable to Shareholders 937,102 645,484 1,485,976 1,657,576 1,282,006
Other Comprehensive income(loss) (926,766) 60,028 1,128,625 1,730,955 735,900
Total Comprehensive Income(Loss) (100,991) 956,627 2,795,812 3,541,356 2,116,931
Dividends 359,414 - 359,414 359,414 419,130
Total distributions 359,414 - 359,414 359,414 419,130
Total Assets 57,026,802 48,724,654 42,083,725 33,109,989 24,657,973
Total Equity 17,694,270 17,795,261 17,198,048 14,761,650 11,620,312
19.4 57.0
THE GROUP’S TOTAL INCOME AS AT 2016
THE GROUP’S TOTAL ASSETS AS AT THE END OF 2016
BILLION BILLIONKshs Kshs
FIVE-YEAR FINANCIAL HIGHLIGHTS
52 UAP OLD MUTUAL GROUP

You make me feel so alive I can conquer all.
KEEP GOOD COMPANY

The Directors submit their report together with the audited financial statements for the year ended 31 December 2016 which disclose the state of affairs of the Company and the Group.
Principal activitiesThe Group is engaged in the business of insurance, premium financing, investment management, insurance brokerage, property and stock broking services. These activities are carried out through the Group’s subsidiaries in Kenya, Uganda, Tanzania, Southern Sudan, Rwanda and Democratic Republic of Congo. These activities are briefly described below:
Insurance business: The Group has seven subsidiary undertakings that underwrite all classes of life and non-life insurance risks as defined by the Kenyan Insurance Act, other than industrial life insurance. They also issue investment contracts to provide their customers with asset management solutions for their savings and retirement needs, and provide premium financing services. These operations are carried out in Kenya, Uganda, Tanzania, South Sudan and Rwanda.
The Group also operates an insurance brokerage business in the Democratic Republic of Congo.
Stock broking: The Group has a subsidiary, UAP Financial Services Limited, a Ugandan based Company that provides stock broking services.
Property: The Group holds investments in two property companies based in Uganda and South Sudan and also in the Holdings company based in Kenya.
Results
2016 2015
KES ’000 KES ’000
Profit for the year 825,775 896,599
Profit attributable to shareholders of the company 937,102 645,484
DividendsDuring the year, no interim dividend was paid (2015: Nil). The Directors recommend the payment of Kes 1.70 per share amounting to Kes 359 million (2015: Nil).
DIRECTORS’ REPORT
54 UAP OLD MUTUAL GROUP

DirectorsThe directors of the Company, who held office to the date of this report, are:
Dr JB Wanjui cbs - Chairman* Appointed on 8 August 2007Mr Peter De Beyer ** Appointed on 29 June 2015Mr Jonas Mushosho *** Appointed on 28 November 2016Mr Peter Mwangi (Group Chief Executive Officer)* Appointed on 23 June 2015Mr JN Muguiyi * Appointed on 8 August 2007Mrs Susan Omanga * Appointed 19 August 2015Mrs Joyce Anne Wainaina - (Alternate Dr JB Wanjui cbs)* Resigned on 24 June 2016 Mr James Wambugu * Appointed 19 June 2015 Mr Ralph Mupita ** Resignation effective 31 January 2017Mr Tavaziva Madzinga *** Resigned on 30 September 2016Dr Peter W Muthoka Ebs* Appointed on 23 June 2015Mr David Marshall ** Appointed on 23 June 2015Mrs Rose Ogega * Appointed on 29 June 2015Mr Paul Truyens **** Appointed on 29 June 2015Mr Michael Harper ** Appointed on 29 June 2015Ms Anisha Archary ** Appointed on 19 August 2015Mr AK Maina * Appointed on 19 August 2015
KENYAN* SOUTH AFRICAN** ZIMBABWEAN*** DUTCH****
Business reviewDuring the year 2016, the Company performed well despite the challenges occassioned by the tough business en-vironment. The Company experienced a premium growth of 15% from KES 16.8 billion in 2015 to KES 19.3 billion in 2016. The total asset base of the Group also improved by 19%, growing from KES 48.7 billion in 2015 to KES 57.0 billion in 2016. The Group posted an underwriting loss KES 1.5 billion during the year versus KES 2.5 billion recorded in 2015. Profit before tax posted in 2016 was KES 1.2 billion against KES 0.6 billion recorded in 2015.
Relevant audit informationThe Directors in office at the date of this report confirm that:
• There is no relevant audit information of which the Company’s auditor is unaware; and • Each director has taken all the steps that they ought to have taken as a director so as to be aware of any relevant
audit information and to establish that the Company’s auditor is aware of that information.
AuditorThe Company’s auditors, KPMG Kenya continue in office in accordance with the Kenyan Companies Act, 2015.
Approval of the financial statementsThe financial statements set out on pages 63 to 138 were approved at a meeting of the Directors held on 8 March 2017.
By order of the Board
Nkirote Mworia NjiruSecretary
8 March 2017
DIRECTORS’ REPORT (CONT’D)
55ANNUAL REPORT & FINANCIAL STATEMENTS 2016

Board RemunerationUAP Holdings Limited is pleased to present the Director’s remuneration report for the year ended 31 December 2016. This report is in compliance with the Group’s reward policy, CMA Code of Corporate Governance Guidelines on Director’s remuneration and the Kenya Companies Act, 2015. A key provision of the Company’s principles is that reward will directly support the business strategy with clear and measurable linkage to business performance.
Our reward system seeks to recognize the contribution individuals make to the success of the Company and reflect-ing the value of the roles they are performing, as well as the level to which they perform them.
During the financial year, the Company’s board of directors consisted of:
a. 2 Executive directors: Mr. Peter Mwangi; Mr. James Wambugub. 8 Non-executive directors: Dr. JB Wanjui (Chairman); Mr. Jonas Mushosho; Mr. AK Maina; Mr. James Muguiyi;
Mr. Ralph Mupita; Mr. Tavaziva Madzinga; Mr. David Marshall; Ms. Anisha Archaryc. 6 Independent Non-executive directors: Mrs. Susan Omanga; Dr. Peter W. Muthoka; Mrs. Rose Ogega;
Mr. Paul Truyens; Mr. Michael Harper; Mr. Peter De Beyer
The remuneration of the executive directors is as per negotiated employment contracts. The Non-Executive Directors representatives of the majority shareholder do not earn any remuneration from UAP Holdings Limited. The Groups remuneration policy has been reproduced in full for both ease of reference and to provide context to the decisions taken during the year. For the financial year ended 31 December 2016, the consolidated directors’ fees was KES 395,257,000 (2015: 226,049,000).
Independent Non-Executive Directors’ Remuneration Policy and FrameworkUAP Holdings Limited offers a selection of financial and non-financial reward and benefits. The precise nature of these rewards may be amended from time to time, taking into account market practice.
The list of the reward components are as follows:
a) Directors Fees These relate to the monthly remuneration that the Directors receive as per their employment as directors to UAP Holdings limited.
b) Directors Sitting AllowanceThese relate to allowances paid out to directors in respect to their attendance and participation of board meetings. The UAP Holdings Limited charter provides that meetings shall be held four times in a year (quarterly) every year.
c) Directors’ Medical CoverThese relate to the employment benefit given to the directors as part of their employment. Each of the directors are given a medical cover.
The Company values the input of the shareholders and engages directly with them when making any revisions to the
Board remuneration package.
By order of the Board
Nkirote Mworia NjiruSecretary
8 March 2017
DIRECTORS’ REMUNERATION REPORT
56 UAP OLD MUTUAL GROUP

The Directors are responsible for the preparation and presentation of the financial statements of UAP Holdings Limited set out on pages 63 to 138 which comprise the consolidated and company statements of financial position at 31 December 2016, and the consolidated statements of profit or loss, consolidated statements of other comprehensive income, consolidated statements of changes in equity and consolidated statements of cash flows for the year then ended, together with the company statement of financial position at 31 December 2016, the company statement of changes in equity and a summary of significant accounting policies and other explanatory information.
The Directors’ responsibilities include: determining that the basis of accounting described in Note 2 is an acceptable basis for preparing and presenting the financial statements in the circumstances, preparation and presentation of financial statements in accordance with International Financial Reporting Standards and in the manner required by the Kenyan Companies Act 2015 and for such internal control as the directors determine is necessary to enable the preparation of financial statements that are free from material misstatements, whether due to fraud or error.
Under the Kenyan Companies Act 2015, the Directors are required to prepare financial statements for each financial period which give a true and fair view of the state of affairs of the Group and Company as at the end of the financial period and of the operating results of the Company for that period. It also requires the Directors to ensure the Company keeps proper accounting records which disclose with reasonable accuracy the financial position of the Company.
The Directors accept responsibility for the annual financial statements, which have been prepared using appropriate accounting policies supported by reasonable and prudent judgments and estimates, in conformity with International Financial Reporting Standards and in the manner required by the Kenyan Companies Act 2015. The Directors are of the opinion that the financial statements give a true and fair view of the state of the financial affairs of the Company and of its operating results.
The Directors further accept responsibility for the maintenance of accounting records which may be relied upon in the preparation of financial statements, as well as adequate systems of internal financial control. The Directors have made an assessment of the Company’s ability to continue as a going concern and have no reason to believe the Company will not be a going concern for at least the next twelve months from the date of this statement.
Approval of the financial statementsThe financial statements, as indicated above, were approved by the Board of Directors on 8 March 2017 and were signed on its behalf by:
Dr JB Wanjui CBS Peter Mwangi Chairman Group Chief Executive Officer
8 March 2017
STATEMENT OF DIRECTORS’ RESPONSIBILITIES
57ANNUAL REPORT & FINANCIAL STATEMENTS 2016

THE KEY AUDIT MATTER HOW THE MATTER WAS ADDRESSED
This is particularly the case for those liabilities that are recognised in respect of claims that have occurred, but have not yet been reported to the Group. Small changes in the assumptions used to value the liabilities, particularly those relating to the amount and timing of future claims, can lead to material impacts on the valuation of insurance liabilities.
The key assumptions that drive the reserving calculations include graduate development factors, loss ratios, inflation assumptions and claims expense assumptions. The valuation of insurance contract liabilities depends on accurate data about the volume, amount and pattern of current and historical claims since they are often used to form expectations about future claims. If the data used in calculating insurance liabilities, or for forming judgements over key assumptions, is not complete and accurate then material impacts on the valuation of insurance liabilities may arise. Consequently, we have determined the valuation of short term insurance contract liabilities to be a key audit matter.
The Group’s accounting policies in respect of insurance contract liabilities are included in the Group’s accounting policies while the disclosures are included in Note 33 to the financial statements.
• Checking samples of claims reserves through comparing the estimated amount of the reserve to appropriate documentation, such as reports from loss adjusters.
• Re-performing reconciliations between the data recorded in the financial systems and the data used in the actuarial reserving calculations.
• Re-projecting the incurred but not reported reserve balances using the actuarially-determined reserve percentages per class of business.
• Using our actuarial specialists to review the reserving methodology applied and analytically review the valuation results presented and movements since the previous year end. We focused on understanding the methodologies applied and examined areas of judgement such as changes in valuation assumptions.
• We considered the validity of management’s liability adequacy testing by assessing the reasonableness of the projected cash flows and challenging the assumptions adopted in the context of Group and industry experience data and specific product features.
LONG TERM INSURANCE CONTRACT LIABILITIES
See Note 33 and 34 to the consolidated financial statements
The key audit matter How the matter was addressed
The Group has significant long term insurance contract liabilities and deposit administration liabilities representing about 24% of the Group’s total liabilities.
This is an area that involves significant judgement over uncertain future outcomes, mainly the ultimate total settlement value of long-term policyholder liabilities. Economic and operating assumptions, such as investment returns, mortality and persistency (including consideration of policyholder behaviour), expenses and expense inflation, withdrawals and sensitivity analysis are the key inputs used to estimate these long-term liabilities.
Our audit procedures in this area included, among others:• Comparing the assumptions to expectations based on
the Group’s historical experience, current trends and our own industry knowledge;
• Evaluating the governance around the overall Group reserving process, including the scrutiny applied by the internal and appointed external actuaries. We assessed qualifications and experience of those responsible and examined the output of the reviews to assess the scope and depth of these processes. Our evaluation of the methodologies and key assumptions enabled us to assess the quality of the challenge applied through the Group’s reserving process.
Report on the financial statements (continued)Short term insurance contract liabilities (continued)Key Audit matters (continued)
REPORT OF THE INDEPENDENT AUDITORS’ TO THE MEMBERSOF UAP HOLDINGS LIMITED (CONT’D)
58 UAP OLD MUTUAL GROUP

LONG TERM INSURANCE CONTRACT LIABILITIES (CONTINUED)
See Note 33 and 34 to the consolidated financial statements (continued)
The key audit matter How the matter was addressed
The assumptions to be made have high estimation uncertainty and changes in the estimates may lead to material impact on the valuation of the liabilities. The valuation also depends on accurate data extraction from the information systems. If the data used is not complete and accurate then material impacts on the valuation of policyholder liabilities may also arise.
Due to the high level of judgment, sensitivity of the assumptions used and complexity of the valuation of long term insurance contract liabilities, we considered this to be a key audit matter.
The Group’s accounting policies in respect of insurance contract and deposit administration liabilities are included in the Group’s accounting policies while the disclosures are included in Notes 33 and 34 to the financial statements.
• Observing the extraction of the data used in the actuarial reserving calculations from the system.
• Using our actuarial specialists to review the reserving methodology applied and analytically reviewed the valuation results presented and movements since the previous year end. We focused on understanding the methodologies applied and examined areas of judgement such as changes in valuation assumptions;
• Considering the validity of management’s liability adequacy testing by assessing the reasonableness of the projected cash flows and challenging the assumptions adopted in the context of Group and industry experience data and specific product features.
• Considering whether the Group’s disclosures in relation to the assumptions used in the calculation of insurance contract liabilities are compliant with the relevant accounting requirements in particular the sensitivities of these assumptions to alternative scenarios and inputs.
Assessment of recoverability and classification of Chase Bank (K) Limited (In Receivership)
balances
See Note 29 (a) to the consolidated financial statements
The key audit matter How the matter was addressed
The Group has recorded KES 370M as part of other receivables (see note 29(a)). The amounts are deposited at Chase Bank (K) Limited (In Receivership) which is currently under statutory management by the Kenya Deposit Insurance Corporation (KDIC). The estimation of recoverability of this amount was significant to our audit. Due to the high level of judgment in assessing the level of impairment of the balances, we considered this to be a key audit matter.
Our audit procedures in this area included, among others evaluating the management’s assessment of the recoverability of the balance.
Report on the financial statements (continued)Key Audit matters (continued)
REPORT OF THE INDEPENDENT AUDITORS’ TO THE MEMBERSOF UAP HOLDINGS LIMITED (CONT’D)
59ANNUAL REPORT & FINANCIAL STATEMENTS 2016

Information Technology (IT) systems and controls
The key audit matter How the matter was addressed
Many financial reporting controls depend on the correct functioning of related elements of the operational and financial IT systems, for example interfaces between policy administration and financial reporting systems or automated controls which are designed to prevent inaccurate or incomplete transfers of financial information. This is an area of significant risk in our audit due to the complexity of the IT infrastructure, particularly where systems require increased manual inputs.
In this area our audit procedures included, among others:• Testing general IT controls around system access and
change management and testing controls over computer operations within specific applications which are required to be operating correctly to mitigate the risk of misstatement in the financial statements;
• With the support of our own IT specialists, we tested these controls through examining whether changes made to the systems were appropriately approved, and assessing whether appropriate restrictions were placed on access to core systems through testing the permissions and responsibilities of those given that access.
• Where general IT controls were not operating effectively and we were therefore unable to rely on certain automated IT controls, we considered whether financial information was impacted and extended the scope of our work by performing additional audit procedures in a limited number of areas.
• In the areas where we performed additional procedures we were able to place reliance on manual compensating controls, such as reconciliations between systems and other information sources, or perform additional testing, such as extending the size of our sample sizes, to obtain sufficient appropriate audit evidence over the financial statement balances that were impacted.
REPORT OF THE INDEPENDENT AUDITORS’ TO THE MEMBERSOF UAP HOLDINGS LIMITED (CONT’D)Report on the financial statements (continued)Key Audit matters (continued)
60 UAP OLD MUTUAL GROUP

Other informationThe Directors are responsible for the other information. The other information comprises the Director’s Report, the Director’s Remuneration Report and the Statement of Directors’ Responsibilities which we obtained prior to the date of this auditor’s report, and the other information to be included in the published annual report and financial statements, which is expected to be made available to us after that date.
Our opinion on the financial statements does not cover the other information and we do not and will not express any form of assurance conclusion thereon. In connection with our audit of the financial statements, our responsibility is to read the other information identified above and, in doing so, consider whether the other information is materially inconsistent with the consolidated financial statements or our knowledge obtained in the audit, or otherwise appears to be materially misstated.
If, based on the work that we have performed on the other information that we obtained prior to the date of this auditor’s report, we conclude that there is a material misstatement of this other information, we are required to report that fact. We have nothing to report in this regard.
Directors’ responsibility for the financial statementsAs stated on page 57, the Directors are responsible for the preparation of the Consolidated and Company financial statements that give a true and fair view in accordance with International Financial Reporting Standards and in the manner required by the Kenyan Companies Act, 2015 and for such internal control, as the directors determine necessary to enable the preparation of the Consolidated and Company financial statements that are free from material misstatements, whether due to fraud or error.
In preparing the financial statements, directors are responsible for assessing the Group’s and Company’s ability to continue as a going concern, disclosing, as applicable, matters related to going concern and using the going concern basis of accounting unless management either intends to liquidate the Group or/and Company or to cease operations, or has no realistic alternative but to do so.
The Directors are responsible for overseeing the Group’s and Company’s financial reporting process.
Auditors’ responsibility for the Audit of the Financial StatementsOur objectives are to obtain reasonable assurance about whether the consolidated financial statements as a whole are free from material misstatement, whether due to fraud or error, and to issue an auditor’s report that includes our opinion. Reasonable assurance is a high level of assurance, but is not a guarantee that an audit conducted in accordance with ISAs will always detect a material misstatement when it exists. Misstatements can arise from fraud or error and are considered material if, individually or in the aggregate, they could reasonably be expected to influence the economic decisions of users taken on the basis of these consolidated financial statements.
As part of an audit in accordance with ISAs, we exercise professional judgment and maintain professional skepticism throughout the audit. We also:
• Identify and assess the risks of material misstatement of the financial statements, whether due to fraud or error, design and perform audit procedures responsive to those risks, and obtain audit evidence that is sufficient and appropriate to provide a basis for our opinion. The risk of not detecting a material misstatement resulting from fraud is higher than for one resulting from error, as fraud may involve collusion, forgery, intentional omissions, misrepresentations, or the override of internal control.
• Obtain an understanding of internal control relevant to the audit in order to design audit procedures that are appropriate in the circumstances, but not for the purpose of expressing an opinion on the effectiveness of the Group’s and Company’s internal control.
• Evaluate the appropriateness of accounting policies used and the reasonableness of accounting estimates and related disclosures made by the Directors.
• Conclude on the appropriateness of the Directors’ use of the going concern basis of accounting and, based on
Report on the financial statements (continued)
REPORT OF THE INDEPENDENT AUDITORS’ TO THE MEMBERSOF UAP HOLDINGS LIMITED (CONT’D)
61ANNUAL REPORT & FINANCIAL STATEMENTS 2016

the audit evidence obtained, whether a material uncertainty exists related to events or conditions that may cast significant doubt on the Group’s and Company’s ability to continue as a going concern. If we conclude that a material uncertainty exists, we are required to draw attention in our auditor’s report to the related disclosures in the consolidated financial statements or, if such disclosures are inadequate, to modify our opinion. Our conclusions are based on the audit evidence obtained up to the date of our auditor’s report. However, future events or conditions may cause the Group or/and Company to cease to continue as a going concern.
• Evaluate the overall presentation, structure and content of the financial statements, including the disclosures, and whether the financial statements represent the underlying transactions and events in a manner that achieves fair presentation.
• Obtain sufficient appropriate audit evidence regarding the financial information of the entities or business activities within the Group to express an opinion on the consolidated financial statements. We are responsible for the direction, supervision and performance of the group audit. We remain solely responsible for our audit opinion.
We are required to communicate with the directors regarding, among other matters, the planned scope and timing of the audit and significant audit findings, including any significant deficiencies in internal control that we identify during our audit.
We are also required to provide the directors with a statement that we have complied with relevant ethical requirements regarding independence, and to communicate with them all relationships and other matters that may reasonably be thought to bear on our independence, and where applicable, related safeguards.
From the matters communicated with the directors, we determine those matters that were of most significance in the audit of the financial statements of the current period and are therefore the key audit matters. We describe these matters in our auditor’s report unless law or regulation precludes public disclosure about the matter or when, in extremely rare circumstances, we determine that a matter should not be communicated in our report because the adverse consequences of doing so would reasonably be expected to outweigh the public interest benefits of such communication.
Report on other legal and regulatory requirementsAs required by the Kenyan Companies Act, 2015, we report to you based on our audit, that:
i) we have obtained all the information and explanations which to the best of our knowledge and belief were necessary for the purposes of our audit;
ii) in our opinion proper books of account have been kept by the Company, so far as appears from our examina-tion of those books; and
iii) the Company’s statement of financial position is in agreement with the books of account.
The Engagement Partner responsible for the audit resulting in this independent auditors’ report is CPA Jacob Gathecha – P/1610.
KPMG KenyaCertified Public AccountantsP.O Box 40612 – 00100Nairobi
8 March 2017
Report on the financial statements (continued)Auditors’ responsibility for the Audit of the Financial Statements (continued)
REPORT OF THE INDEPENDENT AUDITORS’ TO THE MEMBERSOF UAP HOLDINGS LIMITED (CONT’D)
62 UAP OLD MUTUAL GROUP

2016 2015
Notes KES ’000 KES ’000
Gross written premium 5 (b) 19,391,413 16,868,231
Gross earned premium 5 (b) 18,735,006 15,332,794
Reinsurance ceded 5 (b) (3,307,970) (3,263,368)
Net earned premium 15,427,036 12,069,426
Investment income 6 3,114,921 3,310,189
Commissions earned 5 (b) 691,278 1,025,069
Other income 7 184,774 106,244
Total Income 19,418,009 16,510,928
Claims and policy owners’ benefits payable 8 (10,934,346) (9,200,243)
Less: Amount recoverable from reinsurers 5 (b) 1,098,383 1,213,594
Net claims payable (9,835,963) (7,986,649)
Operating and other expenses 9 (5,613,945) (5,199,370)
Commissions payable 5 (b) (2,194,306) (2,053,824)
Total expenses & commissions (7,808,251) (7,253,194)
Finance costs – interest cost on borrowings 37 (a) (553,162) ( 577,929)
Profit before tax 1,220,633 693,156
Income tax (expense)/ credit 11 (394,858) 203,443
Profit for the year (of which Kes 372,170,000 (2015: Kes 993,341,000) has been dealt with in the accounts of the company)
825,775 896,599
Profit attributable to:
Owners of the parent 937,102 645,484
Non-controlling interest (111,327) 251,115
Profit for the year 825,775 896,599
Basic and diluted EPS – Kes 12 4.43 3.05
The notes on pages 71 to 138 are an integral part of these financial statements.
CONSOLIDATED STATEMENT OF PROFIT OR LOSS
63ANNUAL REPORT & FINANCIAL STATEMENTS 2016

2016 2015Notes KES ’000 KES ’000
Profit for the year 825,775 896,599 Other comprehensive income Items that will be recycled to profit or lossExchange differences on translating foreign operations (393,755) 413,668 Total items that will be recycled to profit or loss (393,755) 413,668 Items that will not be recycled to profit or lossGains/(losses) on revaluation of equity investments: Listed ordinary shares 24 (361,878) (302,594) Unlisted ordinary shares 24 (901) 12,046 Remeasurement of retirement benefit obligations (170,232) (63,092)Total items that will not be recycled to profit or loss (533,011) 353,640
Total other comprehensive income for the year, net of tax (926,766) 60,028
Total comprehensive income for the year (100,991) 956,627
Total comprehensive income attributable to:Owners of the parent 39,478 719,383 Non-controlling interests (140,469) 237,244
Total (100,991) 956,627
The notes on pages 71 to 138 are an integral part of these financial statements.
CONSOLIDATED STATEMENT OF OTHER COMPREHENSIVE INCOME
64 UAP OLD MUTUAL GROUP

2016 2015CAPITAL EMPLOYED Notes KES ’000 KES ’000 Share capital 13 (a) 1,057,099 1,057,099 Share premium 13 (b) 4,612,626 4,612,626 Fair value reserve for equity investments 14 1,240,045 1,598,214 Retained earnings 15 8,906,796 8,463,518 Proposed dividends 16 359,414 -Translation reserve 17 (76,523) 292,700 Statutory reserve 17 342,400 418,827 Shareholders’ funds 16,441,857 16,442,984 Non-controlling Interest 1,252,413 1,352,277 Total equity 17,694,270 17,795,261 REPRESENTED BY: Assets Goodwill 18 240,030 240,030 Property and equipment 19 (a) 559,648 403,343 Intangible assets 20 (a) 98,584 81,722 Investment properties 21 (a) 21,798,956 19,794,286 Deferred income tax asset 22 718,461 569,613 Retirement benefit asset 23 258,129 311,550 Equity investment at fair value through Other Comprehensive Income
24 (a) 1,661,826 2,554,729
Equity investment at fair value through profit or loss 24 (b) 1,671,630 2,003,448 Mortgage loans receivable 26 336,774 255,259 Current income tax recoverable 11 93,183 27,900 Reinsurers’ share of insurance liabilities 27 3,737,781 2,977,367 Deferred acquisition cost 28 515,706 432,292 Receivables arising out of direct insurance arrangements 1,873,639 2,364,365 Receivables arising out of reinsurance arrangements 1,314,921 970,510 Other receivables 29 (a) 1,465,727 746,174 Corporate bonds 30 1,878,698 1,855,820 Government securities 31 (ii) 11,920,024 7,541,079 Deposits with financial institutions 32 5,037,139 3,845,043 Cash and bank balances 32 1,845,946 1,750,124 Total assets 57,026,802 48,724,654 Liabilities Deferred income tax liability 22 656,579 617,074 Insurance contract liabilities 33 9,760,830 8,146,877 Payable under deposit administration contracts 34 5,264,158 4,423,199 Unit-linked investment contracts 35 856,045 1,007,721 Borrowings 37 11,031,582 7,477,300 Provision for unearned premium 38 7,591,363 6,373,812 Current income tax payable 11 (a) 84,543 109,397 Creditors arising from reinsurance arrangements 1,876,234 1,105,790 Other payables 39 2,211,198 1,668,223 Total liabilities 39,332,532 30,929,393 Net Assets 17,694,270 17,795,261
The notes on pages 71 to 138 are an integral part of these financial statements.The financial statements on pages 63 to 138 were approved for issue by the board of directors on 8 March 2017 and signed on its behalf by:
Dr JB Wanjui CBS Peter Mwangi (Chairman) (Group Chief Executive Officer)
CONSOLIDATED STATEMENT OF FINANCIAL POSITION
65ANNUAL REPORT & FINANCIAL STATEMENTS 2016
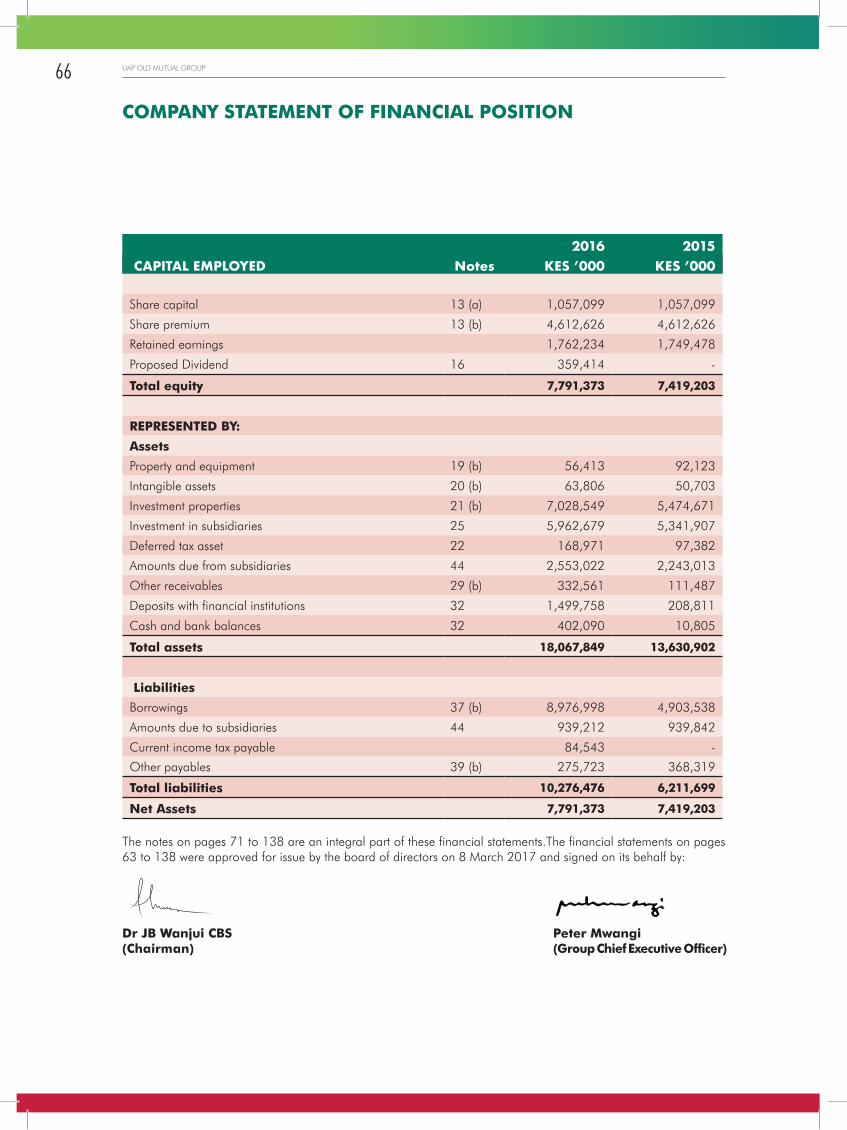
2016 2015 CAPITAL EMPLOYED Notes KES ’000 KES ’000
Share capital 13 (a) 1,057,099 1,057,099
Share premium 13 (b) 4,612,626 4,612,626
Retained earnings 1,762,234 1,749,478
Proposed Dividend 16 359,414 -
Total equity 7,791,373 7,419,203
REPRESENTED BY: Assets Property and equipment 19 (b) 56,413 92,123
Intangible assets 20 (b) 63,806 50,703
Investment properties 21 (b) 7,028,549 5,474,671
Investment in subsidiaries 25 5,962,679 5,341,907
Deferred tax asset 22 168,971 97,382
Amounts due from subsidiaries 44 2,553,022 2,243,013
Other receivables 29 (b) 332,561 111,487
Deposits with financial institutions 32 1,499,758 208,811
Cash and bank balances 32 402,090 10,805
Total assets 18,067,849 13,630,902
Liabilities Borrowings 37 (b) 8,976,998 4,903,538
Amounts due to subsidiaries 44 939,212 939,842
Current income tax payable 84,543 -
Other payables 39 (b) 275,723 368,319
Total liabilities 10,276,476 6,211,699
Net Assets 7,791,373 7,419,203
The notes on pages 71 to 138 are an integral part of these financial statements.The financial statements on pages 63 to 138 were approved for issue by the board of directors on 8 March 2017 and signed on its behalf by:
Dr JB Wanjui CBS Peter Mwangi (Chairman) (Group Chief Executive Officer)
COMPANY STATEMENT OF FINANCIAL POSITION
66 UAP OLD MUTUAL GROUP

CO
NSO
LID
ATE
D S
TATE
MEN
T O
F C
HA
NG
ES I
N E
QU
ITY
2015
Att
rib
uta
ble
to o
wn
ers
of
the p
are
nt
Note
s
Sha
re
cap
ita
l &
sh
are
p
rem
ium
KES
’000
Fa
ir
valu
e
rese
rves
KES
’000
R
eta
ined
ea
rnin
gs
KES
’000
Pro
pose
d
div
iden
ds
KES
’000
Tra
nsl
ati
on
re
serv
es
KES
’000
Sta
tuto
ry
rese
rve
KES
’000
Tota
lK
ES ’000
Non
-co
n-
trollin
g
inte
rest
KES
’000
Tota
l eq
uit
yK
ES ’000
Ba
lan
ce a
t 1 J
an
ua
ry 2
015
5,6
69,7
25
2,2
54,2
05
7,6
46,4
16
359,4
14
(1
32,2
72)
346,0
11
16,1
43,4
99
1,0
54,5
49
17,1
98,0
48
Prof
it fo
r th
e ye
ar-
- 64
5,48
4 -
- -
645,4
84
251,
115
896,5
99
O
ther
com
pre
hen
sive
inco
me
Re-m
easu
rem
ent
of
retir
emen
t be
nefit
obl
igat
ions
-
-
(63,
092)
-
-
-
(63,0
92)
-
(63,0
92)
Gai
ns/(
loss
es)
on r
eval
uatio
n of
eq
uity
inve
stm
ents
:Q
uote
d or
dina
ry s
hare
s 2
4 (c
) -
(3
00,0
27)
-
-
-
-
(300,0
27)
(2,5
67)
(302,5
94)
Unq
uote
d or
dina
ry s
hare
s 2
4 (c
) -
12
,046
-
-
-
-
12,0
46
-
12,0
46
Tran
sfer
of
real
ised
gai
ns o
n sa
le
of s
hare
s -
(3
68,0
10)
368,
010
-
-
-
-
-
-
Cur
renc
y tra
nsla
tion
diffe
renc
es
-
-
-
-
424,
972
-
424,9
72
(11,
304)
413,6
68
Tota
l oth
er c
ompr
ehen
sive
inco
me
for
the
year
-
(6
55,9
91)
304,9
18
-
424,9
72
-
73,8
99
(13,8
71)
60,0
28
Tota
l com
pre
hen
sive
inco
me
for
the y
ea
r
-
(655,9
91)
950,4
02
-
424,9
72
-
719,3
83
237,2
44
956,6
27
Tran
sfer
to s
tatu
tory
res
erve
17 -
-
(1
33,3
00)
-
-
72,8
16
(60,4
84)
60,4
84
-
Tra
nsa
ctio
ns
wit
h o
wn
ers
201
4 D
ivid
end
paid
16
-
-
-
(359
,414
) -
-
(3
59,4
14)
-
(359,4
14)
Tot
al t
ran
sact
ion
s w
ith
ow
ner
s -
-
-
(3
59,4
14)
-
-
(359,4
14)
-
(359,4
14)
Ba
lan
ce a
t 31
Dec
emb
er 2
015
5,6
69,7
25
1,5
98,2
14
8,4
63,5
18
-
292,7
00
418,8
27
16,4
42,9
84
1,3
52,2
77
17,7
95,2
61
The
note
s on
pag
es 7
1 to
138
are
an
inte
gral
par
t of t
hese
fina
ncia
l sta
tem
ents
.
67ANNUAL REPORT & FINANCIAL STATEMENTS 2016

CO
NSO
LID
ATE
D S
TATE
MEN
T O
F C
HA
NG
ES I
N E
QU
ITY
(CO
NT’
D)
2016
Att
rib
uta
ble
to o
wn
ers
of
the p
are
nt
Note
s
Sha
re
cap
ita
l &
sh
are
p
rem
ium
KES
’000
Fa
ir
valu
e
rese
rves
KES
’000
R
eta
ined
ea
rnin
gs
KES
’000
Pro
pose
d
div
iden
ds
KES
’000
Tra
nsl
ati
on
re
serv
es
KES
’000
Sta
tuto
ry
rese
rve
KES
’000
Tota
lK
ES ’000
Non
-co
n-
trollin
g
inte
rest
KES
’000
Tota
l eq
uit
yK
ES ’000
Ba
lan
ce a
t 1 J
an
ua
ry 2
016
5,6
69,7
25
1,5
98,2
14
8,4
63,5
18
-
292,7
00
418,8
27
16,4
42,9
84
1,3
52,2
77
17,7
95,2
61
Oth
er c
ompr
ehen
sive
inco
me
Re-m
easu
rem
ent o
f ret
irem
ent
bene
fit o
blig
atio
ns -
-
(1
70,2
32)
-
-
-
(170,2
32)
-
(170,2
32)
Gai
ns/(
loss
es) o
n re
valu
atio
n of
eq
uity
inve
stm
ents
:
Quo
ted
ordi
nary
sha
res
24
(c)
-
(357
,268
) -
-
-
-
(3
57,2
68)
(4,6
10)
(361,8
78)
Unq
uote
d or
dina
ry s
hare
s 2
4 (c
) -
(9
01)
-
-
-
-
(901)
-
(901)
Cur
renc
y tra
nsla
tion
diffe
renc
es
-
-
-
-
(369
,223
) -
(3
69,2
23)
(24,
532)
(393,7
55)
Tota
l o
ther
com
pre
hen
sive
in
com
e f
or
the y
ea
r -
(3
58,1
69)
(170
,232
) -
(3
69,2
23)
-
(897,6
24)
(29,1
42)
(926,7
66)
Prof
it fo
r th
e ye
ar
-
-
937,
102
-
-
-
937,1
02
(111
,327
)825,7
75
Tota
l com
pre
hen
sive
inco
me
for
the y
ea
r
-
( 358,1
69)
766,8
70
-
(369,2
23)
-
39,4
78
(140,4
69)
(100,9
91)
Tran
sfer
to s
tatu
tory
res
erve
1735
,822
(7
6,42
7)(4
0,6
05)
40,6
05
-
Tra
nsa
ctio
ns
wit
h o
wn
ers
2016
Fin
al d
ivid
end
prop
osed
16
-
-
(359
,414
) 35
9,41
4 -
-
-
-
-
Tota
l tra
nsa
ctio
ns
wit
h o
wn
ers
-
-
(359,4
14)
359,4
14
-
-
-
-
-
Ba
lan
ce a
t 31
Dec
emb
er 2
016
5,6
69,7
25
1,2
40,0
45
8,9
06,7
96
359,4
14
( 76,5
23)
342,4
00
16,4
41,8
57
1,2
52,4
13
17,6
94,2
70
The
note
s on
pag
es 7
1 to
138
are
an
inte
gral
par
t of t
hese
fina
ncia
l sta
tem
ents
.
68 UAP OLD MUTUAL GROUP

Share Capital
& Share premium
Retained earnings
Proposed dividends Total
Notes KES ’000 KES ’000 KES ’000 KES ’000
Balance at 1 January 2015 5,669,725 756,137 359,414 6,785,276
Profit for the year - 993,341 - 993,341 Total comprehensive income for the year - 993,341 - 993,341
Transactions with owners - 2014 Dividend paid 16 - - (359,414) (359,414)
2015 Final dividend proposed 16 - - - - Total transactions with owners - - (359,414) (359,414)
Balance at 31 December 2015 5,669,725 1,749,478 - 7,419,203
Balance at 1 January 2016 5,669,725 1,749,478 - 7,419,203
Profit for the year - 372,170 - 372,170
Total comprehensive income for the year - 372,170 - 372,170
Transactions with owners - 2016 Final dividend proposed 16 - (359,414) 359,414 - Total transactions with owners - (359,414) 359,414 - Balance at 31 December 2016 5,669,725 1,762,234 359,414 7,791,373
The notes on pages 71 to 138 are an integral part of these financial statements.
Share Capital
& Share premium
Retained earnings
Proposed dividends Total
Notes KES ’000 KES ’000 KES ’000 KES ’000
COMPANY STATEMENT OF CHANGES IN EQUITY
69ANNUAL REPORT & FINANCIAL STATEMENTS 2016
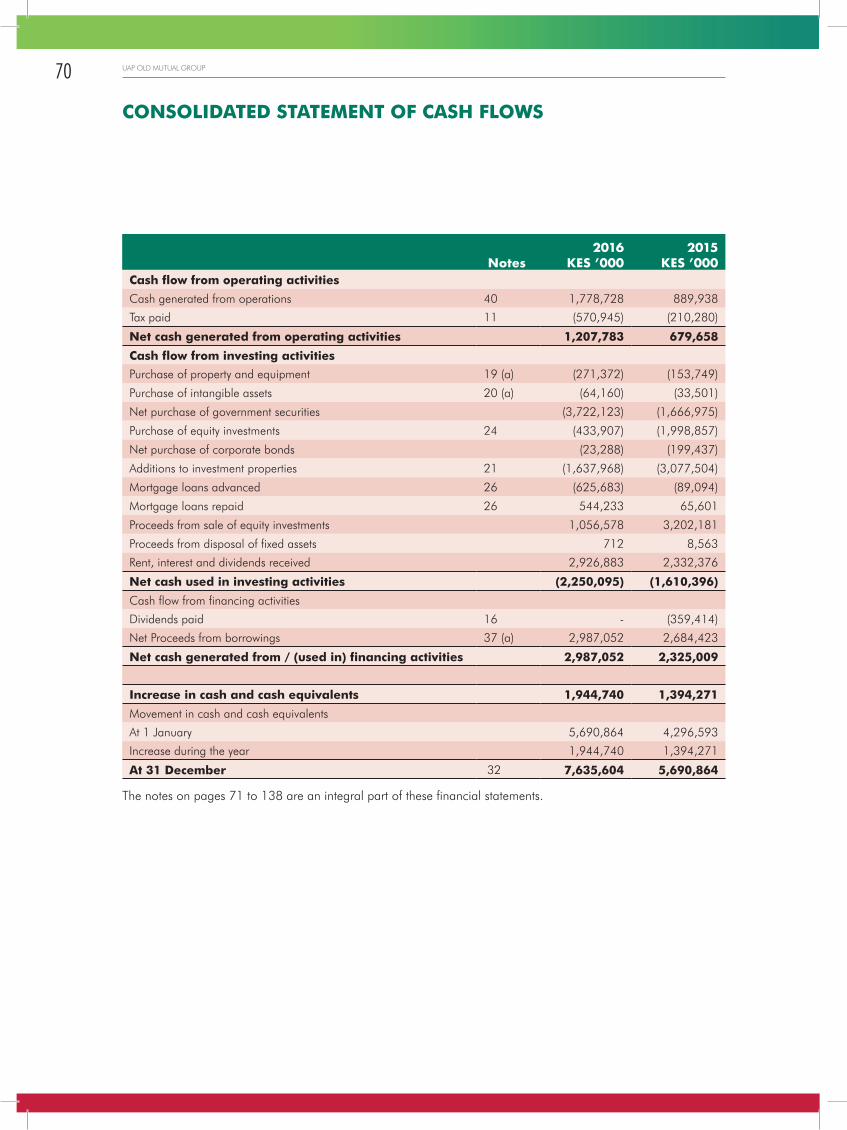
2016 2015 Notes KES ’000 KES ’000
Cash flow from operating activities
Cash generated from operations 40 1,778,728 889,938
Tax paid 11 (570,945) (210,280)
Net cash generated from operating activities 1,207,783 679,658
Cash flow from investing activities
Purchase of property and equipment 19 (a) (271,372) (153,749)
Purchase of intangible assets 20 (a) (64,160) (33,501)
Net purchase of government securities (3,722,123) (1,666,975)
Purchase of equity investments 24 (433,907) (1,998,857)
Net purchase of corporate bonds (23,288) (199,437)
Additions to investment properties 21 (1,637,968) (3,077,504)
Mortgage loans advanced 26 (625,683) (89,094)
Mortgage loans repaid 26 544,233 65,601
Proceeds from sale of equity investments 1,056,578 3,202,181
Proceeds from disposal of fixed assets 712 8,563
Rent, interest and dividends received 2,926,883 2,332,376
Net cash used in investing activities (2,250,095) (1,610,396)
Cash flow from financing activities
Dividends paid 16 - (359,414)
Net Proceeds from borrowings 37 (a) 2,987,052 2,684,423
Net cash generated from / (used in) financing activities 2,987,052 2,325,009
Increase in cash and cash equivalents 1,944,740 1,394,271
Movement in cash and cash equivalents
At 1 January 5,690,864 4,296,593
Increase during the year 1,944,740 1,394,271
At 31 December 32 7,635,604 5,690,864
The notes on pages 71 to 138 are an integral part of these financial statements.
CONSOLIDATED STATEMENT OF CASH FLOWS
70 UAP OLD MUTUAL GROUP

1. General informationThe Company is incorporated in Kenya under the Kenyan Companies Act 2015 as a limited liability company, and is domiciled in Kenya. The address of its registered office is Bishops Garden Towers, Bishops Road, P.O. Box 43013 - 00100 Nairobi.
The Company has seven subsidiary companies that operate as insurance companies and three property Companies in Kenya, Uganda and South Sudan. Four of the Company’s insurance subsidiaries are short term (“general”) insurance companies, two are long term (“life”) insurance companies and one is a composite insurance company selling both general and life insurance. Long term business comprises life assurance business, deposit administration business and investment contracts. Life assurance business relates to the underwriting of risks relating to death of an insured person, and includes contracts subject to the payment of premiums for a term dependent on the termination or continuance of the life of an insured person. Short term (general) insurance business relates to all other categories of short term insurance business, analysed into several sub-classes of business based on the nature of the assumed risks. The Group also holds investments in UAP Financial Services Limited Uganda and UAP Investments Kenya that provides stock broking services and fund management services. UAP Properties (Uganda) Limited and UAP Properties (South Sudan) Limited are property holding companies for Nakawa Business Park and Equatorial Towers which are located in Kampala and South Sudan respectively. The Group also holds an investment in UAP DRC sarl which offers insurance brokerage services.
2. Summary of significant accounting policiesThe principal accounting policies adopted in the preparation of these financial statements are set out below. These policies have been consistently applied to all years presented, unless otherwise stated.
a) Basis of preparationThe financial statements are prepared in compliance with International Financial Reporting Standards (IFRS) and in the manner required by the Kenyan Companies Act, 2015.
i) Basis of measurementThe measurement basis used is the historical cost basis except where otherwise stated in the accounting policies below.
For those assets and liabilities measured at fair value, fair value is the price that would be received to sell an asset or paid to transfer a liability in an orderly transaction between market participants at the measurement date. When measuring the fair value of an asset or a liability, the company uses market observable data as far as possible. If the fair value of an asset or a liability is not directly observable, it is estimated by the company using valuation techniques that maximise the use of relevant observable inputs and minimise the use of unobservable inputs (e.g. by use of the market comparable approach that reflects recent transaction prices for similar items or discounted cash flow analysis). Inputs used are consistent with the characteristics of the asset / liability that market participants would take into account.
Fair values are categorised into three levels of fair value hierarchy based on the degree to which the inputs to the measurements are observable and the significance of the inputs to the fair value measurement in its entirety. See note 4 (e).
ii) Use of estimatesThe preparation of financial statements in conformity with IFRS requires the use of certain critical accounting estimates. It also requires management to exercise its judgment in the process of applying the group’s accounting policies. The areas involving a higher degree of judgment or complexity, or areas where assumptions and estimates are significant to the consolidated financial statements are disclosed in note 3.
iii) Statement of complianceThe financial statements have been prepared in accordance with International Financial Reporting Standards (IFRSs) and the Kenyan Companies Act 2015.
NOTES TO THE FINANCIAL STATEMENTS
71ANNUAL REPORT & FINANCIAL STATEMENTS 2016

For Kenyan Companies Act 2015 reporting purposes in these financial statements, the balance sheet is represented by the statement of financial position and the profit and loss account is presented in the statement of profit or loss.
b) Changes to standards and new interpretations effective in 2016New standards, amendments and interpretation effective and adopted during the year by the GroupThe standards overleaf have been adopted by the Group for the first time for the financial year beginning on 1 January 2015 and none has a material impact on the Group.
i) New standards, amendments and interpretations effective and adopted during the yearThe Group has adopted the following new standards and amendments during the year ended 31 December 2016, including consequential amendments to other standards with the date of initial application by the Group being 1 January 2016. The nature and effects of the changes are explained below:
Clarification of Acceptable Methods of Depreciation and Amortisation (Amendments to IAS 16 and IAS 38) The amendments to IAS 16 Property, Plant and Equipment explicitly state that revenue-based methods of depreciation cannot be used for property, plant and equipment.
The amendments to IAS 38 Intangible Assets introduce a rebuttable presumption that the use of revenue-based amortisation methods for intangible assets is inappropriate. The presumption can be overcome only when revenue and the consumption of the economic benefits of the intangible asset are ‘highly correlated’, or when the intangible asset is expressed as a measure of revenue. The amendments apply prospectively for annual periods beginning on or after 1 January 2016.
The adoption of these changes did not have a significant impact on the financial statements of the Group.
Equity Method in Separate Financial Statements (Amendments to IAS 27)The amendments allow the use of the equity method in separate financial statements, and apply to the accounting not only for associates and joint ventures but also for subsidiaries. The amendments apply retrospectively for annual periods beginning on or after 1 January 2016.
The adoption of these changes did not have a significant impact on the financial statements of the Group.
Investment Entities: Applying the Consolidation Exception (Amendments to IFRS 10, IFRS 12 and IAS 28)The amendment to IFRS 10 Consolidated Financial Statements clarifies which subsidiaries of an investment entity are consolidated instead of being measured at fair value through profit and loss. The amendment also modifies the condition in the general consolidation exemption that requires an entity’s parent or ultimate parent to prepare consolidated financial statements. The amendment clarifies that this condition is also met where the ultimate parent or any intermediary parent of a parent entity measures subsidiaries at fair value through profit or loss in accordance with IFRS 10 and not only where the ultimate parent or intermediate parent consolidates its subsidiaries.
The amendment to IFRS 12 Disclosure of Interests in Other Entities requires an entity that prepares financial statements in which all its subsidiaries are measured at fair value through profit or loss in accordance with IFRS 10 to make disclosures required by IFRS 12 relating to investment entities.
The amendment to IAS 28 Investments in Associates and Joint Ventures modifies the conditions where an entity need not apply the equity method to its investments in associates or joint ventures to align these to the amended IFRS 10 conditions for not presenting consolidated financial statements.
2. Summary of significant accounting policies (continued)a) Basis of preparation (continued)iii) Statement of compliance (continued)
NOTES TO THE FINANCIAL STATEMENTS (CONT’D)
72 UAP OLD MUTUAL GROUP

The amendments introduce relief when applying the equity method which permits a non-investment entity investor in an associate or joint venture that is an investment entity to retain the fair value through profit or loss measurement applied by the associate or joint venture to its subsidiaries.The amendments apply retrospectively for annual periods beginning on or after 1 January 2016. The adoption of these changes did not have a significant impact on the financial statements of the Group.
Disclosure Initiative (Amendments to IAS 1)The amendments provide additional guidance on the application of materiality and aggregation when preparing financial statements. The amendment applies for annual periods beginning on or after 1 January 2016 and early application is permitted. The adoption of these changes does have a significant impact on the financial statements of the Group.
Annual improvements cycle (2012-2014) – various standards
STANDARD AMENDMENTSIFRS 5 Non-current Assets Held for Sale and Discontinued Operations
Changes in methods of disposal.Adds specific guidance in IFRS 5 for cases in which an entity reclassifies an asset from held for sale to held for distribution or vice versa and cases in which held-for-distribution accounting is discontinued.
IFRS 7 Financial Instruments: Disclosures (with consequential amendments to IFRS 1)
Servicing contracts.Adds additional guidance to clarify whether a servicing contract is continuing involvement in a transferred asset for the purpose of determining the disclosures required.
Applicability of the amendments to IFRS 7 to condensed interim financial statements.
Clarifies the applicability of the amendments to IFRS 7 on offsetting disclosures to condensed interim financial statements.
IAS 19 Employee BenefitsDiscount rate: regional market issue.Clarifies that the high quality corporate bonds used in estimating the discount rate for post-employment benefits should be denominated in the same currency as the benefits to be paid (thus, the depth of the market for high quality corporate bonds should be assessed at currency level).
IAS 34 Interim Financial Reporting Disclosure of information ‘elsewhere in the interim financial report’.Clarifies the meaning of ‘elsewhere in the interim report’ and requires a cross-reference
The adoption of these changes did not affect the amounts and disclosures of the Company’s financial statements.
2. Summary of significant accounting policies (continued)b) Changes to standards and new interpretations effective in 2016 (continued)
Investment Entities: Applying the Consolidation Exception (Amendments to IFRS 10, IFRS 12 and IAS 28) (continued)
NOTES TO THE FINANCIAL STATEMENTS (CONT’D)
73ANNUAL REPORT & FINANCIAL STATEMENTS 2016

i) New and amended standards and interpretations in issue but not yet effective for the year ended 31 December 2016
NEW STANDARD OR AMENDMENTSEFFECTIVE FOR ANNUAL PERIODS BEGINNING ON OR AFTER
Disclosure Initiative (Amendments to IAS 7) 1 January 2017
Recognition of Deferred Tax Assets for Unrealised Losses (Amendments to IAS 12) 1 January 2017
IFRS 15 Revenue from Contracts with Customers 1 January 2018IFRS 2: Accounting for modifications of share-based payment transactions from cash-settled to equity-settled
1 January 2018
IFRS 9 Financial Instruments (2014) 1 January 2018Applying IFRS 9 Financial Instruments with IFRS 4 Insurance Contracts (Amendments to IFRS 4)
1 January 2018
Amendments to IFRS 10 and IAS 28: Sale or Contribution of Assets between an Investor and its Associate or Joint Venture
To be determined
IFRIC Interpretation 22 Foreign Currenlty Transactions and Advance Consideration 1 January 2018
IFRS 16 Leases 1 January 2019
All standards and interpretations will be adopted at their effective date (except for those Standards and Interpretations that are not applicable to the entity).
Disclosure Initiative (Amendments to IAS 7)The amendments require disclosures that enable users of financial statements to evaluate changes in liabilities arising from financing activities, including both changes arising from cash flow and non-cash changes. The amendments are effective for annual periods beginning on or after 1 January 2017, with early adoption permitted.
The adoption of these changes will not affect the amounts and disclosures of the Company’s financial statements.
Recognition of Deferred Tax Assets for Unrealised Losses (Amendments to IAS 12)The amendments clarify the accounting for deferred tax assets for unrealised losses on debt instruments measured at fair value. The amendments are effective for annual periods beginning on or after 1 January 2017, with early adoption permitted.
The adoption of these changes will not affect the amounts and disclosures of the Company’s financial statements.
IFRS 15 Revenue from Contracts with CustomersThis standard replaces IAS 11 Construction Contracts, IAS 18 Revenue, IFRIC 13 Customer Loyalty Programmes, IFRIC 15 Agreements for the Construction of Real Estate, IFRIC 18 Transfer of Assets from Customers and SIC-31 Revenue – Barter of Transactions Involving Advertising Services.
The standard contains a single model that applies to contracts with customers and two approaches to recognising revenue: at a point in time or over time. The standard specifies how and when an IFRS reporter will recognise revenue as well as requiring such entities to provide users of financial statements with more informative, relevant disclosures. The standard provides a single, Principals based five-step model to be applied to all contracts with customers in recognising revenue being: Identify the contract(s) with a customer; Identify the performance obligations in the contract; Determine the transaction price; Allocate the transaction price to the performance obligations in the contract; and recognise revenue when (or as) the entity satisfies a performance obligation.
2. Summary of significant accounting policies (continued)b) Changes to standards and new interpretations effective in 2016 (continued)
NOTES TO THE FINANCIAL STATEMENTS (CONT’D)
74 UAP OLD MUTUAL GROUP

IFRS 15 is effective for annual reporting periods beginning on or after 1 January 2018, with early adoption permitted. The Company is assessing the impact of IFRS 15.
Classification and Measurement of Share-based Payment Transactions (Amendments to IFRS 2)
The following clarifications and amendments are contained in the pronouncement:
Accounting for cash-settled share-based payment transactions that include a performance conditionUp until this point, IFRS 2 contained no guidance on how vesting conditions affect the fair value of liabilities for cash-settled share-based payments. IASB has now added guidance that introduces accounting requirements for cash-settled share-based payments that follows the same approach as used for equity-settled share-based payments.
Classification of share-based payment transactions with net settlement features
IASB has introduced an exception into IFRS 2 so that a share-based payment where the entity settles the share-based payment arrangement net is classified as equity-settled in its entirety provided the share-based payment would have been classified as equity-settled had it not included the net settlement feature.
Accounting for modifications of share-based payment transactions from cash-settled to equity-settled
Up until this point, IFRS 2 did not specifically address situations where a cash-settled share-based payment changes to an equity-settled share-based payment because of modifications of the terms and conditions. The IASB has introduced the following clarifications:
• On such modifications, the original liability recognised in respect of the cash-settled share-based payment is derecognised and the equity-settled share-based payment is recognised at the modification date fair value to the extent services have been rendered up to the modification date.
• Any difference between the carrying amount of the liability as at the modification date and the amount recognised in equity at the same date would be recognised in profit and loss immediately.
The amendments are effective for annual periods beginning on or after 1 January 2018. Earlier application is permitted. The amendments are to be applied prospectively. However, retrospective application if allowed if this is possible without the use of hindsight. If an entity applies the amendments retrospectively, it must do so for all of the amendments described above.
The Company is assessing the IFRS 2’s full impact.
IFRS 9: Financial Instruments (2014)On 24 July 2014 the IASB issued the final IFRS 9 Financial Instruments Standard, which replaces earlier versions of IFRS 9 and completes the IASB’s project to replace IAS 39 Financial Instruments: Recognition and Measurement.
This standard introduces changes in the measurement bases of the financial assets to amortised cost, fair value through other comprehensive income or fair value through profit or loss. Even though these measurement categories are similar to IAS 39, the criteria for classification into these categories are significantly different. In addition, the IFRS 9 impairment model has been changed from an “incurred loss” model from IAS 39 to an “expected credit loss” model.
The standard is effective for annual periods beginning on or after 1 January 2018 with retrospective application, early adoption is permitted.The Directors are assessing the full impact of the adoption of this changes on the amounts and disclosures of the Group’s financial statements.
NOTES TO THE FINANCIAL STATEMENTS (CONT’D)
2. Summary of significant accounting policies (continued)b) Changes to standards and new interpretations effective in 2016 (continued) IFRS 15 Revenue from Contracts with Customers (continued)
75ANNUAL REPORT & FINANCIAL STATEMENTS 2016

Applying IFRS 9 Financial Instruments with IFRS 4 Insurance Contracts (Amendments to IFRS 4)The amendments in Applying IFRS 9 ‘Financial Instruments’ with IFRS 4 ‘Insurance Contracts’ (Amendments to IFRS 4) provide two options for entities that issue insurance contracts within the scope of IFRS 4: an option that permits entities to reclassify, from profit or loss to other comprehensive income, some of the income or expenses arising from designated financial assets; this is the so-called overlay approach; an optional temporary exemption from applying IFRS 9 for entities whose predominant activity is issuing contracts within the scope of IFRS 4; this is the so-called deferral approach.
The application of both approaches is optional and an entity is permitted to stop applying them before the new insurance contracts standard is applied.
An entity applies the overlay approach retrospectively to qualifying financial assets when it first applies IFRS 9. Application of the overlay approach requires disclosure of sufficient information to enable users of financial statements to understand how the amount reclassified in the reporting period is calculated and the effect of that reclassification on the financial statements.
An entity applies the deferral approach for annual periods beginning on or after 1 January 2018. Predominance is assessed at the reporting entity level at the annual reporting date that immediately precedes 1 April 2016. Application of the deferral approach needs to be disclosed together with information that enables users of financial statements to understand how the insurer qualified for the temporary exemption and to compare insurers applying the temporary exemption with entities applying IFRS 9. The deferral can only be made use of for the three years following 1 January 2018. Predominance is only reassessed if there is a change in the entity’s activities.
The Directors are assessing the full impact of the adoption of this changes on the amounts and disclosures of the Group’s financial statements.
Amendments to IFRS 10 and IAS 28: Sale or Contribution of Assets between an Investor and its Associate or Joint Venture The amendments require the full gain to be recognised when assets transferred between an investor and its associate or joint venture meet the definition of a ‘business’ under IFRS 3 Business Combinations. Where the assets transferred do not meet the definition of a business, a partial gain to the extent of unrelated investors’ interests in the associate or joint venture is recognised. The definition of a business is key to determining the extent of the gain to be recognised.
The effective date for these changes has now been postponed until the completion of a broader review.
The adoption of these changes will not have a significant impact on the financial statements of the Group.
IFRIC Interpretation 22 Foreign Currency Transactions and Advance Consideration
This Interpretation applies to a foreign currency transaction (or part of it) when an entity recognises a nonmonetary asset or non-monetary liability arising from the payment or receipt of advance considerationbefore the entity recognises the related asset, expense or income (or part of it).This Interpretation stipulates that the date of the transaction for the purpose of determining the exchangerate to use on initial recognition of the related asset, expense or income (or part of it) is the date on which an entity initially recognises the non-monetary asset or non-monetary liability arising from the payment or receipt of advance consideration.This Interpretation does not apply to income taxes, insurance contracts and circumstances when an entitymeasures the related asset, expense or income on initial recognition:
a) at fair value; orb) at the fair value of the consideration paid or received at a date other than the date of initial recognition of the
non-monetary asset or non-monetary liability arising from advance consideration (for example, the measurement of goodwill applying IFRS 3 Business Combinations).
NOTES TO THE FINANCIAL STATEMENTS (CONT’D)
2. Summary of significant accounting policies (continued)b) Changes to standards and new interpretations effective in 2016 (continued)
76 UAP OLD MUTUAL GROUP

The amendments apply retrospectively for annual periods beginning on or after 1 January 2018, with early application permitted.The adoption of these changes will not have an impact on the amounts and disclosures of the Company’s financial statements.
IFRS 16: LeasesOn 13 January 2016 the IASB issued IFRS 16 Leases, completing the IASB’s project to improve the financial reporting of leases. IFRS 16 replaces the previous leases standard, IAS 17 Leases, and related interpretations.
IFRS 16 sets out the Principals for the recognition, measurement, presentation and disclosure of leases for both parties to a contract, i.e. the customer (‘lessee’) and the supplier (‘lessor’). The standard defines a lease as a contract that conveys to the customer (‘lessee’) the right to use an asset for a period of time in exchange for consideration. A Company assesses whether a contract contains a lease on the basis of whether the customer has the right to control the use of an identified asset for a period of time.
The standard eliminates the classification of leases as either operating leases or finance leases for a lessee and introduces a single lessee accounting model. All leases are treated in a similar way to finance leases. Applying that model significantly affects the accounting and presentation of leases and consequently, the lessee is required to recognise:
• assets and liabilities for all leases with a term of more than 12 months, unless the underlying asset is of low value. A Company recognises the present value of the unavoidable lease payments and shows them either as lease assets (right-of-use assets) or together with property, plant and equipment. If lease payments are made over time, a Company also recognises a financial liability representing its obligation to make future lease payments.
• depreciation of lease assets and interest on lease liabilities in profit or loss over the lease term; and• separate the total amount of cash paid into a principal portion (presented within financing activities) and
interest (typically presented within either operating or financing activities) in the statement of cash flows.
IFRS 16 substantially carries forward the lessor accounting requirements in IAS 17. Accordingly, a lessor continues to classify its leases as operating leases or finance leases, and to account for those two types of leases differently. However, compared to IAS 17, IFRS 16 requires a lessor to disclose additional information about how it manages the risks related to its residual interest in assets subject to leases.
The standard does not require a Company to recognise assets and liabilities for:
• short-term leases (i.e. leases of 12 months or less) and;• leases of low-value assets
The new Standard is effective for annual periods beginning on or after 1 January 2019. Early application is permitted insofar as the recently issued revenue Standard, IFRS 15 Revenue from Contracts with Customers is also applied.
Management is assessing the impact of the adoption of the amendments to the Standard.
c) Insurance contracts
ClassificationThe Group issues contracts that transfer insurance risk. Insurance contracts are those contracts that transfer significant insurance risk. As a general guideline, the group defines as significant insurance risk, the possibility of having to pay benefits on the occurrence of an insured event that are at least 10% more than the benefits payable if the insured event did not occur.
NOTES TO THE FINANCIAL STATEMENTS (CONT’D)
2. Summary of significant accounting policies (continued)b) Changes to standards and new interpretations effective in 2016 (continued)
IFRIC Interpretation 22 Foreign Currency Transactions and Advance Consideration (continued)
77ANNUAL REPORT & FINANCIAL STATEMENTS 2016

Insurance contracts are classified into two main categories, depending on the duration of risk and as per the provisions of the Insurance Act: long term insurance business and short term insurance business. i) Long term insurance businessIncludes business of all or any of the following classes, namely; group life business, ordinary life business, deposit administration business and unit linked business.
Life insurance business means the business of, or in relation to, the issuing of, or the undertaking of liability to pay money on death (not being death by accident or in specified sickness only) or on the happening of any contingency dependent on the termination or continuance of human life (either with or without provision for a benefit under a continuous disability insurance contract), and include a contract which is subject to the payment of premiums for term dependent on the termination or continuance of human life and any contract securing the grant of an annuity for a term dependent upon human life.Superannuation business means life assurance business, being business of, or in relation to, the issuing of or the undertaking of the liability under superannuation, group life and permanent health insurance policy.
ii) Short term insurance businessMeans insurance business of any class or classes not being long term insurance business. Classes of general insurance include aviation insurance, engineering insurance, fire insurance - domestic risks, fire insurance - industrial and commercial risks, liability insurance, marine insurance, motor insurance-private vehicles, motor insurance - commercial vehicles, personal accident insurance, theft insurance, workmen’s compensation and employer’s liability insurance and miscellaneous insurance (i.e. class of business not included under those listed above) Motor insurance business means the business of affecting and carrying out contracts of insurance against loss of, or damage to, or arising out of or in connection with the use of, motor vehicles, inclusive of third party risks but exclusive of transit risks.
Personal accident insurance business means the business of affecting and carrying out contracts of insurance against risks of the persons insured sustaining injury as the result of an accident or of an accident of a specified class or dying as the result of an accident or of an accident of a specified class or becoming incapacitated in consequence of disease or of disease of a specified class.
Fire insurance business means the business of affecting and carrying out contracts of insurance, otherwise than incidental to some other class of insurance business against loss or damage to property due to fire, explosion, storm and other occurrences customarily included among the risks insured against in the fire insurance business.
Recognition and measurementi) Premium income For long term insurance business, premiums are recognised as revenue when they become payable by the contract holder. Premiums are shown before deduction of commission. For short term insurance business, premium income is recognised on assumption of risks, and includes estimates of premiums due but not yet received less unearned premium. Unearned premiums represent the proportion of the premiums written in periods up to the accounting date that relates to the unexpired terms of policies in force at the financial reporting date, and is computed using the 365ths method. Premiums are shown before deduction of commission and are gross of any taxes or duties levied on premiums.
ii) ClaimsFor long term insurance business, benefits are recorded as an expense when they are incurred. Claims arising on maturing policies are recognised when the claim becomes due for payment. Death claims are accounted for on notification. Surrenders are accounted for on payment. For short term insurance business, claims incurred comprise claims paid in the year and changes in the provision for outstanding claims. Claims paid represent all
NOTES TO THE FINANCIAL STATEMENTS (CONT’D)
2. Summary of significant accounting policies (continued)c) Insurance contracts (continued) Classification (continued)
78 UAP OLD MUTUAL GROUP

payments made during the year, whether arising from events during that or earlier years. Outstanding claims represent the estimated ultimate cost of settling all claims arising from incidents occurring prior to the financial reporting date, but not settled at that date. Outstanding claims are computed on the basis of the best information available at the time the records for the year are closed, and include provisions for claims incurred but not reported (“IBNR”). Outstanding claims are not discounted.
iii) Commissions payable and deferred acquisition costs (“DAC”)Commissions payable are based on the premium written and are recorded as an expense in the period in which they are incurred.
A proportion of commission payable is deferred and amortised over the period in which the related premium is earned. Deferred acquisition costs represent a proportion of acquisition costs that relate to policies that are in force at the period end.
iv) Liability adequacy testAt each financial reporting date, liability adequacy tests are performed to ensure the adequacy of the insurance contract liabilities net of related DAC. In performing these tests, current best estimates of future contractual cash flows and claims handling and administration expenses, as well as investment income from the assets backing such liabilities, are used. Any deficiency is immediately charged to profit or loss.
v) Reinsurance contracts heldContracts entered into by the Group with reinsurers under which the Group is compensated for losses on one or more contracts issued by the Group and that meet the classification requirements for insurance contracts are classified as reinsurance contracts held. Contracts that do not meet these classification requirements are classified as financial assets. Insurance contracts entered into by the Group under which the contract holder is another insurer (inwards reinsurance) are included with insurance contracts.
The benefits to which the Group is entitled under its reinsurance contracts held are recognised as reinsurance assets. These assets consist of short-term balances due from reinsurers, as well as longer term receivables that are dependent on the expected claims and benefits arising under the related reinsured insurance contracts. Amounts recoverable from or due to reinsurers are measured consistently with the amounts associated with the reinsured insurance contracts and in accordance with the terms of each reinsurance contract. Reinsurance liabilities are primarily premiums payable for reinsurance contracts and are recognised as an expense when due.
The Group assesses its reinsurance assets for impairment on a quarterly basis. If there is objective evidence that the reinsurance asset is impaired, the Group reduces the carrying amount of the reinsurance asset to its recoverable amount and recognises that impairment loss in profit or loss. The Group gathers the objective evidence that a reinsurance asset is impaired using the same process adopted for financial assets held at amortised cost. The impairment loss is also calculated following the same method used for these financial assets. These processes are set out under Note 2(j).
vi) Receivables and payables related to insurance contracts and investment contractsReceivables and payables are recognised when due. These include amounts due to and from agents, brokers and insurance contract holders.
If there is objective evidence that the insurance receivable is impaired, the Group reduces the carrying amount of the insurance receivable accordingly and recognises that impairment loss in the income statement. The Group gathers the objective evidence that an insurance receivable is impaired using the same process adopted for financial assets classified at amortised cost. The impairment loss is also calculated under the same method used for these financial assets. These processes are described under Note 2 (j).
NOTES TO THE FINANCIAL STATEMENTS (CONT’D)
2. Summary of significant accounting policies (continued)c) Insurance contracts (continued)
Recognition and measurement (continued) ii) Claims (continued)
79ANNUAL REPORT & FINANCIAL STATEMENTS 2016

vii) Salvage and subrogation reimbursementsSome insurance contracts permit the Group to sell (usually damaged) property acquired in settling a claim (for example, salvage). The Group may also have the right to pursue third parties for payment of some or all costs (for example, subrogation). Estimates of salvage recoveries are included as an allowance in the measurement of the insurance liability for claims, and salvage property is recognised in other assets when the liability is settled. The allowance is the amount that can reasonably be recovered from the disposal of the property.
Subrogation reimbursements are also considered as an allowance in the measurement of the insurance liability for claims and are recognised in other assets when the liability is settled. The allowance is the assessment of the amount that can be recovered from the action against the liable third party.
d) Revenue recognition
i) Insurance premium revenueThe revenue recognition policy relating to insurance contracts is set out under note 2 (b) above.
ii) CommissionsCommissions receivable are recognised as income in the period in which they are earned.
iii) Interest incomeInterest income is recognised on a time proportion basis that takes into account the effective yield on the asset. When a receivable is impaired, the Group reduces the carrying amount to its recoverable amount, being the estimated future cash flow discounted at the original effective interest rate of the instrument, and continues unwinding the discount as interest income.
iv) Dividend incomeDividends are recognised as income in the period in which the right to receive payment is established.
v) Rental incomeRental income is recognised as income in the period in which it is earned. All investment income is stated net of investment expenses.
vi) Fee incomeFee income consists primarily of administration fees arising from services rendered in relation to the issue and management of deposit administration and investment contracts. Fees are recognised in the accounting period in which the services are rendered and are presented in the income statement within ‘other income’.
e) Investment contracts The Group issues investment contracts without fixed terms (unit-linked) and investment contracts with fixed and guaranteed terms (fixed interest rate). The investment contracts include funds administered for a number of retirement benefit schemes.
Investment contracts without fixed terms are financial liabilities whose fair value is dependent on the fair value of underlying financial assets, and are designated at inception as at fair value through profit or loss. The Group designates these investment contracts to be measured at fair value through profit or loss because it eliminates or significantly reduces a measurement or recognition inconsistency (sometimes referred to as ‘an accounting mismatch’) that would otherwise arise from measuring assets or liabilities or recognising the gains and losses on them on different bases.
The best evidence of the fair value of these financial liabilities at initial recognition is the transaction price (i.e. the fair value received) unless the fair value of that instrument is evidenced by comparison with other observable current market transactions in the same instrument or based on a valuation technique whose variables include only data from observable markets. When such evidence exists, the Group recognises profit at inception.
NOTES TO THE FINANCIAL STATEMENTS (CONT’D)
2. Summary of significant accounting policies (continued)c) Insurance contracts (continued)
80 UAP OLD MUTUAL GROUP

The fair value of financial liabilities for investment contracts without fixed terms is determined using the current unit values in which the contractual benefits are denominated. These unit values reflect the fair values of the financial assets contained within the Group’s unitised investment funds linked to the financial liability. The fair value of the financial liabilities is obtained by multiplying the number of units attributed to each contract holder at the financial reporting date by the unit value for the same date.
For investment contracts with fixed and guaranteed terms, the amortised cost basis is used. In this case, the liability is initially measured at its fair value less transaction costs that are incremental and directly attributable to the acquisition or issue of the contract.
Subsequent measurement of investment contracts at amortised cost uses the effective interest method. This method requires the determination of an interest rate (the effective interest rate) that exactly discounts to the net carrying amount of the financial liability, the estimated future cash payments or receipts through the expected life of the financial instrument or, when appropriate, a shorter period if the holder has the option to redeem the instrument earlier than maturity.
The Group re-estimates at each reporting date the expected future cash flows and recalculates the carrying amount of the financial liability by computing the present value of estimated future cash flows using the financial liability’s original effective interest rate. Any adjustment is immediately recognised as income or expense in the income statement.
f) Property and equipmentAll categories of property and equipment are initially recorded at cost and subsequently stated at historical cost less depreciation. Historical cost includes expenditure that is directly attributable to the acquisition of the items.Subsequent costs are included in the asset’s carrying amount or recognised as a separate asset, as appropriate, only when it is probable that future economic benefits associated with the item will flow to the Group and the cost of the item can be measured reliably. All other repairs and maintenance costs are charged to the income statement during the financial period in which they are incurred.
Depreciation is calculated using the straight line method to write down their cost to their residual values over their estimated useful lives, as follows:
• Motor vehicles – 5 years• Computers & computer equipment – 3 years• Office equipment – 5 years • Furniture & fittings – 8 years
The assets’ residual values and useful lives are reviewed, and adjusted if appropriate, at each financial reporting date. An asset’s carrying amount is written down immediately to its estimated recoverable amount if the asset’s carrying amount is greater than its estimated recoverable amount.
Gains and losses on disposal of property and equipment are determined by comparing proceeds with carrying amount and are included in the income statement.
g) Investment propertiesBuildings, or part of a building, (freehold or held under a finance lease) and land (freehold or held under an operating lease) held for long term rental yields and/or capital appreciation and are not occupied by the Group are classified as investment property under non-current assets. Investment property is carried at fair value, representing open market value determined annually by external valuers. Properties under construction and development sites with projected use as Investment properties are valued at projected fair values taking into account current market conditions, outstanding investment costs and a risk loading according to the progress of the project. Changes in fair values are included in investment income in the income statement.
NOTES TO THE FINANCIAL STATEMENTS (CONT’D)
2. Summary of significant accounting policies (continued)e) Investment contracts (continued)
81ANNUAL REPORT & FINANCIAL STATEMENTS 2016

h) Intangible assetsThe Group’s intangible assets relate to computer software and goodwill (note 2(r)). Acquired computer software licences are capitalised on the basis of the costs incurred to acquire and bring to use the specific software. These costs are amortised over their estimated useful lives of three years.
Development costs that are directly associated with the production of identifiable and unique software products controlled by the Group, and that will probably generate economic benefits exceeding costs beyond one year, are recognised as intangible assets if:
• It is technically feasible to complete the software product so that it will be available for use; • Management intends to complete the software product and use or sell it;• There is an ability to use or sell the software product;• It can be demonstrated how the software product will generate probable future economic benefits;• Adequate technical, financial and other resources to complete the development and use or sell it are
available; and,• The expenditure attributable to the software product during its development can be reliably measured.
Direct costs include the software development, employee costs and an appropriate portion of relevant overheads. Other development expediture that do not meet these criteria are recognised as an expense as incurred. Development costs that have been expensed are not recognised as an asset in a subsequent period. Computer software development costs recognised as assets are amortised over their estimated useful lives (not exceeding three years). Costs associated with maintaining computer software programmes are recognised as an expense as incurred.
i) Impairment of non-financial assetsAssets that have an indefinite useful life are not subject to amortisation and are tested annually for impairment. Assets that are subject to amortisation are reviewed for impairment whenever events or changes in circumstances indicate that the carrying amount may not be recoverable. An impairment loss is recognised for the amount by which the asset’s carrying amount exceeds its recoverable amount. The recoverable amount is the higher of an asset’s fair value less costs to sell and value in use. For the purposes of assessing impairment, assets are grouped at the lowest levels for which there are separately identifiable cash flows (cash-generating units). Non-financial assets other than goodwill that suffered an impairment are reviewed for possible reversal of the impairment at each reporting date.
j) Financial assets
Classification and measurementThe Group classifies its financial assets as subsequently measured at either amortised cost or fair value on the basis of both the Group’s business model for managing the financial assets and the contractual cash flow characteristics of the financial asset. A financial asset is measured at amortised cost if both of the following conditions are met:
• the asset is held within a business model whose objective is to hold assets in order to collect contractual cash flows.
• the contractual terms of the financial asset give rise on specified dates to cash flows that are solely payments of principal and interest on the principal amount outstanding.
The Group’s corporate bonds, government securities, receivables, mortgage loans, cash at bank and deposits with financial institutions are classified at amortised cost. The carrying values of various categories of Financial asset and Financial liabilities are shown in note 43.
All financial assets that do not meet the above criteria are measured at fair value. Equity investments for life business are classified at fair value through profit or loss. Equity investment for non life business are classified at fair value through other comprehensive income (note 24).
2. Summary of significant accounting policies (continued)
NOTES TO THE FINANCIAL STATEMENTS (CONT’D)
82 UAP OLD MUTUAL GROUP

Recognition and de-recognitionFinancial assets are recognised when the Group becomes a party to the contractual provisions of the asset. Initial recognition of financial asset is at fair value plus, for all financial assets except those carried at fair value through profit or loss, transaction costs. Financial assets are derecognised when the rights to receive cash flows from the financial assets have expired or where the Group has transferred substantially all risks and rewards of ownership.
Equity investments are carried at fair value. Gains and losses arising from changes in the fair value of equity investments are recognised in other comprehensive income. When equity investments are derecognised, the cumulative gain or loss previously recognised in other comprehensive income are transferred to retained earnings. Dividends on equity instruments are recognised in the income statement when the Group’s right to receive payment is established.
Fair values of quoted investments in active markets are based on current bid prices. Fair values for unlisted equity securities are estimated using valuation techniques. These include the use of recent arm’s length transactions, discounted cash flow analysis and other valuation techniques commonly used by market participants.
k) Impairment of financial assets
Assets carried at amortised costThe Group assesses at each financial reporting date whether there is objective evidence that a financial asset or a group of financial assets measured at amortised cost is impaired. A financial asset or a group of financial assets is impaired and impairment losses are incurred only if there is objective evidence of impairment as a result of one or more events that occurred after initial recognition of the asset (a ‘loss event’) and that loss event (or events) has an impact on the estimated future cash flows of the financial asset or group of financial assets that can be reliably estimated.
Objective evidence that a financial asset or group of assets is impaired includes observable data that comes to the attention of the Group about the following loss events:
a) significant financial difficulty of the borrower;b) a breach of contract, such as default or delinquency in interest or principal repayments;c) the Group granting to the borrower, for economic or legal reasons relating to the borrower’s financial
difficulty, a concession that the Group would not otherwise consider;d) it becoming probable that the borrower will enter bankruptcy or other financial reorganisation;e) the disappearance of an active market for that financial asset because of financial difficulties; orf) observable data indicating that there is a measurable decrease in the estimated future cash flows from a
group of financial assets since the initial recognition of those assets, although the decrease cannot yet be identified with the individual financial assets in the Group, including:
• adverse changes in the payment status of borrowers in the Group; or• national or local economic conditions that correlate with defaults on the assets in the Group.
The estimated period between a loss occurring and its identification is determined by management for each identified portfolio.
The Group first assesses whether objective evidence of impairment exists individually for financial assets that are individually significant, and individually or collectively for financial assets that are not individually significant. If the Group determines that no objective evidence of impairment exists for an individually assessed financial asset, whether significant or not, it includes the asset in a group of financial assets with similar credit risk characteristics and collectively assesses them for impairment. Assets that are individually assessed for impairment and for which an impairment loss is or continues to be recognised are not included in a collective assessment of impairment.
If there is objective evidence that an impairment loss on financial assets carried at amortised cost has been incurred, the amount of the loss is measured as the difference between the asset’s carrying amount and the present value of estimated future cash flows (excluding future credit losses that have not been incurred) discounted
NOTES TO THE FINANCIAL STATEMENTS (CONT’D)
2. Summary of significant accounting policies (continued)j) Financial assets (continued)
83ANNUAL REPORT & FINANCIAL STATEMENTS 2016

at the financial instrument’s original effective interest rate. The carrying amount of the asset is reduced through the use of an allowance account and the amount of the loss is recognised in the income statement. If a loan has a variable interest rate, the discount rate for measuring any impairment loss is the current effective interest rate determined under the contract. As a practical expedient, the Group may measure impairment on the basis of an instrument’s fair value using an observable market price.
The calculation of the present value of the estimated future cash flows of a collateralised financial asset reflects the cash flows that may result from foreclosure less costs for obtaining and selling the collateral, whether or not foreclosure is probable.
For the purposes of a collective evaluation of impairment, financial assets are grouped on the basis of similar credit risk characteristics (i.e. on the basis of the Group’s grading process that considers asset type, industry, geographical location, collateral type, past-due status and other relevant factors). Those characteristics are relevant to the estimation of future cash flows for groups of such assets by being indicative of the debtors’ ability to pay all amounts due according to the contractual terms of the assets being evaluated.
Future cash flows in a group of financial assets that are collectively evaluated for impairment are estimated on the basis of the contractual cash flows of the assets in the Group and historical loss experience for assets with credit risk characteristics similar to those in the Group. Historical loss experience is adjusted on the basis of current observable data to reflect the effects of current conditions that did not affect the period on which the historical loss experience is based and to remove the effects of conditions in the historical period that do not exist currently.
When a loan is uncollectible, it is written off against the related provision for loan impairment. Such loans are written off after all the necessary procedures have been completed and the amount of the loss has been determined. Subsequent recoveries of amounts previously written off decrease the amount of the provision for loan impairment in the income statement.
If, in a subsequent period, the amount of the impairment loss decreases and the decrease can be related objectively to an event occurring after the impairment was recognised (such as an improvement in the debtor’s credit rating), the previously recognised impairment loss is reversed by adjusting the allowance account. The amount of the reversal is recognised in the income statement.
Loans that are either subject to collective impairment assessment or individually significant and whose terms have been renegotiated are no longer considered to be past due but are treated as new loans. In subsequent years, the renegotiated terms apply in determining whether the asset is considered to be past due.
l) Accounting for leasesLeases of property and equipment where the Group assumes substantially all the risks and rewards of ownership are classified as finance leases. Assets acquired under finance leases are capitalised at the inception of the lease at the lower of their fair value and the estimated present value of the underlying lease payments. Each lease payment is allocated between the liability and finance charges so as to achieve a constant rate on the finance balance outstanding. The corresponding rental obligations, net of finance charges, are included in non-current liabilities. The interest element of the finance charge is charged to the income statement over the lease period. Property and equipment acquired under finance leases is depreciated over the estimated useful life of the asset.
Leases in which a significant portion of the risks and rewards of ownership are retained by the lessor are classified as operating leases. Payments made under operating leases are charged to the income statement on a straight-line basis over the period of the lease.
m) Cash and cash equivalentsCash and cash equivalents includes cash in hand, deposits held at call with banks, other short term highly liquid investments with original maturities of three months or less, and bank overdrafts.
NOTES TO THE FINANCIAL STATEMENTS (CONT’D)
2. Summary of significant accounting policies (continued)k) Impairment of financial assets (continued)
Assets carried at amortised cost (continued)
84 UAP OLD MUTUAL GROUP

n) Employee benefits
(i) Retirement benefit obligationsThe Group operates a defined benefit scheme for employees. A defined benefit plan is a pension plan that defines an amount of pension benefit that an employee will receive on retirement, usually dependent on one or more factors such as age, years of service and compensation d an amount of pension benefit that an employee will receive on retirement, usually dependent on one or more factors such as age, years of service and compensation.
The liability recognised in the statement of financial position in respect of defined benefit pension plans is the present value of the defined benefit obligation at the end of the reporting period less the fair value of plan assets. The defined benefit obligation is calculated annually by independent actuaries using the projected unit credit method. The present value of the defined benefit obligation is determined by discounting the estimated future cash outflows using interest rates of government bonds that are denominated in the currency in which the benefits will be paid, and that have terms to maturity approximating to the terms of the related pension obligation.
Actuarial gains and losses arising from experience adjustments and changes in actuarial assumptions are charged or credited to equity in other comprehensive income in the period in which they arise. Past-service costs are recognised immediately in income.ii) Other entitlementsEmployee entitlements to long service awards are recognised when they accrue to employees. A provision is made for the estimated liability for such entitlements as a result of services rendered by employees up to the financial reporting date.
The estimated monetary liability for employees’ accrued annual leave entitlement at the financial reporting date is recognised as an expense accrual.
o) Current and deferred income taxThe tax expense for the period comprises current and deferred income tax. Tax is recognised in the profit or loss except to the extent that it relates to items recognised in other comprehensive income or directly in equity. In this case, the tax is also recognised in other comprehensive income or directly in equity, respectively.
The current income tax charge is calculated on the basis of the tax enacted or substantively enacted at the reporting date. Management periodically evaluates positions taken in tax returns with respect to situations in which applicable tax regulation is subject to interpretation. It establishes provisions where appropriate on the basis of amounts expected to be paid to the tax authorities.
Deferred income tax is recognised, using the liability method, on temporary differences arising between the tax bases of assets and liabilities and their carrying values in the financial statements. However, if the deferred tax liabilities are not recognised if they arise from the initial recognition of goodwill; deferred income tax is not accounted for if it arises from initial recognition of an asset or liability in a transaction other than a business combination that at the time of the transaction affects neither accounting nor taxable profit or loss. Deferred income tax is determined using tax rates and laws that have been enacted or substantively enacted at the reporting date and are expected to apply when the related deferred income tax liability is settled.
Deferred income tax assets are recognised only to the extent that it is probable that future taxable profits will be available against which the temporary differences can be utilised. Deferred income tax is provided on temporary differences arising on investments in subsidiaries and associates, except where the timing of the reversal of the temporary difference is controlled by the Group and it is probable that the temporary difference will not reverse in the foreseeable future.
Deferred income tax assets and liabilities are offset when there is a legally enforceable right to offset current tax assets against current tax liabilities and when the deferred income taxes assets and liabilities relate to income taxes levied by the same taxation authority on either the same taxable entity or different taxable entities where there is an intention to settle the balances on a net basis.
NOTES TO THE FINANCIAL STATEMENTS (CONT’D)
2. Summary of significant accounting policies (continued)
85ANNUAL REPORT & FINANCIAL STATEMENTS 2016

p) Functional currency and translation of foreign currencies
i) Functional and presentation currencyItems included in the financial statements of each of the Group’s entities are measured using the currency of the primary economic environment in which the entity operates (‘the functional currency’). The consolidated financial statements are presented in ‘Kenyan Shillings (Kes), which is the Group’s presentation currency.
ii) Transactions and balancesForeign currency transactions are translated into the functional currency using exchange rates prevailing at the dates of the transactions or valuation where items are re-measured. Foreign exchange gains and losses resulting from the settlement of such transactions and from the translation at year-end exchange rates of monetary assets and liabilities denominated in foreign currencies are recognised in profit or loss.
Foreign exchange gains and losses that relate to borrowings and cash and cash equivalents are presented in profit or loss within ‘finance income or cost’. All other foreign exchange gains and losses are presented in profit or loss within ‘other income’ or ‘other expenses’. Translation differences related to changes in amortised cost are recognised in profit or loss, and other changes in carrying amount are recognised in other comprehensive income.
Translation differences on non-monetary financial assets and liabilities, such as equities held at fair value through profit or loss, are recognised in profit or loss as part of the fair value gain or loss. Translation differences on non-monetary financial assets, such as equities classified as available-for-sale financial assets, are included in other comprehensive income.
iii) Group balancesThe results and financial position of all the Group entities (none of which has the currency of a hyperinflationary economy) that have a functional currency different from the presentation currency are translated into the presentation currency as follows:
• assets and liabilities for each statement of financial position presented are translated at the closing rate at the end of the reporting period;
• income and expenses for each income statement amount are translated at average exchange rates (unless this average is not a reasonable approximation of the cumulative effect of the rates prevailing on the transaction dates, in which case income and expenses are translated at the dates of the transactions); and
• all resulting exchange differences are recognised in other comprehensive income.
Goodwill and fair value adjustments arising on the acquisition of a foreign entity are treated as assets and liabilities of the foreign entity and translated at the closing rate. Exchange differences arising are recognised in equity.
q) DividendsDividends payable to the Group’s shareholders are charged to equity in the period in which they are declared. Proposed dividends are shown as a separate component of equity until declared.
r) Consolidation
(i) SubsidiariesSubsidiaries are all entities (including structured entities) over which the group has control. The group controls an entity when the group is exposed to, or has rights to variable returns from its involvement with the entity and has the ability to affect those returns through its power over the entity. Subsidiaries are fully consolidated from the date on which control is transferred to the group. They are deconsolidated from the date that control ceases.
The group applies the acquisition method to account for business combinations. The consideration transferred for the acquisition of a subsidiary is the fair values of the assets transferred, the liabilities incurred to the former
NOTES TO THE FINANCIAL STATEMENTS (CONT’D)
2. Summary of significant accounting policies (continued)
86 UAP OLD MUTUAL GROUP

owners of the acquiree and the equity interests issued by the group. The consideration transferred includes the fair value of any asset or liability resulting from a contingent consideration arrangement. Identifiable assets acquired and liabilities and contingent liabilities assumed in a business combination are measured initially at their fair values at the acquisition date. The group recognises any non-controlling interest in the acquiree on an acquisition-by-acquisition basis, either at fair value or at the non-controlling interest’s proportionate share of the recognised amounts of acquiree’s identifiable net assets.
Acquisition-related costs are expensed as incurred.
If the business combination is achieved in stages, the acquisition date carrying value of the acquirer’s previously held equity interest in the acquiree is re-measured to fair value at the acquisition date; any gains or losses arising from such re-measurement are recognised in profit or loss.
Any contingent consideration to be transferred by the group is recognised at fair value at the acquisition date. Subsequent changes to the fair value of the contingent consideration that is deemed to be an asset or liability is recognised in accordance with IAS 39 either in profit or loss or as a change to other comprehensive income. Contingent consideration that is classified as equity is not re-measured, and its subsequent settlement is accounted for within equity.
The excess of the consideration transferred the amount of any non-controlling interest in the acquiree and the acquisition-date fair value of any previous equity interest in the acquiree over the fair value of the identifiable net assets acquired is recorded as goodwill. If the total of consideration transferred, non-controlling interest recognised and eviously held interest measured is less than the fair value of the net assets of the subsidiary acquired in the case of a bargain purchase, the difference is recognised directly in the income statement.
Inter-company transactions, balances and unrealised gains on transactions between group companies are eliminated. Unrealised losses are also eliminated. When necessary amounts reported by subsidiaries have been adjusted to conform with the group’s accounting policies.
ii) Changes in ownership interests in subsidiaries without change of controlTransactions with non-controlling interests that do not result in loss of control are accounted for as equity transactions – that is, as transactions with the owners in their capacity as owners. The difference between fair value of any consideration paid and the relevant share acquired of the carrying value of net assets of the subsidiary is recorded in equity. Gains or losses on disposals to non-controlling interests are also recorded in equity.
iii) Disposal of subsidiariesWhen the group ceases to have control any retained interest in the entity is remeasured to its fair value at the date when control is lost, with the change in carrying amount recognised in profit or loss. The fair value is the initial carrying amount for the purposes of subsequently accounting for the retained interest as an associate, joint venture or financial asset. In addition, any amounts previously recognised in other comprehensive income in respect of that entity are accounted for as if the group had directly disposed of the related assets or liabilities. This may mean that amounts previously recognised in other comprehensive income are reclassified to profit or loss.
iv) AssociatesAssociates are all entities over which the group has significant influence but not control, generally accompanying a shareholding of between 20% and 50% of the voting rights. Investments in associates are accounted for using the equity method of accounting. Under the equity method, the investment is initially recognised at cost, and the carrying amount is increased or decreased to recognise the investor’s share of the profit or loss of the investee after the date of acquisition. The group’s investment in associates includes goodwill identified on acquisition.
If the ownership interest in an associate is reduced but significant influence is retained, only a proportionate share of the amounts previously recognised in other comprehensive income is reclassified to profit or loss where
2. Summary of significant accounting policies (continued)r) Consolidation (continued)
(i) Subsidiaries (continued)
NOTES TO THE FINANCIAL STATEMENTS (CONT’D)
87ANNUAL REPORT & FINANCIAL STATEMENTS 2016
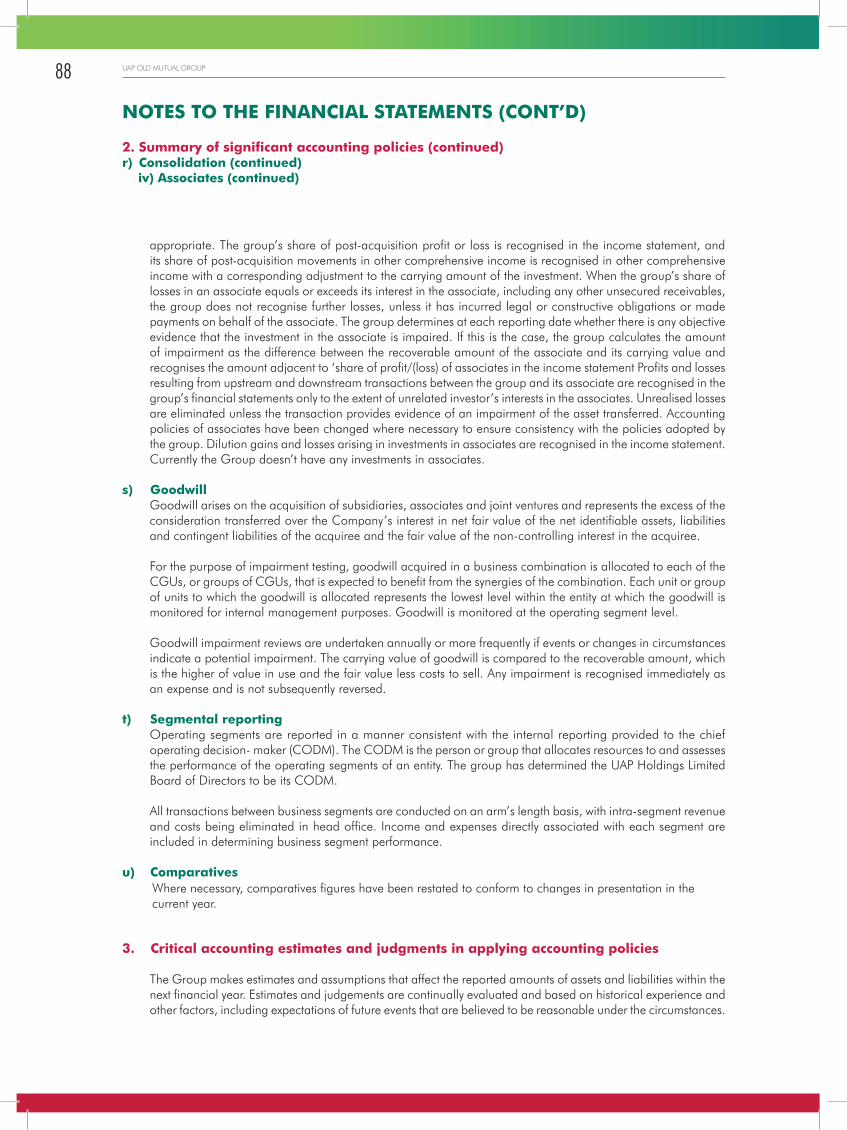
appropriate. The group’s share of post-acquisition profit or loss is recognised in the income statement, and its share of post-acquisition movements in other comprehensive income is recognised in other comprehensive income with a corresponding adjustment to the carrying amount of the investment. When the group’s share of losses in an associate equals or exceeds its interest in the associate, including any other unsecured receivables, the group does not recognise further losses, unless it has incurred legal or constructive obligations or made payments on behalf of the associate. The group determines at each reporting date whether there is any objective evidence that the investment in the associate is impaired. If this is the case, the group calculates the amount of impairment as the difference between the recoverable amount of the associate and its carrying value and recognises the amount adjacent to ‘share of profit/(loss) of associates in the income statement Profits and losses resulting from upstream and downstream transactions between the group and its associate are recognised in the group’s financial statements only to the extent of unrelated investor’s interests in the associates. Unrealised losses are eliminated unless the transaction provides evidence of an impairment of the asset transferred. Accounting policies of associates have been changed where necessary to ensure consistency with the policies adopted by the group. Dilution gains and losses arising in investments in associates are recognised in the income statement. Currently the Group doesn’t have any investments in associates.
s) GoodwillGoodwill arises on the acquisition of subsidiaries, associates and joint ventures and represents the excess of the consideration transferred over the Company’s interest in net fair value of the net identifiable assets, liabilities and contingent liabilities of the acquiree and the fair value of the non-controlling interest in the acquiree.
For the purpose of impairment testing, goodwill acquired in a business combination is allocated to each of the CGUs, or groups of CGUs, that is expected to benefit from the synergies of the combination. Each unit or group of units to which the goodwill is allocated represents the lowest level within the entity at which the goodwill is monitored for internal management purposes. Goodwill is monitored at the operating segment level.
Goodwill impairment reviews are undertaken annually or more frequently if events or changes in circumstances indicate a potential impairment. The carrying value of goodwill is compared to the recoverable amount, which is the higher of value in use and the fair value less costs to sell. Any impairment is recognised immediately as an expense and is not subsequently reversed.
t) Segmental reportingOperating segments are reported in a manner consistent with the internal reporting provided to the chief operating decision- maker (CODM). The CODM is the person or group that allocates resources to and assesses the performance of the operating segments of an entity. The group has determined the UAP Holdings Limited Board of Directors to be its CODM.
All transactions between business segments are conducted on an arm’s length basis, with intra-segment revenue and costs being eliminated in head office. Income and expenses directly associated with each segment are included in determining business segment performance.
u) Comparatives Where necessary, comparatives figures have been restated to conform to changes in presentation in the
current year.
3. Critical accounting estimates and judgments in applying accounting policies
The Group makes estimates and assumptions that affect the reported amounts of assets and liabilities within the next financial year. Estimates and judgements are continually evaluated and based on historical experience and other factors, including expectations of future events that are believed to be reasonable under the circumstances.
2. Summary of significant accounting policies (continued)r) Consolidation (continued)
iv) Associates (continued)
NOTES TO THE FINANCIAL STATEMENTS (CONT’D)
88 UAP OLD MUTUAL GROUP

i) Future benefit payments from long-term insurance contractsThe estimation of future benefit payments from long-term insurance contracts is one of the Group’s most critical accounting estimates. There are several sources of uncertainty that need to be considered in the estimate of the liability that the Group will ultimately pay for such claims. Note 33 contains further details on this process.
The determination of the liabilities under long-term insurance contracts is dependent on estimates made by the Group. Estimates are made as to the expected number of deaths for each of the years in which the Group is exposed to risk. The Group bases these estimates on standard mortality tables that reflect historical mortality experience. The estimated number of deaths determines the value of the benefit payments and the value of the valuation premiums. The main source of uncertainty is that epidemics such as AIDS could result in future mortality being significantly worse than in the past for the age groups in which the Group has significant exposure to mortality risk. However, continuing improvements in medical care and social conditions could result in improvements in longevity in excess of those allowed for in the estimates used to determine the liability for contracts where the Group is exposed to longevity risk. For contracts without fixed terms and with discretionary participation in profits, it is assumed that the Group will be able to increase mortality risk charges in future years in line with emerging mortality experience. Estimates are also made as to future investment income arising from the assets backing long-term insurance contracts. These estimates are based on current market returns as well as expectations about future economic and financial developments. The average estimated rate of investment return is 12.25% p.a.(2015:13.5% p.a.).
ii) Claims reserving and determination of IBNRThe estimation of future contractual cash flows in relation to reported losses and losses incurred but not reported is a key accounting estimate. There are several sources of uncertainty that need to be considered in the estimate of the liability that the Group will ultimately pay for such claims. Case estimates are computed on the basis of the best information available at the time the records for the year are closed. Further details on the process used to estimate claims incurred but not reported and amounts recorded as liabilities at the end of the current and previous year are set out in note 33 of the financial statements.
iii) Fair value of financial assetsFair values of certain financial assets recognised in the financial statements are determined using valuation techniques based on assumptions that are not supported by prices from current market transactions or observable market data.
The fair values of financial instruments that are not quoted in active markets are determined by using valuation techniques. Where valuation techniques (for example models) are used to determine fair values, they are validated and periodically independently reviewed by qualified senior personnel. All models are certified before they are used, and models are calibrated to ensure that outputs reflect actual data and comparative market prices. To the extent practical, models use observable data, however, areas such as credit risk (both own and counterparty), volatilities and correlations require management to make estimates.
iv) Recoverable amount of receivablesCritical estimates are made by the directors in determining the recoverable amount of impaired receivables. This process is set out in note 2(j). The carrying amounts of receivables are shown on note 4(b).
v) Goodwill impairmentCritical estimates have been made by Directors in determining whether the goodwill is impaired. These assumptions are disclosed on note 18.
3. Critical accounting estimates and judgments in applying accounting policies (continued)
NOTES TO THE FINANCIAL STATEMENTS (CONT’D)
89ANNUAL REPORT & FINANCIAL STATEMENTS 2016

4. Risk Governance and Risk Management System
Risk Mangement objectivesRisk management is a central part of the Group’s strategic management process hence we continuously seek to enhance the risk management capabilities of the Group. It is anticipated that our risk management practices will increase the probability of success, and reduce both the potential of failure and the uncertainty associated with achieving the group’s overall objectives. The objectives of the Group’s risk management activities are to achieve sustained competitive advantage via a rigorous, group wide risk management system that is fully aligned to the Group values, strategic business initiatives and processes. At a strategic level, our risk management objectives are to:
• Identify the Group’s significant risks in relation to the corporate strategies pursued;• Formulate the Group’s risk appetite and ensure that business profile and plans are consistent with it;• Optimise risk/return decisions by taking them as closely as possible to the business, while establishing
strong and independent review and challenge structures;• Ensure that business growth plans are properly supported by effective risk infrastructure;• Manage risk profile to ensure that specific financial deliverables remain possible under a range of adverse
business conditions; and• Help executives improve the control and co-ordination of risk taking across the business.
Our risk management strategy defines the extent of the risks we are prepared to incur for our clients and shareholders. The development of our risk strategy is embedded in the annual planning cycle and hence in our business strategy. That is, Integrating Strategy, Risk and Performance management takes place at strategy setting, first with a full Executive management consensus on clearly defined business objectives. Once Executive management have defined the objectives, they then identify the key risks that may present an opportunity to pursue those business objectives, or impede their ability to achieve them.
Organisational structureTo ensure that our risk management operates efficiently and effectively, we have established a specific risk management function within UAP Global Services as a Shared Service for the entire Group. Our Risk Management supervises risk management Group-wide with the support of decentralised structures in all units of the Group. It is headed by the Group Risk and Compliance Manager (GCRM), who is supported by interdisciplinary teams of highly qualified staff. The Group’s activities expose it to a variety of risks, including insurance risk and financial risk.
The Group’s overall risk management programme focuses on the identification and management of risks and seeks to minimise potential adverse effects on its financial performance, by use of underwriting guidelines and capacity limits, reinsurance planning, credit policy governing the acceptance of clients, and defined criteria for the approval of intermediaries and reinsurers. Investment policies are in place which help manage liquidity, and seek to maximise return within an acceptable level of interest rate risk. Management Framework ensure that staff in our risk management structure and the Group as a whole are kept informed of our risk strategy, organisation and processes, enabling the risks incurred to be actively controlled.
Risk Management FrameworkIn order to achieve its mission and objectives, the Group has developed an Enterprise Risk management framework to provide a guide within which key risks affecting the group are identified, measured and managed. This risk management framework also provides management with proven risk management guidelines that support their decision-making responsibilities and processes, together with managing the risks that impact on the objectives of the Group.
NOTES TO THE FINANCIAL STATEMENTS (CONT’D)
90 UAP OLD MUTUAL GROUP

At the heart of the risk management framework is a governance process with clear responsibilities for taking, managing, monitoring and reporting risks. The Group articulates the roles and responsibilities for risk management throughout the organization, from the Board of Directors and the Group Chief Executive Officer (CEO) to its businesses and functional areas, thus embedding risk management in the business
The UAP Risk Management Framework is the Group’s main risk governance document; it specifies the Group’s Target Risk Management Operating Model including Risk management authorities and responsibilities, procedures and reporting requirements. The risk management framework also classifies the risks the Group faces into broad risk categories. The Group regularly enhances the ERM Framework to reflect new insights and changes in the Group’s environment.
One of the key elements of the Group’s risk management framework is to foster risk transparency by establishing risk reporting standards throughout the Group. The Group regularly reports on its risk profile, current risk issues, adherence to its risk policies and improvement actions both at a local and on a Group level. The Group has procedures in place for the timely referral of risk issues to senior management and the Board of Directors.
The implementation of the framework is driven by a risk management culture and awareness that permeates throughout the Group and is supported by a set of policies and procedures; Tools; and A robust reporting mechanisms The Group continues to consciously take risks for which it expects an adequate return. This approach requires sound judgment and an acceptance that certain risks can and will materialize in the future.
Significant risksAccording to our classification, significant risks are risks that could have a long-term adverse effect on the Group’s assets, financial situation or profitability. We have applied this definition consistently to the individual business units and legal entities, taking account of their individual risk tolerance. The section below summarises the significant risks faced by the group and how they are managed.
(a) Insurance riskThe risk under any one insurance contract is the possibility that the insured event occurs and the uncertainty of the amount of the resulting claim. By the very nature of an insurance contract, this risk is random and therefore unpredictable. For a portfolio of insurance contracts where the theory of probability is applied to pricing and provisioning, the principal risk that the Group faces under its insurance contracts is that the actual claims and benefit payments exceed the carrying amount of the insurance liabilities. This could occur because the frequency or severity of claims and benefits are greater than estimated. Insurance events are random and the actual number and amount of claims and benefits will vary from year to year from the level established using statistical techniques.
Experience shows that the larger the portfolio of similar insurance contracts, the smaller the relative variability about the expected outcome will be. In addition, a more diversified portfolio is less likely to be affected by a change in any subset of the portfolio. The group has developed its insurance underwriting strategy to diversify the type of insurance risks accepted and within each of these categories to achieve a sufficiently large population of risks to reduce the variability of the expected outcome. Factors that aggravate insurance risk include lack of risk diversification in terms of type and amount of risk, geographical location and type of industry covered.
4. Risk Governance and Risk Management System (continued)Risk Management Framework (continued)
NOTES TO THE FINANCIAL STATEMENTS (CONT’D)
91ANNUAL REPORT & FINANCIAL STATEMENTS 2016

The following tables disclose the concentration of insurance risk by the class of business in which the contract holder operates and by the maximum insured loss limit included in the terms of the policy. The amounts are the maximum insured loss limit of the insurance liabilities (gross and net of reinsurance) arising from insurance contracts.
Year ended 31 December 2016Class of business
Maximum insured loss Total
(Amounts presented in Kes ‘000)
KES 0-15m KES 15-250mKES 250-1000m
KES ’000
General insurance businessMotor Gross 45,193,825 19,474,920 613,440,790 678,109,535
Net 46,596,396 13,816,992 9,922,757 70,336,145Fire Gross 27,015,544 112,144,863 1,137,738,607 1,276,899,014
Net 29,320,262 103,470,962 460,509,372 593,300,596Accident Gross 25,832,475 85,936,419 129,562,142 241,331,036
Net 10,156,109 22,957,637 20,173,065 53,286,811Other Gross 17,287,761 85,215,670 551,564,267 654,067,698
Net 29,605,483 57,256,223 173,535,096 260,396,802
Life assurance businessOrdinary life Gross 7,750,754 327,421 - 8,078,175
Net 7,743,823 327,421 - 8,071,244Group life Gross 280,564 6,356,641 640,019,127 646,656,332
Net 219,427 5,224,828 378,277,123 383,721,378Total Gross 123,360,923 309,455,934 3,072,324,933 3,505,141,790
Net 123,641,500 203,054,063 1,042,417,413 1,369,112,976
4. Risk Governance and Risk Management System (continued)a) Insurance risk (continued)
NOTES TO THE FINANCIAL STATEMENTS (CONT’D)
Year ended 31 December 2015Class of business
Maximum insured loss Total
(Amounts presented in Kes ‘000) KES 0-15m KES 15-250m KES 250
-1000m KES ’000
General insurance businessMotor Gross 1,919,728 6,060,049 28,950,593 36,930,370
Net 1,365,548 1,154,350 1,414,660 3,934,558Fire Gross 2,555,146 12,937,311 438,922,406 454,414,863
Net 2,530,467 6,743,866 393,824,162 403,098,495Accident Gross 1,002,771 13,184,201 121,260,056 135,447,028
Net 861,541 8,363,131 9,486,530 18,711,202Other Gross 1,213,131 12,068,053 261,734,871 275,019,055
Net 813,673 2,032,127 148,438,162 151,283,962
Life assurance businessOrdinary life Gross 7,035,591 207,421 324,466 7,567,478
Net 7,035,591 207,421 318,627 7,561,639Group life Gross 122,100 8,769,286 603,208,545 612,099,931
Net 120,715 7,012,321 347,652,041 354,785,077Total Gross 13,851,467 53,226,321 1,454,400,937 1,521,478,725
Net 12,727,535 25,513,216 901,134,182 939,374,933
92 UAP OLD MUTUAL GROUP

The concentration by sector or maximum insured loss at the end of the year is broadly consistent with the prior year.
b) Financial risk The Group is exposed to financial risk through its financial assets, financial liabilities (investment contracts and borrowings), reinsurance assets and insurance liabilities. In particular the key financial risk is that the proceeds from its financial assets are not sufficient to fund the obligations arising from its insurance and investment contracts. The most important types of risk are credit risk, liquidity risk and market risk. Market risk includes currency risk, interest rate risk, equity price risk and other price risks.
These risks arise from open positions in interest rate, currency and equity prices, all of which are exposed to general and specific market movements. The risks that the Group primarily faces due to the nature of its investments and liabilities are liquidity rate risk and equity price risk.
The Group manages these risks through policies set out by the Finance and Investment Committee of the Board (FIC). These policies have been developed to achieve long-term investment returns in excess of the Group’s obligations under insurance and investment contracts. The principal technique is to match assets to the liabilities arising from insurance and investment contracts by reference to the type of benefits payable to contract holders. For each distinct category of liabilities, a separate portfolio of assets is maintained.
Market risk(i) Foreign exchange riskThe Group underwrites some short term insurance policies contracted in US dollars and maintains foreign currency denominated current accounts with local banks. Additionally, the group invests in offshore stock exchange markets and places deposits in local financial institutions denominated in foreign currencies. This exposes the group to onward foreign exchange risk arising from the various currency exposures, primarily with respect to the Uganda shillings, US dollar, Euro and Sterling Pound. Foreign exchange risk arises from future commercial transactions and recognised assets and liabilities.
At 31 December 2016, if the Shilling had weakened/strengthened by 10% against the US dollar with all other variables held constant, the post-tax profit for the year would have been Kes 54 million (31 December 2015: Kes 201 million) higher/lower, mainly as a result of US dollar earnings. At 31 December 2016, and 31 December 2015, the group had no significant exposure with respect to any other currencies.
ii) Price riskThe Group is exposed to equity securities price risk because of investments in quoted and unquoted shares classified either as fair value through profit or loss or other comprehensive income. The Group is not exposed to commodity price risk. To manage its price risk arising from investments in equity securities, the Group diversifies its portfolio. Diversification of the portfolio is done in accordance with policies set out by the Board. All quoted shares held by the Group are traded on the various Stock Exchanges across the region.
At 31 December 2016, if the NSE Index had increased/decreased by 10% with all other variables held constant and all the Group’s equity instruments moved according to the historical correlation to the index, equity would have been Kes 58 million higher/ lower (31 December 2015: Kes 40 million). Movement in the USE would not have had a material impact on the Group’s equity 31 December 2016 and 31 December 2015 as investments in the USE Index are not material. There was no concentration of price risk.
iii) Interest rate riskFixed interest rate financial instruments expose the Company and Group to fair value interest rate risk. Variable interest rate financial instruments expose the company to cash flow interest rate risk. The Group’s fixed interest rate financial instruments are government securities, deposits with financial institutions and borrowings. The Company’s variable interest rate financial instruments are quoted corporate bonds, which are always the treasury bills rate plus some basis points. No limits are placed on the ratio of variable rate financial instruments to fixed rate financial instruments.
4. Risk Governance and Risk Management System (continued)a) Insurance risk (continued)
NOTES TO THE FINANCIAL STATEMENTS (CONT’D)
93ANNUAL REPORT & FINANCIAL STATEMENTS 2016

Investment contracts with fixed and guaranteed terms, government securities and deposits with financial institutions held to maturity are accounted for at amortised cost and their carrying amounts are not sensitive to changes in the level of interest rates. At 31 December 2016, if interest rates on bonds had been 2% higher/lower with all other variables held constant, post-tax profit for the year would have been Kes 30 million (31 December 2015: Kes 37 million) lower/higher, mainly as a result of higher/lower interest income on floating rate quoted corporate bonds.
Credit riskThe Group has exposure to credit risk, which is the risk that a counterparty will be unable to pay amounts in full when due. Key areas where the Group is exposed to credit risk are:
• Receivables arising out of direct insurance arrangements;• Receivables arising out of reinsurance arrangements; • Reinsurers’ share of insurance liabilities;• Corporate bonds;• Government securities; and• Mortgage loans receivable.
The Group has no significant concentrations of credit risk. The Group structures the levels of credit risk it accepts by placing limits on its exposure to a single counterparty, or groups of counterparty, and to geographical and industry segments. Such risks are subject to an annual or more frequent review. Limits on the level of credit risk by category and territory are approved quarterly by the Board of Directors.
Reinsurance is used to manage insurance risk. This does not, however, discharge the Group’s liability as primary insurer. If a reinsurer fails to pay a claim for any reason, the Group remains liable for the payment to the policyholder. The creditworthiness of reinsurers is considered on an annual basis by reviewing their financial strength prior to finalisation of any contract.
The exposure to individual counterparties is also managed by other mechanisms, such as the right of offset where counterparties are both debtors and creditors of the Group. Management information reported to the Group includes details of provisions for impairment on loans and receivables and subsequent write-offs. Finance and Investment committee of the Group Board makes regular reviews to assess the degree of compliance with the Group procedures on credit. Exposures to individual policyholders and groups of policyholders are collected within the ongoing monitoring by the management credit committee.
The credit quality of financial assets that are neither past due nor impaired can be assessed by reference to external credit ratings if available or historical information about counterparty default rates. None of the group’s credit risk counter parties are rated except the Government of Kenya, the issuer of the Group’s government securities which has B+ rating. The Company classifies counterparties without an external credit rating as below:
Group 1 - new customers/related parties.Group 2 - existing customers/related parties with no defaults in the past.Group 3 - existing customers/related parties with some defaults in the past. All defaults were fully recovered.
4. Risk Governance and Risk Management System (continued)b) Financial risk (continued) Market risk (continued) iii) Interest rate risk (continued)
NOTES TO THE FINANCIAL STATEMENTS (CONT’D)
94 UAP OLD MUTUAL GROUP

Maximum exposure to credit risk before collateral held - Group
31-Dec 31-Dec
Credit rating/ 2016 2015
Classification KES ’000 KES ’000
Receivables arising out of reinsurance arrangements Group 2 1,314,921 970,510
Receivables arising out of direct insurance arrangements Group 2 1,873,639 2,364,365
Reinsurers’ share of insurance liabilities Group 2 3,737,781 2,977,367
Other receivables Group 2 1,150,331 480,827
Government securities B+ rating 11,920,024 7,541,079
Corporate bonds Group 2 1,878,698 1,855,820
Mortgage loans receivable Group 2 336,774 255,259
Deposit with financial institutions Group 2 5,037,139 3,845,043
Cash at bank Group 2 1,845,946 1,750,124
Total 29,095,253 22,040,394
Maximum exposure to credit risk before collateral held - Company
31-Dec 31-Dec
Credit rating/ 2016 2015
Classification KES ’000 KES ’000
Cash at bank Group 2 402,090 10,805
Deposits with financial institutions Group 2 1,499,758 208,811
Amount due from subsidiaries Group 2 2,553,022 2,243,013
Other receivables Group 2 296,598 13,435
Total 4,751,468 2,476,064
No collateral is held for any of the above assets other than for staff mortgage loans and car loans included under other receivables. Properties in relation to staff mortgage loans and motor vehicles in relation to staff car loans are charged to the group as collateral. The fair value of this collateral was Kes 368 million (2015: Kes 487 million) and no collateral had been repossessed at as the end of the year. All receivables that are neither past due or impaired are within their approved credit limits, and no receivables have had their terms renegotiated. All receivables are classified in group 2.
None of the above assets are either past due or impaired except for the following amounts in the Group’s receivables under direct insurance and reinsurance arrangements.
4. Risk Governance and Risk Management System (continued)b) Financial risk (continued)
Credit risk (continued)
NOTES TO THE FINANCIAL STATEMENTS (CONT’D)
95ANNUAL REPORT & FINANCIAL STATEMENTS 2016
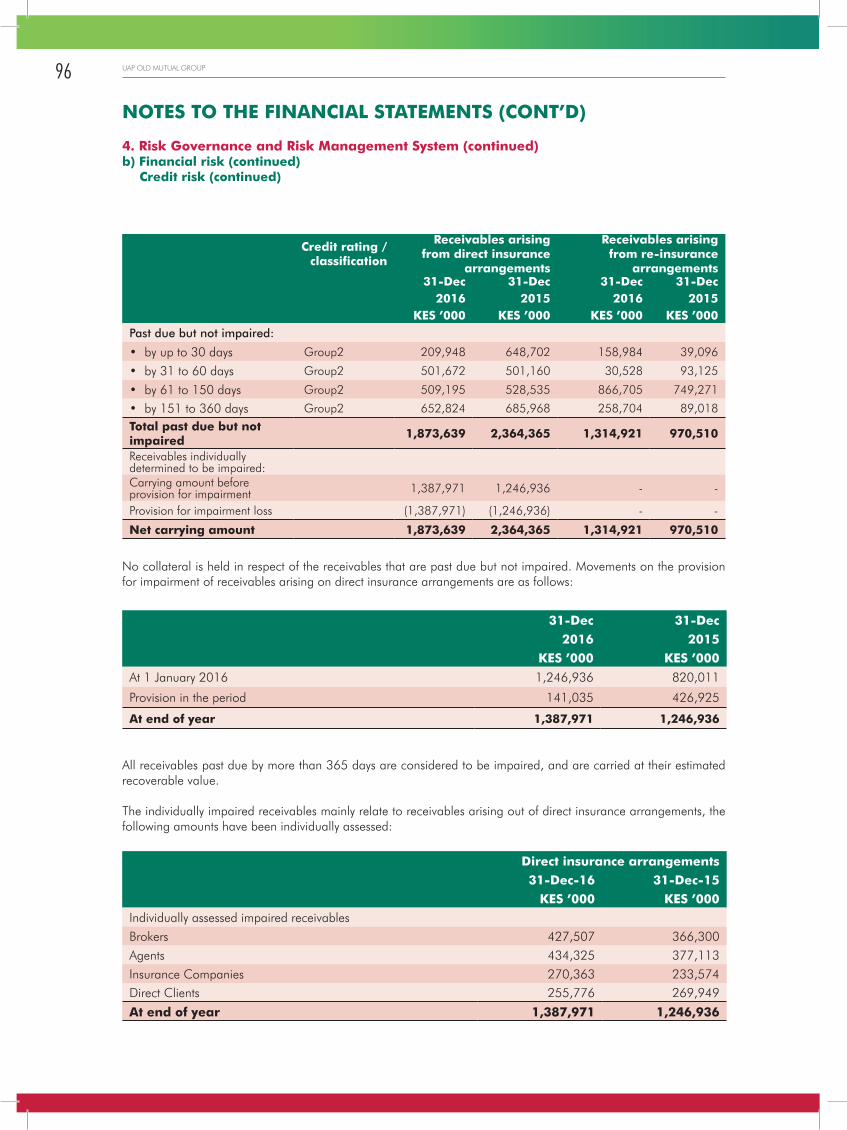
Credit rating / classification
Receivables arising from direct insurance
arrangements
Receivables arising from re-insurance
arrangements31-Dec 31-Dec 31-Dec 31-Dec
2016 2015 2016 2015KES ’000 KES ’000 KES ’000 KES ’000
Past due but not impaired:
• by up to 30 days Group2 209,948 648,702 158,984 39,096
• by 31 to 60 days Group2 501,672 501,160 30,528 93,125
• by 61 to 150 days Group2 509,195 528,535 866,705 749,271
• by 151 to 360 days Group2 652,824 685,968 258,704 89,018
Total past due but not impaired
1,873,639 2,364,365 1,314,921 970,510
Receivables individually determined to be impaired:Carrying amount before provision for impairment 1,387,971 1,246,936 - -
Provision for impairment loss (1,387,971) (1,246,936) - -
Net carrying amount 1,873,639 2,364,365 1,314,921 970,510
No collateral is held in respect of the receivables that are past due but not impaired. Movements on the provision for impairment of receivables arising on direct insurance arrangements are as follows:
31-Dec 31-Dec2016 2015
KES ’000 KES ’000
At 1 January 2016 1,246,936 820,011
Provision in the period 141,035 426,925
At end of year 1,387,971 1,246,936
All receivables past due by more than 365 days are considered to be impaired, and are carried at their estimated recoverable value.
The individually impaired receivables mainly relate to receivables arising out of direct insurance arrangements, the following amounts have been individually assessed:
Direct insurance arrangements31-Dec-16 31-Dec-15
KES ’000 KES ’000Individually assessed impaired receivablesBrokers 427,507 366,300 Agents 434,325 377,113 Insurance Companies 270,363 233,574 Direct Clients 255,776 269,949
At end of year 1,387,971 1,246,936
4. Risk Governance and Risk Management System (continued)b) Financial risk (continued)
Credit risk (continued)
NOTES TO THE FINANCIAL STATEMENTS (CONT’D)
96 UAP OLD MUTUAL GROUP

Liquidity riskLiquidity risk is the risk that the Group is unable to meet its payment obligations associated with its financial liabilities as they fall due and to replace funds when they are withdrawn.
The Group is exposed to daily calls on available cash resources for claims settlement and other administration expenses. The Group does not maintain cash resources to meet all of these needs as experience shows that a minimum level of reinvestment of maturing funds can be predicted with a high level of certainty. The Finance and Investment Committee sets limits on the minimum level of cash balances.
The table below presents the cash flows payable by the Group under financial liabilities by remaining contractual maturities (other than insurance contract liabilities which are based on expected maturities) at the financial reporting date.
As at 1 January 2016
Up to 1 1-3 3-12 1-5 Over 5
month months months years years Total
KES ’000 KES ’000 KES ’000 KES ’000 KES ’000 KES ’000
LiabilitiesInsurance contract liabilities 2,169,804 823,666 1,306,925 2,906,713 2,553,722 9,760,830Payable under deposit administration
contracts48,243 55,890 191,341 1,186,199 3,782,485 5,264,158
Unit-linked investment contracts 23,563 18,242 61,582 374,010 378,648 856,045Creditors arising from reinsurance
arrangements1,358,259 96,086 239,425 182,464 - 1,876,234
Other payables 751,204 116,509 1,229,445 114,040 - 2,211,198Borrowings - - 3,307,009 6,153,684 1,570,889 11,031,583
Total financial liabilities as at 31 December 2016
4,351,073 1,110,393 6,335,727 10,917,110 8,285,745 31,000,047
As at 1 January 2015
Up to 1 1-3 3-12 1-5 Over 5
month months months years years Total
KES ’000 KES ’000 KES ’000 KES ’000 KES ’000 KES ’000
LiabilitiesInsurance contract liabilities 1,665,591 431,858 1,242,636 2,323,931 2,482,861 8,146,877Payable under deposit administration
contracts17,785 32,097 163,384 1,010,798 3,199,135 4,423,199
Unit-linked investment contracts 1,988 40,081 68,061 399,378 498,213 1,007,721Creditors arising from reinsurance
arrangements843,103 90,037 172,649 1 - 1,105,790
Other payables 297,130 174,012 408,120 787,627 1,334 1,668,223Borrowings - 2,846,485 180,507 4,089,299 361,009 7,477,300
Total financial liabilities as at 31 December 2015
2,825,597 3,614,570 2,235,357 8,611,034 6,542,552 23,829,110
Investment contracts and deposit administration contracts can be surrendered before maturity for a cash surrender value specified in the contractual terms and conditions. Prudent liquidity risk management includes maintaining sufficient cash balances to cover anticipated surrenders before the contractual maturity dates. In addition, the Group invests only a limited proportion of its assets in investments that are not actively traded. The Group’s listed securities are considered readily realisable, as they are actively traded on the Nairobi Securities Exchange and Uganda Stock Exchange.
4. Risk Governance and Risk Management System (continued)b) Financial risk (continued)
NOTES TO THE FINANCIAL STATEMENTS (CONT’D)
97ANNUAL REPORT & FINANCIAL STATEMENTS 2016

The table below presents the cash flows payable by the Company under financial liabilities by remaining contractual maturities at the financial reporting date.
Less than 1 year Greater than 1 yearKES ’000 KES ’000
At 31 December 2016:Amounts due to subsidiaries (Note 44(iv)) 939,212 - Other payables 275,723 - Borrowings 3,043,710 5,933,289 4,258,645 5,933,289 At 31 December 2015:Amounts due to subsidiaries (Note 44(iv)) 939,842 - Other payables 368,319 - Borrowings 2,846,485 2,057,053 4,154,646 2,057,053
c) Capital managementThe Group’s objectives when managing capital, which is a broader concept than the ‘equity’ on the statement of financial position, are:
• to comply with the capital requirements as set out in the regulations of the jurisdictions in which the Group entities operate in;
• to comply with regulatory solvency requirements as set out in legislation in the jurisdictions in which the Group entities operate in;
• to safeguard the Group’s ability to continue as a going concern, so that it can continue to provide returns to shareholders and benefits for other stake holders; and
• to provide an adequate return to shareholders by pricing insurance and investment contracts commensurately with the level of risk.
The Group’s paid up capital comprises share capital as disclosed on note 13. The Group manages the minimum paid up capital and regulatory Capital (solvency) held in each subsidiary as capital. Capital adequacy and solvency margin are monitored regularly by the Board of Directors. The required information is filed with the respective authorities.
During the year, the Group held the minimum paid up share capital required. The Group entities also met the solvency margins required in the jurisdictions in which they operate, except for the Life Assurance (Kenya) and General Insurance (Rwanda and Tanzania) subsidiaries. Appropriate measures, including capital injection and business turn-around initiatives, have been instituted to resolve the solvency gaps in these entities.
The table below summarises the capital requirements of the Group’s entities in the various jurisdictions in which the Group operates and the amount of capital held.
4. Risk Governance and Risk Management System (continued)b) Financial risk (continued) Liquidity risk (continued)
NOTES TO THE FINANCIAL STATEMENTS (CONT’D)
98 UAP OLD MUTUAL GROUP

31-Dec-16
Kenya UgandaGeneral
insurance
Life
AssuranceSudan
General
insurance
Life
InsuranceRwanda Tanzania
KES
’000
KES
’000
KES
’000
KES
’000
KES
’000
KES
’000
KES
’000Regulatory capital requirements 600,000 400,000 341,190 128,153 96,115 136,524 74,916
Amount of paid up capital 1,000,000 1,584,593 342,709 214,939 466,599 1,031,110 940,720
Required solvency margin 4,760,000 477,000 461,115 260,828 85,155 106,961 121,715Solvency margin by Company 6,955,000 882,000 1,860,491 331,724 196,885 205,026 315,820Surplus/(deficit) over required margin
2,195,000 405,000 1,399,376 70,896 111,730 98,065 194,105
31-Dec-15
Kenya UgandaGeneral
insurance
Life
AssuranceSudan
General
insurance
Life
InsuranceRwanda Tanzania
KES
’000
KES
’000
KES
’000
KES
’000
KES
’000
KES
’000
KES
’000Regulatory capital requirements
300,000 150,000 341,190 128,153 96,115 136,524 74,916
Amount of paid up capital 600,000 1,584,593 342,710 214,939 286,018 733,057 940,720
Required solvency margin 7,992,078 428,767 24,887 279,585 691,272 68,217 206,254Solvency margin by Company 13,159,930 841,756 1,300,657 310,759 803,010 35,701 311,408Surplus/(deficit) over required margin
5,167,852 412,989 1,275,770 31,174 111,738 (32,516) 105,154
d) Fair values of financial assets and liabilitiesThe fair value of government securities at 31 December 2016 is estimated at Kes 9,257 million (2015: Shs 5,664 million) compared to the carrying value Kes 11,920 million (2015: Shs 7,541 million). The fair values of the Group’s other financial assets and liabilities approximate the respective carrying amounts, due to the generally short periods to contractual repricing or maturity dates as set out above. Fair values are based on discounted cash flows using a discount rate based upon the borrowing rate that the directors expect would be available to the Group at the financial reporting date.
e) Fair values estimation IFRS 7 and IFRS 13 require disclosure of fair value measurements by the following levels of hierarchy for financial instruments that are measured in the statement of financial position at fair value:
• Quoted prices (unadjusted) in active markets for identical assets or liabilities (level 1).• Inputs other than quoted prices included within level 1 that are observable for the asset or liability, either
directly (that is, as prices) or indirectly (that is, derived from prices) (level 2).• Inputs for the asset or liability that are not based on observable market data (that is, unobservable inputs)
(level 3).
4. Risk Governance and Risk Management System (continued)c) Capital management (continued)
NOTES TO THE FINANCIAL STATEMENTS (CONT’D)
99ANNUAL REPORT & FINANCIAL STATEMENTS 2016

The following table presents the Group’s assets that are measured at fair value at the end of the year.
Year ended 31 December 2016Level 1 Level 2 Level 3 Total balance
KES ’000 KES ’000 KES ’000 KES ’000
AssetsEquity investments 3,211,265 - 122,191 3,333,456Government securities 509,633 - - 509,633Corporate bonds 132,013 - - 132,013Investment Properties - - 21,798,956 21,798,956
Total 3,852,911 - 21,921,147 25,774,058
Year ended 31 December 2015Level 1 Level 2 Level 3 Total balance
KES ’000 KES ’000 KES ’000 KES ’000AssetsEquity investments 4,429,484 - 128,693 4,558,177Government securities 320,523 - - 320,523Corporate bonds 160,418 - - 160,418Investment Properties - - 19,794,286 19,794,286
Total 4,910,425 - 19,922,979 24,833,404
The fair value of financial instruments traded in active markets is based on quoted market prices at the end of each reporting period. A market is regarded as active if quoted prices are readily and regularly available from an exchange, dealer, broker, industry group, pricing service, or regulatory agency, and those prices represent actual and regularly occurring market transactions on an arm’s length basis. The quoted market price used for financial assets held by the company is the current bid price. These instruments are included in level 1. Instruments included in level 1 comprise of primarily equity investments quoted at Nairobi Securities Exchange and Uganda Stock Exchange.
Financial instruments measured at fair value that are not traded in active markets relate to Group’s investment in the holding company for an investment property and investments in equities that aren’t traded in active markets. Fair value estimate is based on the Group’s share of the net asset of the investee company and on use of rental income and a capitalization rate of 8%. As the investment property of the investee company is measured at their fair value, the net asset value of the investee company approximates its fair value. This estimate is classified as level 3. There were no transfers into or out of level 3 during the year (2015: Nil).
4. Risk Governance and Risk Management System (continued)e) Fair value estimation (continued)
NOTES TO THE FINANCIAL STATEMENTS (CONT’D)
100 UAP OLD MUTUAL GROUP

5 (a) Segmental information
Management has determined the operating segments based on the reports reviewed by the Group’s Board of Directors) that are used to make strategic decisions.
The Group reviews its operating segments (business units) by type of business and by geography. Based on this, the group’s operating segments comprise of General Insurance, Life Assurance, Property, Investment management and related Financial Services. The group currently has operations in six countries namely Kenya, Uganda, South Sudan, Rwanda, Tanzania and Democratic Republic of Congo (DRC). The reportable operating segments derive their revenue primarily from the underwriting of classes and non-life risks as defined by the Insurance Act and investment property.
Other services offered by the Group that are included within the Kenya and Uganda segments include stock brokerage, investment management and related financial advisory services. The results of these operations are included in the all other segments column as they are not material to the Group.
The Group Board of Directors assesses the performance of the reporting segments based on a measure of revenue and profitability.
The segment information provided to the Group Board of Directors for the reportable segments for the year ended 31 December 2016 is as follows:
NOTES TO THE FINANCIAL STATEMENTS (CONT’D)
101ANNUAL REPORT & FINANCIAL STATEMENTS 2016

5(a
) Seg
men
tal in
form
ati
on
(co
nti
nu
ed
)
Yea
r en
ded
31 D
ece
mb
er
2016
Ken
yaSo
uth
Su
da
nU
ga
nd
aR
wa
nd
aTa
nza
nia
All o
ther
Gen
era
lIn
sura
nce
Li
fe
Ass
ura
nce
G
en
era
lIn
sura
nce
Li
fe
Ass
ura
nce
P
rop
ert
y G
en
era
lIn
sura
nce
Li
fe
Ass
ura
nce
P
rop
ert
y G
en
era
lIn
sura
nce
G
en
era
lIn
sura
nce
s
eg
men
ts
Tota
l
KES
’0
00
KES
’0
00
KES
’0
00
KES
’0
00
KES
’0
00
KES
’0
00
KES
’0
00
KES
’0
00
KES
’0
00
KES
’0
00
KES
’0
00
KES
’0
00
Gro
ss w
ritte
n pr
emiu
m (e
xter
nal)
10,9
82,0
70
1,27
3,74
6 1,
574,
833
132,
850
- 2,
429,
788
758,
065
- 84
5,03
2 1,
395,
029
- 19
,391
,413
Gro
ss e
arne
d pr
emiu
m9,
949,
492
1,32
9,76
5 1,
734,
236
180,
138
- 2,
561,
334
758,
065
- 86
2,28
8 1,
359,
688
- 18
,735
,006
Net
ear
ned
prem
ium
8,
453,
260
960,
112
1,56
4,99
7 84
,774
-
1,89
1,26
8 71
4,70
5 -
769,
952
987,
968
- 15
,427
,036
Inte
rest
inco
me
661,
577
867,
729
12,7
63
14,4
95
- 12
7,95
8 14
1,14
6 -
57,9
13
152,
994
(252
,887
)1,
783,
688
Oth
er in
vest
men
t inc
ome
403,
370
(42,
073)
215,
619
(12,
850)
143,
720
75,8
30
(13,
883)
442,
873
524
- 11
8,10
3 1,
331,
233
Com
mis
sion
s an
d ot
her
inco
me
300,
419
134,
965
28,7
69
20,9
61
- 13
0,06
0 8,
884
- 31
,210
12
1,53
7 99
,247
87
6,05
2
Tota
l in
com
e9,8
18,6
26
1,9
20,7
33
1,8
22,1
48
107,3
80
143,7
20
2,2
25,1
16
850,8
52
442,8
73
859,5
99
1,26
2,49
9
(35,5
36)
19,4
18,0
10
Cla
ims
and
polic
y ow
ners
’ ben
efits
pay
able
(5,8
36,6
75)
(1,1
77,1
82)
(225
,959
)(1
9,34
8)-
(977
,897
)(5
76,0
09)
- (5
48,8
95)
(473
,998
)-
(9,8
35,9
63)
Fina
nce
cost
- -
- -
260,
880
- -
(259
,639
)-
- (5
54,4
03)
( 553
,162
)
Dep
reci
atio
n(3
2,59
3)(1
8,40
8)(1
5,82
6)-
- (8
,566
)(3
,935
)(4
,644
)(1
0,42
2)(9
,758
)(5
5,97
1)( 1
60,1
23)
Amor
tisat
ion
(5,7
00)
- -
- -
- (4
06)
- (1
,796
)(4
,380
)(3
4,78
4)(4
7,06
6)C
omm
issi
ons
and
othe
r op
erat
ing
expe
nses
(3,1
16,4
38)
(689
,253
)(6
63,9
95)
(64,
985)
(297
,110
)(1
,158
,334
)(4
56,8
42)
(181
,596
)(4
15,2
08)
(679
,705
)12
2,40
4 (7
,601
,062
)
Pro
fit
befo
re t
ax
827,2
20
35,8
90
916,3
68
23,0
47
107,4
90
80,3
19
(186,3
40)
(3,0
06)
(116,7
22)
94,6
58
(558,2
91)
1,2
20,6
33
Inco
me
tax
expe
nse
(205
,732
)(7
,468
)-
- (2
1,38
0)(2
2,93
9)-
(81,
965)
- (4
2,59
8)(1
2,77
6)(3
94,8
58)
Pro
fit
or
(loss
) a
fter
tax
for
the y
ea
r621,4
88
28,4
22
916,3
68
23,0
47
86,1
10
57,3
80
(186,3
40)
(84,9
71)
(116,7
22)
52,0
60
(571,0
67)
825,7
75
Prof
it/ (l
oss)
attr
ibut
able
to s
hare
hold
ers
of
the
pare
nt62
1,48
8 28
,422
91
6,36
8 23
,047
(1
22,3
39)
30,4
11
(98,
760)
(67,
000)
(116
,722
)31
,236
(3
09,0
50)
937,
102
Prof
it/ (l
oss)
attr
ibut
able
to N
on-c
ontro
lling
in
tere
sts
- -
- -
(52,
431)
26,9
69
(87,
580)
(17,
971)
- 20
,824
(1
,137
)(1
11,3
27)
Pro
fit
or
(loss
) a
fter
tax
for
the y
ea
r621,4
88
28,4
22
916,3
68
23,0
47
(174,7
70)
57,3
80
(186,3
40)
(84,9
71)
(116,7
22)
52,0
60
(310,1
87)
825,7
75
Oth
er c
ompr
ehen
sive
inco
me
(359
,807
)-
(388
,366
)(5
0,47
8)1,
102
(54,
811)
1,58
1 (8
3,51
1)(1
6,56
4)33
,067
(8
,981
)(9
26,7
66)
Tota
l co
mp
reh
en
sive
in
com
e/
(loss
)261,6
81
28,4
22
528,0
02
(27,4
31)
(173,6
68)
2,5
69
(184,7
59)
(168,4
82)
(133,2
86)
85,1
27
(319,1
67)
(100,9
91)
Addi
tions
:Pro
per
ty a
nd
eq
uip
men
t37
,708
4,
166
73,2
19
- -
34,7
76
4,70
5 88
,326
5,
514
7,70
5 15
,253
27
1,37
2 In
vest
men
t p
rop
erty
- 2,
391
- (9
82)
261,
390
- -
28,1
13
- -
1,34
7,05
6 1,
637,
968
Inta
ng
ible
ass
ets
30,3
95
- -
- -
- 65
7 -
- -
33,1
08
64,1
60
Tota
l ass
ets
17,9
72,2
30
10,8
22,3
99
3,9
65,4
57
323,2
95
4,76
7,05
2
4,2
11,3
17
1,5
91,0
99
4,30
4,29
0
1,10
5,50
5
2,35
6,26
6
5,6
07,8
93
57,0
26,8
03
Tota
l eq
uity
7,6
47,8
70
1,2
76,5
90
1,8
18,9
38
108,7
48
1,58
1,68
4
1,1
29,0
24
166,0
23
1,20
2,89
7
379,5
68
858,3
26
1,5
24,6
03
17,6
94,2
70
NO
TES
TO T
HE
FIN
AN
CIA
L ST
ATE
MEN
TS (
CO
NT’
D)
102

5(a
) Seg
men
tal in
form
ati
on
(co
nti
nu
ed
)
Yea
r en
ded
31 D
ece
mb
er
2015
Ken
yaSo
uth
Su
da
nU
ga
nd
aR
wa
nd
aTa
nza
nia
All o
ther
Gen
era
lIn
sura
nce
Li
fe
Ass
ura
nce
G
en
era
lIn
sura
nce
Li
fe
Ass
ura
nce
P
rop
ert
y G
en
era
lIn
sura
nce
Li
fe
Ass
ura
nce
P
rop
ert
y G
en
era
lIn
sura
nce
G
en
era
lIn
sura
nce
Se
gm
en
ts
Tota
l
KES
’0
00
KES
’0
00
KES
’0
00
KES
’0
00
KES
’0
00
KES
’0
00
KES
’0
00
KES
’0
00
KES
’0
00
KES
’0
00
KES
’0
00
KES
’0
00
Gro
ss w
ritte
n pr
emiu
m (e
xter
nal)
8,28
5,01
8 1,
244,
512
1,51
5,72
5 11
9,30
9 -
3,10
7,80
7 49
7,07
5 -
678,
590
1,42
0,19
5 -
16,8
68,2
31
Gro
ss e
arne
d pr
emiu
m7,
821,
738
1,20
6,14
8 1,
286,
449
109,
005
- 2,
542,
651
497,
075
- 53
9,48
1 1,
330,
247
- 15
,332
,794
Net
ear
ned
prem
ium
6,
227,
334
873,
183
1,15
8,38
4 52
,670
-
1,85
3,81
5 47
5,45
2 -
450,
845
977,
743
- 12
,069
,426
Inte
rest
inco
me
642,
983
608,
322
6,72
6 19
,101
-
73,0
10
75,4
42
- 24
,365
64
,043
(8
8,39
6)1,
425,
596
Oth
er in
vest
men
t inc
ome
442,
454
(312
,243
)18
1,13
9 9,
376
1,29
1,12
3 11
3,73
8 7,
418
(55,
121)
880
89
205,
740
1,88
4,59
3
Com
mis
sion
s an
d ot
her
inco
me
442,
144
144,
398
26,5
37
12,7
23
- 34
7,43
9 8,
187
- 28
,387
96
,319
25
,179
1,
131,
312
Tota
l in
com
e7,7
54,9
15
1,3
13,6
60
1,37
2,78
6
93,8
70
1,29
1,12
3
2,3
88,0
02
566,4
99
(55,1
21)
504,4
77
1,1
38,1
94
142,5
23
16,5
10,9
28
Cla
ims
and
polic
y ow
ners
’ ben
efits
pay
able
(4,2
89,9
62)
(1,0
35,5
16)
(495
,423
)(2
0,22
6)-
(952
,132
)(3
26,9
94)
- (3
79,7
25)
(486
,671
)-
(7,9
86,6
49)
Fina
nce
cost
(7,6
70)
- -
- -
- -
(227
,463
)-
(23,
342)
(319
,454
)(5
77,9
29)
Dep
reci
atio
n(2
7,95
5)(1
1,50
9)(1
9,39
8)-
- (6
,656
)(3
,138
)(4
49)
(12,
076)
(8,3
58)
(52,
297)
(141
,836
)
Amor
tisat
ion
(2,3
86)
- -
- -
- (9
9)-
(4,4
93)
(4,2
05)
(57,
032)
(68,
215)
Com
mis
sion
s an
d ot
her
oper
atin
g ex
pens
es(2
,881
,956
)(6
90,1
22)
(480
,887
)(6
0,30
7)(1
27,3
80)
(1,3
35,0
37)
(349
,530
)(7
8,26
1)(3
27,7
67)
(588
,529
)(1
23,3
67)
(7,0
43,1
43)
Prof
it be
fore
tax
544,
986
(423
,487
)37
7,07
8
13,3
37
1,16
3,74
3
94,1
77
(113
,262
)(3
61,2
94)
(219
,584
)27
,089
(4
09,6
27)
693,
156
Inco
me
tax
expe
nse
(113
,880
)15
5,43
9 -
- (1
93,6
69)
(33,
258)
- 19
3,24
7 -
37,8
97
157,
667
203,
443
Prof
it or
(los
s) a
fter
tax
for
the
year
431,
106
(268
,048
)37
7,07
8
13,3
37
970,
074
60,9
19
(113
,262
)(1
68,0
47)
(219
,584
)64
,986
(2
51,9
60)
896,
599
Prof
it at
tribu
tabl
e to
sha
reho
lder
s of
the
pare
nt43
1,10
6 (2
68,0
48)
377,
078
13,3
37
679,
052
32,2
87
(60,
029)
(132
,505
)(2
19,5
84)
38,9
92
(246
,202
)64
5,48
3
Prof
it at
tribu
tabl
e to
Non
-con
trolli
ng in
tere
sts
- -
- -
291,
022
28,6
32
(53,
233)
(35,
542)
- 25
,994
(5
,758
)25
1,11
5
Prof
it or
(los
s) a
fter
tax
for
the
year
431,
106
(268
,048
)37
7,07
8
13,3
37
970,
074
60,9
19
(113
,262
)(1
68,0
47)
(219
,584
)64
,986
(2
51,9
60)
896,
599
Oth
er c
ompr
ehen
sive
inco
me
(459
,623
)-
427,
253
59,5
15
155,
309
(58,
859)
(5,7
17)
(118
,133
)2,
735
(13,
030)
70,5
79
60,0
29
Tota
l com
preh
ensi
ve in
com
e(2
8,51
7)(2
68,0
48)
804,
331
72,8
52
1,12
5,38
3
2,06
0
(118
,979
)(2
86,1
80)
(216
,849
)51
,956
(1
81,3
81)
956,
627
Addi
tions
:
Pro
pert
y a
nd
eq
uip
men
t26
,371
10
,088
19
,473
2,
230
- 8,
032
11,3
63
- 22
,902
10
,695
42
,596
15
3,75
0
Inve
stm
en
t p
rop
ert
y-
- -
- 1,
040,
505
- -
86,1
40
- -
1,95
0,85
9 3,
077,
504
Inta
ng
ible
ass
ets
- -
- -
- -
183
- 3,
826
12,4
16
17,0
76
33,5
01
Tota
l ass
ets
15,8
59,9
74
9,82
3,48
2
2,25
3,86
9
207,
830
4,35
2,51
8
4,46
7,65
9
952,
425
4,19
1,25
1
827,
197
2,09
6,97
1
3,69
1,47
8
48,7
24,6
54
Tota
l equi
ty7,
786,
189
1,24
8,16
6
1,55
7,74
7
136,
178
1,75
5,35
2
1,12
6,45
6
105,
067
1,37
1,37
9
214,
800
773,
199
1,72
0,72
8
17,7
95,2
61
NO
TES
TO T
HE
FIN
AN
CIA
L ST
ATE
MEN
TS (
CO
NT’
D)
103

5(a
) Seg
men
tal in
form
ati
on
(co
nti
nu
ed
)
Pre
miu
ms
by
sou
rce c
ou
ntr
y
31-D
ec-
16
31-D
ec-
15
Ken
yaU
ga
nd
aSu
da
nR
wa
nd
aTa
nza
nia
Tota
lK
en
yaU
ga
nd
aSu
da
nR
wa
nd
aTa
nza
nia
Tota
l
KES
’000
KES
’000
KES
’000
KES
’000
KES
’000
KES
’000
KES
’000
KES
’000
KES
’000
KES
’000
KES
’000
KES
’000
Short
-term
in
sura
nce
Gro
ss w
ritte
n pr
emiu
m10
,982
,070
2,42
9,78
81,
574,
833
845,
032
1,39
5,02
917
,226
,752
8,28
5,01
83,
107,
807
1,51
5,72
567
8,59
01,
420,
195
15,0
07,3
35
Gro
ss e
arne
d pr
emiu
m9,
949,
492
2,56
1,33
41,
734,
236
862,
288
1,35
9,68
816
,467
,038
7,82
1,73
82,
542,
651
1,28
6,44
953
9,48
11,
330,
247
13,5
20,5
66
Net
ear
ned
prem
ium
8,4
53,2
60
1,8
91,2
68
1,5
64,9
97
769,9
52
987,9
68
13,6
67,4
45
6,2
27,3
34
1,85
3,81
51,1
58,3
84
450,8
45
977,7
43
10,6
68,1
21
Lon
g-t
erm
bu
sin
ess
Gro
s w
ritte
n pr
emiu
m1,
273,
746
758,
065
132,
850
--
2,1
64,6
61
1,24
4,51
249
7,07
511
9,30
9-
-1,8
60,8
96
Gro
ss e
arne
d pr
emiu
m1,
329,
765
758,
065
180,
138
--
2,2
67,9
68
1,20
6,14
849
7,07
510
9,00
5-
-1,8
12,2
28
Net
ea
rned
pre
miu
m960,1
12
714,7
05
84,7
74
--
1,7
59,5
91
873,1
83
475,4
52
52,6
70
--
1,4
01,3
05
Gro
ss w
ritte
n pr
emiu
m12
,255
,816
3,18
7,85
31,
707,
683
845,
032
1,39
5,02
919,3
91,4
13
9,52
9,53
03,
604,
882
1,63
5,03
467
8,59
01,
420,
195
16,8
68,2
31
Gro
ss e
arne
d pr
emiu
m11
,279
,257
3,31
9,39
91,
914,
374
862,
288
1,35
9,68
818,7
35,0
06
9,02
7,88
63,
039,
726
1,39
5,45
453
9,48
11,
330,
247
15,3
32,7
94
Net
ea
rned
pre
miu
m9,4
13,3
72
2,6
05,9
73
1,6
49,7
71
769,9
52
987,9
68
15,4
27,0
36
7,1
00,5
17
2,3
29,2
67
1,2
11,0
54
450,8
45
977,7
43
12,0
69,4
26
Inve
stm
ent i
ncom
e1,
735,
206
794,
538
373,
746
58,4
3715
2,99
43,1
14,9
21
1,48
4,42
822
8,91
91,
507,
465
25,2
4564
,132
3,3
10,1
89
Com
mis
sion
ear
ned
360,
963
140,
049
49,7
3018
,999
121,
537
691,2
78
530,
729
336,
051
39,2
6022
,709
96,3
191,0
25,0
68
Oth
er in
com
e15
3,23
619
,327
-12
,211
-184,7
74
79,6
6720
,899
-5,
678
-106,2
44
Tota
l in
com
e11,6
62,7
77
3,5
59,8
87
2,0
73,2
47
859,5
99
1,2
62,4
99
19,4
18,0
09
9,1
95,3
42
2,9
15,1
36
2,7
57,7
79
504,4
77
1,1
38,1
94
16,5
10,9
28
NO
TES
TO T
HE
FIN
AN
CIA
L ST
ATE
MEN
TS (
CO
NT’
D)
Ass
et
alloca
tion
by
cou
ntr
y
31-D
ec-
16
31-D
ec-
15
Ken
yaU
ga
nd
aSu
da
nR
wa
nd
aTa
nza
nia
Oth
er
Tota
lK
en
yaU
ga
nd
aSu
da
nR
wa
nd
aTa
nza
nia
Oth
er
Tota
l
KES
’0
00
KES
’0
00
KES
’0
00
KES
’0
00
KES
’0
00
KES
’0
00
KES
’0
00
KES
’0
00
KES
’0
00
KES
’0
00
KES
’0
00
KES
’0
00
KES
’0
00
KES
’0
00
Prop
erty
& e
quip
men
t18
8,60
4 17
0,54
2 11
9,93
3 28
,978
48
,257
3,
334
559,
648
236,
126
64,0
90
9,92
5 3
6,67
1 50
,839
5,
692
403,
343
Inve
stm
ent p
rope
rty11
,585
,249
4,
729,
515
5,48
4,19
2 -
- -
21,7
98,9
56
9,95
7,37
1 4
,774
,521
5,
062,
394
- -
-19
,794
,286
Inta
ngib
le a
sset
s90
,709
87
0 -
- 2,
042
4,96
3 98
,584
5
2,91
1 65
2 -
1,96
5 6
,474
19
,720
81
,722
Tota
l ass
ets
34,3
46,7
58
10,1
40,1
55
9,05
5,80
4
1,10
5,50
5
2,35
6,26
6
22,3
12
57,0
26,8
02
29,2
87,2
269,
670,
139
6,81
4,21
782
7,19
72,
096,
971
28,9
04
48,7
24,6
54
Tota
l equi
ty10
,438
,428
2,
497,
211
3,50
9,37
0
379,
568
858,
326
11,3
67
17,6
94,2
70
10,8
36,5
892,
612,
351
3,44
9,27
721
4,80
077
3,19
9(9
0,95
5)17
,795
,261
104

5(b) (i) Gross earned premium
The premium income of the Group can be analysed between the main classes of business as shown below:-
Gross Written Premium Gross Earned Premium
2016 2015 2016 2015KES ’000 KES ’000 KES ’000 KES ’000
Short term insurance business
Engineering 479,276 1,350,685 555,003 1,005,905
Fire 1,677,677 1,621,001 1,677,024 1,499,094
Liability 284,117 307,130 308,732 299,616
Marine 249,961 302,272 263,215 273,067
Motor 3,996,790 3,804,755 3,977,116 3,646,658
Workmen’s Compensation 379,724 330,371 375,899 342,732
Personal Accident and medical 455,464 398,902 476,055 389,002
Theft 618,366 627,486 652,602 612,130
Medical 8,549,941 5,898,169 7,708,319 5,126,897
Others 535,436 366,564 473,073 325,465
Total 17,226,752 15,007,335 16,467,038 13,520,566
Long term business
Ordinary life 983,025 702,637 983,025 702,637
Group life 1,181,636 1,158,259 1,284,943 1,109,591
Total 2,164,661 1,860,896 2,267,968 1,812,228
Total 19,391,413 16,868,231 18,735,006 15,332,794
Gross written premium represents the total premiums receivable by the Group before adjusting for the unearned proportion of the premiums. It is reported in the income statement for information purposes only. Revenue comprises gross earned premiums. All revenue is earned from external customers.
NOTES TO THE FINANCIAL STATEMENTS (CONT’D)
105ANNUAL REPORT & FINANCIAL STATEMENTS 2016

5(b) (ii) Reinsurance ceded and Amounts recoverable from reinsurers
Reinsurance cededAmounts recoverable from
reinsurers
2016 2015 2016 2015
KES ’000 KES ’000 KES ’000 KES ’000
Short term insurance business
Engineering 412,946 859,548 52,597 40,211
Fire 1,026,705 954,188 164,799 273,491
Liability 152,700 150,602 (46,312) 137,991
Marine 111,994 117,545 38,708 -22,904
Motor 114,676 140,132 336,999 291,604
Workmen’s Compensation 8,648 13,672 6,338 -5,489
Personal Accident 72,169 80,138 1,130 13,347
Theft 267,162 268,242 72,158 48,778
Medical 302,974 54,589 83,344 86,232
Others 329,619 213,789 100,623 87,042
Total 2,799,593 2,852,445 810,384 950,303
Long term business 508,377 410,923 287,999 263,291
Total 3,307,970 3,263,368 1,098,383 1,213,594
5(b) (iii) Commissions earned and Commissions Payable
Commissions earned Commissions Payable
2016 2015 2016 2015
KES ’000 KES ’000 KES ’000 KES ’000
Short-term business 575,525 892,016 1,877,020 1,780,256
Long-term business 110,881 131,181 317,286 273,568
Brokerage/Investment management 4,872 1,872 - -
Total 691,278 1,025,069 2,194,306 2,053,824
NOTES TO THE FINANCIAL STATEMENTS (CONT’D)
106 UAP OLD MUTUAL GROUP

6. Investment income
2016 2015KES ’000 KES ’000
Interest from government securities 1,534,197 993,887 Bank deposit interest 411,772 393,260 Loan interest receivable 30,806 38,449 Rental income from investment properties 686,868 530,506 Miscellaneous income ( 9,147) 185,232 (Loss)/ Gain in foreign exchange ( 260,342) ( 184,035)Profit/(loss) on sale of equities ( 11,484) ( 56,988)Fair value gains on investment properties (note 21 (a)) 672,036 1,594,432 Fair value loss on equity assets at fair value through profit or loss (note 24(b)) ( 212,171) ( 329,147)Dividends receivable from equity investments 272,386 191,041 Profit on sale of property and equipment - 957 Fair value (losses)/ gains on government securities assets at fair value through profit or loss
- ( 47,405)
Total 3,114,921 3,310,189
7 Other income
2016 2015KES ’000 KES ’000
Fee income 121,861 102,006 Others 62,913 4,238
Total 184,774 106,244
Fee income relates to administration fees arising from services rendered in relation to the issue and management of deposit administration and other investment contracts. There are no individually significant items included in other category.
8 Claims and policyholder benefits payable
a) Short term insurance business
2016 2015KES ’000 KES ’000
Engineering 84,685 100,023Fire 365,840 374,299Liability (1,052) 163,330Marine 71,800 (1,818)Motor 2,554,941 2,691,203Workmen’s compensation 213,736 124,028Personal accident 116,843 59,081Theft 208,430 103,550Medical 5,131,948 3,837,857Others 126,637 102,663
Total 8,873,808 7,554,216
NOTES TO THE FINANCIAL STATEMENTS (CONT’D)
107ANNUAL REPORT & FINANCIAL STATEMENTS 2016

8 Claims and policyholder benefits payable (continued)
b) Long term insurance business
2016 2015KES ’000 KES ’000
Death, maturity and benefits payable 1,041,011 634,087Increase in policy owners’ liabilities 1,028,442 902,152Interest payable on deposit administration and unit linked investments contracts (8,915) 109,788Total 2,060,538 1,646,027
Total 10,934,346 9,200,243
9 Operating and other expenses
There are no individually significant items included in other category.
10 Staff costs2016 2015
KES ’000 KES ’000Salaries and wages 1,943,495 1,676,779 Social security benefits costs 50,511 48,228 Retirement benefit costs: Defined benefits scheme (67,622) 26,570 Defined contribution scheme 80,531 82,032 Other staff costs 510,355 186,876 Total 2,517,270 2,020,485
2016 2015
KES ’000 KES ’000Staff Costs (Note 10) 2,517,270 2,020,485Depreciation (Note 19) 160,123 141,836Amortisation of intangible assets (Note 20) 47,066 68,215Impairment charge on receivables arising out of insurance arrangements (Note 4 (b))
141,035 426,925
Travel costs 153,576 124,705Office running costs 714,488 546,017Directors expenses 94,843 110,472Consultancy fees and expenses 261,742 361,294Recurrent property costs 105,646 50,706Repairs and maintenance costs 25,234 41,177Publicity and marketing expenses 510,245 545,502Subscription costs 29,914 36,830software costs 329,869 369,339Licenses costs 11,610 11,902Premium tax costs 190,450 170,002Other insurance expenses 12,397 143,390Bank charges and other expenses. 308,437 30,573
5,613,945 5,199,370
NOTES TO THE FINANCIAL STATEMENTS (CONT’D)
108 UAP OLD MUTUAL GROUP

11 Income tax expense
2016 2015KES ’000 KES ’000
Current income tax 480,808 363,191 Deferred tax (Note 22) ( 85,950) (566,634)Total 394,858 (203,443)
The tax on the Group’s profit before income tax differs from the theoretical amount that would arise using the statutory income tax rate as follows:
2016 2015KES ’000 KES ’000
Profit before tax 1,220,632 693,156
Tax calculated at a tax rate of 30% (2015: 30%); 366,190 207,947
Less: tax effect of income not subject to tax (301,050) (885,670)
Add: tax effect of expenses not deductible for tax purposes 329,718 593,761
Prior year over-provision of deferred tax - (119,481)
Total 394,858 (203,443)
Movement in the tax (payable) / recoverable account is as follows:
2016 2015KES ’000 KES ’000
At 1 January 2016 ( 81,497) 71,414
Taxation charge (480,808) (363,191)
Taxation paid 570,945 210,280
At end of the year 8,640 ( 81,497)
Disclosed as follows;
31-Dec 31-Dec2016 2015
KES ’000 KES ’000Current income tax recoverable 93,183 27,900
Current income tax payable (84,543) (109,397)
Total 8,640 (81,497)
NOTES TO THE FINANCIAL STATEMENTS (CONT’D)
109ANNUAL REPORT & FINANCIAL STATEMENTS 2016
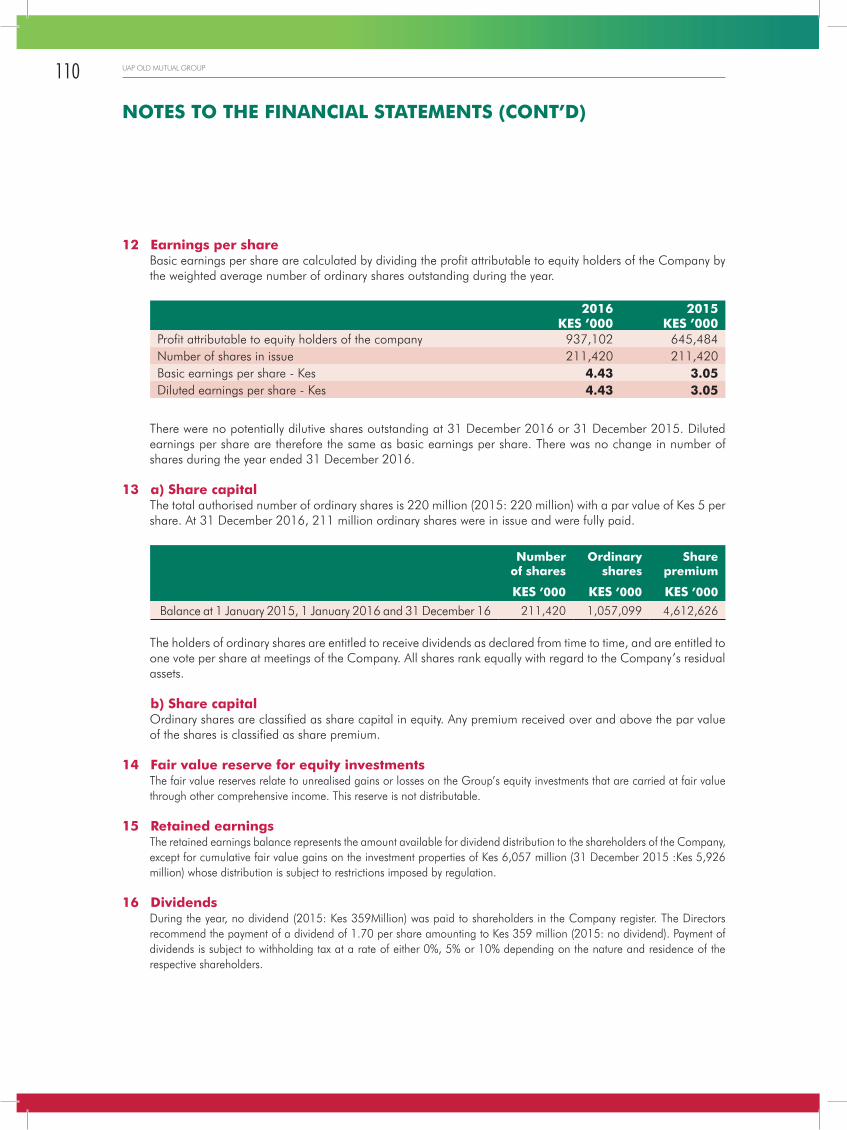
12 Earnings per shareBasic earnings per share are calculated by dividing the profit attributable to equity holders of the Company by the weighted average number of ordinary shares outstanding during the year.
2016 2015KES ’000 KES ’000
Profit attributable to equity holders of the company 937,102 645,484Number of shares in issue 211,420 211,420Basic earnings per share - Kes 4.43 3.05Diluted earnings per share - Kes 4.43 3.05
There were no potentially dilutive shares outstanding at 31 December 2016 or 31 December 2015. Diluted earnings per share are therefore the same as basic earnings per share. There was no change in number of shares during the year ended 31 December 2016.
13 a) Share capitalThe total authorised number of ordinary shares is 220 million (2015: 220 million) with a par value of Kes 5 per share. At 31 December 2016, 211 million ordinary shares were in issue and were fully paid.
Number of shares
Ordinary shares
Share premium
KES ’000 KES ’000 KES ’000
Balance at 1 January 2015, 1 January 2016 and 31 December 16 211,420 1,057,099 4,612,626
The holders of ordinary shares are entitled to receive dividends as declared from time to time, and are entitled to one vote per share at meetings of the Company. All shares rank equally with regard to the Company’s residual assets.
b) Share capitalOrdinary shares are classified as share capital in equity. Any premium received over and above the par value of the shares is classified as share premium.
14 Fair value reserve for equity investmentsThe fair value reserves relate to unrealised gains or losses on the Group’s equity investments that are carried at fair value through other comprehensive income. This reserve is not distributable.
15 Retained earningsThe retained earnings balance represents the amount available for dividend distribution to the shareholders of the Company, except for cumulative fair value gains on the investment properties of Kes 6,057 million (31 December 2015 :Kes 5,926 million) whose distribution is subject to restrictions imposed by regulation.
16 DividendsDuring the year, no dividend (2015: Kes 359Million) was paid to shareholders in the Company register. The Directors recommend the payment of a dividend of 1.70 per share amounting to Kes 359 million (2015: no dividend). Payment of dividends is subject to withholding tax at a rate of either 0%, 5% or 10% depending on the nature and residence of the respective shareholders.
NOTES TO THE FINANCIAL STATEMENTS (CONT’D)
110 UAP OLD MUTUAL GROUP

17 i) Translation reserve The translation reserve compiles all foreign currency differences arising from the translation of the financial statements of foreign operations. The translation reserve is not distributable.ii) Statutory reserve
The statutory reserve represents amounts set up in the Group’s Ugandan subsidiary in accordance with the Ugandan Insurance Act, which requires the following amounts to be appropriated from earnings:
• a contingency reserve calculated at the higher of 2% of gross premium and 15% of net profits of UAP Insurance Uganda Limited.
• a capital reserve, calculated at 5% of net profits of UAP Insurance Uganda Limited.
The reserve is available for distribution to the extent that the minimum amounts required by the Uganda Insurance Act are maintained.
18 GoodwillThe goodwill arose from acquisition of UAP Century Tanzania in 2013 (Kes 174,363,000) and UAP Insurance Uganda Limited in 2004 (Kes 65,667,000) and is therefore all allocated to the Tanzania and Uganda Cash Generating Units (CGUs) for the purposes of impairment assessment.
KES ’000
Balance as at 1 January 2015, 31 December 2015 and 31 December 2016 240,030
The recoverable amount of a CGU is determined based on value-in-use calculations. These calculations use cash flow projections based on financial budgets approved by management covering a 5 year period. The growth rates do not exceed the long-term average growth rates for the respective businesses in which CGUs operate.
The key assumptions used for the value in use calculations are:
31 December 2016 31 December 2015Growth rate % 23 23Discount rate % 13 13
Management determined budgeted profit from operating activities based on past performance and its expectations for the market developments. The weighted average growth rates used are consistent with the forecasts included in industry reports. The discount rates used are pre-tax and reflect specific risks relating to the Tanzania and Uganda segment.
NOTES TO THE FINANCIAL STATEMENTS (CONT’D)
111ANNUAL REPORT & FINANCIAL STATEMENTS 2016

19 Property and equipmenta) Group
Office Capitalfurniture & Computer Motor work-in Telephoneequipment equipment Vehicles progress equipment Total
KES ’000 KES ’000 KES ’000 KES ’000 KES ’000 KES ’000
Year ended 31 December 2016
Cost
At 1 January 2016 448,329 461,657 59,397 55,682 86,598 1,111,663Additions 178,015 33,543 10,179 41,957 7,678 271,372Disposals ( 400) ( 1,599) - - - ( 1,999)Transferred to computer equipment - 13,789 - (13,789) - -Translation difference 41,353 20,616 48,727 13,706 6,022 130,424At 31 December 2016 667,297 528,006 118,303 97,556 100,298 1,511,460DepreciationAt 1 January 2016 261,928 344,694 48,562 - 53,136 708,320Charge for the year 49,691 74,959 21,498 - 13,975 160,123Accumulated depreciation on disposals ( 570) ( 717) - - - ( 1,287)Translation difference 31,653 15,977 32,058 - 4,968 84,656At 31 December 2016 342,702 434,913 102,118 - 72,079 951,812
Net book amountAt 31 December 2016 324,595 93,093 16,185 97,556 28,219 559,648
Year ended 31 December 2015
Cost
At 1 January 2015 435,725 400,054 104,576 60,212 77,196 1,077,763
Additions 50,812 80,448 7,777 3,115 11,597 153,749
Disposals (1,021) - (13,157) - - ( 14,178)
Translation difference (37,187) ( 18,845) (39,799) ( 7,645) (2,195) ( 105,671)
At 31 December 2015 448,329 461,657 59,397 55,682 86,598 1,111,663
At 31 December 2015
Depreciation
At 1 January 2015 248,095 295,427 54,078 - 43,802 641,402
Charge for the year 40,909 67,033 21,987 - 11,907 141,836
Accumulated depreciation on disposals 389 ( 169) ( 6,792) - - ( 6,572)
Translation difference (27,465) ( 17,597) (20,711) - (2,573) ( 68,346)
At 31 December 2015 261,928 344,694 48,562 - 53,136 708,320
Net book amountAt 31 December 2015
186,401 116,963 10,835 55,682 33,462 403,343
Included in equipment are assets with a gross value of Kes 259,846,385 (2015 – Kes 228,469,490) which are fully depreciated and still in use. Such assets would have attracted a notional depreciation of Kes 50,334,328 (2015 – Kes 43,766,562).
NOTES TO THE FINANCIAL STATEMENTS (CONT’D)
112 UAP OLD MUTUAL GROUP
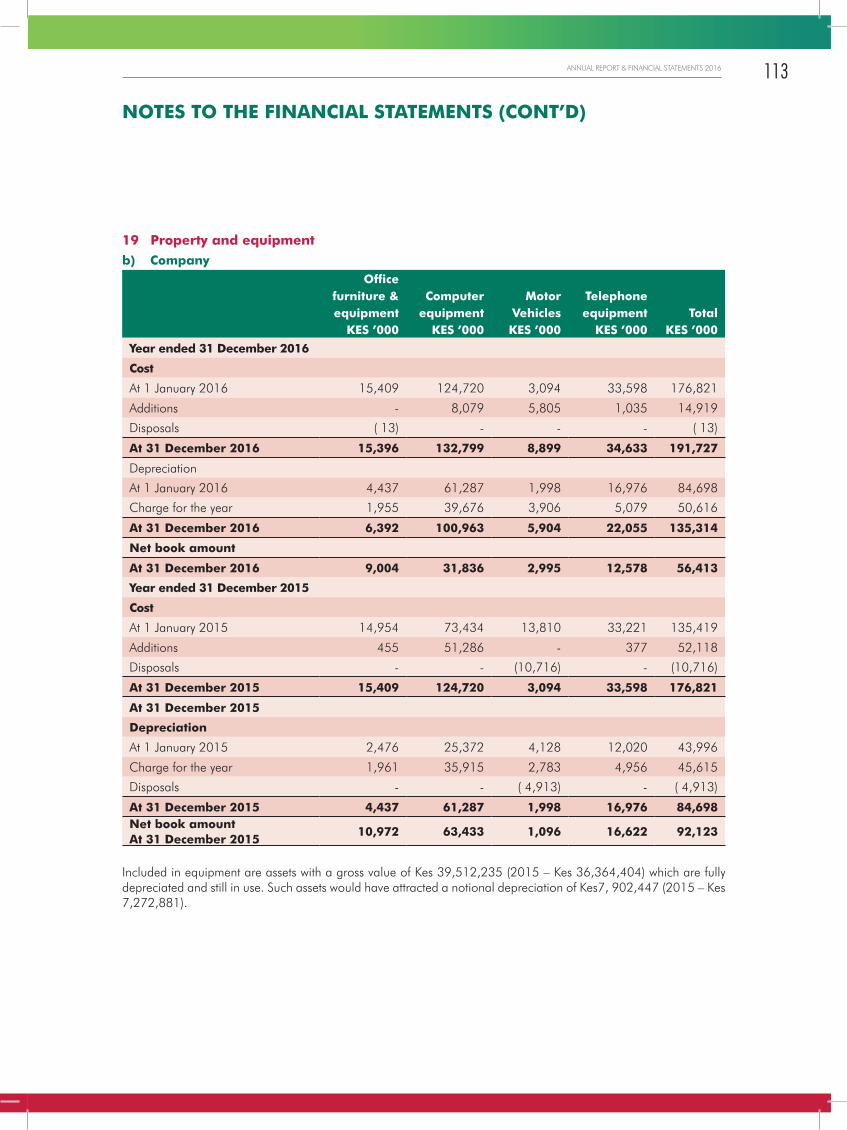
19 Property and equipmentb) Company
Office furniture & Computer Motor Telephone equipment equipment Vehicles equipment Total
KES ’000 KES ’000 KES ’000 KES ’000 KES ’000
Year ended 31 December 2016
Cost
At 1 January 2016 15,409 124,720 3,094 33,598 176,821
Additions - 8,079 5,805 1,035 14,919
Disposals ( 13) - - - ( 13)
At 31 December 2016 15,396 132,799 8,899 34,633 191,727
Depreciation
At 1 January 2016 4,437 61,287 1,998 16,976 84,698
Charge for the year 1,955 39,676 3,906 5,079 50,616
At 31 December 2016 6,392 100,963 5,904 22,055 135,314
Net book amount
At 31 December 2016 9,004 31,836 2,995 12,578 56,413
Year ended 31 December 2015
Cost
At 1 January 2015 14,954 73,434 13,810 33,221 135,419
Additions 455 51,286 - 377 52,118
Disposals - - (10,716) - (10,716)
At 31 December 2015 15,409 124,720 3,094 33,598 176,821
At 31 December 2015
Depreciation
At 1 January 2015 2,476 25,372 4,128 12,020 43,996
Charge for the year 1,961 35,915 2,783 4,956 45,615
Disposals - - ( 4,913) - ( 4,913)
At 31 December 2015 4,437 61,287 1,998 16,976 84,698 Net book amountAt 31 December 2015
10,972 63,433 1,096 16,622 92,123
Included in equipment are assets with a gross value of Kes 39,512,235 (2015 – Kes 36,364,404) which are fully depreciated and still in use. Such assets would have attracted a notional depreciation of Kes7, 902,447 (2015 – Kes 7,272,881).
NOTES TO THE FINANCIAL STATEMENTS (CONT’D)
113ANNUAL REPORT & FINANCIAL STATEMENTS 2016

20 Intangible assets
a) Group
Computer Work in
software progress Total
KES ’000 KES ’000 KES ’000Year ended 31 December 2016:CostAt 1 January 2016 537,848 19,591 557,439Additions 35,423 28,737 64,160Translation difference ( 232) - ( 232)At 31 December 2016 573,039 48,328 621,367DepreciationAt 1 January 2016 475,717 - 475,717Charge for the year 47,066 - 47,066At 31 December 2016 522,783 - 522,783Net book amountAt 31 December 2016 50,256 48,328 98,584Year ended 31 December 2015:CostAt 1 January 2015 520,489 - 520,489Additions 13,910 19,591 33,501Translation difference 3,449 - 3,449At 31 December 2015 537,848 19,591 557,439DepreciationAt 1 January 2015 407,502 - 407,502Charge for the year 68,215 - 68,215At 31 December 2015 475,717 - 475,717Net book amount 62,131 19,591 81,722
b) Company
2016 2015
KES ’000 KES ’000
Carrying value
At start of year 50,703 61,936
Additions 4,362 11,442
Work in progress - Additions 28,737 19,592
Amortisation charge for the year (19,996) (42,267)
At end of year 63,806 50,703
The intangible assets for the company relate to computer software.
NOTES TO THE FINANCIAL STATEMENTS (CONT’D)
114 UAP OLD MUTUAL GROUP

21 Investment properties
a) Group
2016 2015
KES ’000 KES ’000At start of year 19,794,286 15,122,307Additions 1,637,968 3,077,504Fair value gains unrealised 672,036 1,594,432Translation difference ( 305,334) 43 At end of year 21,798,956 19,794,286
b) Company
2016 2015
KES ’000 KES ’000At start of year 5,474,671 3,635,242Additions 1,347,056 1,945,929Fair value gains 206,822 (106,500)At end of year 7,028,549 5,474,671
The Group’s investment properties were revalued in December 2016 and 2015 by Knight Frank Valuers Limited, professional independent valuers in Kenya, South Sudan and Bageine & Company in Uganda respectively on the basis of open market and the comparative and investment methods. The open market value of all properties was determined using recent market prices. The rental income earned by the Group from its investment properties leased out under operating leases amounted to Kes 687 million (2015: Kes 531 million). Direct operating expenses arising on investment properties amounted to Kes 106 million (2015: Kes 49 million). All investment properties are classified as non-current assets.
Details of the Group’s investment properties and information about fair value hierarchy as at 31 December 2016 are as follows:
2016 2015KES ’000 KES ’000
Level 1 - -Level 2 - -Level 3 21,798,956 19,794,286
Fair value as at 31 December 21,798,956 19,794,286
Details of the Company’s investment properties and information about fair value hierarchy as at 31 December 2016 are as follows:
2016 2015KES ’000 KES ’000
Level 1 - -Level 2 - -Level 3 7,028,549 5,474,671Fair value as at 31 December 7,028,549 5,474,671
NOTES TO THE FINANCIAL STATEMENTS (CONT’D)
115ANNUAL REPORT & FINANCIAL STATEMENTS 2016

21 Investment properties (continued)The carrying value of the investment properties is the fair value of the property as determined by a registered independent valuer having an appropriate recognized professional qualification and experience in the category of the property being valued.
The investment properties are leased to third parties under operating leases and partly occupied by the company. No contingent rents are charged.
There is neither restriction on the realisability of the investment properties nor are there contractual obligations pegged to the investment properties.
All investment properties as at 31 December 2016 are measured at fair value.
The table below shows the valuation techniques used in measuring fair value of investment property as well as significant unobservable inputs used.
Valuation technique Significant unobservable inputs
Inter-relationships between unobservable inputs and fair value measurements
Discounted cash flows:The valuation model considers the present value of net cash flows to be generated from the property taking into account expected rental growth, occupancy rates and other costs not paid by tenants. The net cash flows are discounted using the risk adjusted discount rate.
1. Expected market rental growth – 3.75% - 7%2. Occupancy rates (90% -100%)3. Risk-adjusted discount rate
Estimated fair values would increase / ( decrease) if:;
1. Expected rental growth were higher /(lower2. Occupancy rates were higher / (lower)3. Risk-adjusted discount rate was lower / (higher)
NOTES TO THE FINANCIAL STATEMENTS (CONT’D)
116 UAP OLD MUTUAL GROUP

22 Deferred income taxDeferred tax is calculated, in full, on all temporary differences under the liability method using a principal tax rate of 30% (2015: 30%). The movement on the deferred income tax account for the Group is as follows
31-Dec 31-Dec 2016 2015 KES ’000 KES ’000At start of year: 47,461 637,146 Profit or loss (Note 11) (85,950) (566,634)Translation difference (23,393) (23,051)Total (61,882) 47,461
Disclosed as follows;
Deferred tax assets and liabilities and deferred tax charge/(credit) in the income statement for the Group are attributable to the following items:
31-Dec 31-Dec 2016 2015 KES ’000 KES ’000Deferred tax asset (718,461) (569,613)Deferred tax liability 656,579 617,074 Total (61,882) 47,461
2015
Year ended 31 December 20151-Jan (Charged) Translation 31-Dec2015 / credited Reserves 2015
KES ’000 KES ’000 KES ’000 KES ’000Property and equipment: - on historical cost basis ( 84,380) 132,214 ( 18) 47,816 Investment property fair value gains (887,902) (10,085) (89,794) (987,781)Other provisions 335,136 444,505 112,863 892,504 Net deferred tax liability (637,146) 566,634 23,051 ( 47,461)
2016
Year ended 31 December 20161-Jan (Charged) Translation 31-Dec
2016 / credited Reserves 2016KES ’000 KES ’000 KES ’000 KES ’000
Property and equipment: - on historical cost basis 47,816 (17,017) 151 30,950Investment property fair value gains (987,781) (88,901) 46,634 (1,030,048)Other provisions 892,504 191,868 (23,392) 1,060,980Net deferred tax liability (47,461) 85,950 23,393 61,882
NOTES TO THE FINANCIAL STATEMENTS (CONT’D)
117ANNUAL REPORT & FINANCIAL STATEMENTS 2016

22 Deferred income tax (continued)
The movement on the deferred income tax account for the Company is as follows:
Deferred tax assets and liabilities and deferred tax charge/(credit) in the income statement for the Company are attributable to the following items:
31-Dec 31-Dec
2016 2015
KES ’000 KES ’000
At start of year: ( 97,382) 61,442 Profit or loss ( 71,589) (158,824)
Total (168,971) ( 97,382)
Year ended 31 December 2015
1-Jan (Charged) 31-Dec
2016 / credited 2016
KES ’000 KES ’000 KES ’000
Property and equipment: - on historical cost basis 93,901 (129,513) (35,612)Investment property fair value gains 32,426 ( 5,325) 27,101 Tax losses (58,893) ( 25,158) (84,051)Staff gratuity ( 5,992) 1,172 ( 4,820)
Net deferred tax liability 61,442 (158,824) (97,382)
Year ended 31 December 2016
1-Jan (Charged) 31-Dec
2016 / credited 2016
KES ’000 KES ’000 KES ’000
Property and equipment: - on historical cost basis (35,612) 14,152 ( 21,460)Investment property fair value gains 27,101 10,341 37,442 Tax losses (84,051) (66,749) (150,800)Staff gratuity ( 4,820) (29,333) ( 34,153)
Net deferred tax liability (97,382) (71,589) (168,971)
NOTES TO THE FINANCIAL STATEMENTS (CONT’D)
118 UAP OLD MUTUAL GROUP

23 Retirement benefit obligation
Description of planThe Group operates a funded defined benefit plan for all employees. The Scheme is open to new entrants. Scheme members’ contributions are a fixed percentage of pensionable pay with the Group responsible for the balance of the cost of benefits accruing. The Scheme is established under trust. The Scheme funds are invested by a fund manager in a variety of asset classes comprising government securities (Treasury bills and bonds), stocks and shares and commercial paper.
The amounts recognised in the statement of financial position are determined as follows: 2016 2015
KES ’000 KES ’000Present value of funded obligations 853,277 709,452Fair value of plan assets (1,111,406) (1,021,002)
Present value of over-funding (258,129) ( 311,550)
The movement in the fair value of funded obligations is as follows:2016 2015
KES ’000 KES ’000At start of year 709,452 651,907 Current service cost 21,534 63,937 Interest cost 107,342 90,106 Remeasurements 94,737 ( 36,312)Benefits paid (79,788) ( 60,186)
At end of year 853,277 709,452
The movement in the fair value of the plan assets is as follows:2016 2015
KES ’000 KES ’000At start of year 1,021,002 937,825 Interest on scheme assets 158,563 127,473 Actuarial gains/(losses) ( 75,495) ( 99,404)Employer contributions - 74,183 Employee contributions 87,124 41,111 Benefits paid ( 79,788) ( 60,186)
At end of year 1,111,406 1,021,002
NOTES TO THE FINANCIAL STATEMENTS (CONT’D)
119ANNUAL REPORT & FINANCIAL STATEMENTS 2016

23 Retirement benefit obligation (continued)
2016KES ’000
2015KES ’000
Plan assets comprise:Equity instruments 218,543 19.66% 232,437 22.77%Debt instruments 837,587 75.36% 549,625 53.83%Other 55,276 4.98% 238,940 23.40%
1,111,406 100% 1,021,002 100%
The amounts recognised in the income statement for the year are as follows:
2016 2015KES ’000 KES ’000
Current service cost net of contributions 21,534 63,937 Net interest cost 107,342 90,106 Return on scheme assets (excluding interest) 158,563 (127,473)Total change included in employee benefit expense 287,439 26,570
The principal actuarial assumptions used were as follows:- discount rate 14.4% 15.00%- expected rate of return on scheme assets 14.4% 15.00%- future salary increases 8.0% 9.00%- future pension increases 2.8% 3.20%
Sensitivity analysis of the above actuarial assumptions
The sensitivity of the defined benefit obligation to the financial assumptions has been assessed by increasing and decreasing the discount rate assumption by 0.5%.
Defined benefit obligation
2016
Discount rate 13.9% 14.4% 14.9%Total accrued liability 858,517 853,277 848,631Change 1% - 0.50%
2015 Discount rate 14.5% 15.00% 15.50%
Total accrued liability 713,803 709,451 706,066Change 1% - 0.50%
NOTES TO THE FINANCIAL STATEMENTS (CONT’D)
120 UAP OLD MUTUAL GROUP

24 Equity investments
The Group’s equity investments are measured at fair value with fair value changes recorded through either other comprehensive income or income statements for different portfolios of equity investments, following early adoption of IFRS 9, as follows:
a) Equity investments at fair value through other comprehensive income
2016 2015KES ’000 KES ’000
At 1 January 2,554,729 3,734,740 Additions 183,146 1,173,961 Disposals ( 701,097) (2,047,337)Fair value gains recognised in equity ( 362,779) ( 290,548)Translation difference ( 12,173) ( 16,087)At end of the year 1,661,826 2,554,729
b) Equity investments at fair value through profit or loss
At 1 January 2,003,448 2,353,888 Additions 250,761 824,896 Disposals ( 366,965) ( 843,822)Fair value gains charged to profit or loss ( 212,171) ( 329,147)Translation difference ( 3,443) ( 2,367)At end of the year 1,671,630 2,003,448 Total 3,333,456 4,558,177
c) Equity investments
2016 2015KES ’000 KES ’000
(i) Listed securitiesAt 1 January 4,429,484 5,998,958 Additions 433,907 1,977,908 Disposals (1,066,310) (2,875,089)Fair value gains charged to other comprehensive income ( 361,878) ( 302,594)Fair value gains charged to income statement ( 212,171) ( 329,147)Translation difference ( 11,767) ( 40,552)At end of the year 3,211,265 4,429,484
(ii) Unlisted securitiesAt 1 January 128,693 89,671 Additions - 20,949 Disposals ( 1,752) ( 16,070)Fair value gains charged to other comprehensive income ( 901) 12,046 Translation difference ( 3,849) 22,097 At end of the year 122,191 128,693
At end of the year 3,333,456 4,558,177
NOTES TO THE FINANCIAL STATEMENTS (CONT’D)
121ANNUAL REPORT & FINANCIAL STATEMENTS 2016

25 Investments in subsidiaries
Country of Interest 2016 2015Incorporation held KES ’000 KES ’000
UAP Insurance Company Limited (Kenya) Kenya 100% 600,000 600,000
UAP Life Assurance Limited (Kenya) Kenya 100% 1,510,791 1,510,791
UAP Insurance Limited (South Sudan) Sudan 100% 339,442 339,442
UAP Insurance Limited (Uganda) Uganda 53% 202,507 202,507
UAP Financial Services Limited (Kenya) Kenya 100% 10,000 10,000
UAP Financial Services Limited (Uganda) Uganda 82% 140,861 128,845
UAP Properties Limited (Uganda) Uganda 79% 488,743 488,743
UAP SPRL RDC DRC 100% - 12,974
UAP Investments (Kenya) Limited Kenya 100% 125,000 125,000
UAP Century Tanzania Limited Tanzania 60% - -
UAP Rwanda Limited Rwanda 100% - -
UAP Life Uganda Limited Uganda 53% 390,215 172,589
UAP Properties Limited (South Sudan) Uganda 70% - -
UAP Properties Limited (Mauritius) Mauritius 100% - -
UAP Africa Limited (Mauritius) Mauritius 100% 2,155,120 1,751,016
UAP Global Services Limited Mauritius 100% - -
UAP Investments Limited (Mauritius) Mauritius 100% - -
Total 5,962,679 5,341,907
During the year, the Company increased its investments in subsidiaries as follows:
Country of 2016 2015Incorporation KES ’000 KES ’000
UAP Life Assurance Limited (Uganda) Uganda 217,625 100,000
UAP Life Assurance Limited (Kenya) Kenya - 950,000
UAP Financial Services Limited (Uganda) Uganda 12,017 63,475
UAP SPRL RDC DRC 105,928 42,783
UAP Century Tanzania Tanzania - 636,550
UAP Rwanda Rwanda 298,176 350,000
Total 633,746 2,142,808
The investments in UAP Century Tanzania Limited, UAP RDC sarl and UAP Rwanda Limited have been made through UAP Africa Limited (Mauritius).
NOTES TO THE FINANCIAL STATEMENTS (CONT’D)
122 UAP OLD MUTUAL GROUP

26 Mortgage loans receivable
Maturity profile of loans
There is no concentration of credit risk with respect to mortgage loans.
27 Reinsurers’ share of insurance liabilities
2016 2015KES ’000 KES ’000
Reinsurers’ share of:
Unearned premium (Note 38) 2,162,557 1,503,737
Notified claims outstanding:
- short term insurance (Note 36) 1,018,921 992,290 - long term insurance contract liabilities (Note 36) 339,689 245,629 Claims incurred but not reported short term insurance (Note 36) 216,614 235,711
At end of year 3,737,781 2,977,367
Amounts due from reinsurers in respect of claims already paid by the Group on contracts that are reinsured are included in receivables arising out of reinsurance arrangements on the statement of financial position. Movements in the above reinsurance assets are shown in note 36 and 38.
2016 2015KES ’000 KES ’000
Loans maturingWithin 1 year 2,903 1,998In 1-5 years 77,189 76,609In over 5 years 256,682 176,652
336,774 255,259
2016 2015KES ’000 KES ’000
At start of year 255,259 255,437
Loans advanced 625,683 89,094 Loan repayments (544,233) (65,601)Translation difference 65 (23,671)
At end of year (Note 44(iii)) 336,774 255,259
NOTES TO THE FINANCIAL STATEMENTS (CONT’D)
123ANNUAL REPORT & FINANCIAL STATEMENTS 2016

28 Deferred acquisition costs
2016 2015KES ’000 KES ’000
At start of year 432,292 428,748
Additions 223,800 117,060
Amortisation charge (135,723) (86,964)
Translation difference ( 4,663) (26,552)
At end of year 515,706 432,292 29 Other receivables and prepayments
a) Group
2016 2015KES ’000 KES ’000
Prepayments 315,396 265,347
Accrued income 180,929 54,662
Staff debtors 145,797 157,297
Others 823,605 268,868
1,465,727 746,174
b) Company
2016 2015KES ’000 KES ’000
Prepayments 35,963 98,052
Others 296,598 13,435
Total 332,561 111,487
Due from related party (note 44 (iv)) 2,553,022 2,243,013
There are no individually significant items under others category.
*Others include bank balances held in Chase Bank (K) Limited (In Receivership). The Bank was put under receivership on 7 April 2016 by the Central Bank of Kenya and was re-opened on 27 April 2016 under a Receiver Manager (KCB Bank Kenya Limited). The total Group balances in Chase Bank (K) Limited (In Receivership) are Kes 370 million whilst that for the Company are Kes 60 million.
30 Corporate bonds
2016 2015KES ’000 KES ’000
At 1 January 1,855,820 1,588,613
Purchases/(redemptions) 23,288 199,437
Fair value gains charged to income statement (410) 67,770
At 31 December 1,878,698 1,855,820
NOTES TO THE FINANCIAL STATEMENTS (CONT’D)
124 UAP OLD MUTUAL GROUP

31 Government securities
32 Cash and cash equivalents
For the purposes of the statement of cash flows, cash and cash equivalents for the Group comprise the following:
Cash and cash equivalents for the Company comprise the following:
2016 2015KES ’000 KES ’000
Cash and bank balances 402,090 10,805 Deposits with financial institutions 1,499,758 208,811
At end of the year 1,901,848 219,616
2016 2015KES ’000 KES ’000
Cash and bank balances 1,845,906 1,750,124 Deposits with financial institutions 5,037,139 3,845,043 Treasury bills maturing within 91 days of acquisition (note 31) 752,519 95,697
At end of the year 7,635,604 5,690,864
2016 2015KES ’000 KES ’000
Treasury bills and bonds maturing:Within 91 days 752,519 95,697 91 days to 1 year 2,422,966 966,468 In 1-5 years 2,830,078 860,278 After 5 years 5,914,461 5,618,636
At end of the year 11,920,024 7,541,079
Government securities – fair value 650,419 320,523 Government securities – armortised cost 11,269,605 7,220,556
At end of the year 11,920,024 7,541,079
NOTES TO THE FINANCIAL STATEMENTS (CONT’D)
125ANNUAL REPORT & FINANCIAL STATEMENTS 2016

Movements in insurance liabilities and reinsurance assets are shown in Note 36.
i) Short term insurance contracts liabilitiesGross claims reported, claims handling expenses liabilities and the liability for claims incurred but not reportedare net of expected recoveries from salvage and subrogation. The expected recoveries at the end of 31 December2016 and 31 December 2015 are not material.
The Group uses chain-ladder techniques to estimate the ultimate cost of claims and the IBNR provision. Chainladder techniques are used as they are an appropriate technique for mature classes of business that have arelatively stable development pattern. This involves the analysis of historical claims development factors and theselection of estimated development factors based on this historical pattern. The selected development factorsare then applied to cumulative claims data for each accident year that is not fully developed to produce anestimated ultimate claims cost for each accident year.
The development of insurance liabilities provides a measure of the Groups’ ability to estimate the ultimate valueof claims. The table below illustrates how the Groups’ estimate of total claims outstanding for each accidentyear has changed at successive year ends.
2016 2015KES ’000 KES ’000
Short term insurance contracts
- claims reported and claims handling expenses 4,077,341 3,576,809
- claims incurred but not reported 1,629,151 1,307,691
At end of the year 5,706,492 4,884,500
Long term contracts
- claims reported and claims handling expenses 4,054,338 3,262,377
Total gross insurance liabilities 9,760,830 8,146,877
NOTES TO THE FINANCIAL STATEMENTS (CONT’D)
33 Insurance contract liabilities
126 UAP OLD MUTUAL GROUP

33 Insurance contract liabilities (continued) i) Short term insurance contracts liabilities (continued)
ii) Long term business contractsThe Group determines its liabilities on long term insurance contracts based on assumptions in relation to future deaths, voluntary terminations, investment returns and administration expenses. A margin for risk and uncertainty is added to these assumptions. The liabilities are determined on the advice of the consulting actuary and actuarial valuations are carried out on an annual basis.
Actuarial Valuation assumptionsThe latest actuarial valuation of the Life Fund was carried out as at 31 December 2016 by QED Actuaries and Consultants, using both Net Premium Valuation (NPV) method and Gross Premium valuation (GPV) method and has reported based on the Gross Premium Method as per guidance from the insurance Act that requires the higher resulting liability to be used. This method is generally accepted in the actuarial industry as an appropriate method to place a realistic value (with an appropriate allowance for margins) on the liabilities of a life insurance Company. This method is based on a discounted cash flow approach taking into account the expected cash flows from existing in-force business. By setting appropriate assumptions this method determines liabilities which are consistent with the value of assets included in the accounts.
The more significant valuation assumptions are summarised below. The assumptions used for the previous year-end valuation are shown in brackets:
a) Mortality – The Company used SA56-62 (2015: SA56-62) as a base table of standard mortality for the GPV valuation and KE01-03 (2015: A1949/52) for the NPV basis. Statistical methods are used to adjust the rates reflected in the table based on the Company’s experience. An allowance for AIDS is made based on the Actuarial Society of South Africa’s 2003 AIDS tables. For contracts insuring survivorship the a(90) (2015: a(55)) life table was used as a base; no allowance is made for future mortality improvements.
Accident year2012 2013 2014 2015 2016 Total
KES ’000 KES ’000 KES ’000 KES ’000 KES ’000 KES ’000
Estimate of ultimate claims costsAt end of accident year 1,911,509 4,397,835 5,055,654 6,159,310 6,539,010 24,063,318
One years later 2,096,809 4,849,591 5,554,090 6,847,489 - 19,347,979
Two years later 2,125,027 4,863,898 5,480,592 - - 12,469,517
Three years later 2,104,213 4,827,115 - - - 6,931,328
Four years later 2,142,873 - - - - 2,142,873
Current estimate of cumulative claims
2,142,873 4,827,115 5,480,592 6,847,489 6,539,010 25,837,079
Less: Cumulative payments to date (2,033,559) (4,440,907) (5,009,979) (6,149,816) (5,101,259) (22,735,520)
Liability in the Balance sheet 109,314 386,208 470,613 697,673 1,437,751 3,101,559
Liability in respect of prior years - - - - 975,782 975,782Incurred but not reported - - - - 1,629,151 1,629,151
Total gross claims liability included in the balance sheet
109,314 386,208 470,613 697,673 4,042,684 5,706,492
NOTES TO THE FINANCIAL STATEMENTS (CONT’D)
127ANNUAL REPORT & FINANCIAL STATEMENTS 2016

33 Insurance contract liabilities (continued)(ii) Long term business contracts (continued)
Actuarial valuation assumptions (continued)
• Persistency – The Company does not have sufficient historical data to allow statistical methods to be used to determine an appropriate persistency rate. The persistency rates used in the valuation were set according to the experience observed (by the actuary) in the Company’s data.
• Investment returns are derived with reference to the return on long term fixed interest investments available in Kenya and adjusted to reflect the actual underlying mix of assets. For the current valuation, the rate of return was 12.5%p.a. (2015: 12.5% p.a.) for the GPV basis and 4% p.a (2015: 4% p.a) for the NPV basis.
• Expenses, tax and inflation – The current level of renewal expenses were taken to be an appropriate expense base. Expenses pertaining to business establishment and expansion were excluded from the valuation assumption. Expense inflation is assumed to be 10% p.a. (2015:10% p.a.). It has been assumed that the current tax legislation and rates continue unaltered. Under the NPV method it is not possible to model expenses, tax and inflation explicitly.
iii Long term business contracts (continued) Sensitivity analysis
The following table presents the sensitivity of the value of long term insurance liabilities to movements in key assumptions used in the estimation of liabilities. For liabilities under insurance contracts with fixed and guaranteed terms, key assumptions are unchanged for the duration of the contract. For long term insurance contracts without fixed terms and with discretionary participation in profits, the liability is set approximately equal to the value of the underlying asset of the contract. Hence, there is no sensitivity analysis for these types of contracts.
34 Amounts payable under deposit administration contractsDeposit administration contracts are recorded at amortised cost. Movements in amounts payable under deposit administration contracts during the period were as shown below. The liabilities are shown inclusive of interest accumulated to the end of the reporting period. Interest was declared and credited to the customers’ accounts at a weighted average rate of 12 % for the year (2015: 13 %).
Change in variable
Increase in liability
2016
Increase in liability
2015
Contracts with Fixed and Guaranteed Terms – Variable: KES ’000 KES ’000
Worsening of mortality +10% (20,607) (20,595)
Lowering of investment returns p.a. -1% 133,692 144,524
Worsening of expense inflation rate +1% 20,980 23,409
Worsening of lapse rate +10% ( 7,515) (10,515)
NOTES TO THE FINANCIAL STATEMENTS (CONT’D)
128 UAP OLD MUTUAL GROUP

34 Amounts payable under deposit administration contracts (continued)
Other movements relate to fees deducted from policyholder’s accounts in respective years and also the additional discretionary reserves in year 2016.
35 Unit-linked investment contracts The benefits offered under these contracts are based on the return of a portfolio of equities and debt securities.
The maturity value of the financial liabilities is determined by the fair value of the linked assets. There will be no difference between the carrying amount and the maturity amount at maturity date.
2016 2015KES ’000 KES ’000
At start of year 1,007,721 1,040,828
Premium received 98,977 114,341
Interest credited ( 8,915) 45,297
Liabilities released for payment (187,745) ( 192,640)
Other movements ( 49,439) 2,788
Translation difference ( 4,554) ( 2,893)
At end of the year 856,045 1,007,721
2016 2015KES ’000 KES ’000
At start of year 4,423,199 3,633,021
Pension fund deposits received 1,286,127 881,368
Surrenders and annuities paid (778,940) (655,031)
Interest payable to policyholders 226,574 567,124
Administration fees ( 13,948) 9,539
Other movements 131,865 -
Translation difference ( 10,719) ( 12,822)
At end of the year 5,264,158 4,423,199
NOTES TO THE FINANCIAL STATEMENTS (CONT’D)
129ANNUAL REPORT & FINANCIAL STATEMENTS 2016

36 Movements in insurance liabilities and reinsurance assets
Short term insurance business
31-Dec-16 31-Dec-15
GrossRe
insuranceNet Gross
Reinsurance
Net
KES ’000 KES ’000 KES ’000 KES ’000 KES ’000 KES ’000
Notified claims 3,576,809 ( 992,290) 2,584,519 3,417,187 ( 982,207) 2,434,980
Incurred but not reported 1,307,691 ( 235,711) 1,071,980 941,485 ( 123,290) 818,195
Total at beginning of year 4,884,500 (1,228,001) 3,656,499 4,358,672 (1,105,497) 3,253,175
Cash paid for claims settled in year (8,157,914) 789,231 (7,368,683) (3,487,349) 492,425 (2,994,924)
Increase in liabilities
- arising from current year claims 8,161,063 ( 664,805) 7,496,258 3,416,949 ( 636,280) 2,780,669
- arising from prior year claims 870,987 ( 150,696) 720,291 874,455 ( 28,596) 845,859
Translation difference ( 52,144) 18,736 ( 33,408) ( 278,227) 49,948 ( 228,279)
Total at year end 5,706,492 (1,235,535) 4,470,957 4,884,500 (1,228,000) 3,656,500
Notified claims 4,077,341 (1,018,921) 3,058,420 3,576,809 ( 992,290) 2,584,519
Incurred but not reported 1,629,151 (216,614) 1,412,537 1,307,691 ( 235,711) 1,071,980
Total at year end 5,706,492 (1,235,535) 4,470,957 4,884,500 (1,228,001) 3,656,499
Long term insurance business
31-Dec-16 31-Dec-15
Gross Reinsurance Net Gross Re
insurance Net
KES ’000 KES ’000 KES ’000 KES ’000 KES ’000 KES ’000
At 1 January 3,262,377 ( 245,629) 3,016,748 3,361,763 ( 248,620) 3,113,143Premium received/valuation pre-mium
1,640,655 ( 369,653) 1,271,002 1,445,908 ( 333,310) 1,112,598
Liabilities released for payments ( 846,750) 287,483 ( 559,267) (1,591,515) 332,761 (1,258,754)
Translation difference ( 1,944) ( 11,890) ( 13,834) 46,221 3,540 49,762
Total at year end 4,054,338 ( 339,689) 3,714,649 3,262,377 ( 245,629) 3,016,749
Total at year end 9,760,830 (1,575,224) 8,185,606 8,146,877 ( 1,473,630) 6,673,248
37 Borrowings
2016 2015
KES ’000 KES ’000
a) Group
At start of year 7,477,300 3,981,001
Net proceeds from borrowings 2,987,052 2,684,423
Finance cost – interest on borrowings 553,162 577,929
Fair value loss/(gain) on financial liabilities revaluation 5,747 ( 21,594)
Unrealised forex loss on borrowings 54,701 303,629
Translation difference ( 46,380) ( 48,088)
At end of the year 11,031,582 7,477,300
NOTES TO THE FINANCIAL STATEMENTS (CONT’D)
130 UAP OLD MUTUAL GROUP

Construction of Nakawa Park, a project undertaken by UAP Properties Uganda, is partly financed through PTA Bank. The borrowings are repayable in 9 years and bear an interest rate of 8.5%.
On 28 July 2014, the group issued Kes 2 billion 13% Kenya Shilling medium term notes to finance its expansion programme and working capital requirements. The related transaction costs amounting to Kes 36 million have been netted off against the proceeds and amortised over the tenure of the notes. The notes are repayable on 28 July 2019.
Construction of UAP Equatoria Tower, a project undertaken by UAP Properties South Sudan, is partly financed through Norwegian Investment Fund for Development (Norfund) - USD5 million and International Finance Corporation (IFC) - USD 5 million. The borrowings are repayable in 7 years beginning 2016 and bear an interest rate of LIBOR plus 6%. UAP Insurance South Sudan has taken a 5 year loan with SFC Finance Limited which is a USD 6 million facility at an interest rate of 9.5%
The short term finance from Old Mutual Holdings Kenya comprises USD 16.5million which bears an interest rate of 3months LIBOR plus 7.5% and Kes 1billion at interest rate of 12.5%. The Nedbank loan is a USD 31 million 5year loan at an interest of 3months LIBOR plus 3.5%.
None of the borrowings was in default at any time during the period.
2016 2015
KES ’000 KES ’000
b) Company
At start of year 4,903,538 2,078,647 Proceeds from borrowings, net of transaction costs 3,647,843 2,356,997 Interest cost payable 419,870 489,488 Revaluation gain 5,747 ( 21,594)
At end of the year 8,976,998 4,903,538
37 Borrowings (continued)
The breakdown of the borrowings is shown below:
2016 2015
KES ’000 KES ’000
PTA Bank Loan - Uganda 1,570,890 1,607,557 Corporate Bond- UAP Holdings Limited 2,077,206 2,086,109 Norfund Loan - South Sudan Properties Limited 316,660 511,557 IFC Loan - South Sudan Properties Limited 316,660 511,557 Old Mutual Holdings Kenya Short term financing 3,043,710 2,760,520 Nedbank loan 3,153,118 - SFC Finance Limited loan 553,338 -
At end of year 11,031,582 7,477,300
NOTES TO THE FINANCIAL STATEMENTS (CONT’D)
131ANNUAL REPORT & FINANCIAL STATEMENTS 2016

38 Unearned premiumUnearned premium represents the liability for short term business contracts where the Group’s obligations are not expired at the year end. Movements in the reserve are shown below:
39 Other payables
a) Group
There are no individually significant items under other liabilities category.
b) Company
2016 2015KES ’000 KES ’000
Accrued expenses 88,313 21,460
Other liabilities 187,410 346,859
Total 275,723 368,319
Due to related parties (Note 44 (iv)) 939,212 939,842 There are no individually significant items under others category.
2016 2015KES ’000 KES ’000
Deferred income 58,573 21,097
Accrued expenses 747,446 195,951
Accrued leave 65,928 93,439
Withheld taxes 341,482 183,479
Other liabilities 997,769 1,174,257
At end of the year 2,211,198 1,668,223
31-Dec-16 31-Dec-15
Gross Reinsurance Net Gross Reinsurance Net
KES ’000 KES ’000 KES ’000 KES ’000 KES ’000 KES ’000At beginning of the year 6,373,812 (1,503,737) 4,870,075 5,364,573 (1,083,183) 4,281,390
Increase in the period 1,351,619 ( 713,183) 638,436 1,331,364 ( 437,812) 893,552
Translation difference (134,068) 54,363 ( 79,705) ( 322,125) 17,258 (304,867)
At end of year 7,591,363 (2,162,557) 5,428,806 6,373,812 (1,503,737) 4,870,075
NOTES TO THE FINANCIAL STATEMENTS (CONT’D)
132 UAP OLD MUTUAL GROUP

40 Cash generated from operations
Reconciliation of profit before tax to cash generated from operations
41 Contingent liabilities
Legal ProceedingsThe holding Company, UAP Holdings Limited has a pending legal suit against the Company seeking a declaration that the sale of the property known as Land Reference No. 209/13453 Upper hill, Nairobi and on which the development known as UAP Towers is currently under construction as null and void. The contingent liability is estimated at Kes 500 Million. Management, based on legal advice, do not foresee the suit being successful and has therefore made no provision in the financial statement.
Tax contingent liabilities
In 2015, the Kenya Revenue Authority (KRA) carried out an audit of UAP Life Assurance Company Limited’s tax affairs for the periods January 2011 to December 2014 and issued an assessment of Kes 68 million under the tax heads of Excise Duty, Value Added Tax (VAT), Pay As You Earn (PAYE) and Corporation Tax. UAP Life Assurance Company Limited has objected to assessments amounting to Kes 36 million.
No provision has been made in the financial statement as well as the KRA assessed amounts as in the Directors’ opinion, the exposures and assessments relate to industry-wide tax issues which are yet to be conclusively resolved.
In common with the insurance industry in general, the Group’s insurance subsidiaries are subject to litigation arising in the normal course of insurance business. The directors are of the opinion that this litigation will not have a material effect on the financial position or profits of the Group.
2016 2015KES ’000 KES ’000
Profit before tax 1,220,633 693,156
Adjustments for:
Investment income (Note 6) (3,114,921) (3,309,232)
Depreciation (Note 19) 160,123 141,836
Amortisation (Note 20) 47,066 68,215
Interest costs (Note 37) 553,162 577,929
Gain on disposal of property and equipment (Note 6) - ( 957)
Changes in:
Insurance contract liabilities (net) (Note 33) 1,613,953 426,442
Deposit administration contracts (Note 34) 840,959 790,178
Unit-linked contracts (Note 35) ( 151,676) ( 33,107)
Unearned premium (net) (Note 37) 1,217,551 1,009,239
Re-insurance and other payables 1,313,419 391,043 Direct insurance, re-insurance and other receivables(including foreign exchange movements)
(1,721,316) 164,372
Deferred acquisition costs (Note 28) ( 83,414) ( 3,544)
Retirement benefit asset (Note 23) ( 116,811) ( 25,632)
Cash generated from operations 1,778,728 889,938
NOTES TO THE FINANCIAL STATEMENTS (CONT’D)
133ANNUAL REPORT & FINANCIAL STATEMENTS 2016

42 Commitments
Capital expenditure committed but not contracted for at financial reporting date is as follows:
The capital expenditure committed but not contracted relates to three major contracts for the construction of investment properties in Kenya, Uganda and Sudan. These projects are estimated to cost approximately Kes 7.4 billion. They are estimated to take 6 more months to complete.
43 Financial instruments by category
a) Financial assetsThe Group’s financial assets are summarised by measurement category in the table below.
2016 2015KES ’000 KES ’000
At amortised cost 28,312,821 20,450,063 At fair value 4,115,888 6,148,508
32,428,709 26,598,571
i) Financial assets at amortised cost
Government securities 11,269,605 7,220,556 Corporate bonds 1,746,685 586,012 Receivables arising out of direct insurance arrangements 1,873,639 2,364,365 Receivables arising out of reinsurance arrangements 1,314,921 970,510 Reinsurers’ share of insurance liabilities 3,737,781 2,977,367 Other receivables 1,150,331 480,827 Deposits with financial institutions 5,037,139 3,845,043 Cash and bank balances 1,845,946 1,750,124 Mortgage loans receivable 336,774 255,259
28,312,821 20,450,063
ii) Financial assets at fair value
Equity investments:At fair value through other comprehensive income 1,661,826 2,554,729 At fair value through profit or loss 1,671,630 2,003,448 Corporate bonds 132,013 1,269,808 Government securities 650,419 320,523
4,115,888 6,148,508
2016 2015KES ’000 KES ’000
Capital expenditure 861,750 1,633,351
NOTES TO THE FINANCIAL STATEMENTS (CONT’D)
134 UAP OLD MUTUAL GROUP

b) Financial liabilities Except for unit-linked investment contracts, which are measured at fair value, the Group’s financial liabilities are measured at amortised cost. The carrying value of the Group’s and the Company’s financial liabilities at the end of 2016 and 2015 is shown in note 4(b).
44 Related party transactions
The Group is controlled by UAP Holdings Company Ltd incorporated in Kenya being the ultimate parent of the Group. There are other companies that are related to UAP Holdings Limited through common shareholdings or common directorships. The following transactions were carried out with related parties:
43 Financial instruments by category (continued)
2016 2015KES ’000 KES ’000
i) Administration of staff pension scheme- GroupContributions paid 18,870 163,485Benefits paid (13,323 ) (76,310)
ii) Transactions with related parties - CompanyInterest paid to UAP Insurance Kenya 77,011 159,044Interest received from UAP Properties South Sudan 223,499 28,272Interest received from UAP Properties Uganda 89,565 60,888Investment management fees paid to UAP Investments Kenya 34,154 48,332
iii) Outstanding balances with related parties - GroupNedbank loan (Note 37) 3,153,118 -Old Mutual Holdings Kenya short term financing (Note 37) 3,043,710 2,760,520Mortgages loans receivable (Note 26) 336,774 255,259At end of year 6,533,602 3,015,779
Mortgages to staff are fully secured on the mortgage properties and are charged interest at 6% (2015: 6%).
NOTES TO THE FINANCIAL STATEMENTS (CONT’D)
135ANNUAL REPORT & FINANCIAL STATEMENTS 2016

2016 2015
KES ’000 KES ’000
iv) Outstanding balances with related parties - Company
Payable to related parties:UAP Insurance Kenya 893,775 891,746
UAP Insurance Uganda 45,437 48,096
At end of year 939,212 939,842
Receivable from related parties:UAP Insurance Kenya - -
UAP Life Assurance Kenya 37,184 240,410
UAP Life Assurance Uganda 116 114
UAP Insurance South Sudan 20,373 63,786
UAP Insurance Uganda - 13,569
UAP Financial Services Uganda - 1,326
UAP Properties Uganda 975,638 712,777
UAP Properties South Sudan 285,200 61,708
UAP Insurance Rwanda 5,899 5,484
UAP SPRL RDC - 82,952
UAP Investments Kenya 22,591 22,591
UAP Global Services Mauritius 1,183,882 1,015,700
UAP Africa Mauritius 12,676 10,771
UAP Properties Limited (Mauritius) 8,598 6,740
UAP Insurance Tanzania 865 834
UAP Investments (Mauritius) - 4,251
At end of year 2,553,022 2,243,013The amounts payable to related parties have no specific repayment date.
v) Loan to directorsAt start of year 25,681 37,697
Loan advanced during the year - -
Loans repayments received (1,886) (12,016)
At end of year 23,795 25,681
Loans to directors are fully secured and are charged interest at 6% (2015: 6%).
44 Related party transactions (continued)
NOTES TO THE FINANCIAL STATEMENTS (CONT’D)
136 UAP OLD MUTUAL GROUP

2016 2015
KES ’000 KES ’000
vi) Key management compensationa) GroupSalaries (Including executive directors salaries) 593,366 444,351
Retirement benefits costs 49,931 50,167
643,897 494,518
b) CompanySalaries (Including executive directors salaries) 94,988 116,182
Retirement benefits costs 6,561 7,594
101,549 123,776
vii) Directors’ emoluments
a) GroupExecutive salaries (included in key management compensation above) 316,627 135,892
Fees 71,285 73,327
Other remuneration 7,345 16,830
395,257 226,049
b) CompanyExecutive salaries (included in key management compensation above) - 48,215Fees 21,709 16,452
Other remuneration 6,338 14,186
28,047 78,853
44 Related party transactions (continued)
NOTES TO THE FINANCIAL STATEMENTS (CONT’D)
137ANNUAL REPORT & FINANCIAL STATEMENTS 2016
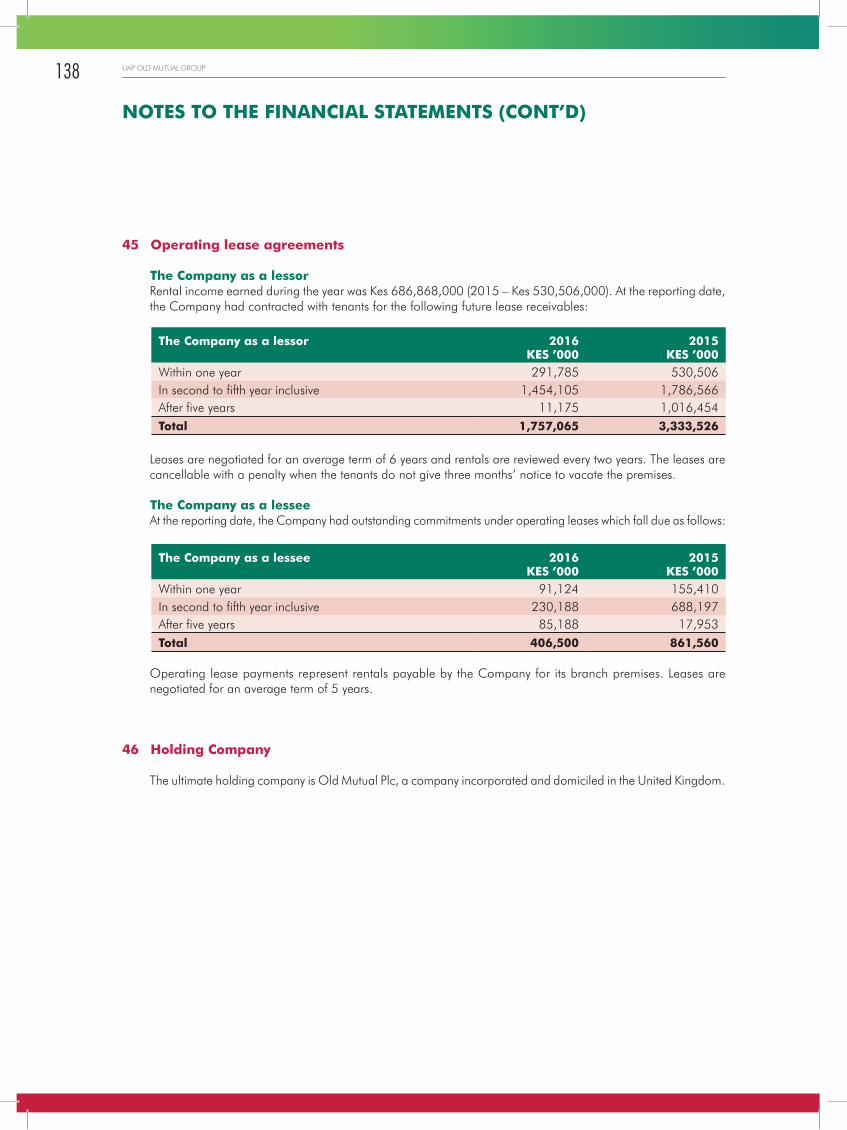
45 Operating lease agreements
The Company as a lessorRental income earned during the year was Kes 686,868,000 (2015 – Kes 530,506,000). At the reporting date, the Company had contracted with tenants for the following future lease receivables:
Leases are negotiated for an average term of 6 years and rentals are reviewed every two years. The leases are cancellable with a penalty when the tenants do not give three months’ notice to vacate the premises.
The Company as a lesseeAt the reporting date, the Company had outstanding commitments under operating leases which fall due as follows:
Operating lease payments represent rentals payable by the Company for its branch premises. Leases are negotiated for an average term of 5 years.
46 Holding Company
The ultimate holding company is Old Mutual Plc, a company incorporated and domiciled in the United Kingdom.
The Company as a lessor 2016 2015KES ’000 KES ’000
Within one year 291,785 530,506In second to fifth year inclusive 1,454,105 1,786,566After five years 11,175 1,016,454Total 1,757,065 3,333,526
The Company as a lessee 2016 2015KES ’000 KES ’000
Within one year 91,124 155,410In second to fifth year inclusive 230,188 688,197After five years 85,188 17,953Total 406,500 861,560
NOTES TO THE FINANCIAL STATEMENTS (CONT’D)
138 UAP OLD MUTUAL GROUP

NOTICE IS HEREBY GIVEN that the Ninth Annual General Meeting of the shareholders of UAP Holdings Limited will be held on Wednesday, 28th June 2017 at 11.00 a.m. at the UAP Old Mutual Tower, Upper Hill, Nairobi to transact the following business:
1. Reading of NoticeThe Secretary to read the notice convening the meeting, table the proxies and to confirm the presence of quorum.
2. Confirmation of MinutesConfirmation of the minutes of the Annual General Meeting held on 16th September 2016.
ORDINARY BUSINESS
3. Consideration of Reports To receive, consider and if thought fit, adopt the audited Financial Statements for the year ended 31st December 2016 and the Reports of the Chairman, Directors’ and Auditors’ thereon.
4. Declaration of DividendTo consider and if thought fit, adopt the recommendation to pay a final dividend of Kes. 1.70/= for each ordinary share of Kes. 5/= on the issued share capital of the company in respect of the year ended 31st December 2016.
5. Remuneration Report To approve the directors’ remuneration for the year ended 31st December 2016 as provided for in the FinancialStatements.
6. Election of Directors
a) To approve that the directors mentioned in 6 (b) and 6(c) be re-elected and appointed as directors of the Company and be put to this meeting as a single resolution.
b) In accordance with Article 101 of the Company’s Articles of Association to consider that:-
i) Dr. Peter Muthoka, retires by rotation at the dissolution of the meeting and being eligible, offers himself for re-election in accordance with Article 103 of the Company’s Articles of Association.
ii) Mr. David Marshall, retires by rotation at the dissolution of the meeting and being eligible, offers himself for re-election in accordance with Article 103 of the Company’s Articles of Association.
iii) Mr. Peter de Beyer, retires by rotation at the dissolution of the meeting and being eligible, offers himself for re-election in accordance with Article 103 of the Company’s Articles of Association.
iv) Mr. Paul Truyens, retires by rotation at the dissolution of the meeting and being eligible, offers himself for re-election in accordance with Article 103 of the Company’s Articles of Association.
v) Mr. Michael Harper, retires by rotation at the dissolution of the meeting and being eligible, offers himself for re-election in accordance with Article 103 of the Company’s Articles of Association.
c) In accordance with Article 99 of the Company’s Articles of to consider that Mr. Jonas Mushosho, appointed to fill a casual vacancy, retires by rotation at the dissolution of the meeting and being eligible, offers himself for re-election.
7. Appointment of External Auditor To note that the auditors Messrs KPMG East Africa Limited, being eligible and having expressed their willingness, will continue in office in accordance with Section 721(2) of the Companies Act, 2015 and to authorise the directors to fix their remuneration in accordance with Section 724(2) of the Companies Act, 2015.
NOTICE OF ANNUAL GENERAL MEETING
139ANNUAL REPORT & FINANCIAL STATEMENTS 2016

SPECIAL BUSINESS8. Approve the sale of UAP DRC Sarl
To approve the sale of UAPHL’s 99% shareholding in UAP RDC SARL made up of 9,900 ordinary shares to Associated Holdings Network Limited including ratification of the execution of the Sale Agreement and any relevant agreement pertaining to the sale of the DRC business, adoption and implementation of their terms and authorising the board to obtain all relevant regulatory approvals to implement the sale.
ANY OTHER BUSINESS9. To transact any other business which may be properly transacted at an annual general meeting and for which
a valid notice has been issued in accordance with the Articles of Association of the Company.
By order of the Board
Nkirote Mworia NjiruSecretary
7 April 2017
NOTE:
In accordance with Section 298(1) of the Companies Act, 2015 every member entitled to vote at the above meeting is entitled to appoint a proxy to attend and vote on his/her behalf. A proxy need not be a member of the Company.
To be valid, a form of proxy must be duly completed by the member and either returned to the Group Company Secretary, P.O. Box 43013 – 00100, Nairobi, email: [email protected] or the Shares Registrars, CDSC Limited, Nation Centre, 10th Floor, Kimathi Street, P.O. Box 3464-00100 Nairobi so as at to arrive no later than 48 hours before the meeting or any adjournment thereof.
NOTICE OF ANNUAL GENERAL MEETING (CONT’D)
140 UAP OLD MUTUAL GROUP

I/WE
being a member* / members* of UAP HOLDINGS LIMITED hereby appoint:
of P. O. Box
and failing him / her the Chairman of the meeting to be my / our proxy, to vote for me /us at the 9th Annual General Meeting of the Company to be held on Wednesday 28th June, 2017 at UAP Old Mutual Tower, Upperhill Nairobi at 11:00 a.m. or at any adjournment thereof. As witness my/ our hand/ hands this day of:
2017
Signed:
NOTE:
The Completed Proxy Form by member must be lodged at the office of the Group Company Secretary, 8th Floor, Bishops Garden Towers, Bishops Road, P.O. Box 43013-00100, Nairobi, email: [email protected] or the Shares Registrars, CDSC Limited, Nation Centre, 10th Floor, Kimathi Street, P.O. Box 3464-00100 Nairobi so as to reach the Company 48 hours before the Meeting.
FORM OF PROXY
141ANNUAL REPORT & FINANCIAL STATEMENTS 2016

A Member of the Group
HEAD OFFICEOff Ngong Road, Ngong LaneP.O. BOX : 60240-00200 NAIROBITEL: 020 3877290-3/ 73872183/ 43867503Fax : 3874857To Call Centre: 0711 074 074 or 0711 074 000Website: www.faulukenya.com
UAP OLD MUTUAL Located at: UAP Old Mutual Tower, Upper Hill RoadTel: +254 (020) 2829 000Mobile: +254 711 010 000/ 800/ 1or +254 732 101 000/ 800/ 1
AND
Bishops Garden Tower1st Ngong Avenue, Bishops Road P.O Box 43013-00100Nairobi, Kenya Mobile: +254 711 065 000Tel: +254 20 27 19 030
UAP OLD MUTUAL UGANDA LIMITEDUAP OLD MUTUALUAP Nakawa Business ParkPlot 3-5 New Portbell RoadP.O. Box 1610, Kampala - UgandaTel +256 414 332 700Fax: +256 414 256 388Email: [email protected]
UAP INSURANCE RWANDA LIMITEDUAP OLD MUTUALGrand Pension Plaza - 7th FloorAvenue de la PaixB.P 6644 Kigali, Rwanda,Tel: +250 25 2500905-7Fax: +250 25 2500908Email: [email protected]
UAP RDC, SARLUAP OLD MUTUALUAP RDC, Sarl - courtier d’Assurances/Insurance brokersBureau n° 3-0-B12, Kavali Center, n° 10/13Croisement des Av. Mutombo Katshi etEquateur Kinshasa/Gombe, RDCTel +243 975 33 88 33Email: [email protected]
UAP INSURANCE TANZANIA LIMITEDUAP OLD MUTUALBarclays House, 4th Floor, Ohio StreetP.O. Box 71009 Dar es Salaam, Tanzania.Tel: +255 22 213 7324 / 5Fax: +255 22 213 7308Email: [email protected]
UAP INSURANCE SOUTH SUDAN LIMITEDUAP OLD MUTUALUAP Equatoria TowerP.O Box 201 Juba, South SudanTel: +211 922 550 040 /+211 22 550 049Email: [email protected]
Design & Layout : PVG KENYA ([email protected])
142 UAP OLD MUTUAL GROUP

NOTES
143ANNUAL REPORT & FINANCIAL STATEMENTS 2016
