context sensitive solutions performance measures
TRANSCRIPT

Context Sensitive Solutions Performance Measures Literature Review Report NM05DSG-01 Prepared by: ATR Institute 801 University Boulevard SE, Suite 302 MSC 04 2760 Albuquerque, NM 87106-4342 June 2006 Prepared for: New Mexico Department of Transportation Research Bureau 7500B Pan American Freeway NE Albuquerque, NM 87109 In Cooperation with: The US Department of Transportation Federal Highway Administration

1. Report No.
NM05DSG-01 2. Government Accession No.
3. Recipient's Catalog No.
5. Report Date
June 2006 4. Title and Subtitle
Context Sensitive Solutions Performance Measures Literature Review
6. Performing Organization Code
7. Author(s)
Alliance for Transportation Research Institute University of New Mexico 801 University Boulevard SE, Suite 302 Albuquerque, NM 87106
8. Performing Organization Report No.
10. Work Unit No. (TRAIS)
9. Performing Organization Name and Address
Alliance for Transportation Research Institute University of New Mexico 801 University Boulevard SE, Suite 302 Albuquerque, NM 87106
11. Contract or Grant No.
CO 4616
13. Type of Report and Period Covered
Final Report 12. Sponsoring Agency Name and Address
New Mexico Department of Transportation Research Bureau 7500-B Pan American Freeway P. O. Box 94690 Albuquerque, NM 87109-4690
14. Sponsoring Agency Code
15. Supplementary Notes
Eric Worrell, USDOT FHWA, New Mexico Division; Joe Sanchez, New Mexico Department of Transportation, Context Sensitive Solutions; Bill Hutchinson, New Mexico Department of Transportation, Context Sensitive Solutions; Kathy Kretz, New Mexico Department of Transportation, Environment Design; Bruce Bender, New Mexico Department of Transportation, Planning Division; Bob Wildoe, New Department of Transportation, Planning Division; Rais Rizvi, New Mexico Department of Transportation, Research Bureau; Phil Horton, New Mexico Department of Transportation, Research Bureau
16. Abstract
At the November 2005 Context Sensitive Solutions Research Advisory Committee meeting, the recommendation was made to review the New Mexico Department of Transportation context sensitive solutions performance measures. Current literature indicates that state DOTs are placing more focus on utilizing system-wide, multimodal performance measures in addition to project level indicators. Examining other state DOTs’ performance measurement frameworks and procedures provides a perspective for context sensitive solutions performance measures.
17. Key Words
Context sensitive solutions, performance measures, context sensitive design,
18. Distribution Statement
19. Security Classif. (of this report)
Unclassified 20. Security Classif. (of this page)
Unclassified 21. No. of Pages
72 22. Price
Form DOT F 1700.7 (8-72)

CONTEXT SENSITIVE SOLUTIONS PERROMANCE
MEASURES LITERATURE REVIEW
by
Kelly R. Stillman Graduate Research Assistant New Mexico State University
Craig M. Newtson Associate Professor
New Mexico State University
Report NM05DSG-01
A Report on Research Sponsored by
New Mexico Department of Transportation Research Bureau
in Cooperation with The U.S. Department of Transportation
Federal Highway Administration
June 2006
NMDOT Research Bureau 7500B Pan American Freeway NE
PO Box 94690 Albuquerque, NM 87199-4690
(505) 841-9145
© New Mexico Department of Transportation

PREFACE
The research reported is a review of New Mexico Department of Transportation’s (NMDOT) performance measures by examining current context sensitive solutions literature and practices of other state Departments of Transportation.
NOTICE
DISCLAIMER
The United States Government and the State of New Mexico do not endorse products or manufacturers. Trade or manufacturers’ names appear herein solely because they are considered essential to the object of this report. This information is available in alternative accessible formats. To obtain an alternative format, contact the NMDOT Research Bureau, 7500B Pan American Freeway, Albuquerque, NM 87109 (P.O. Box 94690, Albuquerque, NM 87199-4690) or by telephone (505) 841-9145.
This report presents the results of research conducted by the author(s) and does not necessarily reflect the views of the New Mexico Department of Transportation. This report does not constitute a standard or specification.
i

ABSTRACT
At the November 2005 Context Sensitive Solutions Research Advisory Committee meeting, the
recommendation was made to review the New Mexico Department of Transportation context
sensitive solutions performance measures. Current literature indicates that state DOTs are
placing more focus on utilizing system-wide, multimodal performance measures in addition to
project level indicators. Examining other state DOTs’ performance measurement frameworks
and procedures provide a perspective for context sensitive solutions performance measure
practices.
ii

ACKNOWLEDGEMENTS
ATR Institute would like to thank the following persons for their support of this project:
Bruce Bender, New Mexico Department of Transportation, Planning Division
Phil Horton, New Mexico Department of Transportation, Research Bureau
Bill Hutchinson, New Mexico Department of Transportation, Context Sensitive Solutions
Kathy Kretz, New Mexico Department of Transportation, Environment Design
Rais Rizvi, New Mexico Department of Transportation, Research Bureau
Joe Sanchez, New Mexico Department of Transportation, Context Sensitive Solutions
Bob Wildoe, New Department of Transportation, Planning Division
Eric Worrell, US Department of Transportation, Federal Highway Administration, New
Mexico Division
iii

TABLE OF CONTENTS
BACKGROUND………………………………………………………………………… 1 APPROACH TO REVIEW……………………………………………………………… 2 OVERVIEW OF PERFORMANCE MEASURES …………………………………….. 5 CONTEXT SENSITIVE SOLUTIONS AND PERFORMANCE MEASURES ………. 8 RECOMMENDATIONS ……………………………………………………….……..... 16
iv

LIST OF FIGURES, TABLES AND APPENDICES
FIGURES Figure 1; Context Sensitive Solutions Measurement Framework ………………….. 9 TABLES Table 1: State DOTs Examined in Performance Measures Critique ……………….. 4 Table 2: Context Sensitive Solutions Performance Measures ……………………… 10 APPENDICES 16 Appendix A: Summary of Literature Survey Sources for Selected Focus Areas ….. 19 Appendix B: State Departments of Transportation, Mission, Vision, Values, Principles ……………………………………………………………..
21
Appendix C: State Departments of Transportation Performance Measures ...…….. 26 Appendix D: State DOT Examples: Long Range Planning and Performance Measures ……………………………………………………………..
43
Appendix E: State DOT Performance Measures: User Friendly and Easily Accessible …………………………………… ………………………
49
Appendix F: State DOT Examples: Brochures …………………………………… 66
v

BACKGROUND
The New Mexico Department of Transportation (NMDOT) Research Bureau entered into an
Action Plan (NM05DSG-01) with the ATR Institute (ATRI) to develop a context sensitive
solutions (CSS) guide for NMDOT transportation decision-making processes. These CSS
procedures and guidelines are intended to assist NMDOT as it incorporates CSS into current and
future transportation projects commencing with the planning process. Secretary Faught signed a
CSS Directive in 2006 mandating that all NMDOT transportation projects include CSS
processes. The Research Advisory Committee (RAC) in its deliberations recommended that a
review of context sensitive solution performance measures be added to the Action Plan products.
1

APPROACH TO THE REVIEW
Information from previous Action Plan products—the Annotated Bibliography, Literature
Survey, and the Guide to CSS—were reviewed as the foundation for additional research into state
Departments of Transportation (DOT) practices in CSS long-range planning, performance
measures, and attainment reporting. State DOT, FHWA, Transportation Research Board (TRB)
Web sites and reports were used extensively. In all, information from 33 state DOTs were used
of which 46 resources were in planning and 40 in performance measures. A breakdown of the 33
state DOTs used in this review can be found in Appendix A.
Current practice and literature shows that an increasing number of state DOTs are
developing a systems approach to performance measures. Most often, a DOT’s mission, vision,
values, and/or guiding principles is the foundation for its long-range plan. The DOT’s long-
range plan goals then cascade into the DOT’s strategic plan or business plans. At each level,
there is uniformity as well as performance measures.
Some state DOTs have attainment reports which are used to inform decision-makers, the
public, stakeholders, and staff of progress being made in achieving goals. Some innovative
approaches to performance reporting include: dashboards, watch lists, Web sites, and report
cards. Attainment reporting in state DOTs varied from quarterly, bi-annually, to annually. Many
state DOTs still use a silo approach to transportation which focuses on individual modes while
others are working towards performance measures for multimodal transportation that views
transportation in a systematic manner.
State DOTs that were used in this review were randomly selected primarily related to the
ability to locate long-range plans and performance measures on state DOT Web sites and/or have
been identified in the literature as exhibiting best practices in specified areas. Four of the states
2

(Florida, Maryland, Minnesota, and Washington State) were part of the initial FHWA CSS
demonstration states. Each of those DOTs have integrated CSS principles into their planning
and project development activities.
More detailed information on performance measures was gathered from fourteen state
DOTs (Table 1). Appendix C contains individual state DOTs Mission, Vision, Values, and/or
Management Guiding Principles/Goals. This Appendix provides philosophical underpinnings
and frameworks for individual state DOT’s long-range plans and strategic directions. Selected
state DOT performance measures are listed in Appendix D. Most DOTs that were studied do not
have performance measures integrated into its long-range plan. Consequently, other source
documents such as business plans and strategic plans were used to identify performance
measures. Very few states have performance measures as well as performance targets integrated
into its long range plan (Florida, Pennsylvania, Minnesota, and Maryland).
3

TABLE 1 State DOTs Examined in Performance Measures Critique
State DOT Mis
sion
Vis
ion
Val
ues
Goa
ls*
Mea
sure
s**
Alaska
Arizona
California
Florida
Maryland
Minnesota
Nebraska
New Mexico
New York
Oregon
Pennsylvania
Utah
Virginia Washington
*Management/Guiding Principles/Goals **Performance Measures
4

OVERVIEW OF PERFORMANCE MEASURES
Performance measures enable a state DOT to track progress towards its targets and goals as well
as to plan, program investments, and manage operations. Reasons for adopting performance
measures include accountability, efficiency of project delivery, communication of progress
toward specifically defined goals and objectives, and documentation of accomplishments. The
FHWA’s Office of Operations defines performance measurements and their elements as follows:
Definition of Performance Measure
Defined Goal or Department Objective
Evidence of Actual Facts:
Outputs: Efficiency Measures and Information (Goods and Services)
Quality – How Well Goods and Services Delivered
Outcomes: Results of Department Activity Compared to Intended Purpose
Program Operations Compared to Program Objectives
Measurement of Customer Perceptions
Elements/Criteria for Setting up Performance Measure
Defined Goal or Department Objective
Definition of Key Terms
Data Collection Process
Population Measured/Characteristics of the Data
Description of the Metric
Charts and Graphs
Data Source
Length of Time
5

Frequency of Reports
Type of Comparison
Calculation Methods
Cost Effectiveness of Data Collection
Reports
With these elements, a DOT’s performance measurement system can be acceptable and
meaningful to the end user because it:
Supports the organization’s long-range plan, strategic priorities, and values as well as the
relationship the DOT has with its citizens, decision makers, policy makers, and
transportation professionals;
Comprises a balanced set of a limited vital few measures and should gauge progress towards
achieving specific goals and objectives and on improvement measured against
established benchmarks;
Produces timely and useful reports at a reasonable cost; and
Displays and makes readily available information that is shared, understood, and used by an
organization and matches reports to the needs of intended users.
DOT performance measures can be generally categorized as infrastructure conditions,
deficiency measures, mobility measures, safety measures, and customer service measures. Some
performance measures are modal-specific which challenges DOTs to develop and apply the
performance of all modes as part of an integrated system. Other trends include using
performance measures in its asset management process (Utah) or sustainability goals (California
and Oregon).
6

A good source of information is the FHWA’s Performance Measurement Fundamentals Web site
(ops.fhwa.dot.gov/perf_measurement/fundamentals.htm). TRB Performance Measurement
Exchange Web site which is sponsored by FHWA is also a helpful resource
(knowledge.fhwa.dot.gov/cops/pm.nsf/home).
7

CONTEXT SENSITIVE SOLUTIONS AND PERFORMANCE MEASURES
Currently, the NMDOT is implementing the CSS Directive into its business practices. On a
national level, the CSS “Qualities that Characterize Excellence in Transportation Design” were
developed at the “Thinking Beyond the Pavement Workshop” in 1998. These CSS goals have
remained largely unchanged. These CSS considerations should be incorporated into a
performance measurement system:
The project is a safe facility for both the user and the community.
The project is in harmony with the community, and it preserves environmental, scenic,
aesthetic, historic, and natural resource values of the area, i.e., exhibits context
sensitive design.
The project exceeds the expectations of both designers and stakeholders and achieves a level
of excellence in people’s minds.
The project involves efficient and effective use of the resources (time, budget, community) of
all involved parties.
The project is designed and built with minimal disruption to the community.
The project is seen as having added lasting value to the community.
As state DOTs have implemented and integrated CSS goals in their operations, the
concept has expanded to include planning, construction, and maintenance. A few state DOTs
have adopted CSS evaluation tools (New York and Connecticut) but not performance measures
for projects. State DOTs that have included CSS in its long range plans include Michigan,
Oregon, Pennsylvania, and Utah.
The evaluation of CSS projects requires a new approach in developing performance
measures. Performance Measures for Context Sensitive Solutions – A Guidebook for State DOTs
8

At the project level, some measures may apply across many projects, while others may be scaled
to be used on an individual project. On the other hand, organization-wide measures provide a
complement to tailored project measures. They offer insights on organization-wide trends that
cannot be captured through micro-level measures on individual projects. Another dynamic in
CSS measures is balancing between process and outcome measures. Generally, organization
measures are broader in scope and are fewer in number than project-level measures. Table 2
lists suggestions for CSS performance measures.
9
(NCHRP Document 69 (Project 20-24(30) provides a measurement framework for CSS that are
indicators of project and organization-wide performance. The framework for CSS performance
measures includes processes and outcomes at both the project level (micro) and organization
wide (macro). This basic framework and its elements are illustrated in Figure 1:
CSS Measurement Framework
Use of Multidisciplinary Teams
Community Engagement
Agreement on Project Problems
Alternative Analysis
Construction
Training
Manuals
Policies
Motivation
Achievemor
Stake
Qualit
ent of Project Vision Project Goals
holder Satisfaction
y Assurance Review
Timeframe and Budget
Stakeholder Satisfaction
PROCESS
OUTCOMES
PROJECT - LEVEL ORGANIZATION - WIDE
FIGURE 1 CSS Measurement Framework. Source: Performance Measures for Context Sensitive Solutions – A Guidebook for State DOTs (NCHRP Document 69 (Project 20-24(30)

10
TABLE 2: CSS Performance Measures *
Suggestions for Measuring
Process-Related Outcome-Related Focus Areas Framework Focus Area
Project Specific Outcomes Process Organization
Right people on team?
Team function Effectively?
Use of multi-Disciplinary Teams
Focus on CSS principles from start?
Public involvement plan created?
Techniques chosen strategically?
Consensus on key project elements?
Were external champions created?
Public input at key decision points?
Adequacy of DOT expertise and resources?
Public Engagement
Quality of public involvement strategy?
Support for statement of problems, opportunities and needs
Project Problems, Opportunities and Needs Linkage of problems, opportunities and
needs to alternatives evaluation
Consistency with local plans?
Consensus on project vision and goals?
Achievement of project vision or goals?
Project Vision or Goals
Supportiveness of community needs?
Adequacy of range of alternatives developed?
Existence of criteria for evaluation of alternatives?
Design considerations: design speed
Design considerations: level of service
Design considerations: safety
Need for redesign
Process-Related
Alternatives Analysis
Multimodal considerations?

11
Suggestions for Measuring
Process-Related Outcome-Related Focus Areas Framework Focus Area
Project Specific Outcomes Process Organization
CSS related construction issues considered during project development
Construction and Maintenance
CSS related maintenance issues considered during project development
Match problems, opportunities, and needs with final project?
Tracking and adherence to project commitments?
Were project vision/goals met?
Project supports community values?
Environmental resources preserved or enhance?
Achievement of project vision/goals
Did project leverage other resources?
Tailored surveys of key stakeholders
Achievement of consensus during project?
Stakeholder satisfaction
Impacts of construction?
Evaluation charette
Peer review of project
Outcome-Related Focus Areas
Quality assurance review
Post project review
Quantity of training?
Focus of training?
CSS Training
Quality of training?
CSS changes in manuals?
Process Related Focus Areas
Manuals
Effectiveness of manual changes?

Suggestions for Measuring
Process-Related Outcome-Related Focus Areas Framework Focus Area
Project Specific Outcomes Process Organization
CSS changes in policies
Policies
Effectiveness of policy changes?
CSS awards? Staff motivation strategies CSS in staff
performance reviews
Timeframe Timeframe and budget
Budget
Tailored surveys of key stakeholders
Achievement of consensus during project?
12
Outcome-Related Focus Areas
Stakeholder satisfaction
Impacts of construction?
Source: Performance Measures for Context Sensitive Solutions - A Guidebook for State DOTs (NCHRP 69 (Project 20-24(30))

REVIEW OF NMDOT PERFORMANCE REPORTS
The NMDOT use of performance measures has evolved since it became a multimodal
organization in 2003 and the development of the Good to Great Report which replaced the
COMPASS. This analysis focuses on the NMDOT long-range plan, CSS, and performance
measures. In preparing this review, the following source documents were used:
NMDOT Guiding Principles and Commitment to Energy and the Environment;
New Mexico 2025 Statewide Multimodal Transportation Plan;
Legislative Finance Committee Report on New Mexico Department of Transportation Road
Planning and Financing Report (January 17, 2005); and
New Mexico Department of Finance Administration (DFA) FY 2005 End-of-Year
Performance Report.
In an organization-wide approach to performance measures, there should be linkages
between the NMDOT multimodal long-range plan and its strategic/business plan as well as
performance measures and targets. The 2025 Multimodal Plan “was developed as a tool for
establishing transportation objectives and implementation strategies to achieve the goals
associated with the NMDOT’s Guiding Principles.” These overarching Guiding Principles for
NMDOT business practices include:
Multimodal Transportation
Partnership with Tribal Governments
Environmental Responsibility
Partnership with Local Governments
Safety and Security
Efficient Use of Public Resources
Economic Vitality
13

For each principle, the 2025 Multimodal Plan includes long range objectives and
implementation strategies. While many objectives and strategies lend themselves to CSS-related
performance measures, the 2025 Multimodal Plan does not include any quantifiable performance
measures or targets. The linkages between Guiding Principles and 2025 Multimodal Plan
program areas should be clearly delineated. In the 2025 Multimodal Plan, there are seven
guiding principles plus five other program areas (aviation, non-motorized transportation,
commercial trucks, personal vehicles, rail freight, and rail public transit).
The 2025 Multimodal Plan contains three references to CSS but do not seem to lend
themselves to performance measures. The references are:
Partnership with Local Governments Implementation Strategy: Implement Context
Sensitive Design that rely on local partners for design guidance.
Environmental Responsibility Implementation Strategies: Update the Corridor Location
Procedures Manual to include environmental concerns at all planning stages, particularly
with regard to context sensitive considerations.
Pedestrian Transportation Implementation Strategies: Ensure that context sensitive
design considers equestrian needs when appropriate.
Another source of information for this review was the Legislative Finance Committee (LFC)
Report on New Mexico Department of Transportation Road Planning and Financing Report
(January 17, 2005). This report was focused on NMDOT’s state transportation improvement
plan (STIP), Governor Richardson Investment Partnership (GRIP), and Design-Build activities.
However, many of the Report recommendations are relevant to the adoption of written standards
and procedures for the documentation and analysis of performance data. A review of NMDOT
14

documents does not appear to address these recommendations which may be impacting
NMDOT’s ability to establish an effective and meaningful performance measurement system.
The New Mexico Department of Finance Administration’s FY 2005 End-of-Year
Performance Report for its Performance Based Budgeting System for the NMDOT was also
studied. Each performance measure included a FY 2004 target level as well as an end result for
FY 2004. This DFA reporting covers five program areas which are: Traffic Safety Program
(four performance measures); Construction Program (six measures): Maintenance Program (six
measures); Program Support (five measures); Aviation (three measures); and Public
Transportation (four measures). None of these performance measures relate to CSS.
A search for “performance measures” was conducted on the NMDOT Web site and
“Performance-Based Budgeting” in the Quality Management Web site was the result. Currently
the Quality Management Office oversees reporting and updating performance measures.
However, the information on this Web site mainly related to internal procurement issues and not
NMDOT transportation programs.
15

RECOMMENDATIONS
There are no CSS performance measures in the 2025 Multimodal Plan. Consistent and
uniform CSS performance measures that are also in accordance with LFC recommendations
need to be developed.
Need uniformity consisting of data analysis between the 2025 Multimodal Plan and reports
to the DFA and LFC.
Establish CSS benchmarks, standards, and/or targets (see Appendix D for state DOT
examples).
A logical progression and a hierarchy of performance measures should be evident and be
systematically integrated into NMDOT’s long-range plans, strategic priorities, and
attainment reports. Selected measures should be identified which support the fundamental
roles of the NMDOT. Good examples are Arizona DOT, Minnesota DOT, and Pennsylvania
DOT.
Integrate principles in the NMDOT CSS Directive and performance measures in the 2025
Multimodal Plan to promote NMDOT’s new vision of conducting the transportation planning
and project delivery processes.
Involve NMDOT customers and stakeholders in the development of performance measures.
NMDOT should conduct CSS training to help integrate and implement the NMDOT
CSS Directive in its operations.
CSS marketing should be done to communicate information to the general public. Marketing
would include information about NMDOT’s new way of doing business through CSS,
summary information about the NMDOT planning processes, and performance reporting.
16

Present information in an easily understandable, clear format which can be accessible on the
NMDOT Web site. Dashboards should be considered as a method for graphic presentation
of performance measures and data mining. Brief performance “report cards” could provide
easily-accessible, selective and most important measurements and information for the public
and other stakeholders. Washington State DOT’s Charting the Gray Notebook Way,
presented at the 2004 TRB Committee on Performance Measurement Conference, is an
excellent resource for effective data and graphic presentations (www.trb-
performancemeasurement.org/Charting_the_GNB_Way.PDF). See Appendix E for
examples of performance measurement presentations from other DOTs.
There is no summary document or brochure on the CSS, long-range transportation plans, or
strategic directions. This would provide a framework for NMDOT performance measures as
the audience could more readily understand the context of the information. Good state DOT
brochure examples are found in Appendix F.
Performance measures should be considered for congestion management, environmental
programs, rail crossing safety, freight and truck, progress in implementing GRIP, and
multimodal activities including non-motorists and commuter rail.
17

A P P E N D I C E S
18

A P P E N D I X A
S U M M A R Y O F L I T E R A T U R E S U R V E Y S O U R C E S F O R S E L E C T E D F O C U S A R E A S
19

Appendix A Summary of Literature Survey Sources for Selected Focus Award
Organization Performance
Measures Planning Alaska DOT 1
Arizona DOT 4
California DOT 4 1
Colorado DOT 1
Connecticut DOT 1
Delaware DOT
Florida DOT 2 1
Idaho DOT 1
Illinois DOT 1
Kansas DOT 1
Kentucky Transportation Cabinet 1
Louisiana DOT 1
Maine DOT
Maryland State Highway Administration 2 2
Michigan DOT 2 1
Minnesota DOT
Missouri DOT 2
Montana DOT 1
Nebraska Dept of Roads 1
Nevada DOT 1
New Hampshire DOT 2
New Jersey DOT 1
New Mexico DOT 2 2
New York State DOT 2
North Carolina DOT 2 3
Ohio DOT 1
Oregon DOT 1 3
Pennsylvania DOT 3
Tennessee DOT 3
Utah DOT 2
Virginia DOT 3 5
Washington State DOT 7 1
Wisconsin DOT 1
AASHTO 0 2
FHWA/Public Roads 8 4
Transportation Research Board/TR News 12 1
Other Sources 30 7
Total 70 53
20

21
A P P E N D I X B
S T A T E D E P A R T M E N T S O F T R A N S P O R T A T I O N M I S S I O N , V I S I O N ,
V A L U E S , P R I N C I P L E S
A L A S K A D O T A R I Z O N A D O T
C A L I F O R N I A D O T F L O R I D A D O T
M A R Y L A N D S T A T E H I G H W A Y A D M I N I S T R A T I O N M I N N E S O T A D O T
N E B R A S K A D E P A R T M E N T O F R O A D S N E W M E X I C O D O T
N E W Y O R K S T A T E D O T N O R T H C A R O L I N A D O T
O R E G O N D O T P E N N S Y L V A N I A D O T
T E N N E S S E E D O T U T A H D O T
V I R G I N I A D O T W A S H I N G T O N S T A T E D O T
22
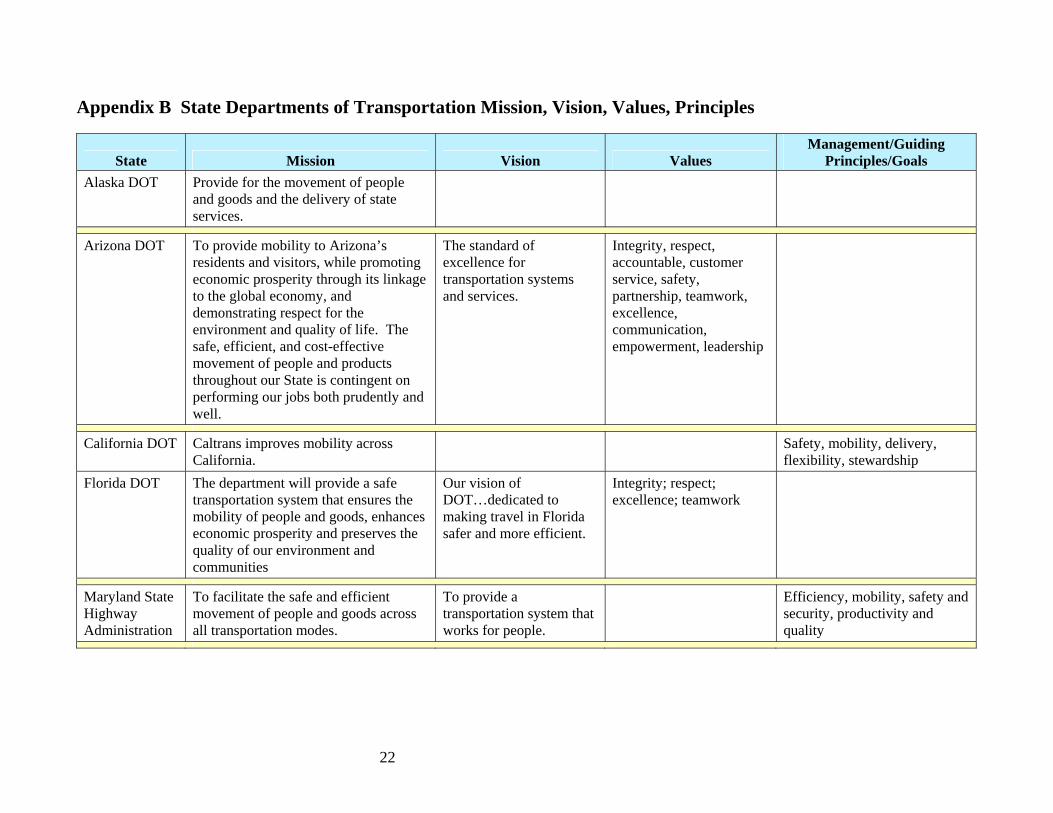
Appendix B State Departments of Transportation Mission, Vision, Values, Principles
State Mission Vision Values Management/Guiding
Principles/Goals Alaska DOT Provide for the movement of people
and goods and the delivery of state services.
Arizona DOT To provide mobility to Arizona’s residents and visitors, while promoting economic prosperity through its linkage to the global economy, and demonstrating respect for the environment and quality of life. The safe, efficient, and cost-effective movement of people and products throughout our State is contingent on performing our jobs both prudently and well.
The standard of excellence for transportation systems and services.
Integrity, respect, accountable, customer service, safety, partnership, teamwork, excellence, communication, empowerment, leadership
California DOT Caltrans improves mobility across California.
Safety, mobility, delivery, flexibility, stewardship
Florida DOT The department will provide a safe transportation system that ensures the mobility of people and goods, enhances economic prosperity and preserves the quality of our environment and communities
Our vision of DOT…dedicated to making travel in Florida safer and more efficient.
Integrity; respect; excellence; teamwork
Maryland State Highway Administration
To facilitate the safe and efficient movement of people and goods across all transportation modes.
To provide a transportation system that works for people.
Efficiency, mobility, safety and security, productivity and quality

23
State Mission Vision Values Management/Guiding
Principles/Goals Minnesota DOT
Improve access to markets, jobs, goods and services and improve mobility by focusing on priority transportation improvements and investments that help Minnesotans travel safer, smarter and more efficiently.
MNDOT's vision affirms what citizens want for Minnesota’s transportation: a coordinated transportation network that meets the needs of Minnesota’s citizens and businesses for safe, timely and predictable travel
Commitment to mission, focus on customers, simplify government, manage for results, improvement by innovation
Nebraska Department of Roads
To provide and maintain, in cooperation with public and private organizations, a safe, efficient, affordable and coordinated statewide transportation system for the movement of people and goods.
Building a better system for Nebraska future.
New Mexico DOT
The primary responsibility of the agency is to plan, build, and maintain a quality state-wide transportation network which will serve the social and economic interests of our citizens in a productive, cost-effective innovative manner.
Multimodal transportation, partnership with tribal governments, environmental responsibility, partnership with local governments, safety and security, efficient use of public resources, economic vitality
New York State DOT
It is the mission of the NYSDOT to ensure our customers—those who live, work and travel in New York State—have a safe, efficient, balanced, and environmental sound transportation system.
Integrity; customer service; partnership; teamwork; people; excellence
Serve customers and earn their trust; Chain of Value; clarity of expectations and feedback make the chain strong and effective; organization's chain of command supplies leadership and guidance

24
State Mission Vision Values Management/Guiding
Principles/Goals
North Carolina DOT
Provide and support an integrated transportation system and related services that enhance the state’s well-being
Balance, choices, customer focus, effective decision making, integrity, open communication, partnership, performance excellence, safety, stewardship
Oregon DOT To provide a safe, efficient transportation system that supports economic opportunity and livable communities for Oregonians.
Safety, customer focus, efficiency, accountability, problem solving, accountability, positive workplace, environment
Provide outstanding customer service; use innovative program design and technologies; improve the return on investment; attract, retain and develop an outstanding ODT workforce; Engage the public, other state agencies, local governments, business and community leaders in solving transportation problems and planning; increase intermodal linkages; communicate, educate and inform the public.
Pennsylvania DOT
Through the active involvement of customers, employees and partners; PennDOT provides services and a safe intermodal transportation system that attracts businesses and residents and stimulate Pennsylvania’s economy.
Customer driven, intermodal transportation system, and services that enhance the quality of life in Pennsylvania.
Customers, integrity, people, performance relationships
System preservation, quality of life, management and productivity, mobility, safety

State Mission Vision Values Management/Guiding
Principles/Goals Tennessee DOT
The mission of the Tennessee Department of Transportation is to plan, implement, maintain, and manage an integrated transportation system for the movement of people and products, with emphasis on quality, safety, efficiency and the environment.
Communication, accountability, consistency, integrity
Develop and implement a transportation system vision; increase stakeholder involvement and communication; address transportation system safety; protect and preserve the environment; manage the department through a clear strategic plan; cultivate partnerships.
Utah DOT Quality transportation today, better transportation tomorrow, we work to connect communities.
- Take care of what we have - Make it work better - Improve safety - Increase capacity
,
Virginia DOT VDOT will plan, develop, deliver, and maintain, on time and on budget, the best possible transportation system for the traveling public.
Safe; seamless; secure Safety and security; truth, trust and teamwork; environmental excellence; action and accountability; results and respect
Washington State DOT
Our mission is to keep people and business moving by operating and improving the state’s transportation systems vital to our taxpayers and communities.
Delivery, accountability, business practices, environmental responsibility, safety, excellence and integrity, communications
Leadership, delivery and accountability, business practices, safety, environmental responsibility, excellence and integrity, communications
25

26
A P P E N D I X C S T A T E D E P A R T M E N T S O F
T R A N S P O R T A T I O N P E R F O R M A N C E M E A S U R E S
A L A S K A D O T A R I Z O N A D O T
C A L I F O R N I A D O T F L O R I D A D O T
M A R Y L A N D S T A T E H I G H W A Y A D M I N I S T R A T I O N M I N N E S O T A D O T
N E B R A S K A D E P A R T M E N T O F R O A D S N E V A D A D O T
N E W M E X I C O D O T N E W Y O R K S T A T E D O T
O R E G O N D O T P E N N S Y L V A N I A D O T
U T A H D O T V I R G I N I A D O T
W A S H I N G T O N S T A T E D O T

27
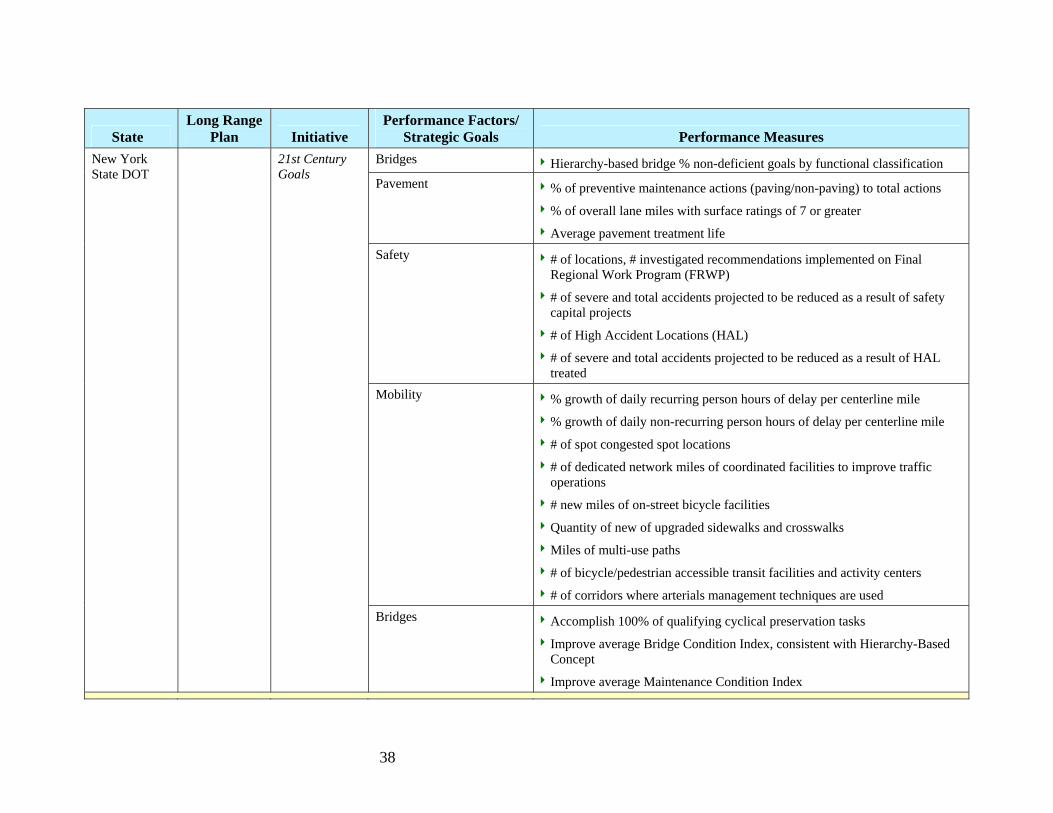
Appendix C State Departments of Transportation Performance Measures
State Long Range
Plan Initiative Performance Factors/
Strategic Goals Performance Measures Reduce injuries, fatalities and property damage: build
Road related fatalities on state roads per 100 million vehicle miles (MVM) traveled
% of NHS routes meeting current department standards
# of bridges that are considered deficient by FHWA standards
dministrative and engineering cost compared to total project cost
% change in the LOS at signalized intersections
% of highway and aviation construction funding advertised by a given date
% of aCarry out safe DOT orking one
.
operations % change in annual injury rate per 100 department employees wyear.
% change in employees successfully completing required safety trainingImproved mobility of people and goods
of customers Change in customer satisfaction based on survey
Alaska DOT Missions and Measures
Provide the assets and facilities to enable delivery of state services
Change in satisfaction based on survey of government sector customers
Dollar value of differed maintenance needed.

28
State Long Range
Plan Initiative Performance Factors/
Strategic Goals Performance Measures Mobility and economic competitiveness
% of Person-miles Traveled (PMT) by LOS
Average delay per trip Connectivity rridors Ability to pass in major 2-lane co
Intercity travel time connectivity Preservation
ent condition
ment condition % state highway lane miles by pave
% VAT on state highways by pavem
% Deficient bridges on State routes
Vehicle trips by bridge condition Reliability Incident-related non-recurring delay per VMT Safety Reduction in fatalities and injuries by 100 million VMT Accessibility # of Park-and-Ride spaces
Added Transit or School Bus Turnouts
ore bike suitable % of state routes or state route miles that are m
Arizona DOT MoveAZ
Resource conservation Reduction in mobile source emissions (tons)
% of air quality improvement projects
Added sound walls
Project consistency with local plans
# of gallons of fuel consumed by ADOT fleet

29
State Long Range
Plan Initiative Performance Factors/
Strategic Goals Performance Measures Enhance public safety and security
Accident rates
Crime Rates
Security levels Preserve the transportation system
Rate
dition Asset Con
Fleet Down-time
Fleet Age
Cost to Maintain Improve mobility and
odes (flexibility)
accessibility Travel time
Travel Delay
Access to Desired Locations
Access to MSupport the economy Final demand (value of transportation to economy)
Benefit-cost ratio Enhance the environment pollutant thresholds Days exceeding
Emissions
Noise levels
Impacts/improvements to species, habitats and wetlands
California DOT
California Transportation Plan
Reflect community values Commute time
Walk time to transit
Safety by mode
Neighborhood cohesion

30
State Long Range
Plan Initiative Performance Factors/
Strategic Goals Performance Measures System Preservation Through 2011, ensure that 80 percent of pavement on the State Highway
System meets Department standards.
Through 2011, ensure that 90 percent of FDOT-maintained bridges meet Department standards while keeping all FDOT-maintained bridges othe public safe.
pen to
d Through 2011, achieve 100 percent of the acceptable maintenance standaron the State Highway System.
System Efficiency n
ety and traffic flow by reducing the number of per
iles traveled.
By 2011, improve system efficiency by deploying Intelligent TransportatioSystem Technology on critical state corridors.
By 2011, improve safcommercial vehicle crashes on the State Highway System to or below 7.7 100 million vehicle m
Mobility/ Competit
Economic iveness
change in person hours of
ity
wice the average rate of
Through 2007, at a minimum, maintain the rate ofdelay on the Florida Intrastate Highway System (FIHS).
Through 2011, commit approximately 50 percent of the highway capacimprovement program for capacity improvements on the FIHS.
ership at tThrough 2011, increase transit ridpopulation growth.
Florida DOT 2020 Florida Transportation Plan
Safety
tate Highway System to or below miles traveled.
y rate to or below 0.19 fatalities per
rate to or below 2.35 fatalities per
By 2006, reduce the highway fatality rate on all public roads to or below 1.75 fatalities per 100 million vehicle miles traveled.
By 2006, reduce the fatality rate on the S1.54 fatalities per 100 million vehicle
By 2011, reduce the bicycle fatalit100,000 population.
By 2011, reduce the pedestrian fatality 100,000 population.

31
State Long Range
Plan Initiative Performance Factors/
Strategic Goals Performance Measures Mob % of vehicle trips on to
volumes below congested levels
ington regions
ility ll facilities using E-Zpass
ovided Annual vehicle revenue miles of MTA service pr
% of lane miles with average annual
n Baltimore/WashPeak period congestion on freeways iProductivity Transportation related emissions by Region
Customer satisfaction with MTS
MTA operating cost per passenger
mile
very 3-4
MTA operating cost per passenger
% of respondents rating their overall SHA experience (survey eyears)
Maintenance expenditures per lane mile Safety
on SHA facilities
Customer perceptions of MTA safety
# and rate of injuries on MTA transit
# & rate of injury accidents
# & rate of fatalities on SHA facilities
Ma At
tion System Performance
Efficiency
rformance
ith acceptable ride quality
ryland SHA
nnual AttainmenReport on Transporta
% of MTA service provided on time
% of MTA bus routes with “successful” or acceptable pe
% of SHA-maintained roads w
Reduction in incident congestion delay
ng federal standards % NHS bridges meeti

32
State Long Range
Plan Initiative Performance Factors/
Strategic Goals Performance Measures Safeguard what exists Clearance times for incident, accidents or Hazmats (metro)
d and poor ride quality
ent
% bridges that meet good and poor structural condition
Snow and ice removal clearance time
% of miles that meet goo
Remaining service life of pavem
Make the transportation network operate better
Travel times for people & freight between Regional Trade Centers
Travel times for people & freight within major Regional Trade Centers
Peak period travel time reliability Increase safety and security of transportation system
Crash rate (3 year average)
Fatalities per year (3 year average)
Minnesota DOT
Strategic Directions
Make Mn/DOT work better Transportation projects completion versus original schedule
General administrative expenditures as % of total expenditures
% customers satisfied with the reliability of MnDOT communications-
% of MnDOT fuel consumption defined as cleaner fuels
# of acres replanted with native species
# of undeveloped acres converted to another land use
Time to complete EIS, Environmental Assessment per project

33
State Long Range
Plan Initiative Performance Factors/
Strategic Goals Performance Measures Tran Fatalities on Nebraska r
ebraska roadways
Motor vehicle accidents in construction work zones
Pavement conditions on Nebraska highways
s
unctionally adequate bridges
e crossing closures
ustomer/partner satisfaction
sportation System Safety & Performance
oads
Motor vehicle crashes on N
Smoother road
# of structurally sound & f
dRailroads gra
External cSurface Transportation Program Delivery
e% of Project in 1 year program l
t to contract
% of Project awarded
Accuracy of project estimates in 1 year program
ys allowed
ects final within 60 days
program let to contract
Accuracy of state highway user revenue projections
% of construction completed within da
% of Construction proj
% of Project in 5 year
Cash balance
Neb
Nerformance
Measures
Motor vehicle accident frequency rate
Lost work days due to job-related injuries
on
cres
Wetland acres for future needs
raska Dept of Roads
DOR P
Employee Health, Welfare, and Morale
Employee satisfacti
No loss of wetland a

34
State Long Range
Plan Initiative Performance Factors/
Strategic Goals Performance Measures To provide a statewide transportation system that adequately meets present and future accessibility and mobility needs.
% congested roadways
Miles congested roadways
To assure the safety of the users of the statewide transportation system.
Total crashes
Property damage crashes
Injury crashes
Total injuries
Fatalities To protect or enhance the environment that is affected by the transportation system; to minimize and mitigate harmful impacts.
Carbon monoxide state standard
Particulate matter state standard
To provide a statewide transportation system that is efficient and effective in the movement of people and goods.
Maintained pavement condition index
Truck miles of travel
Vehicle miles of travel
Enhance the efficiency of en
technology.
the statewide system whappropriate, with the application of new
Urban highway congestion
NevPlan
To implement an effectively planned transportation system that recognizes the opportunity to increase tourism,
economic development, and diversification.
Enplanement index
Rural traffic counts
Nevada DOT

35
Long Range Performance Factors/ State Plan Initiative Strategic Goals Performance Measures
New Mexico DOT
Good to Great Strategic Plan
and secure multimodal programs and transportation infrastructure
r airport improvement projects
rport improvement projects
dget
tation 3037 annual ridership
d with NM pueblos
pedestrian death rates
ing heavy trucks
Environment criteria averages
Deliver safe Aviation division revenue sources
FY2005 Discretionary Total for FAA Southwestern Region
# of projects at New Mexico airports
Local, state, and federal contribution fo
d aiActual funding compared to planne
Aviation Division Expenditure budget FY 2006 operating bu
ridership Rural Public Transportation 5311 annual
Welfare-to-work transpor
Disabled and elderly transportation program (5310) annual ridership
Park and Ride annual passenger trip by route
Park and Ride passenger trip and average daily ridership
SECA routes, vans and number of riders
Memorandum of Understanding complete
RPO attendance
Fatalities per million vehicle miles: New Mexico and nationally
Seatbelt usage of outboard front seat occupants
Alcohol-involved fatalities per 100 MVM
Crash statistics by District
Statewide traffic fatalities
highestSeven counties with
Seven counties with highest crash rates involv
y segments New Mexico’s highest crash rate by rural highwa
Alcohol-involved crashes by severity by District
Fatalities per 100 MVM per District

36
State Long Range
Plan Initiative Performance Factors/
Strategic Goals Performance Measures
Performance of projects in meeting environmental responsibility
Protect wildlife crossing created
Compost use by NMDOT, compost socks, berms installed by NMDOT
Discarded tires reused by NMDOT
Wetland creation projects by NMDOT
Engineers’ estimates vs. awarded bids statewide, by District
% of projects let to bid within target period
Let cost/programmed amount
% of projects let within programmed year Expand and maintain a safe highway and transportation system
% of non-NHS, interstate, non-interstate, & NHS surface miles meeting minimum level of performance
Rest area statewide satisfaction results, by District
State owned structurally deficient bridges number rating 4 & below
State owned structurally deficient bridges square footage of ration 4 & below
Maintenance expenditures per centerline miles by roadway type statewide, by District
Statewide improved surface lane miles
% over bid price statewide, by District
Days to final statewide, by District
# of increased clean-ups per year
# of tons of litter removed from roads statewide, by District
# of volunteers involved in litter control
$ spent on litter removal
Fiscal year summary all construction projects by District
Construction contract totals, cumulative & monthly payment, by District
Deliver safe and secure multimodal programs and transportation infrastructure
New Mexico DOT
Good to Great Strategic Plan

37
State Long Range
Plan Initiative Performance Factors/
Strategic Goals Performance Measures
Construction project status report by District
# of lane miles of highways meeting minimum level of performance by District
istrict Improved surface lane miles by D
Litter pickup accomplishment by District Provide Efficient and Effective Management of Department Resources revenue
T FY06 current operating budget status with budget request
ions FY budget status with request
s
contracts and agreements entered into by NMDOT
NMDOT Worker’s Compensation loss experience
Construction injury incidence rates national/NMDOT comparison
NMDOT fleet motor accident –cars, pickups, trucks
Payment within 30 days
DOT State-Source
NMDOT 20-year financial summary
NMDO
Program and infrastructure FY 06 budget status with request
Transportation and highway operat Business/program support FY budget status with request
NMDOT vacancy average, % vacancy rate
NMDOT separations
NMDOT IT Project status
IT Help Desk calls
$ value of contracts entered into by NMDOT
Types of
Price agreements executed in Quarter by District
New Mexico t n
Expand transportation DOT
Good to GreaStrategic Pla
nd and maintain a safe highway a
system
38
State Long Range
Plan Initiative Performance Factors/
Strategic Goals Performance Measures Bridges Hierarchy-based bridge % non-deficient goals by functional classification Pavement e maintenance actions (paving/non-paving) to total actions
gs of 7 or greater
ment life
iv% of prevent
% of overall lane miles with surface ratin
Average pavement treatSafety ndations implemented on Final
a result of safety
to be reduced as a result of HAL
# of locations, # investigated recommeRegional Work Program (FRWP)
nd total accidents projected to be reduced as# of severe acapital projects
# of High Accident Locations (HAL)
accidents projected# of severe and total treated
Mobility % growth of daily recurring person hours of delay per centerline mile
ring person hours of delay per centerline mile
# of spot congested spot locations
rk miles of coordinated facilities to improve traffic operations
# new miles of on-street bicycle facilities
Quantity of new of upgraded sidewalks and crosswalks
Miles of multi-use paths
# of bicycle/pedestrian accessible transit facilities and activity centers
# of corridors where arterials management techniques are used
ur% growth of daily non-rec
# of dedicated netwo
New York State DOT
21st CenGoals
tury
Bridges Accomplish 100% of qualifying cyclical preservation tasks
Improve average Bridge Condition Index, consistent with Hierarchy-Based Concept
Improve average Maintenance Condition Index

39
State Long Range
Plan Initiative Performance Factors/
Strategic Goals Performance Measures Improve Travel Safety in Oregon
Traffic fatalities
Traffic injuries
fety belts
Rail crossing incidents
Satisfaction with transportation safety
Safe drivers
Impaired driving-related traffic fatalities
Use of sa
Derailment incidents
Move People and GoEfficiently
ods onians
Travel delay
hip
Alternative to one-person commuting
capita
Bridge condition
Transit annual rides by elderly and disabled Oreg
Passenger rail riders
Vehicle miles traveled per
Pavement condition
Provide a TransportatioSystem that Supports
n ng
Bike lanes and sidewalks
Livability and Economic Prosperity
Jobs from construction spendi
Intercity passenger service
Oregon DOT Context Sensitive and Sustainable Solutions
cellent Customer Customer satisfaction Provide ExServices

40
State Long Range
Plan Initiative Performance Factors/
Strategic Goals Performance Measures Adhere to “maintenance first” policies
% of resources expended on maintenance programs and projects
Reduce fatalities and crash severity
Reduce fatalities and injuries by category
Implement statewide congestion management strategic plan
development of improvement Identification of badly congested corridors & strategies
Consistently meet the requirements of the Clean
on all non-attainment &
Air Act
Number of conformity analyses performedmaintenance areas
Clear all strategic rail corridors for double stack capacity
100% double stack clearance on strategic corridors
Improve pavement ride quality
% of miles rated poor
Reduce # of posted & closed bridges
# of posted and closed bridges
Increase rural & urban hip transit systems' riders
% increase in transit ridership
Reduce dependence on single-occupancy vehicles
Increase vehicle occupancy rate
Eliminate at-grade strategic rail freight crossings on state roads
# of at-grade strategic rail freight crossings on state roads
PennsylvanDOT
ia lan PennPMoves
Reduce # of state-maintained roads
# turned-back miles

41
State Long Range
Plan Initiative Performance Factors/
Strategic Goals Performance Measures Take care of what we have Pavements in “Fair or Better” Condition
Bridge condition “fair to very good”
MMQA+ grade for snow and ice control
MMQA+ for signing and striping
Performance Measures: Final Four
Incident management time to clear incidents Make the system work better # of traveler information 511 calls
Traveler information CommuterLink Website hits Improve safety Annual pedestrian fatalities
pedestrians) Annual fatalities (including
Utah DOT Utah Tomorrow
Final Four
ake City Increase capacity Freeway travel times to downtown Salt L
State Long Range
Plan Initiative Performance Factors/
Strategic Goals Performance Measures Service Performance % of construction contracts completed by original date Service Performance % of construction contracts completed within 110% of contract award amount Service Performance % of all maintenance construction completed by original specified completion
date
Virginia DOT VTrans2025 Strategic Plan
Service Performance % of maintenance contracts completed within 110% of contract award amount

State Long Range
Plan Initiative Performance Factors/
Strategic Goals Performance Measures Plan and build (deliver) capital projects for our transportation systems in accordance with the instructions of the legislature
Planned vs. actual results of scope, schedule and budget
Compare planned delivery milestone dates against completion dates
Planned vs numbers of highway construction projects advertised
Planne l expenditures for preservation and improvement programs
% of f r below award
% of p d or poor condition (by type)
% of b fair or port condition
. actual
d vs. actua
inal cost above o
avement in goo
ridges in good, Maintain and operate ttransportation facilitie systems placed under tdepartment’s responsimaking cost-effective of the appropriations provided by the Legislfrom citizens’ taxes.
ing nance activities he s andhe
bilityuse
atur
,
e
Rat for 22 highway mainte
Optimize the operationefficiency and safety otransportation systems facilities committed toWSDOT’s charge.
talit strian, vehicle)
for alysis for safety projects
f re erage clearance time
cha rmance for 20 Puget Sound routes
al f theand
Fa
Be
# o
%
y rates (bicyclis
e and after collis
sponses and ov
nge in travel tim
t, pede
ion an
erall av
e perfoReport to the Transpotion Commission, citizother officials and the lelature on achievements, shortcomings, and challenges in WSDOT’s performance.
Repor rogram delivery
Desig anagement, schedule and cost evaluation
rta-ens,
gis-
Gray Notebook, Web
ting on capital p
n, construction m
pages
42
Washington State DOT
Strategic Initiative: Gray Notebook
Assure the capability and efficiency of WSDOT’s workforce
Compliance ratings for 17 training courses
Recordable injuries per 100 workers per calendar year

A P P E N D I X D S T A T E D O T E X A M P L E S :
L O N G R A N G E P L A N N I N G A N D P E R F O R M A N C E M E A S U R E S
M I N N E S O T A D O T N E V A D A D O T
P D O T E N N S Y L V A N I A
43

- 44 -
erformance Framework and Measures
Utah Depart
Minnesota DOT P
Source: Minnesota Department of Transportation. www.cts.umn.edu/research/rfp/documents/MnDOT-Performance-Measures.pdf
ment of Transportation Strategic Directions and Performance Measures: Final Four.

Minnesota DOT
Source: Minnesota Statewide Transportation Plan: Moving People and Freight from 2003 to 2023. Executive Summary. August 2003. Minnesota Department of Transportation. www.oim.dot.state.mn.us/StatePlan/03STP_exec_summ_(Web).pdf
45

Nevada DOT
Source: NevPlan Statewide Transportation Plan. [Online]2005. Nevada Department of Transportation. www.nevadadot.com/reports_pubs/NevPlan/pdfs/NevPlanSection3.pdf.
46

Pennsylvania DOT
Source: Pennsylvania Department of Transportation, PennPlan Moves! Excerpted Objectives 1 to 7 with Performance Measures and Targets
47

PennPlan Moves! (continued)
Source: Pennsylvania De 000. PennPlan Moves! ftp.dot.state.pa.us/pu / sandobjectives.pdf
partment of Transportation. 2df/PennPlanMoves/blic p statewidegoal
48

A P P E N D I X E T A T E D O T P E R F O R M A N C E M E A S U R E S
U S E R F R I E N D L Y A N D E A S I L Y A C C E S S I B L E
A R Y L A N D S T A T E H I G H W A Y A D M I N I S T R A T I OM I S S O U R I D O T
N E B R A S K A D E P A R T M E N T O F R O A D S N E W Y O R K S T A T E D O T
U T A H D O T V I R G I N I A D O T
W A S H I N G T O N S T A T E D O T
S :
M N
49

Mary
land State Highway Administration
Excerpt from Annual Attainment Report on Transportation System Performance (2004)
50

Source: Maryland Department of Transportation. Annual Attainment Report on Transportation System Performance. 2004. www.mdot.state.md.us/State%20Report%20on%20Transportation/Documents/
Annual%20Attainment%20Reports/Final%202004%20Attainment%20Report.pdf
51

Missouri DOT
Source: Tracker: Me ent of Transportation. www.modot.org/about/general_info/documents/completereduced.pdf asures of Department Performance. January 2006. Missouri Departm
52

Source: Tracker: Measures of Department Performance. January 2006. Missouri Department of Transportation. www.modot.org/about/general_info/documents/completereduced.pdf
53

Nebraska Department of Roads
Index These are revised throughout the year - please check back
Transportation System Safety & Performance
Surface Transportation Program Delivery
Employee Health, Welfare & Morale
Fatalities on Nebraska Roadways
% of Projects in 1 yr. Program Let to Contract
Motor Vehicle Accident Frequency Rate
Motor Vehicle Crashes on Nebraska Roadways % of Projects Awarded Lost Work Days Due to Job
Related Injuries
Motor Vehicle Accidents in Construction Work Zones
Accuracy of Project Estimates in 1 Year Program Employee Satisfaction
Pavement Condition of NE Highways
% of Construction Projects Completed Within Days Allowed
Smoother Roads % of Construction Projects Finaled Within 60 Days
% of Structurally Sound & Functionally Adequate Bridges
% of Projects in 5 yr. Program Let to Contract
Railroad Grade Crossing Closures
Accuracy of State Highway User Revenue Projections
External Customer/Partner Satisfaction Cash Balance
No Loss of Wetland Acres
Wetland Acres for Future Needs
Source: Nebraska Department of Roads: www.dor.state.ne.us/performance/index.htm
54

Source: Nebraska Department of Roads: www.dor.state.ne.us/performance/index.htm
55

Source: Nebraska Department of Roads: www.dor.state.ne.us/performance/index.htm
56

Utah DOT
Source: Utah Department of Transportation: http://www.udot.utah.gov/download.php/tid=1089/06strategic.pdf
57

Virgin
Source: Performance-Based Decision Making in Transportation: Ideal and Real Approaches. 2004. Virginia Department of Transportation.
www.trb-performancemeasurement.org/Jeff%20price%20Sun%20AM%20Workshop%201.PDF
ia DOT
58

59
Source: Dashboard: Virginia Department of Transportation, Performance Reporting System for Projects and Programs,
dashboard.virginiadot.org/default.aspx

Source: Report Card. 2004. Virginia Department of Transportation. www.virginiadot.org/infoservice/resources/QuarterlyReport1-04.pdf
60

Source: Report Card. 2004. Virginia Department of Transportation. www.virginiadot.org/infoservice/resources/QuarterlyReport1-04.pdf
61

Washington State DOT
Source: “Measures, Markers and Mileposts.” 2005. Washington State Department of Transportation. www.wsdot.wa.gov/Accountability/GrayNotebook.pdf
62

Source: “Measures, Markers and Mileposts.” 2005. Washington State Department of Transportation. www.wsdot.wa.gov/Accountability/GrayNotebook.pdf
63

Source: “Measures, Markers and Mileposts.” 2005. Washington State Department of Transportation. www.wsdot.wa.gov/Accountability/GrayNotebook.pdf
64

Source: “Measures, Markers and Mileposts.” 2005. Washington State Department of Transportation. www.wsdot.wa.gov/Accountability/GrayNotebook.pdf
65

66
A P P E N D I X F S T A T E D O T E X A M P L E S :
B R O C H U R E S
M I N N E S O T A D O T N O R T H C A R O L I N A D O T
M O N T A N A D O T

67
Minnesota Department of Transportation

68
Source: Minnesota Department of Transportation. www.dot.state.mn.us/information/statplan00/strategicplan.pdf

69
www.ncdot.org/planning/strategicplan/SPBROCHURE.pdf
North Carolina Department of Transportation

70

71
Montana Department of Transportation
www.mdt.mt.gov/publications/docs/brochures/tranplan21/tranplan21bro.pdf

72

New Mexico Department of Transportation RESEARCH BUREAU
Pan American Freeway NE PO Box 94690 Albuquerque, NM 87199-4690 Tel: (505) 841-9145
7500B