contextquestionsmethodsplacesperformancesummary varieties of knowledge and economic performance...
TRANSCRIPT

context questions methods places performance summary
varieties of knowledge and economic performance evidence from canadian city-regions, 1991-2001
greg spencer & tara vinodraidepartment of geography &munk centre for international studiesuniversity of toronto
context
onris fall workshop, toronto, canada, november 24, 2006

context questions methods places performance summary
background: goals of quantitative analysis
• social dynamics of innovation (theme I)– what is the relationship between economic performance, economic
diversity and local / non-local linkages and knowledge flows?
• social foundations of talent attraction/retention (theme II)– what is the relationship between economic performance and
quality of place?• cultural dynamism, social diversity, openness and tolerance, social
inclusion and cohesion, socio-spatial polarization
• socio-economic / demographic profiles of city-regions– what are the socio-economic and demographic characteristics of
the 15 city-regions included in the ISRN study?– facilitate comparison and the selection of case studies, etc.
context

context questions methods places performance summary
purpose of today’s presentation
• present preliminary and exploratory research addressing issues related to understanding the relationship between knowledge diversity and the economic performance of city-regions
• informed by three recent debates / developments in the literature on learning, innovation, and regional economic performance– talent, human capital, and the city– economic specialization vs. diversity – knowledge bases / typologies and innovation
context

context questions methods places performance summary
received wisdom
• talent, human capital and the growth of cities– uneven geography of highly educated labour; talent attracted to,
and concentrated in, particular urban centres (Florida 2002)– cities with initial higher levels of education experienced higher
levels of growth in share of highly educated workers (Berry and Glaeser 2005)
– focus on university-educated workers
• diversity and regional economic growth– relative importance of specialization (Marshall) vs. diversity
(Jacobs) to economic dynamism– presence of ‘related’ variety (knowledge spillovers) leads to
economic growth whereas ‘unrelated’ variety (portfolio effect) does not influence growth (Frenken et al. 2004; Boschma and Iammorino 2006)
context

context questions methods places performance summary
received wisdom
• knowledge bases (Asheim and Gertler 2005, Asheim et al. 2006)– innovation process of firms and industries differ substantially
between various sectors, whose activities require specific ‘knowledge bases’
– analytic – science / math-based– synthetic – engineering-based– symbolic – culturally-based
– industrial / sector-basedapproach
context

context questions methods places performance summary
received wisdom
• combining insights from these three perspectives suggests:– need to go beyond simply noting the presence of degree/diploma
holders to examine the specific knowledge assets / qualifications of workers in the local economy
– the knowledge characteristics of the local labour force may be important in explaining regional economic performance
– presence of specific knowledge assets individually or in combination may affect growth outcomes
• ‘diverse specializations’
context

context questions methods places performance summary
key questions addressed
• can we characterize particular places by assessing the knowledge characteristics of the local labour force?
• do city-regions with a diverse knowledge infrastructure experience higher levels of economic performance compared to cities with a more specialized knowledge infrastructure?– does the presence of particular forms of knowledge result in
particular types of growth (i.e. employment vs. income growth)?– are different growth outcomes based on having different
combinations of knowledge specializations?
questions

context questions methods places performance summary
data: sources and variables
• sources of data– Census of Population, 1991 & 2001– 136 city-regions (census metropolitan areas and census
agglomerations)
• key variables– educational attainment
• post-secondary degree/diploma holders• knowledge specialization (field of study – 10 categories)• average years of schooling
– income, income change– employment, employment change– presence of universities (ph.d. granting, other)
methods

context questions methods places performance summary
data: methodological approach
• assign fields of study (10 categories) to knowledge base groups
• identify knowledge base of city-regions– location quotients – presence of knowledge type as proportion of
population 15 years or older, compare local to national
– 136 city-regions can be assigned to one of 8 categories depending on knowledge specializations present in that place
• None• Symbolic, Synthetic, Analytic• Symbolic-Synthetic, Symbolic-Analytic, Analytic-Synthetic• All
• compare economic performance between these 8 groups– income growth, employment growth
methods

context questions methods places performance summary
defining knowledge bases: field of study
methods
Symbolic Synthetic Analytic Educational, recreational and counselling services
Engineering and applied sciences
Commerce, management and business administration
Fine and applied arts Applied science technologies and trades
Agricultural, biological, nutritional, and food sciences
Humanities and related fields
Mathematics, computer and physical sciences
Social sciences and related fields
Health professions and related technologies
context questions methods places performance summary
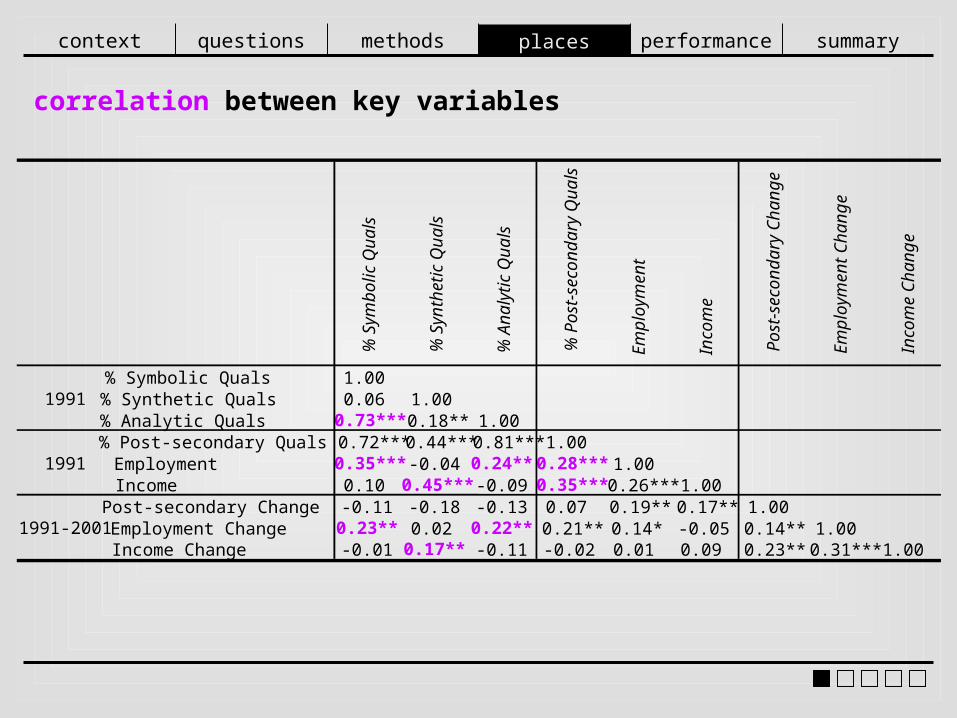
correlation between key variables
places
% S
ymbo
lic Q
uals
% S
ynth
etic
Qua
ls
% A
naly
tic Q
uals
% P
ost-
seco
ndar
y Q
uals
Em
ploy
men
t
Inco
me
Pos
t-se
cond
ary
Cha
nge
Em
ploy
men
t Cha
nge
Inco
me
Cha
nge
% Symbolic Quals 1.00% Synthetic Quals 0.06 1.00% Analytic Quals 0.73*** 0.18** 1.00% Post-secondary Quals 0.72*** 0.44*** 0.81*** 1.00Employment 0.35*** -0.04 0.24** 0.28*** 1.00Income 0.10 0.45*** -0.09 0.35*** 0.26*** 1.00Post-secondary Change -0.11 -0.18 -0.13 0.07 0.19** 0.17** 1.00Employment Change 0.23** 0.02 0.22** 0.21** 0.14* -0.05 0.14** 1.00Income Change -0.01 0.17** -0.11 -0.02 0.01 0.09 0.23** 0.31*** 1.00
1991
1991
1991-2001

context questions methods places performance summary
post-secondary education and economic performance
• findings confirms relationship between higher education and economic performance (employment growth and income)
• presence of analytic and symbolic knowledge– tend to be geographically concentrated in fewer places and co-
located– associated with larger cities and employment growth BUT not
higher incomes / income growth
• presence of synthetic knowledge– tends to be more geographically dispersed and not co-located with
other knowledge types– associated with smaller cities, higher incomes and income growth
BUT not employment growth
• H: combinations of knowledge specializations may lead to better overall economic performance
places

context questions methods places performance summary
categorizing places: combining knowledge specializations
places
symbolic syntheticsymbolic-synthetic
symbolic-synthetic-analytic
analytic
symbolic-analytic
analytic-synthetic
no specialization

context questions methods places performance summary
knowledge specializations by place
Grand Falls-Windsor
Labrador City
Campbellton
Edmundston
Matane
Rivière-du-Loup
Dolbeau-Mistassini
Saint-Georges
Magog
Cowansville
Victoriaville
Drummondville
Granby
Saint-Hyacinthe
Saint-Jean-sur-Richelieu
Salaberry-de-Valleyfield
Lachute
Val-d'Or
Amos
Cornwall
places
symbolic synthetic
analytic
Charlottetown
Truro Moncton
Camrose
North Battleford
Portage la Prairie
Joliette
Cobourg
Port Hope and Hope
Stratford
North Bay
Wetaskiwin
Québec
Sherbrooke
Montréal
Ottawa-HullToronto
GuelphLondon
Winnipeg Brandon
Regina
Saskatoon
Lethbridge
Peterborough
Kitchener
Halifax
Fredericton
Rimouski
YellowknifeWhitehorse
Victoria Vancouver
EdmontonCalgary Kingston
Trois-Rivières
St. John's
Gander
NanaimoKamloops
Kelowna
Penticton
Cranbrook
Red Deer
Chicoutimi-Jonquière
Kentville
Brockville
Barrie
Corner Brook Summerside
New Glasgow Cape Breton Saint John
Bathurst Baie-Comeau Alma
Sept-Îles Thetford Mines Shawinigan
La Tuque Sorel-Tracy Rouyn-Noranda
Belleville Oshawa Hamilton
St. Catharines-Niagara
Sarnia
Greater Sudbury
Elliot Lake Timmins Sault Ste. Marie
Thunder Bay Kenora Thompson
Moose Jaw Estevan Medicine Hat
Lloydminster Cold Lake Grande PrairieWood Buffalo
Vernon
Duncan
Port Alberni
Courtenay
Campbell River
Powell River Williams Lake
QuesnelPrince Rupert
Kitimat
Terrace
Prince George
Dawson Creek
Fort St. John
Hawkesbury
Pembroke
Kawartha Lakes
Brantford
Woodstock
Tillsonburg
Norfolk
Chatham-Kent
Leamington
Windsor
Owen Sound
Collingwood
Orillia
Midland
Haileybury
Yorkton
Swift Current
Prince Albert
Chilliwack
Abbotsford

context questions methods places performance summary
knowledge specializations: number of places, 1991 & 2001
places
1991: 62001: 1
1991: 472001: 28
1991: 22001: 3
1991: 112001: 22
1991: 62001: 6
1991: 122001: 9
1991: 122001: 7
1991: 402001: 60
symbolic synthetic
analytic

context questions methods places performance summary
knowledge specializations: employment income, 1991
performance
$23,483 $25,125$24,835
$25,706
$20,970
$26,957 $23,489
$22,970
symbolic synthetic
analytic

context questions methods places performance summary
employment growth by knowledge specialization
performance
0.0% 5.0% 10.0% 15.0% 20.0% 25.0%
No Specialization
Symbolic
Synthetic
Analytic
Symbolic-Synthetic
Synthetic-Analytic
Analytic-Symbolic
Symbolic-Synthetic-Analytic
% change in employment 1991-2001
context questions methods places performance summary
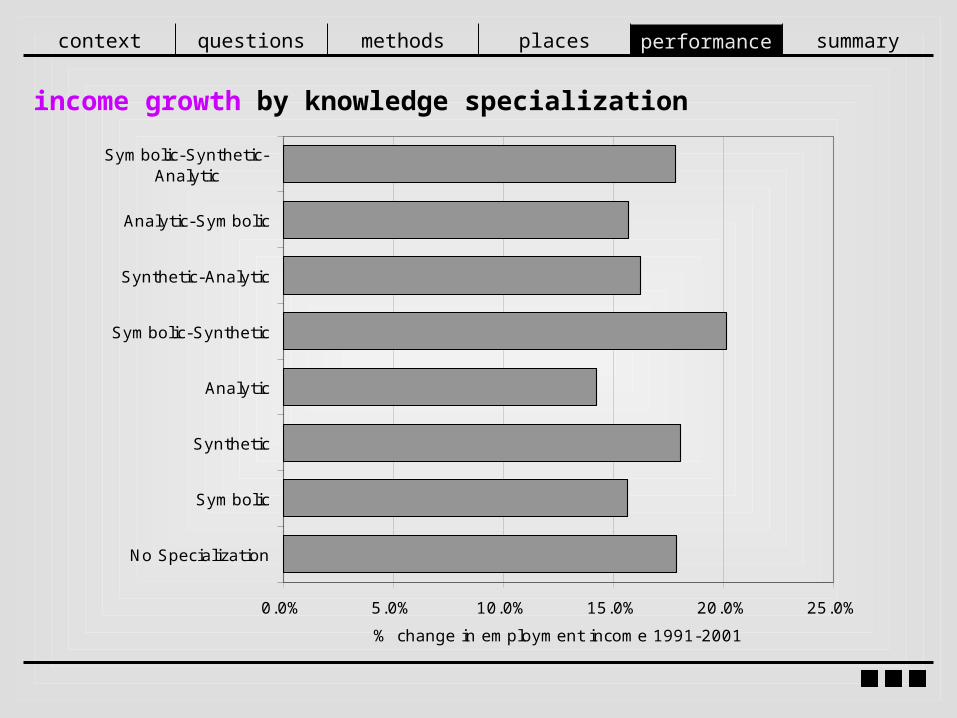
income growth by knowledge specialization
performance
0.0% 5.0% 10.0% 15.0% 20.0% 25.0%
No Specialization
Symbolic
Synthetic
Analytic
Symbolic-Synthetic
Synthetic-Analytic
Analytic-Symbolic
Symbolic-Synthetic-Analytic
% change in employment income 1991-2001

context questions methods places performance summary
knowledge specializations: key characteristics
summary
RareLow Growth
CommonSmall/Mid-SizedHigh IncomeLower Growth
Rare
Large CitiesHigh Income
FastestGrowth
RareLow Growth
Large CitiesHighest Inc. Growing
Small/Mid-sizedFast Growing
CommonSmallerLow Income
symbolic synthetic
analytic
context questions methods places performance summary
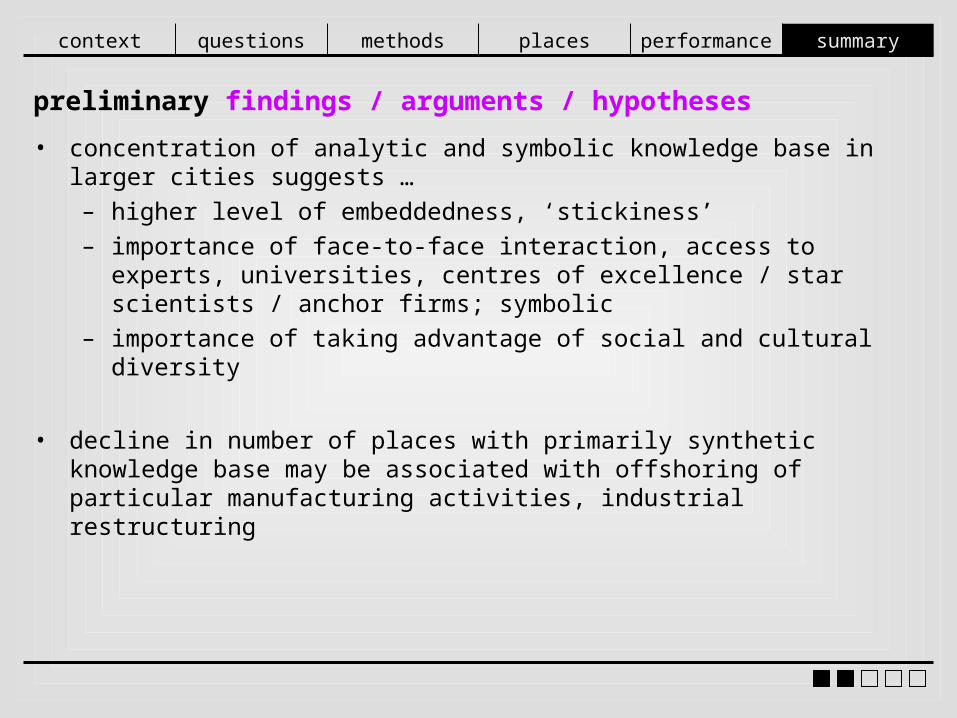
preliminary findings / arguments / hypotheses
• concentration of analytic and symbolic knowledge base in larger cities suggests …– higher level of embeddedness, ‘stickiness’– importance of face-to-face interaction, access to experts,
universities, centres of excellence / star scientists / anchor firms; symbolic
– importance of taking advantage of social and cultural diversity
• decline in number of places with primarily synthetic knowledge base may be associated with offshoring of particular manufacturing activities, industrial restructuring
summary

context questions methods places performance summary
preliminary arguments / hypotheses
• more inclusive and nuanced definition of highly educated/skilled workers (i.e. includes all post-secondary diploma/degree holders rather than simply university degree holders) and their field of specialization
• emphasis on measuring knowledge (types of post-secondary qualifications) at the city-region level rather than via industries or occupations
• potential benefit of having combinations of knowledge (variety) within particular places to overall economic performance (particularly employment growth)
summary

context questions methods places performance summary
next steps: analysis
• hypothesis testing and multivariate analysis– what is the relationship between economic performance and the
diversity of the knowledge base?• industrial structure• variations by size• social inequality• other regional effects
– test other measures of ‘diversity’
• advantage to considering disaggregated categories of post-secondary qualifications?
• solicit feedback and comments
summary

context questions methods places performance summary
thank you
• we would like to acknowledge Meric Gertler and David Wolfe for their the valuable comments and insights
• thank you to Deborah Huntley for her on-going help and support
• we would also like to thank the Manic Monday Economic Geography Study Group (Kate Geddie, Atle Hauge, Brian Hracs, Dieter Kogler, and Josee Rekers) for pointing and laughing as appropriate
• for further questions:[email protected] or [email protected]
summary