continued assessment of high impact options presented by public financial management to the act 141...
TRANSCRIPT

Continued assessment ofhigh impact options
Presented by Public Financial Management to the Act 141 Advisory CommitteeDavis School
March 27, 2013
2
Framework for evaluating options
We have continued to evaluate the two remaining high impact options according to the Committee’s criteria:
Does it provide a sound, effective education?
Does it provide a safe, healthy learning environment?
Does it provide a viable, sustainable business model?
We are also considering the relative difficulty for the District to implement the high impact option.
Tonight we will give you more information on the full charter conversion option and academic performance analysis for the internal transformation option.

Conversion charter
4
Demographic comparison
We described Philadelphia’s Renaissance School approach to conversion charters at the last Advisory
Committee meeting. One follow up questions was how the Renaissance Schools compare to the
District operated schools in terms of demographics defined as:
Number of students per facility
Percent of student population that is “economically disadvantaged” (receiving free or reduced price
lunches)
Percent of student population that has an Individualized Education Program (IEP) that helps students
with a disability meet their educational objectives
Please note that, for internal consistency, we are presenting the data in each of these categories for
the students who took the Pennsylvania System of School Assessment (PSSA) tests in 2011-
2012 unless otherwise noted. Students in grades 3-8 and 11 take the PSSA tests, so the subsequent
analysis does not capture the demographics of every student in every grade. However, using the
PSSA test data allows us to show demographic information for the same student population whose
test results we presented on March 17.
York data does not include Lindberg Academy, which had only 11 eleventh grade students in 2011-
2012. Renaissance School data does not include one of the eight K-8 schools because it was not
available.

5
Students per facility (2011-2012 PSSA results)
Since the data is from last year, it reflects York’s elementary/middle school split before the conversion to the K-8 model. York had fewer
students taking the PSSA in its elementary schools (K-4) than the Renaissance Schools (K-6). York’s middle schools (5-8) were 32
percent larger and its high schools were 26 percent smaller than the Renaissance Schools according to this measure. Overall the
Renaissance Schools had more students– 305 per facility versus 225 for York.
6
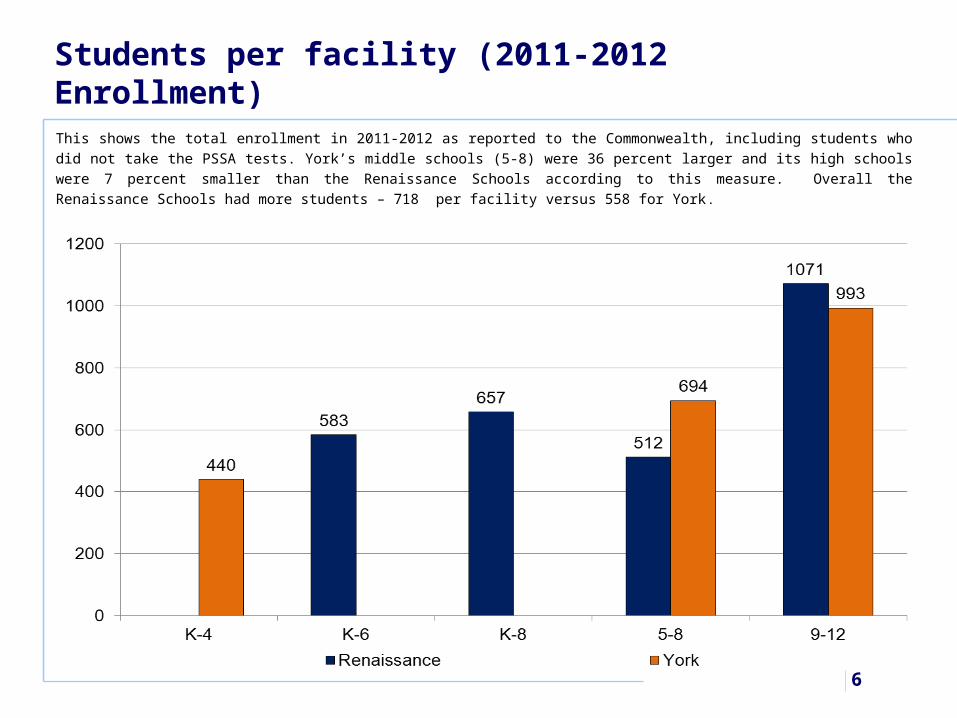
Students per facility (2011-2012 Enrollment)
This shows the total enrollment in 2011-2012 as reported to the Commonwealth, including students who did not take the PSSA
tests. York’s middle schools (5-8) were 36 percent larger and its high schools were 7 percent smaller than the Renaissance
Schools according to this measure. Overall the Renaissance Schools had more students – 718 per facility versus 558 for York.
7
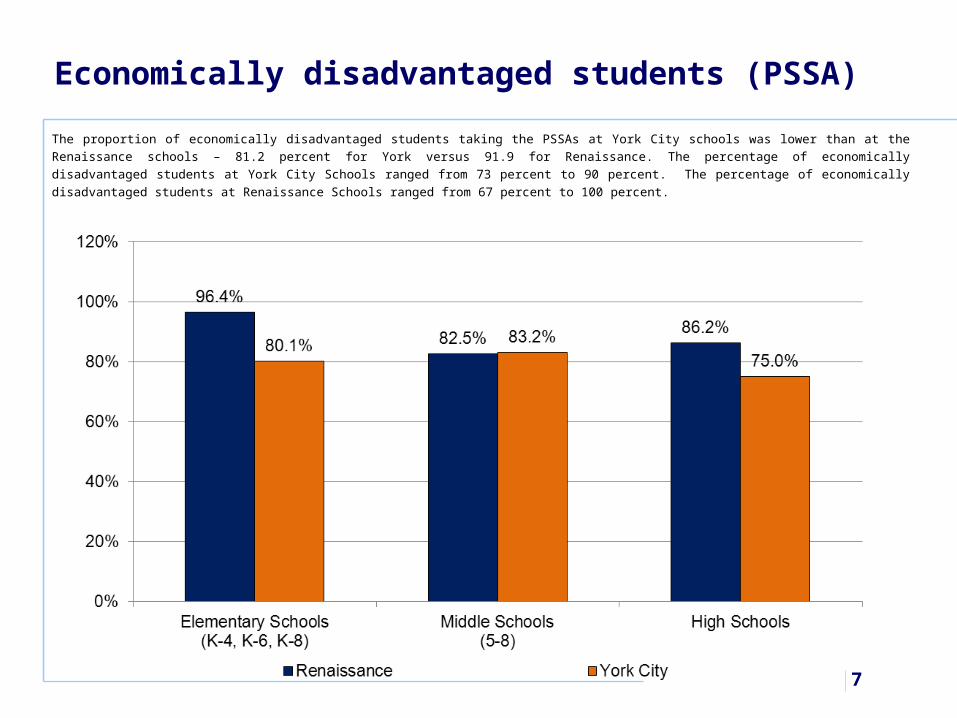
Economically disadvantaged students (PSSA)
The proportion of economically disadvantaged students taking the PSSAs at York City schools was lower than at the Renaissance
schools – 81.2 percent for York versus 91.9 for Renaissance. The percentage of economically disadvantaged students at York City
Schools ranged from 73 percent to 90 percent. The percentage of economically disadvantaged students at Renaissance Schools
ranged from 67 percent to 100 percent.
8
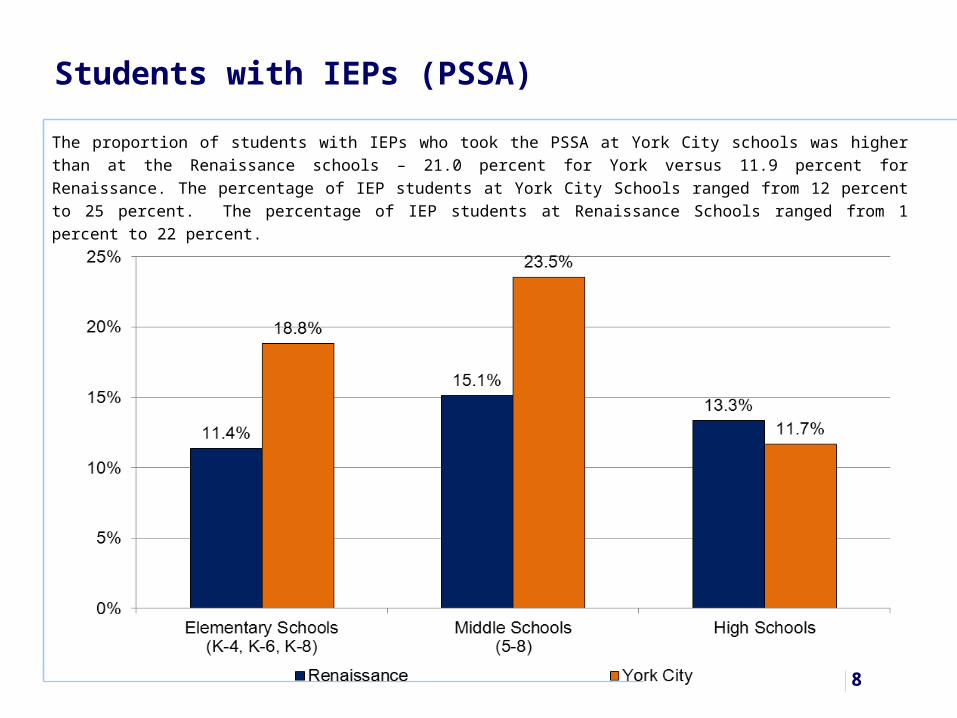
Students with IEPs (PSSA)
The proportion of students with IEPs who took the PSSA at York City schools was higher than at the Renaissance
schools – 21.0 percent for York versus 11.9 percent for Renaissance. The percentage of IEP students at York City
Schools ranged from 12 percent to 25 percent. The percentage of IEP students at Renaissance Schools ranged from 1
percent to 22 percent.
9
PSSA test results for Renaissance IEP students
At the last meeting we presented the Pennsylvania System of School Assessment
(PSSA) math and reading test results for the schools converted to charters via the
Renaissance program. We showed the percentage of students achieving advanced or
proficient scores for all students, economically disadvantaged students and African
American/Hispanic students. The test scores for each of these groups included
students with IEPs.
The next two slides show the math and reading test results just for students with IEPs. As
before, the dotted line shows the performance of the SDP schools excluding those in the
Renaissance Program. The blue lines shows the performance for schools that converted
to Renaissance charters in 2010-2011 (two years of results since conversion). The red
line shows the performance for schools that converted to Renaissance charters in 2011-
2012 (one year of results since conversion).
One of the K-8 schools converted to a Renaissance School in 2011-2012 did not have
results available.

10
PSSA results: Math for students in IEPs
Operated as charter school

11
PSSA results: Reading for students in IEPs
Operated as charter school
12
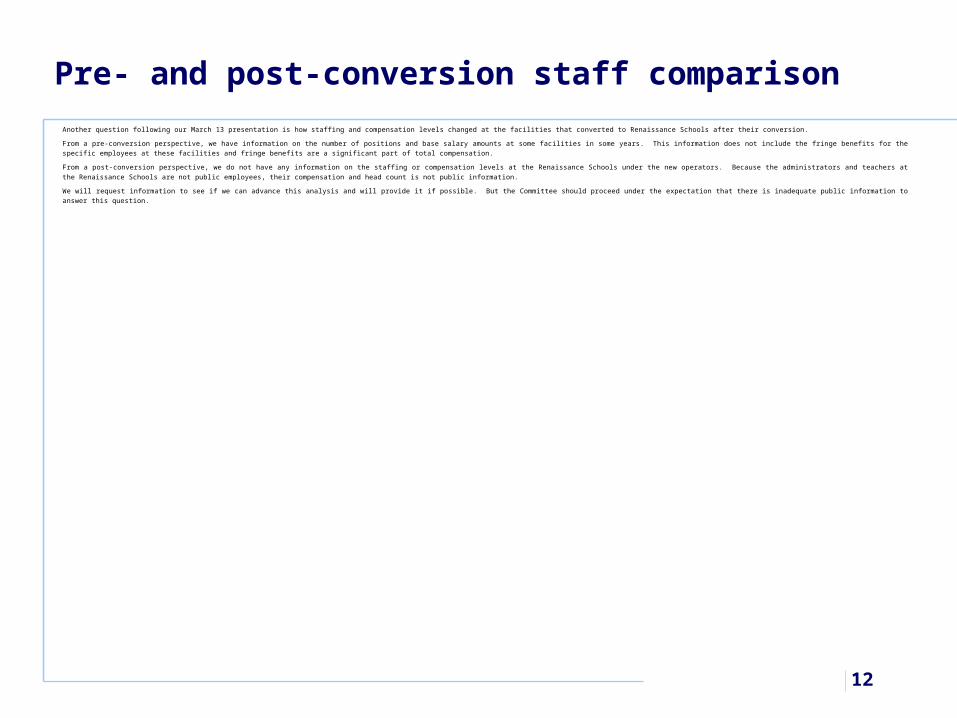
Pre- and post-conversion staff comparison
Another question following our March 13 presentation is how staffing and compensation levels changed at the facilities that converted to Renaissance Schools after their conversion.
From a pre-conversion perspective, we have information on the number of positions and base salary amounts at some facilities in some years. This information does not include the fringe benefits for the specific employees at these facilities and
fringe benefits are a significant part of total compensation.
From a post-conversion perspective, we do not have any information on the staffing or compensation levels at the Renaissance Schools under the new operators. Because the administrators and teachers at the Renaissance Schools are not
public employees, their compensation and head count is not public information.
We will request information to see if we can advance this analysis and will provide it if possible. But the Committee should proceed under the expectation that there is inadequate public information to answer this question.

Conversion charter

14
Academic performance baseline
To provide a baseline for evaluating the internal transformation option, we are providing the Pennsylvania
System of School Assessment (PSSA) math and reading test results for the District operated schools and three
charters (New Hope, Lincoln and Helen Thackston) in York City.
Students take the PSSA in grades 3 through 8 and 11. Their scores are broken into four categories –
advanced, proficient, basic and below basic. We focused on the percentage of students achieving advanced
or proficient scores.
Our review covers the school years from 2006-2007 through 2011-2012 (most recent available).
Existing charter schools: In all categories, the percentage of students receiving advanced or proficient
scores dropped for math and reading over this period. In come cases there was a steady decline. In others
there was a large drop and then it leveled off. In others there was a large drop and then the results rebounded,
but not to 2006-2007 levels.
District operated schools: The percentage of students receiving advanced or proficient scores in math
increased over this period. For reading there was improvement through 2010-2011 but performance in 2011-
2012 fell back to 2006-2007 levels.
Changing population sizes: The size of the student populations educated by these two groups has changed
significantly since 2006-2007. The number of students taking the PSSA at the three charter schools increased
by 130 percent over this period and by higher percentages in certain categories (+250% for IEPs). In contrast,
the number of students taking the PSSA at District-operated facilities dropped by 30-50 percent, depending on
the category.

15
PSSA results: Math for all students
Percent scoring Advanced or Proficient

16
PSSA results: Math for economically disadvantaged
Percent scoring Advanced or Proficient

17
PSSA results: Math for students with IEPs
Percent scoring Advanced or Proficient

18
PSSA results: Reading for all students
Percent scoring Advanced or Proficient
19
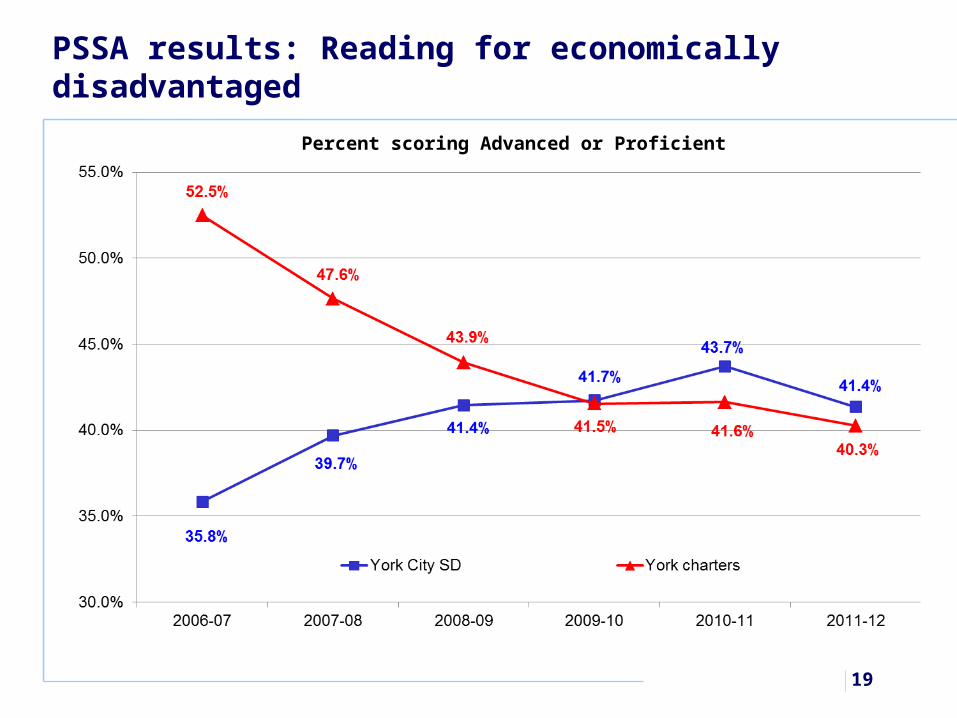
PSSA results: Reading for economically disadvantaged
Percent scoring Advanced or Proficient
20
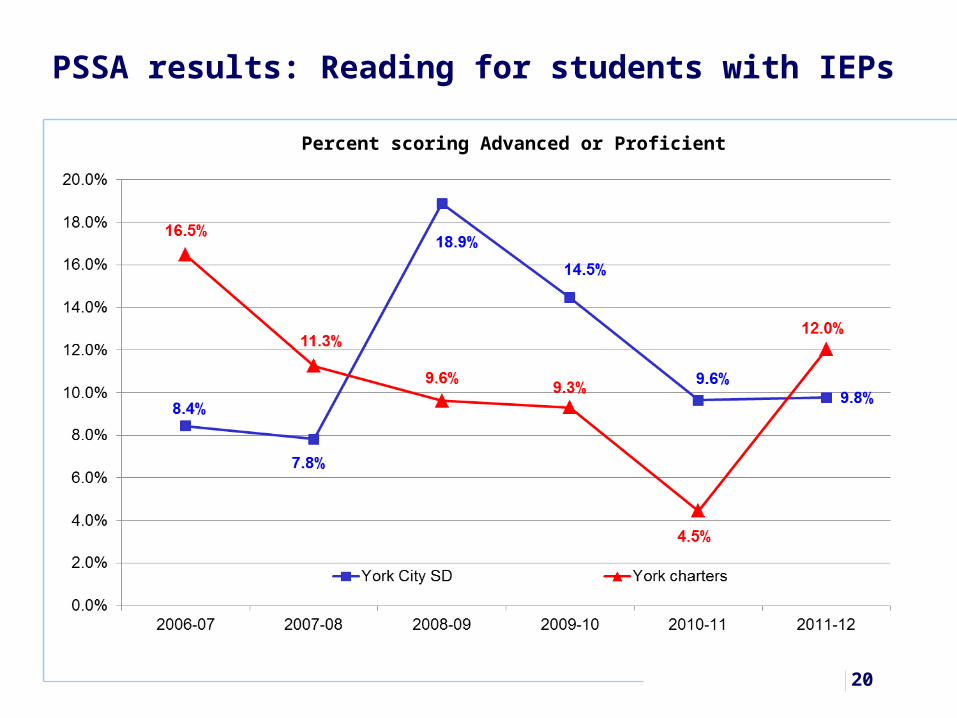
PSSA results: Reading for students with IEPs
Percent scoring Advanced or Proficient

21
Pennsylvania magnet school examples
The District’s proposal cited three Pennsylvania magnet schools as models that show the
potential for the internal transformation option to improve academic performance in York.
Conwell Russell is a Philadelphia magnet school with students in grades 5-8. Its academic
performance is consistently stronger than other SDP schools. In 2011-2012, 77 percent of its
students scored advanced or proficient in math and 80 percent reached that level in reading.
However, Conwell only accepts students who score 70 percent on math and reading for sixth
grade enrollment and 80 percent for seventh and eighth grade enrollment. So its high
performance is partly a result of its selectivity.
Pittsburgh Science and Technology Academy is a magnet school covering grades 6-12 .
Its academic performance is also stronger than other Pittsburgh Public schools. In 2011-2012,
79 percent of its students scored advanced or proficient in math and 84 percent reached that
level in reading. However, it only accepts students who achieve basic proficiency on the PSSA
in those areas. One-third of the York City students did not reach basic proficiency for reading
in 2011-2012.
If the District wants to establish a magnet school with a similar approach, it will have to set its
entrance requirements, project its enrollment based on those requirements and make staffing
and facility plans accordingly.

22
Magnet school: Dilworth Elementary
The third Pennsylvania-based magnet school is
Dilworth Elementary in Pittsburgh that has 417
students in grades K-5. Dilworth is open to all
students in the surrounding neighborhood.
Seventy-five percent of the Dilworth students who
took the PSSA in 2011-2012 were economically
disadvantaged (82 percent in York). For the other key
demographic, 7.5 percent of the Dilworth students
who took the PSSA had IEPs (21 percent in York).
We reviewed the Pennsylvania System of School Assessment (PSSA) math and reading test results
for Dilworth Elementary and all other Pittsburgh School district facilities. As before we focused on
the percentage of students achieving advanced or proficient scores with a breakout for economically
disadvantaged students and students with an IEP. We are presenting the scores for the school
years from 2006-2007 through 2011-2012, as we did for York and the Renaissance schools.
On average Dilworth had 22 IEP students per year who took the PSSAs. Last year Dilworth had 15
students and less than 10 in each grade. The Commonwealth does not report results when less
than 10 students per grade take the PSSAs, so the charts for IEP students stop in 2010-2011.

PSSA results: Math for all students
23
Percent scoring Advanced or Proficient

PSSA results: Math for economically disadvantaged
24
Percent scoring Advanced or Proficient
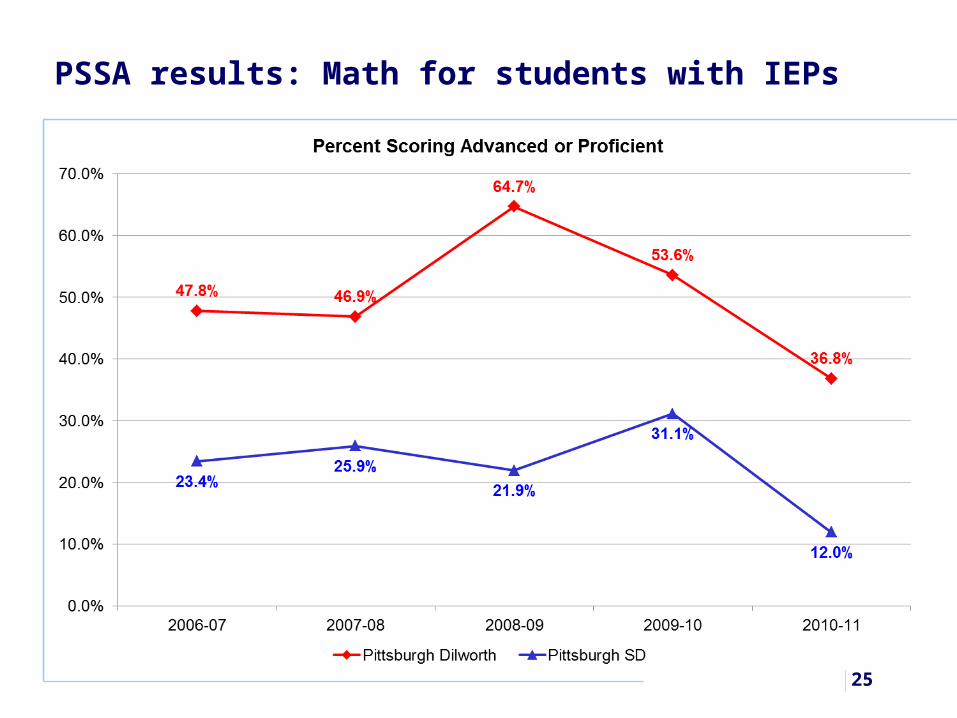
PSSA results: Math for students with IEPs
25
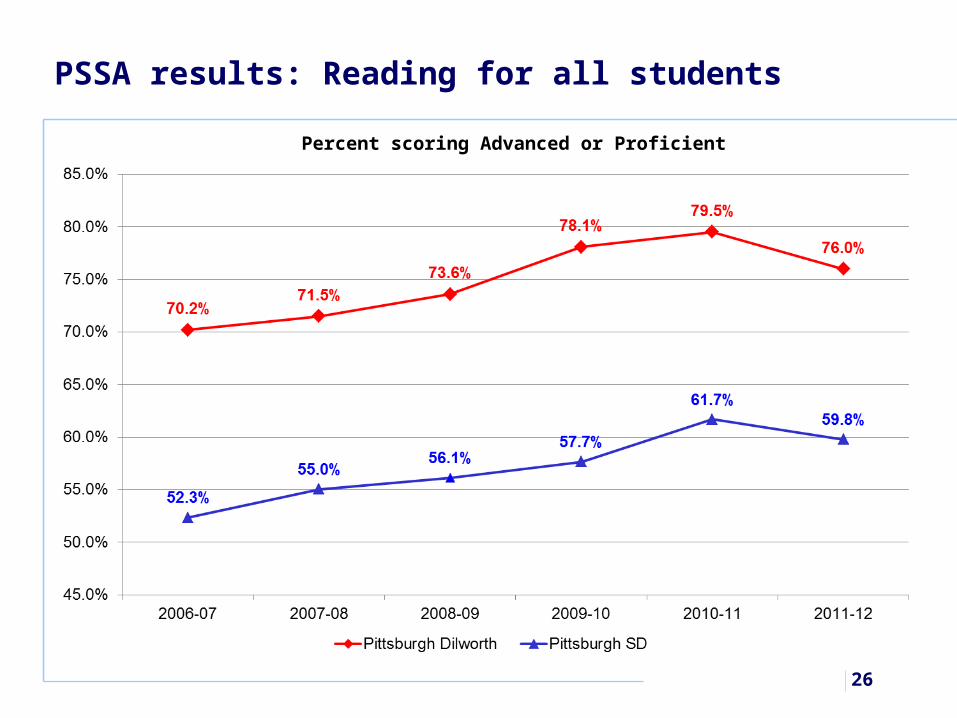
PSSA results: Reading for all students
26
Percent scoring Advanced or Proficient
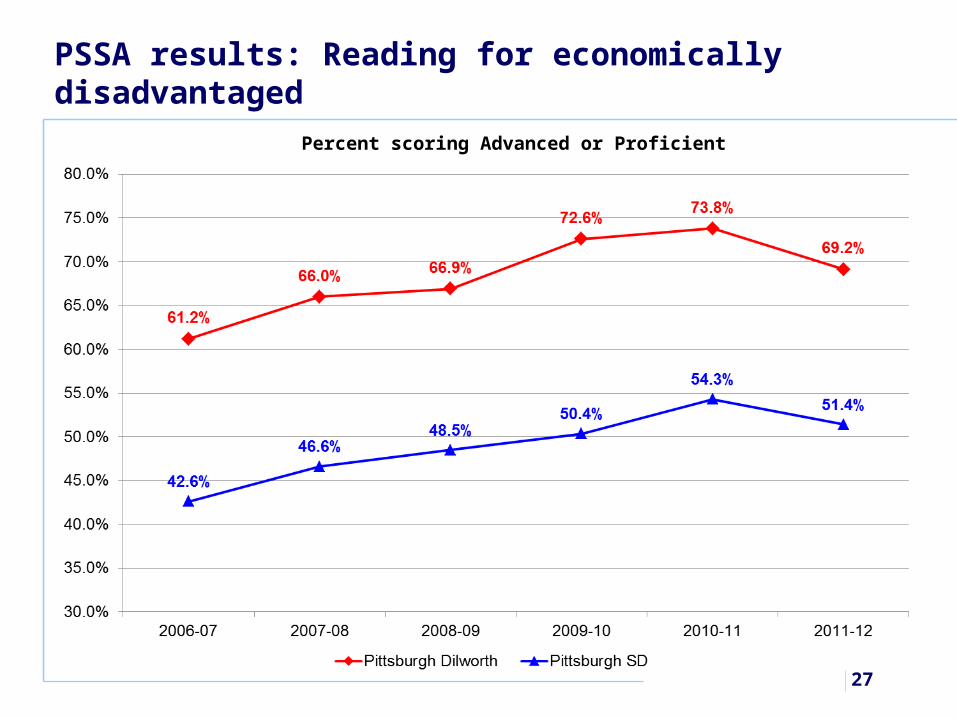
PSSA results: Reading for economically disadvantaged
27
Percent scoring Advanced or Proficient
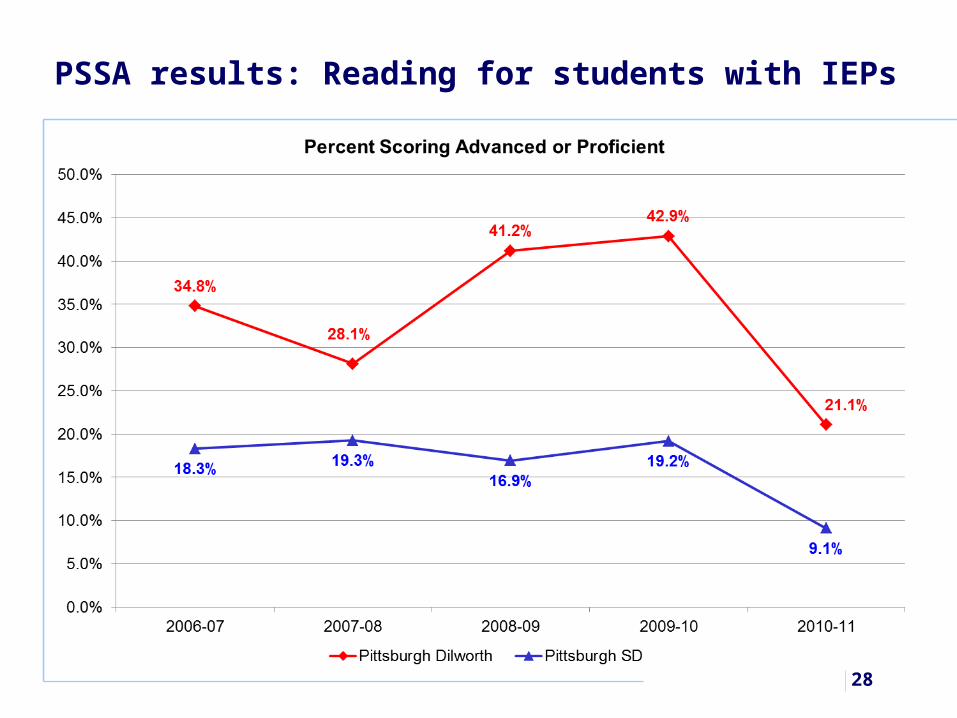
PSSA results: Reading for students with IEPs
28

29
Goldsboro and Gardendale Magnet Schools
Goldsboro and Gardendale Elementary Magnet
Schools are two of the 189 elementary magnet
schools in Florida. Goldsboro Magnet has 656
students in Pre-K to fifth grade while Gardendale
Magnet has 449 students in Pre-K to sixth grade.
Of the students who took the Florida
Comprehensive Assessment Test (FCAT) in 2011-
2012, 60 percent of the Goldsboro students and
43 percent of the Gardendale students were
economically disadvantaged (82 percent in York).
Twenty (20) percent of the Goldsboro students and 28 percent of the Gardendale students who took
the FCATs had Florida’s version of the IEP (21 percent in York).
We reviewed the FCAT math and reading test results for fourth graders at Goldsboro Elementary
and all other facilities in the Seminole County School District since that grade and school has the
most information available.
Note: We have the same charts for Gardendale Elementary available if needed

FCAT results: Math for all fourth grade students
30
What happened last year?
Last year Florida applied higher grading standards to measure proficiency in math and reading. Across the State, test results dropped by double digits.
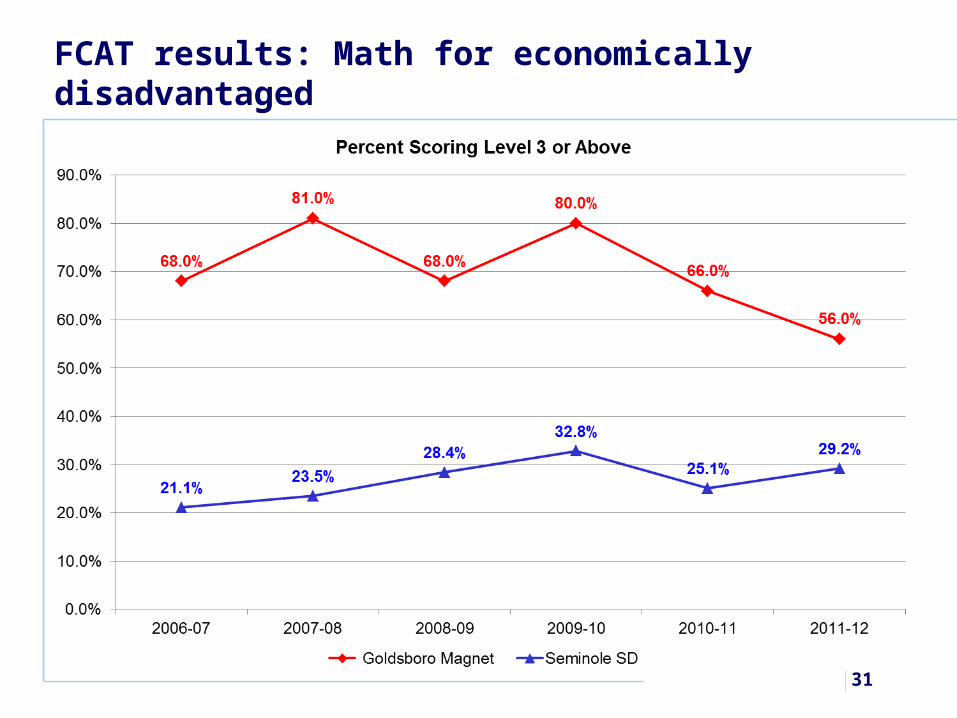
FCAT results: Math for economically disadvantaged
31

FCAT results: Math for students with ESE
32

FCAT results: Reading for fourth grade students
33
What happened last year?
Last year Florida applied higher grading standards to measure proficiency in math and reading. Across the State, test results dropped by double digits.
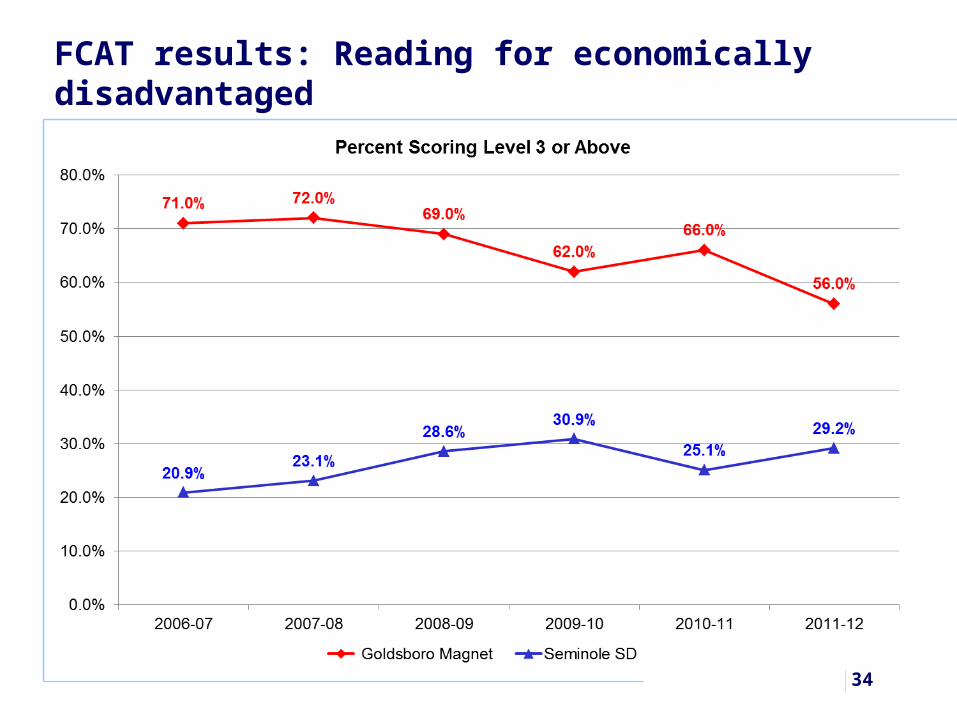
FCAT results: Reading for economically disadvantaged
34
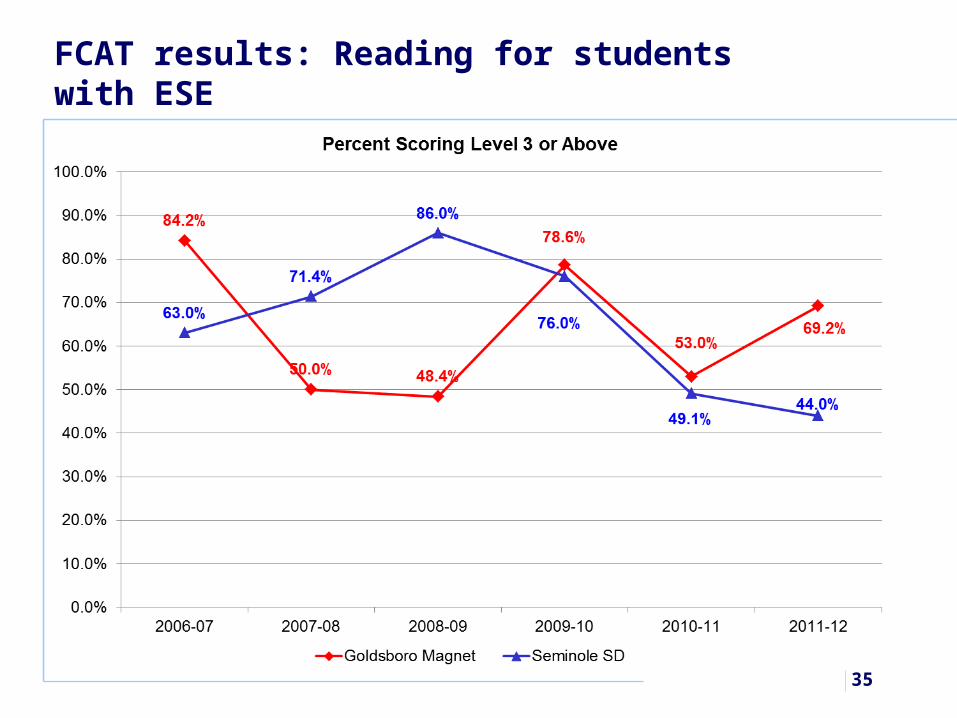
FCAT results: Reading for students with ESE
35

36
Working toward a Recovery Plan
Act 141 requires the CRO to propose and the York School Board to adopt a Recovery Plan to lead
the district into financial solvency and position it for academic success. The Recovery Plan will
outline a relatively specific strategy that the District will implement for those objectives. We need to
start moving toward the creation of that document.
Eventually we will have to select one of the two high impact options that will become the basis for
the final Plan. For now we will focus our analysis on what the Plan would look like under each
option.
Working through these specifics will help us refine the financial projections and surface issues
related to ease of implementation. As we collect information, we will share it with the Advisory
Committee.
Example: The internal transformation option proposes the creation of magnet schools. For inclusion in the Recovery Plan and refining the financial projections we need to know…
What will be the focus for the magnet schools?
Will there be admission standards like those at Conwell Russell or Pittsburgh Science and Technology?
What’s the projected enrollment?
What facility will house the students?
37
Ease of implementation
As you move toward a decision, the questions that we raised in late February related to
ease of implementation become more relevant. Here are the questions we raised on
February 28.
Does the option require a change to Commonwealth law or other action by the General
Assembly?
Does the option require the cooperation or active partnership of another School District?
Does the option require changes to collective bargaining agreements?
How long will it take to implement the option?
Who will be accountable for administering the process and do they have a track record
of success?
The second question is not relevant for the remaining high impact options, but the others
still are.