continuing education meeting: update on syphilis, gonorrhea, and chlamydia jan-jun 2002 liz lee...
TRANSCRIPT
Continuing Education Meeting:Update on Syphilis, Gonorrhea, and Chlamydia
Jan-Jun 2002
Liz LeeSenior Epidemiologist
Bureau of EpidemiologyHouston Department of Health and Human services
August 14th, 2002

STD’s in Houston/Harris County
• Syphilis
• Gonorrhea
• Chlamydia
In Houston/Harris County,
Jan-Jun 2002
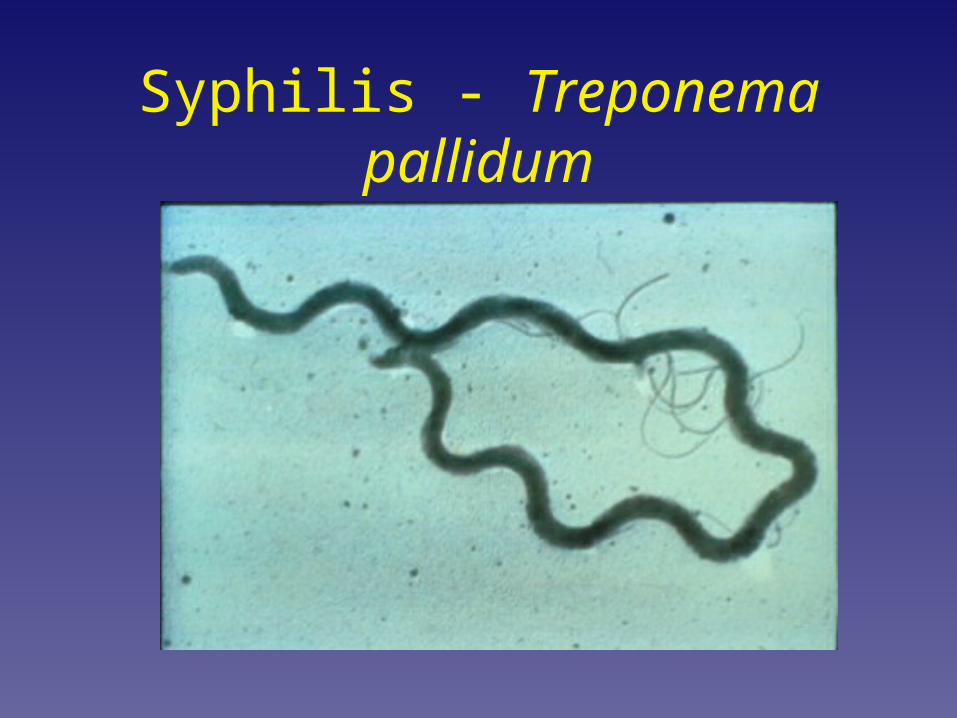
Syphilis - Treponema pallidum

Syphilis Stages of Main Concern
• Focus on Primary and Secondary Stage– INFECTIOUS!
• Infection within one year period
(Early Latent Stage) is also of concern:– Indicates MISSED infectious syphilis cases
• Syphilis in Pregnancycongenital syphilis
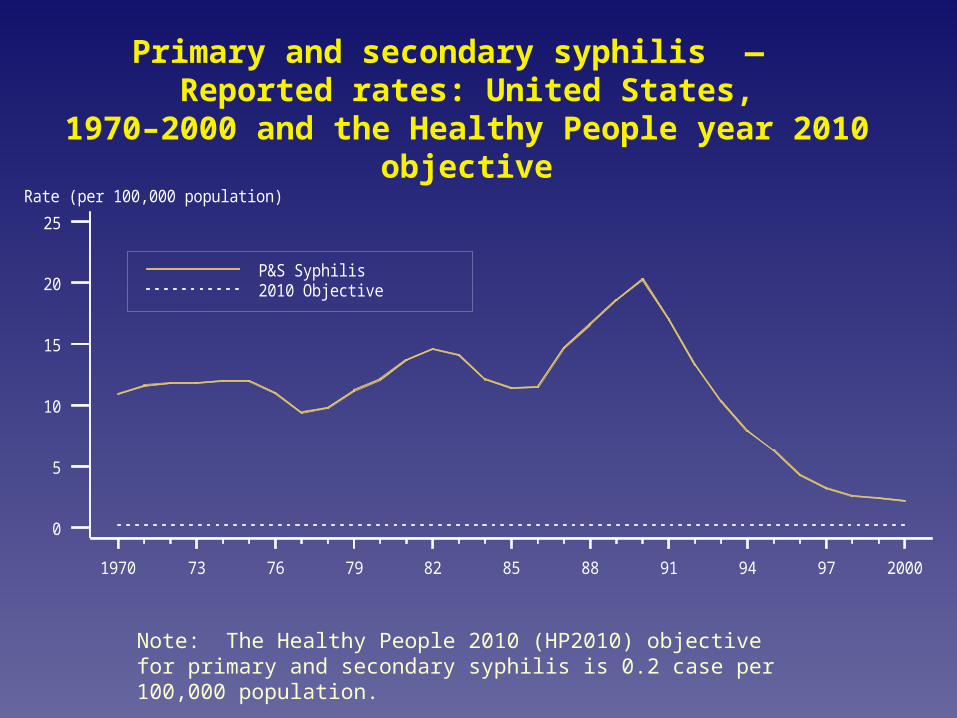
Primary and secondary syphilis — Reported rates: United States,
1970–2000 and the Healthy People year 2010 objectiveRate (per 100,000 population)
P&S Syphilis2010 Objective
0
5
10
15
20
25
1970 73 76 79 82 85 88 91 94 97 2000
Note: The Healthy People 2010 (HP2010) objective for primary and secondary syphilis is 0.2 case per 100,000 population.

Primary and secondary syphilis — Rates by gender: United States,
1981–2000 and the Healthy People year 2010 objective
Rate (per 100,000 population)
MaleFemale2010 Objective
0
5
10
15
20
25
1981 83 85 87 89 91 93 95 97 99

Primary and secondary syphilis — Rates by race and ethnicity: United States, 1981–2000 and the
Healthy People year 2010 objective
Rate (per 100,000 population)
WhiteBlackHispanicAsian/Pac IslNat Am/AK Nat2010 Objective
0
30
60
90
120
150
1981 83 85 87 89 91 93 95 97 99

Primary and secondary syphilis — Rates by state: United States and outlying areas, 2000
Note: The total rate of primary and secondary syphilis for the United States and outlying areas (including Guam, Puerto Rico and Virgin Islands) was 2.2 per 100,000 population. The Healthy People year 2010 objective is 0.2 per 100,000 population.
Rate per 100,000population
<=.2.21-4>4
VT 0.0 NH 0.2 MA 1.1 RI 0.4 CT 0.5 NJ 0.9 DE 1.2 MD 5.8
Guam 0.6
Puerto Rico 4.5 Virgin Is. 2.7
(n=14)(n=29)(n=10)
2.8
0.0
4.0 4.1
1.0 0.3
2.7
5.2
0.2
0.1
3.4 5.9
0.4
0.2 2.1
4.8
0.1
3.3
0.3
4.9
0.5
0.0
0.1 0.3
0.9
0.7
6.3
0.0
0.6
3.5
0.4
0.6
5.9
0.0
9.7
2.0
0.1
1.8
1.1
0.2
0.9
0.2

Harris County is among the 28 counties that account for over 50% of infectious syphilis cases in US
Harris County

Syphilis in Houston/Harris County
Infectious syphilis (P&S)
2000 2001 % increase from 2001 to 2002
# cases citywide 73 95 30%
# of MSM cases 10 35 250%
Alarm of potential outbreak among MSM population!
MSM=“Men who have sex with men”
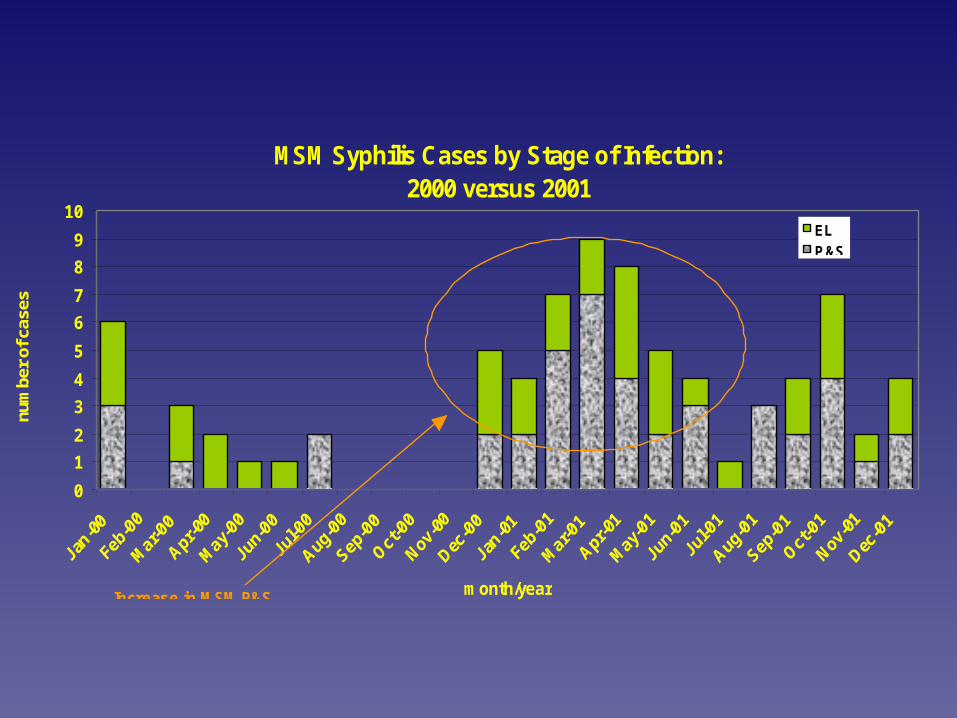
MSM Syphilis Cases by Stage of Infection:2000 versus 2001
0
1
2
3
4
5
6
7
8
9
10
month/year
num
ber
of c
ases
ELP&S
Increase in MSM P&S

Syphilis in Houston/Harris County
Infectious syphilis (P&S)
Jan-Jun 2001
Jan-Jun 2002
% increase from 2001 to 2002
# cases citywide 52 52 0%
# of MSM cases 24 28 17%
*No decrease in number of cases seen at the citywide level!
*MSM cases continuing to increase!

MSM Syphilis Cases by Stage of Infection
0
2
4
6
8
10
12
Dec
00
J an
01
Feb
01
Mar
01
Apr
01
May
01
J un
01
J ul
01
Aug
01
Sep
01
Oct
01
Nov
01
Dec
01
J an
02
Feb
02
Mar
02
Apr
02
May
02
J un
02
Month/year
Nu
mb
er o
f C
ases
EL
P & S
P&S
Outbreak
Threshold,
4 cases
P&S and EL
Outbreak
Threshold,
7 cases
. Intensif ication of MSM outbreak!

Cumulative MSM P&S syphilis cases: 2002 outbreak threshold and goal
0
5
10
15
20
25
30
35
40
Jan Feb Mar Apr May Jun Jul Aug Sep Oct Nov Dec
cum
ula
tive
P&
S c
ases
reference
2000 actual
2002 outbreak
2002 goal
2002 actual
2001 actual

Cumulative P&S syphilis cases: 2002 outbreak threshold and goal, citywide
0
10
20
30
40
50
60
70
80
90
100
Jan Feb Mar Apr May Jun Jul Aug Sep Oct Nov Dec
cum
ula
tive
nu
mb
er o
f P
&S
cas
es
reference line
2002outbreak
2002goal
2002actual
2001 actual

Outbreak Level Citywide for Infectious Outbreak Level Citywide for Infectious
(P&S) Syphilis in Houston/Harris(P&S) Syphilis in Houston/Harris
• June 2002, Citywide: – 14 cases of infectious (P&S) syphilis
• Exceeds outbreak threshold
• 64% (9 of 14) cases were MSM cases
• Urgent need to work with MSM community to provide education and screening services!
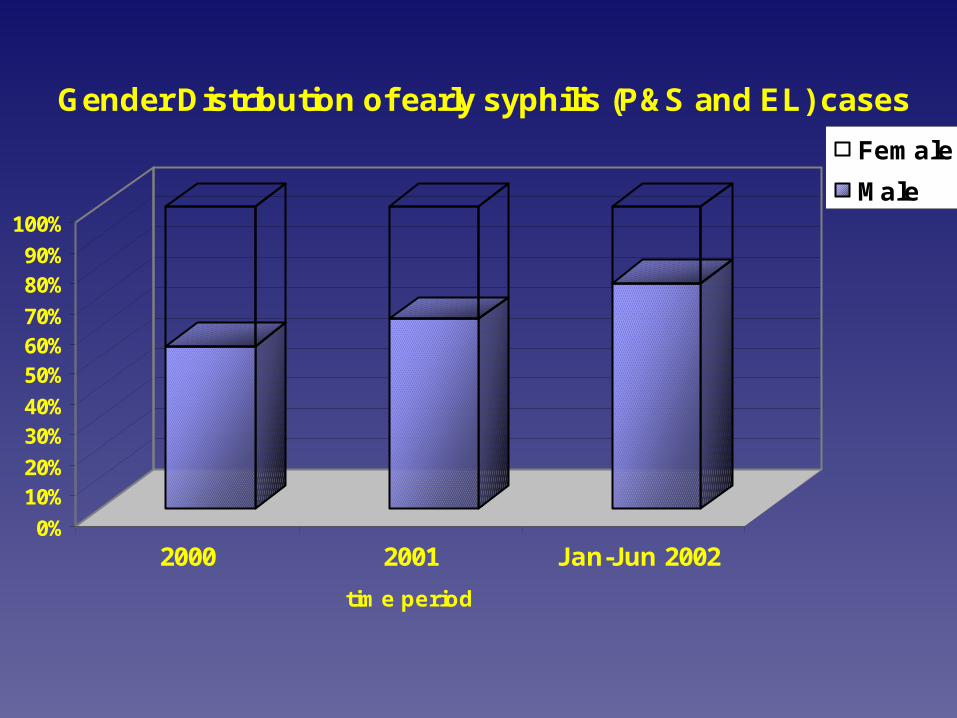
0%
10%20%
30%40%
50%60%70%
80%90%
100%
2000 2001 Jan-Jun 2002
time period
Gender Distribution of early syphilis (P&S and EL) cases
Female
Male
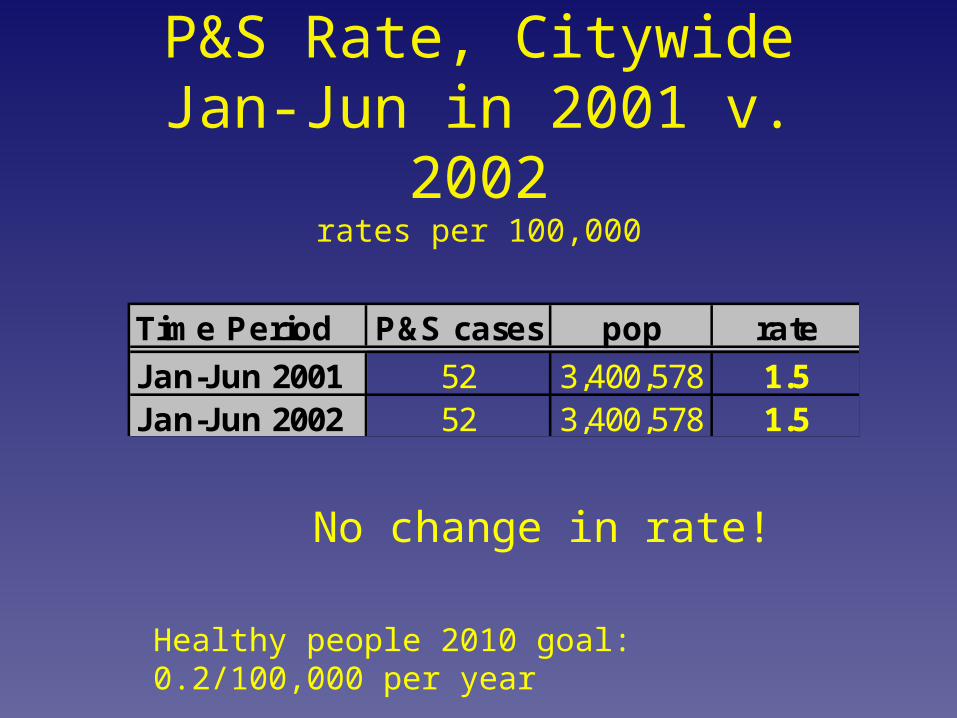
P&S Rate, CitywideJan-Jun in 2001 v. 2002
rates per 100,000
Time Period P&S cases pop rate
Jan-Jun 2001 52 3,400,578 1.5Jan-Jun 2002 52 3,400,578 1.5
No change in rate!
Healthy people 2010 goal: 0.2/100,000 per year

P&S Rate, CitywideJan-July in 2001 v. 2002
rates per 100,000
Time Period P&S cases pop rate
Jan-July 2001 54 3,400,578 1.6Jan-July 2002 61 3,400,578 1.8
Increase in rate!
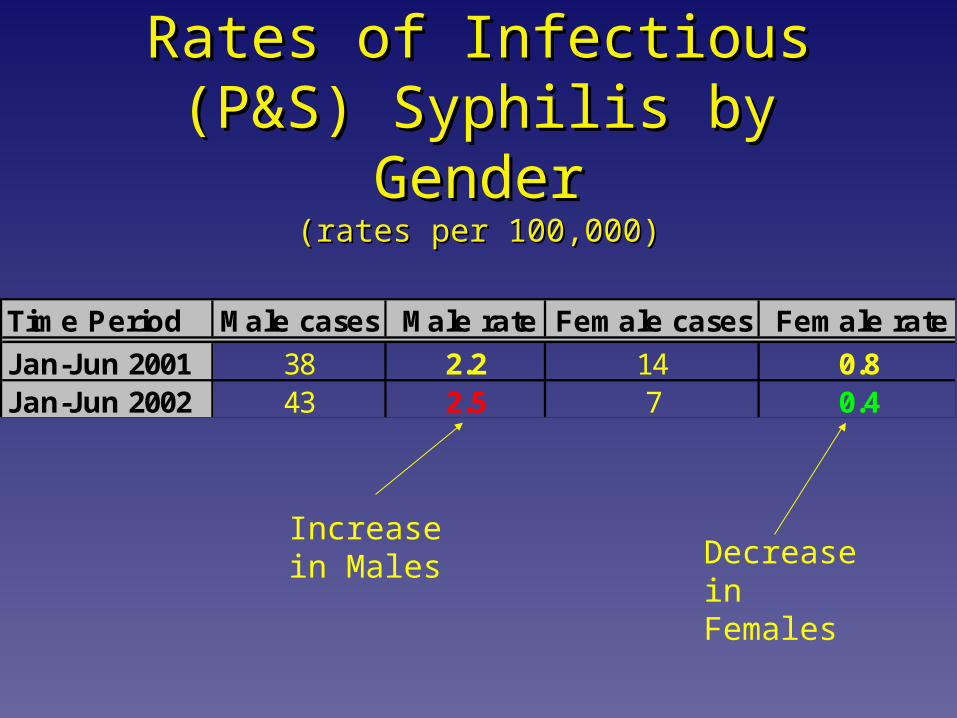
Rates of Infectious (P&S) Rates of Infectious (P&S) Syphilis by GenderSyphilis by Gender
(rates per 100,000)(rates per 100,000)
Increase in Males Decrease in
Females
Time Period Male cases Male rate Female cases Female rate
Jan-Jun 2001 38 2.2 14 0.8Jan-Jun 2002 43 2.5 7 0.4

Rates of Infectious (P&S) Syphilis Rates of Infectious (P&S) Syphilis by Age Groupsby Age Groups
(rates per 100,000)(rates per 100,000)
Age Group P&S cases rate P&S cases rate
under 15 0 0.0 1 0.115-19 6 2.4 4 1.620-29 21 3.8 12 2.230-39 14 2.5 18 3.240-49 8 1.5 12 2.350+ 3 0.4 5 0.7
Total 52 1.5 52 1.5
Jan-Jun 2002Jan-Jun 2001
Shift in Age Group:
20-29 y.o. 30-39 y.o.

Rates of Infectious Syphilis (P&S) by Race/Ethnicity
(rates per 100,000)
Race/Ethnicity P&S cases rate P&S cases rate
Asian 0 0.0 0 0.0Black 31 4.9 21 3.3Hispanic 10 0.9 12 1.1
White 11 0.8 19 1.3Other 0 0.0 0 0.0
Total 52 1.5 52 1.5
Jan-Jun 2001 Jan-Jun 2002
Largest increase in WhitesHighest rate in Blacks
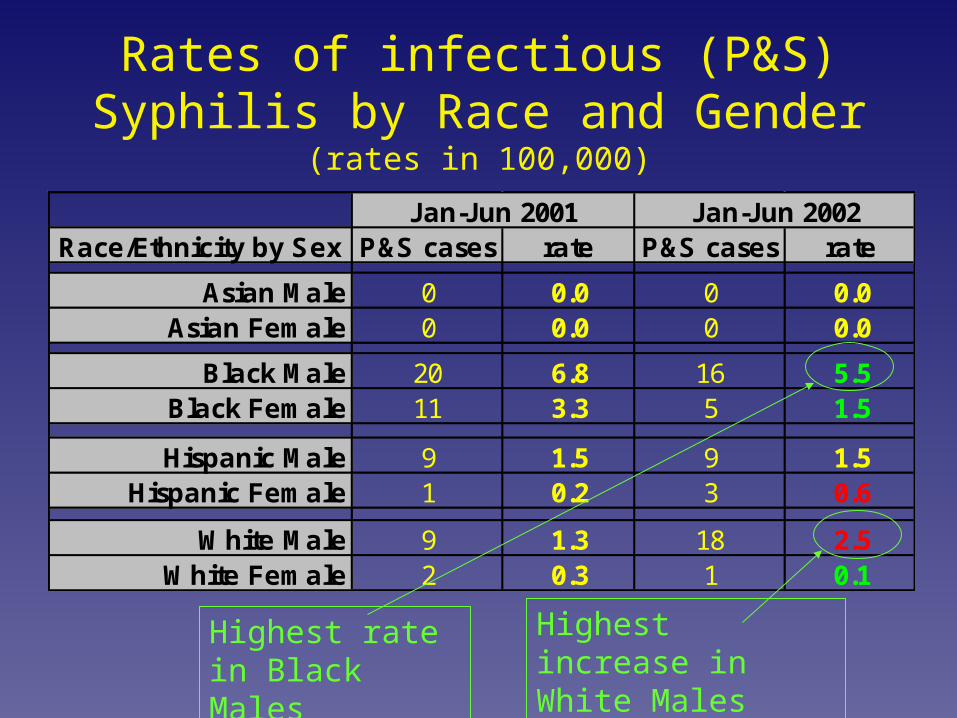
Rates of infectious (P&S) Syphilis by Race and Gender
(rates in 100,000)
Race/Ethnicity by Sex P&S cases rate P&S cases rate
Asian Male 0 0.0 0 0.0Asian Female 0 0.0 0 0.0
Black Male 20 6.8 16 5.5Black Female 11 3.3 5 1.5
Hispanic Male 9 1.5 9 1.5Hispanic Female 1 0.2 3 0.6
White Male 9 1.3 18 2.5White Female 2 0.3 1 0.1
Jan-Jun 2001 Jan-Jun 2002
Highest increase in White Males
Highest rate in Black Males

Increasing Syphilis and HIV Co-Infection Rates
Percent HIV Positive Among Interviewed Syphilis Clients with Known HIV Status
Year 2001 Jan-May 2001 Jan-May 2002
All syphilis 10% 12% 19%
Early syphilis 16% 19% 29%
Cit
y-w
ide
P&S syphilis 22% 26% 39%
All syphilis 49% 54% 56%
Early syphilis 53% 54% 58% MS
M
P&S syphilis 56% 56% 60%
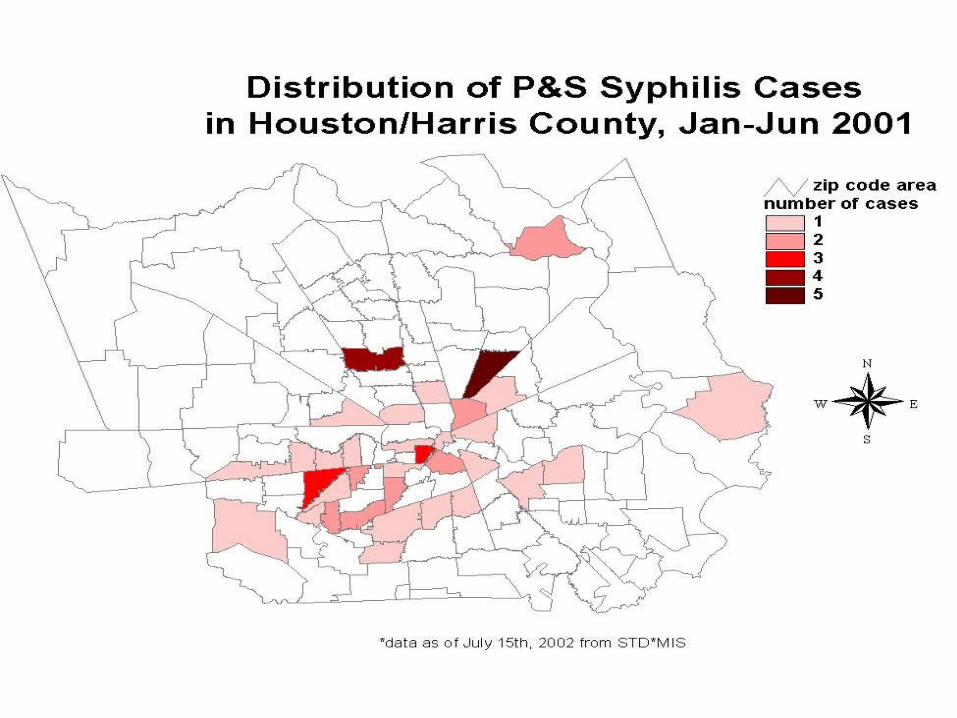


Rates: MSM, P&S J-J 2001
Rates of MSM P&S Syphilis by Zip Code Area,in Houston/Harris County, Jan-Jun 2001

Rates of MSM P&S Syphilis by Zip Code Area,in Houston/Harris County, Jan-Jun 2002
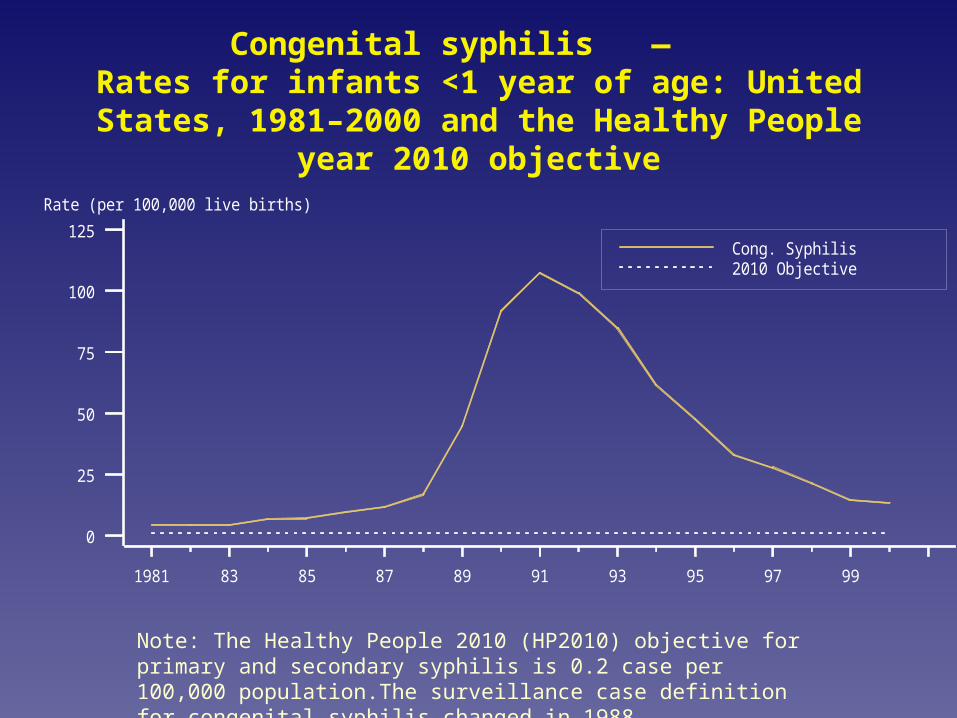
Congenital syphilis — Rates for infants <1 year of age: United States, 1981–2000
and the Healthy People year 2010 objective
Rate (per 100,000 live births)
Cong. Syphilis2010 Objective
0
25
50
75
100
125
1981 83 85 87 89 91 93 95 97 99
Note: The Healthy People 2010 (HP2010) objective for primary and secondary syphilis is 0.2 case per 100,000 population.The surveillance case definition for congenital syphilis changed in 1988.

Congenital Syphilis in Houston/Harris(rates per 100,000)
Congenital Syphilis
# of cases Crude Rates (per 100,000 births)
Year 2000 32 51Year 2001 22 34
Jan-Jun 2002 16 23*
Healthy People 2010 Objectives: 1 per 100,000!

Congenital Syphilis by Race/Ethnicity(rate per 100,000)
# cases rate # cases rate # cases rateBlacks 19 168 8 69 10 85Hispanics 11 37 12 38 5 15Whites 2 11 1 5 1 5
Year 2001 Jan-Jun 2002Congenital Syphilis
Year 2000
*Highest rate in Blacks
*Rate as of June already exceeds 2001 levels
In Houston/Harris County,
Jan-Jun 2002

4% Decrease in Gonorrhea
• Jan-Jun 2001• 2559 cases reported
• 75/100,000
• Jan-Jun 2002• 2464 cases reported
• 72/100,000
Healthy People 2000 goal: 100/100,000 per year

1289 12651310
1150
0
200
400
600
800
1000
1200
1400
Nu
mb
er
of
Ca
se
s
Jan-Jun 2001 Jan-Jun 2002Report Period
Gonorrhea by Gender
male
female
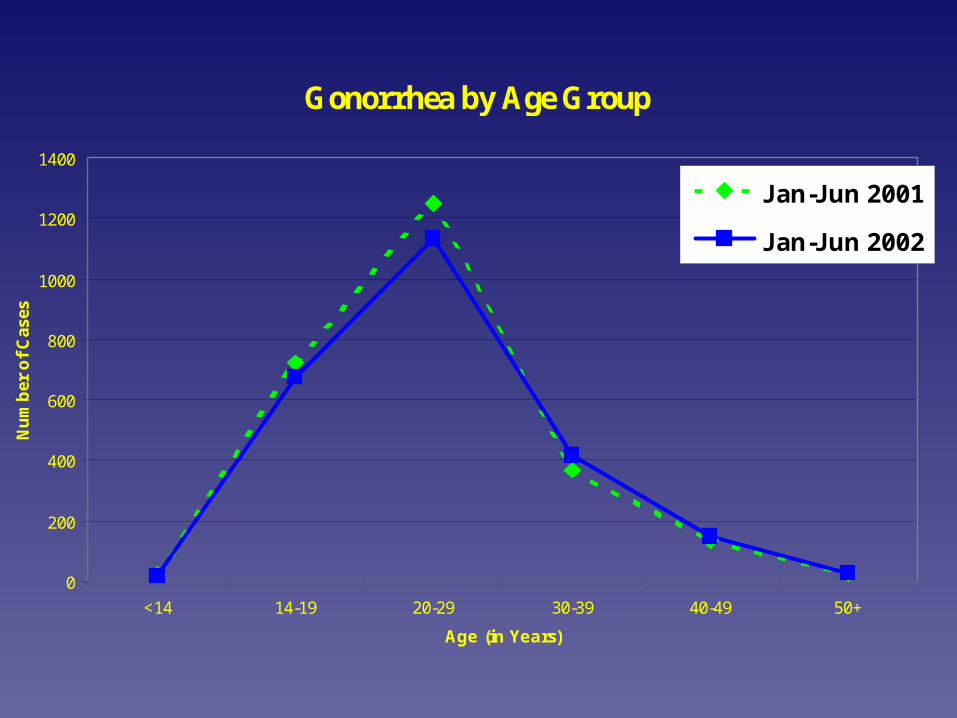
Gonorrhea by Age Group
0
200
400
600
800
1000
1200
1400
<14 14-19 20-29 30-39 40-49 50+
Age (in Years)
Nu
mb
er o
f C
ases
Jan-Jun 2001
Jan-Jun 2002
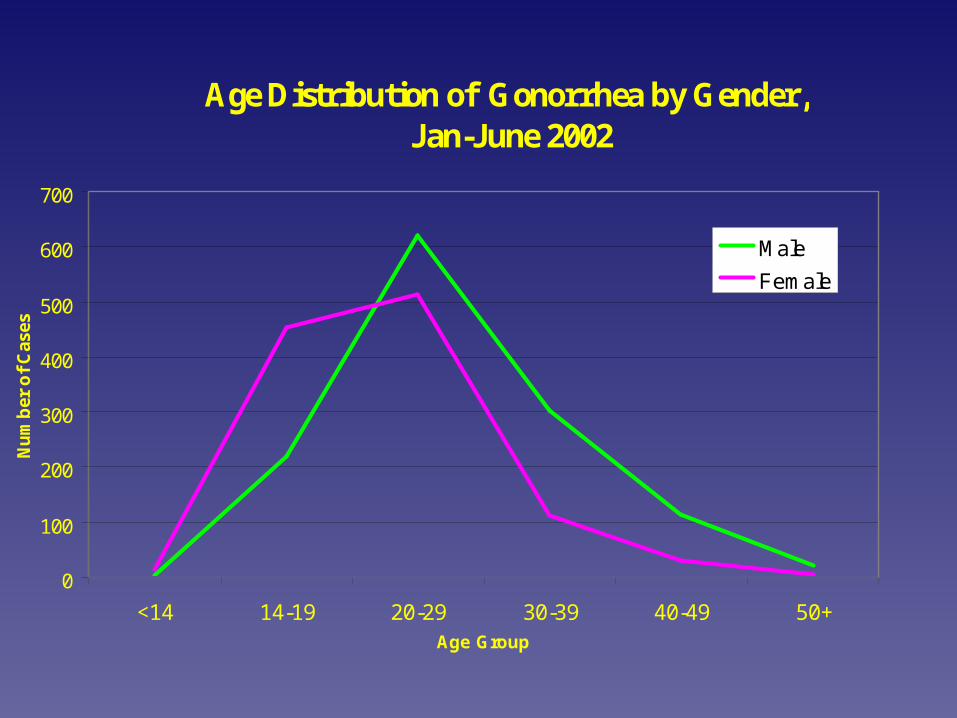
Age Distribution of Gonorrhea by Gender, Jan-June 2002
0
100
200
300
400
500
600
700
<14 14-19 20-29 30-39 40-49 50+Age Group
Nu
mb
er o
f C
ases
Male
Female

Gonorrhea Rates by Race/Ethnicity
*rates per 100,000
Houston/ Harris County
Jan-Jun 2001 rate
Jan-Jun 2002 rate
white 7.1 5.9black 248.7 225.8asian 9.8 11.6hispanic 26.3 22.8
Highest rate among African-Americans
Increase among Asians
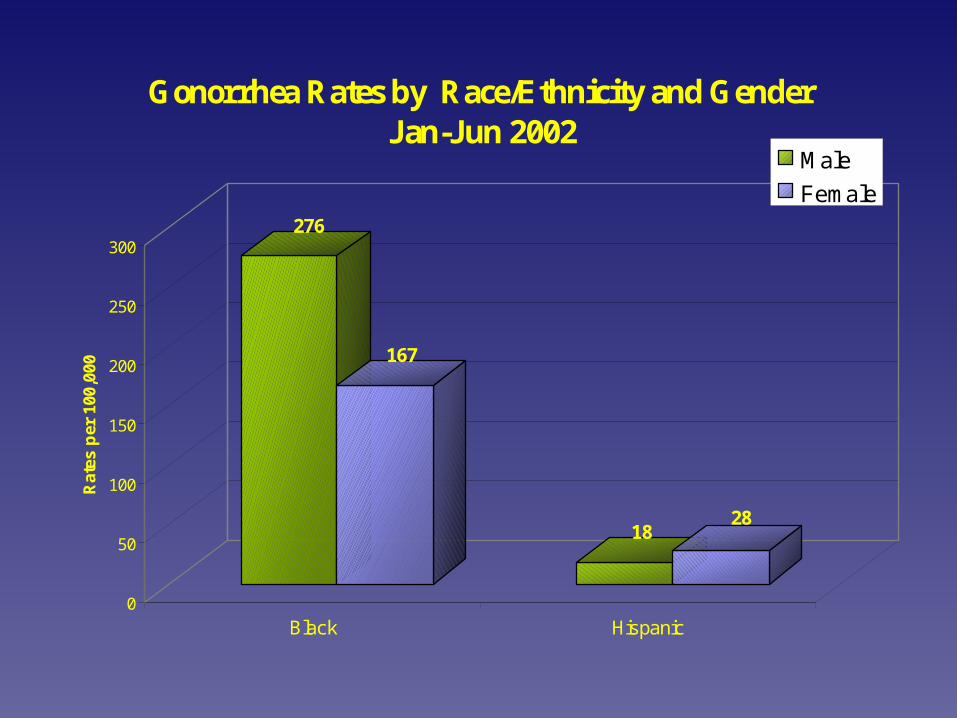
276
167
1828
0
50
100
150
200
250
300
Rat
es p
er 1
00,0
00
Black Hispanic
Gonorrhea Rates by Race/Ethnicity and GenderJan-Jun 2002
Male
Female
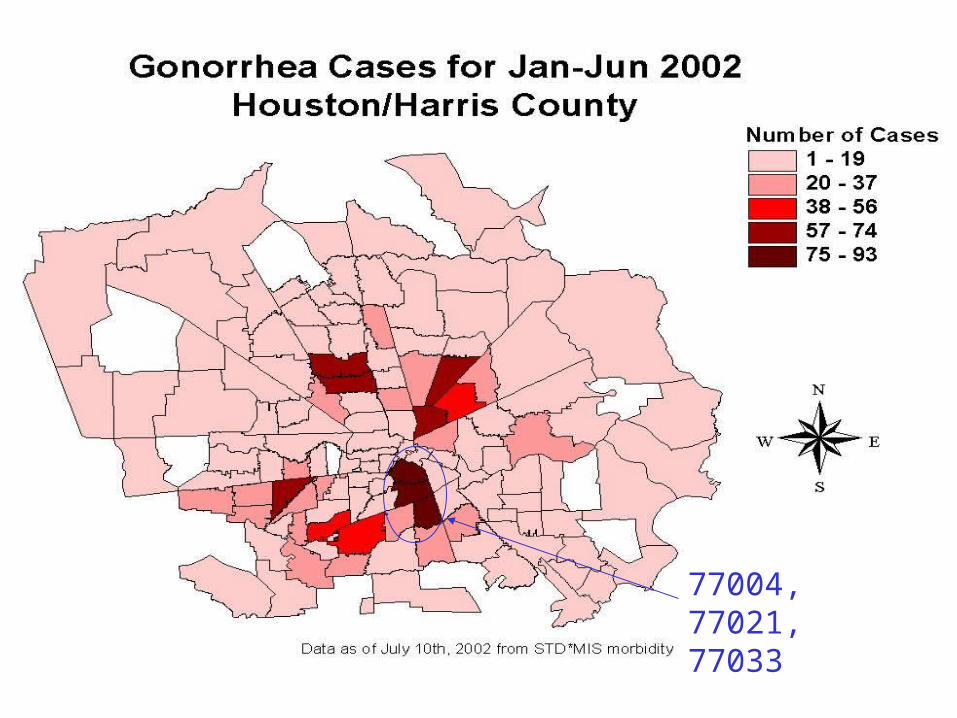
77004, 77021, 77033

Distribution of Gonorrhea by Provider
Provider Type # cases % cases
HDHHS STD Clinics 970 39%HDHHS Family Planning 35 1%HDHHS Maternity 21 1%Private MD/HMO 906 37%Jail/Correctional 29 1%Other 503 21%Total 2464 100%
Distribution of gonorrhea cases by provider type, Jan-Jun 2002, n=2464

Distribution of gonorrhea cases by provider type, Jan-Jun 2002, n=2464 HDHHS STD Clinics
HDHHS Family Planning
HDHHS Maternity
Private MD/HMO
Jail/Correctional
Other

In Houston/Harris County,
Jan-Jun 2002
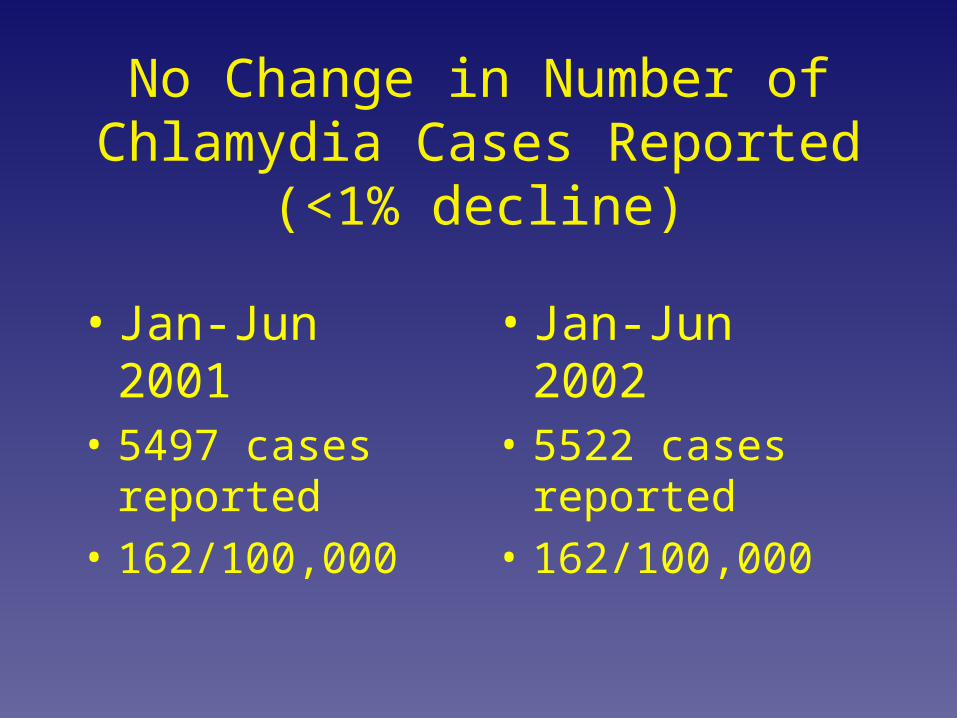
No Change in Number of Chlamydia Cases Reported(<1% decline)
• Jan-Jun 2001• 5497 cases reported
• 162/100,000
• Jan-Jun 2002• 5522 cases reported
• 162/100,000

832
4683
898
4569
0
500
1000
1500
2000
2500
3000
3500
4000
4500
5000
Nu
mb
er
of
Ca
se
s
Jan-Jun 2001 Jan-Jun 2002
Report Period
Chlamydia by Gender
Male
Female

0
500
1000
1500
2000
2500
Nu
mb
er
of
Ca
se
s
<14 14-19 20-24 25-29 30-34 35-39 40-49 50+
Age (in Years)
Chlamydia by Age Group
Jan-Jun 2001
Jan-Jun 2002
Largest proportion among 14-19 y.o.

274
248
142 135
15 14
0
50
100
150
200
250
300
Ra
te p
er
10
0,0
00
*
Black Hispanic White
Race/Ethnicity
Chlamydia Rate per 100,000 by Race/Ethnicity
Jan-Jun 2001
Jan-Jun 2002
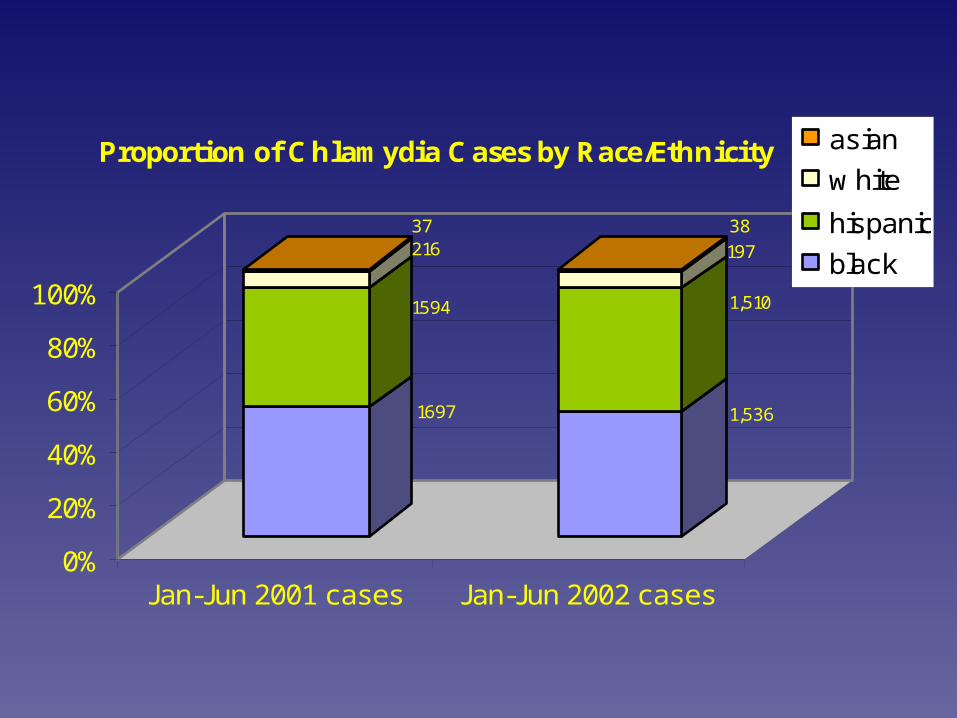
1697
1594
21637
1,536
1,510
19738
0%
20%
40%
60%
80%
100%
Jan-Jun 2001 cases Jan-Jun 2002 cases
Proportion of Chlamydia Cases by Race/Ethnicity asian
w hite
hispanic
black

77088
7703377033

Distribution of Reported Chlamydia by Provider
Provider Type Percent
HDHHS STD Clinic 11.5%HDHHS Family Planning 7.3%HDHHS Maternity 5.0%Jail/Correctional Facility 2.5%Hospitals 6.7%Private MD/HMO 54.7%Other 12.3%
Total 100.0%
Distribution of Reported Chlamydia by Provider Type, Jan-Jun 2002

Take Home Messages• Houston is experiencing an outbreak of infectious
syphilis• Largest increase in infectious syphilis rates between
2001 to 2002 in White Males• Urgent need to work with private sector and CBO’s
to target intervention program in high risk areas: – Provider/DIS--enhance education and screening
• Increase in congenital syphilis in Houston– Urgent need to improve screening of women of
reproductive age and provide quality prenatal care and appropriate referrals to get adequate treatment
Additional Resources
• www.stdhivtraining.org– On-Line Chlamydia Course
• Latest screening, diagnosis, and treatment of chlamydia
• www.houstonhealth.org– Selected slides from this presentation
• Syphilis, gonorrhea, and chlamydia in Houston/Harris County