continuing operational delivery and progress implementing ... · continuing operational delivery...
TRANSCRIPT

Continuing operational delivery and
progress implementing strategy QinetiQ Group plc Interim results for half year ended 30 September 2016
17 November 2016

Introduction Steve Wadey| Chief Executive Officer

Agenda
1 Headlines
2 Financial overview
3 Strategic overview
4 Q&A
3 Interim results for the half year ended 30 September 2016

Headlines
• Delivered solid operational performance in H1 FY17 – Stable revenue and profit with continued high cash conversion
– 5% increase in interim dividend in line with commitment to a progressive dividend; £17m remaining of the share buyback programme
• Focus on delivery of FY17 – 94% of FY17 revenue under contract, consistent with prior period (90%)
– Maintaining expectations for Group performance in the current financial year
• Progress implementing strategy – Orders increase due to £109m 11-year renewal for UK Naval Combat System Integration
Support Services (NCSISS) and $28m US aircraft carrier orders
– Transformation programme on track to improve customer focus and competitiveness
4 Interim results for the half year ended 30 September 2016

Financial overview David Mellors| Chief Financial Officer
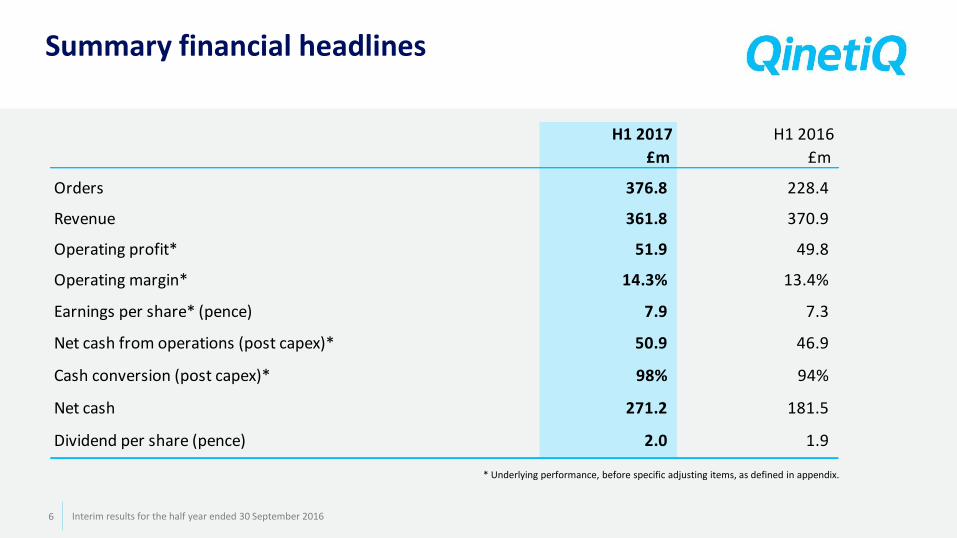
Summary financial headlines
* Underlying performance, before specific adjusting items, as defined in appendix.
6 Interim results for the half year ended 30 September 2016
H1 2017 H1 2016
£m £m
Orders 376.8 228.4
Revenue 361.8 370.9
Operating profit* 51.9 49.8
Operating margin* 14.3% 13.4%
Earnings per share* (pence) 7.9 7.3
Net cash from operations (post capex)* 50.9 46.9
Cash conversion (post capex)* 98% 94%
Net cash 271.2 181.5
Dividend per share (pence) 2.0 1.9

Orders
Global Products
EMEA Services
• EMEA Services
– Timing of multi-year awards – £137.2m H1 2017 v £16.9m H1 2016
– H1 2017 £109m 11-year renewal for UK Naval Combat System Integration Support Services (NCSISS)
• Global Products
– QinetiQ North America awarded $28m US aircraft carrier orders
7 Interim results for the half year ended 30 September 2016
228.4 (3.8) 1.8 120.3 (4.8) 8.6 26.3 376.8
H1 2016 Cyveillancedisposal
EMEAServices -
FX
EMEAServices -Timing ofmulti-yearcontracts
EMEAServices -
Other
GlobalProducts -
FX
GlobalProducts -
Other
H1 2017
£ m
illio
n
170.8
92.5
284.3
57.6
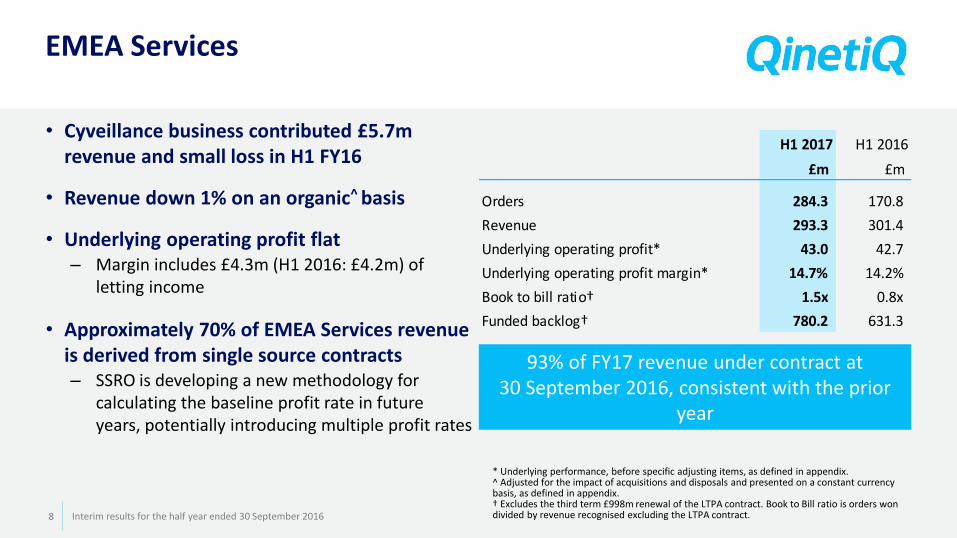
EMEA Services
* Underlying performance, before specific adjusting items, as defined in appendix. ^ Adjusted for the impact of acquisitions and disposals and presented on a constant currency basis, as defined in appendix. † Excludes the third term £998m renewal of the LTPA contract. Book to Bill ratio is orders won divided by revenue recognised excluding the LTPA contract.
• Cyveillance business contributed £5.7m revenue and small loss in H1 FY16
• Revenue down 1% on an organic^ basis
• Underlying operating profit flat – Margin includes £4.3m (H1 2016: £4.2m) of
letting income
• Approximately 70% of EMEA Services revenue is derived from single source contracts – SSRO is developing a new methodology for
calculating the baseline profit rate in future years, potentially introducing multiple profit rates
93% of FY17 revenue under contract at 30 September 2016, consistent with the prior
year
8 Interim results for the half year ended 30 September 2016
H1 2017 H1 2016
£m £m
Orders 284.3 170.8
Revenue 293.3 301.4
Underlying operating profit* 43.0 42.7
Underlying operating profit margin* 14.7% 14.2%
Book to bill ratio† 1.5x 0.8x
Funded backlog† 780.2 631.3

Global Products
* Underlying performance, before specific adjusting items, as defined in appendix.
98% of FY17 revenue under contract at 30 September 2016, compared to 81% in the
prior year
9 Interim results for the half year ended 30 September 2016
H1 2017 H1 2016
£m £m
Orders 92.5 57.6
Revenue 68.5 69.5
Underlying operating profit* 8.9 7.1
Underlying operating profit margin* 13.0% 10.2%
Book to bill ratio 1.4x 0.8x
Funded backlog 171.8 101.4
-
50
100
H1 2017 H1 2016Armor Robots
Other US Global Products Space Products
OptaSense Other EMEA Global Products
HY revenue (£m)

Movements in net cash
* Underlying performance, before specific adjusting items, as defined in appendix. 10 Interim results for the half year ended 30 September 2016
274.5 67.0 (9.7) (6.4) (8.5) (26.0) (21.9) 2.2 271.2
Net cash31 Mar 16
Operating cashflow, before
pension deficitrepair
Net capex Pension deficitrepair
Tax & netinterest
Share buyback Dividends Other Net cash30 Sep 16
£ m
illi
on
£42.4m free cash flow*
£47.9m shareholder returns
98% cash conversion*
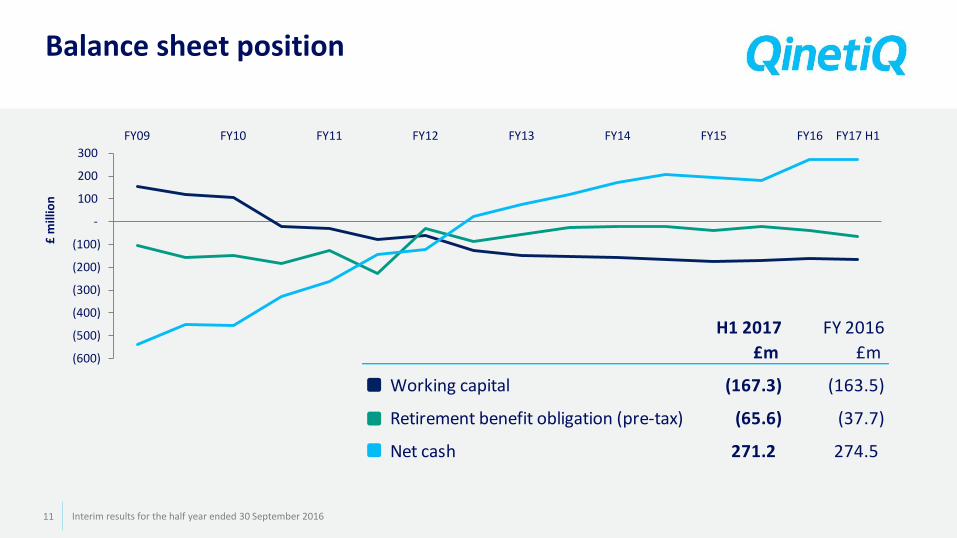
Balance sheet position
11 Interim results for the half year ended 30 September 2016
H1 2017 FY 2016
£m £m
Working capital (167.3) (163.5)
Retirement benefit obligation (pre-tax) (65.6) (37.7)
Net cash 271.2 274.5
(600)
(500)
(400)
(300)
(200)
(100)
-
100
200
300
FY09 FY10 FY11 FY12 FY13 FY14 FY15 FY16 FY17 H1
£ m
illio
n

Capital allocation policy
Invest in our organic capabilities,
complemented by bolt-on acquisitions
where there is a strong strategic fit
Priority 1
Maintain the necessary balance
sheet strength
Priority 2
Provide a progressive dividend
to shareholders
Priority 3
Return excess cash to shareholders
Priority 4
12 Interim results for the half year ended 30 September 2016

FY17 outlook
EMEA Services In FY17, the UK Government’s Strategic Defence and Security Review, together with ongoing defence transformation, are expected to continue to have an impact on the UK defence market. This will provide future opportunities for EMEA Services to build on its strong record of delivering more for less, while recognising that there may continue to be some uncertainty and the potential for interruptions to order flow. At 30 September 2016, revenue under contract for FY17 was in line with the prior year, and the division’s performance as a whole is expected to remain steady this year.
Global Products The Group’s Global Products division has shorter order cycles than EMEA Services. At 30 September 2016, FY17 revenue under contract was above that of a year ago, but the performance of Global Products remains dependent on the timing of shipments of key orders.
Group performance Overall, the Board’s expectations for Group performance this financial year remain unchanged.
13 Interim results for the half year ended 30 September 2016

Strategic overview Steve Wadey| Chief Executive Officer
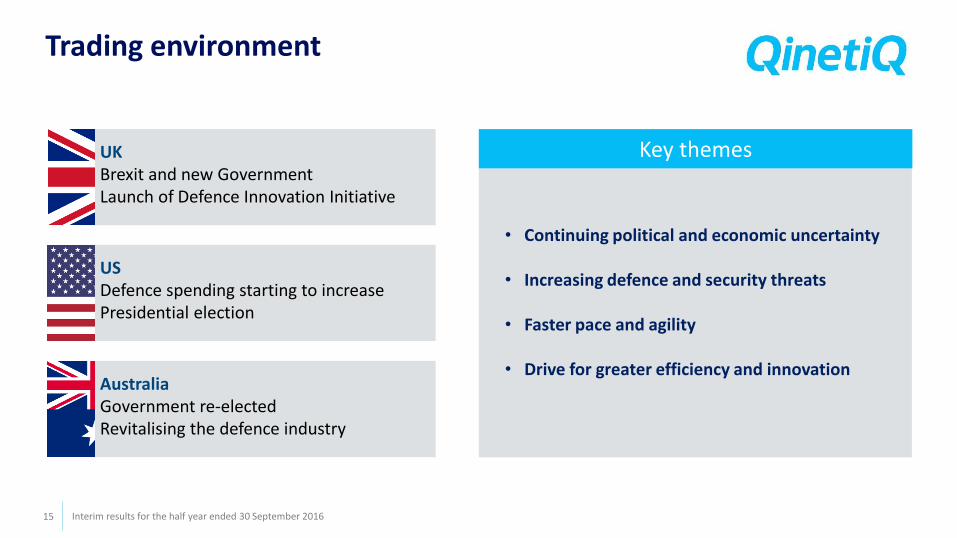
Trading environment
• Continuing political and economic uncertainty
• Increasing defence and security threats
• Faster pace and agility
• Drive for greater efficiency and innovation
Key themes UK Brexit and new Government Launch of Defence Innovation Initiative
US Defence spending starting to increase Presidential election
Australia Government re-elected Revitalising the defence industry
15 Interim results for the half year ended 30 September 2016

Our vision and strategy
Lead and modernise the UK
Defence Test & Evaluation
enterprise, by working in
partnership with Government
and prime contractors
Build an international company that delivers additional value to our
customers by developing our home markets, creating new home markets and exporting
Invest in and apply our core competence for customer advantage in defence and
commercial markets
“The chosen partner around the world for mission-critical solutions, innovating for our customers’ advantage”
UK International Innovation
Transformation programme Improving customer focus and competitiveness
16 Interim results for the half year ended 30 September 2016

Transforming customer focus and competitiveness
17
• Strengthened leadership team
• Reorganised the company
• Driving performance management
• Driving integrated business planning
• Dynamic resource management
• Streamlining processes
Leadership and organisation
Operational excellence
• Created an International business
• Focusing on campaigns
• Upskilling teams
• Increased Internal Research & Development
• Delivering savings to reinvest
• Focusing on organic and inorganic growth
Business winning
Investing in our future
Interim results for the half year ended 30 September 2016 17

Delivering modern UK Defence Test & Evaluation
New innovative service model performing
Innovation to deliver more for less
Air Strategic Enterprise
Naval Combat System Integration Support Services
Shaping and enabling future capability
Unmanned Warrior
18 Interim results for the half year ended 30 September 2016
•£31m added to 5-year contract • Six new platforms; Wildcat, Puma,
Apache, Merlin, Gazelle, Tornado
•£109m 11-year contract renewal •Developing and de-risking Royal
Navy mission systems
•World’s first multi-national demo •Environment to experiment &
test new disruptive capabilities

Building an international company
North America Australia
Stabilised and focusing on growth Developing growth strategy
New International business unit
Customer focus
19 Interim results for the half year ended 30 September 2016
•Developing markets in Canada, Sweden and UAE •Export team and campaigns
• Strong order intake and good operational performance •Developing team partnering
•Continued growth in orders •Defence Science and Technology
Group (DSTG) strategic alliance

Innovating for our customers’ needs
20 Interim results for the half year ended 30 September 2016
Over 30 major campaigns identified
Exploitation of investment
Major government programmes
Major near-term competitions
QinetiQ strategic capability
Strategic partnering and investment
• Future Combat Air •Next generation robots
•Test and Evaluation •Cyber security
• Laser capability •Australian strategic
support partner
• Secure Navigation •OptaSense

Summary
Delivered solid
operational
performance
Focusing on delivery of FY17
Progress implementing
strategy
21 Interim results for the half year ended 30 September 2016

Q&A
22
QinetiQ is a founding member of The 5% Club, an industry-led initiative to grow the
number of young people on apprenticeships and graduate programmes.
www.5percentclub.org.uk

Appendices
QinetiQ App for tablets and smart phones

Definitions
Underlying performance is stated before: – Amortisation of intangibles arising from acquisitions
– Pension net finance expense
– Gains/losses on business divestments and disposal of investments and property
– Impairment of goodwill and other intangible assets
– Tax on the above items
– Significant non-recurring deferred tax movements
Organic growth: – Is calculated at constant foreign exchange rates, adjusting the comparatives to incorporate the results of
acquired entities and excluding the results for any disposals for the same duration of ownership as the current period
24 Interim results for the half year ended 30 September 2016
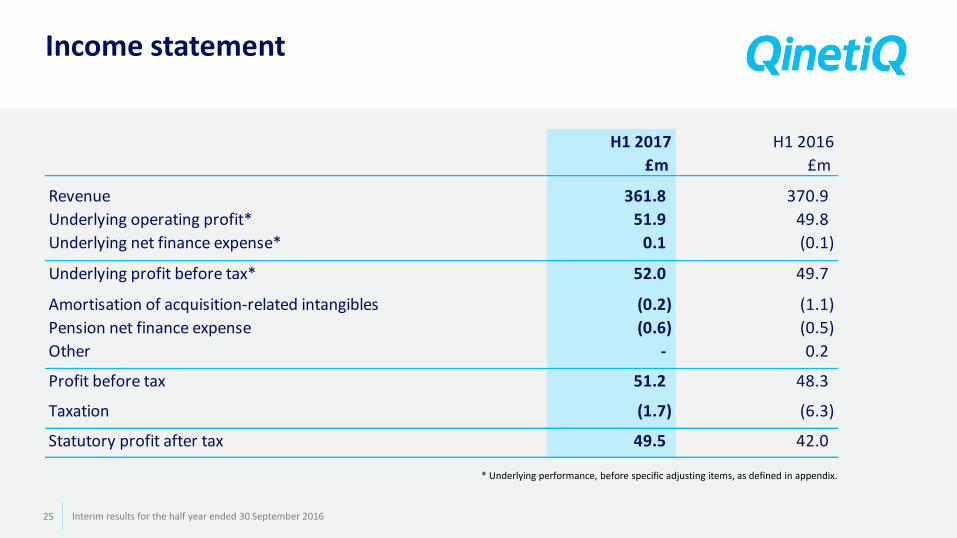
Income statement
* Underlying performance, before specific adjusting items, as defined in appendix.
25 Interim results for the half year ended 30 September 2016
H1 2017 H1 2016
£m £m
Revenue 361.8 370.9
Underlying operating profit* 51.9 49.8
Underlying net finance expense* 0.1 (0.1)
Underlying profit before tax* 52.0 49.7-
Amortisation of acquisition-related intangibles (0.2) (1.1)
Pension net finance expense (0.6) (0.5)
Other - 0.2
Profit before tax 51.2 48.3
Taxation (1.7) (6.3)
Statutory profit after tax 49.5 42.0#

Specific adjusting items*
* Specific adjusting items are defined in appendix.
26 Interim results for the half year ended 30 September 2016
H1 2017 H1 2016
£m £m
Items with cash impact
Profit on disposal of property - 0.2
Non-cash items
Amortisation of acquired intangibles (0.2) (1.1)
Pension net finance expense (0.6) (0.5)
Total specific adjusting items (pre-tax) (0.8) (1.4)
Tax impact of items above 0.1 0.2
Recognition of non-trading UK tax losses 4.1 -
Other non-trading deferred tax movement 0.6 -
Total specific adjusting items 4.0 (1.2)
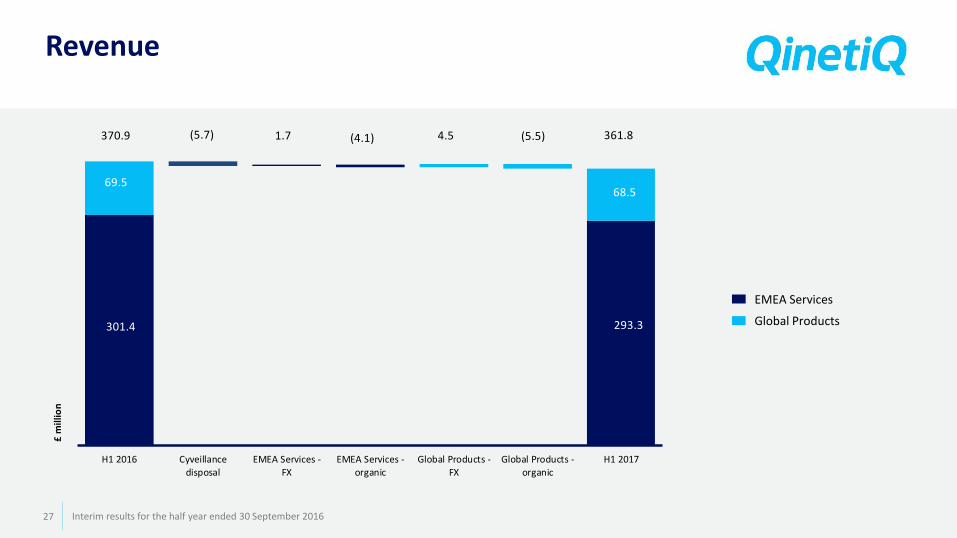
Revenue
Global Products
EMEA Services
27 Interim results for the half year ended 30 September 2016
370.9 (5.7) 1.7 (4.1) 4.5 (5.5) 361.8
H1 2016 Cyveillancedisposal
EMEA Services -FX
EMEA Services -organic
Global Products -FX
Global Products -organic
H1 2017
£ m
illio
n
301.4
68.5
293.3
69.5
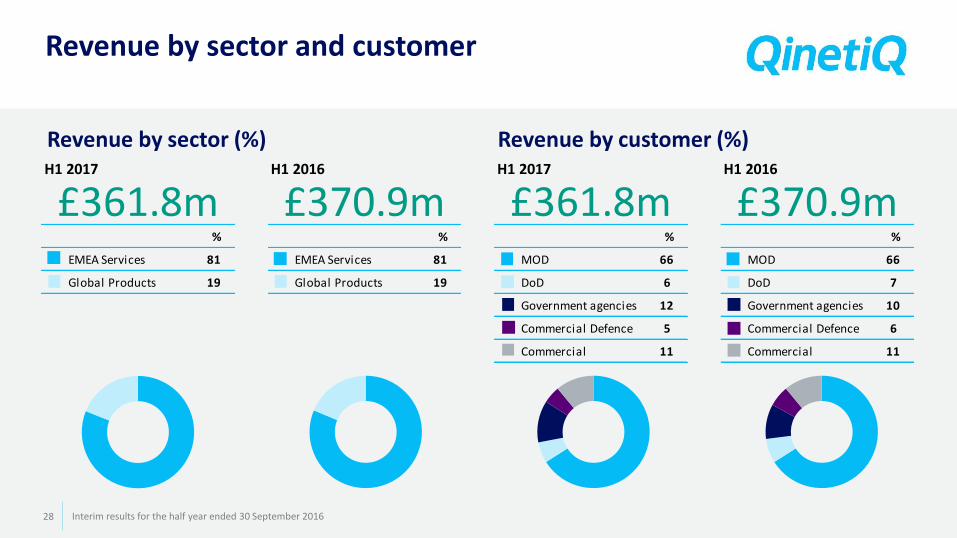
Revenue by sector and customer
Revenue by sector (%) Revenue by customer (%)
28 Interim results for the half year ended 30 September 2016
H1 2017
%
EMEA Services 81
Global Products 19
£361.8mH1 2016
%
EMEA Services 81
Global Products 19
£370.9mH1 2017
%
MOD 66
DoD 6
Government agencies 12
Commercial Defence 5
Commercial 11
£361.8mH1 2016
%
MOD 66
DoD 7
Government agencies 10
Commercial Defence 6
Commercial 11
£370.9m

Taxation
* Underlying performance, before specific adjusting items, as defined in appendix.
29 Interim results for the half year ended 30 September 2016
H1 2017 H1 2016
£m £m
Underlying tax charge* (6.5) (6.5)
Tax on non-recurring items 4.8 0.2
Headline tax charge (1.7) (6.3)
Underlying tax rate* 12.5% 13.1%
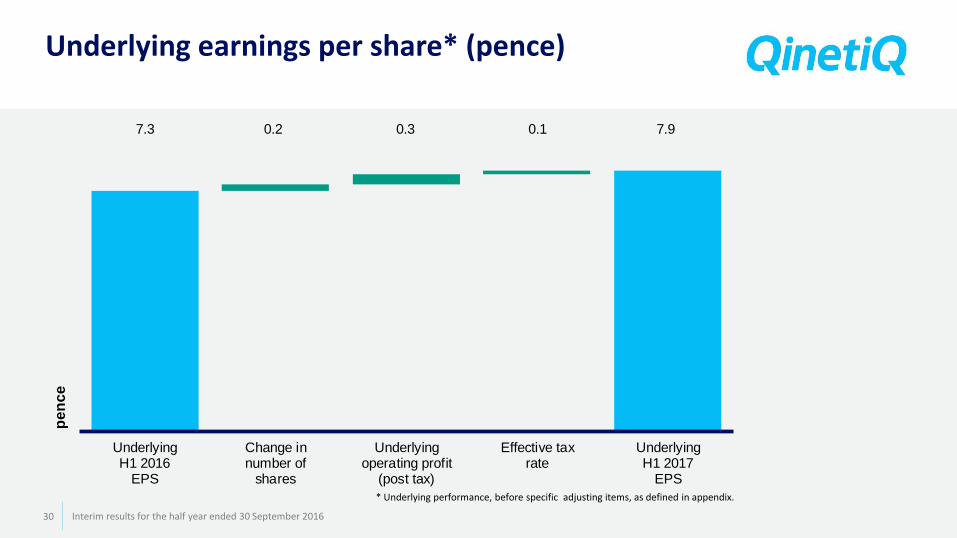
Underlying earnings per share* (pence)
* Underlying performance, before specific adjusting items, as defined in appendix.
30 Interim results for the half year ended 30 September 2016
7.3 0.2 0.3 0.1 7.9
UnderlyingH1 2016
EPS
Change innumber of
shares
Underlyingoperating profit
(post tax)
Effective taxrate
UnderlyingH1 2017
EPS
pe
nc
e
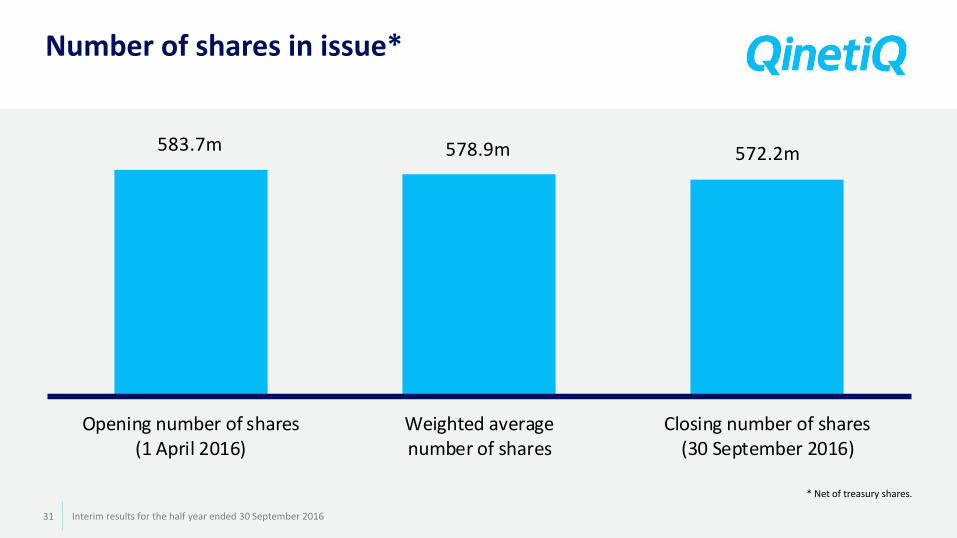
Number of shares in issue*
* Net of treasury shares.
31 Interim results for the half year ended 30 September 2016
583.7m 578.9m 572.2m
Opening number of shares(1 April 2016)
Weighted averagenumber of shares
Closing number of shares(30 September 2016)

Balance sheet
32 Interim results for the half year ended 30 September 2016
30 September 2016 31 March 2016
£m £m
Goodwill 77.7 73.1
Intangible assets 7.9 8.3
Property, plant and equipment 230.6 233.4
Working capital (167.3) (163.5)
Retirement benefit obligation (net of tax) (58.8) (36.2)
Other assets and liabilities (52.5) (64.8)
Net cash 271.2 274.5
Net assets 308.8 324.8
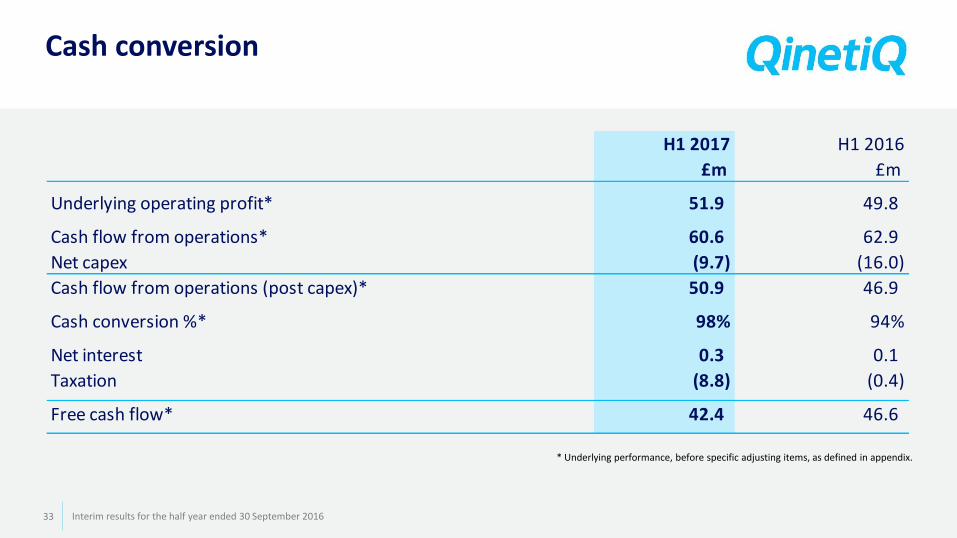
Cash conversion
* Underlying performance, before specific adjusting items, as defined in appendix.
33 Interim results for the half year ended 30 September 2016
H1 2017 H1 2016
£m £m
Underlying operating profit* 51.9 49.8
Cash flow from operations* 60.6 62.9
Net capex (9.7) (16.0)
Cash flow from operations (post capex)* 50.9 46.9
Cash conversion %* 98% 94%
Net interest 0.3 0.1
Taxation (8.8) (0.4)
Free cash flow* 42.4 46.6

Movements in net cash
* Underlying performance, before specific adjusting items, as defined in appendix.
34 Interim results for the half year ended 30 September 2016
H1 2017 H1 2016
£m £m
Free cash flow* 42.4 46.6
Business divestments - 6.2
Purchase of own shares (26.3) (45.3)
Dividends (21.9) (21.2)
Other (0.6) 0.3
Change in net cash before FX (6.4) (13.4)
FX translation impact 3.1 (0.6)
Change in net cash (3.3) (14.0)
Opening net cash - 1 April 274.5 195.5
Closing net cash - 30 September 271.2 181.5

Defined benefit pension scheme – IAS 19 balance sheet position
35 Interim results for the half year ended 30 September 2016
30 September 2016 31 March 2016
£m £m
Equities - quoted 408.2 347.9
Equities - unquoted 71.7 66.1
LDI investment 626.2 362.8
Liquidity fund 69.9 -
Corporate bonds 345.4 314.2
Alternative bonds 124.3 176.6
Property 124.0 126.6
Cash and other 6.7 16.2
Market value of assets 1,776.4 1,410.4
Present value of scheme liabilities (1,842.0) (1,448.1)
Net pension liability before deferred tax (65.6) (37.7)
Deferred tax asset 6.8 1.5
Net pension liability (58.8) (36.2)
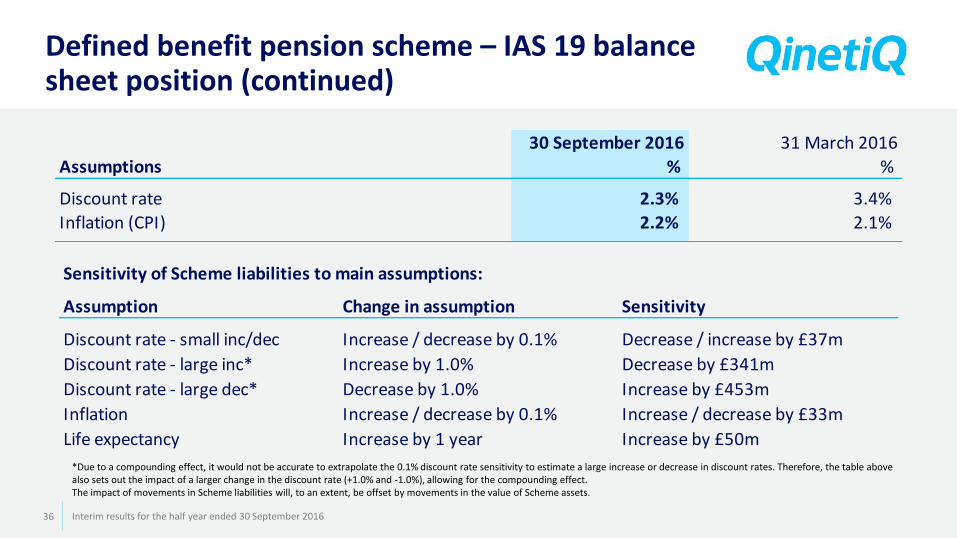
Defined benefit pension scheme – IAS 19 balance sheet position (continued)
36 Interim results for the half year ended 30 September 2016
30 September 2016 31 March 2016
Assumptions % %
Discount rate 2.3% 3.4%
Inflation (CPI) 2.2% 2.1%
Sensitivity of Scheme liabilities to main assumptions:
Assumption Change in assumption Sensitivity
Discount rate - small inc/dec Increase / decrease by 0.1% Decrease / increase by £37m
Discount rate - large inc* Increase by 1.0% Decrease by £341m
Discount rate - large dec* Decrease by 1.0% Increase by £453m
Inflation Increase / decrease by 0.1% Increase / decrease by £33m
Life expectancy Increase by 1 year Increase by £50m
*Due to a compounding effect, it would not be accurate to extrapolate the 0.1% discount rate sensitivity to estimate a large increase or decrease in discount rates. Therefore, the table above also sets out the impact of a larger change in the discount rate (+1.0% and -1.0%), allowing for the compounding effect. The impact of movements in Scheme liabilities will, to an extent, be offset by movements in the value of Scheme assets.
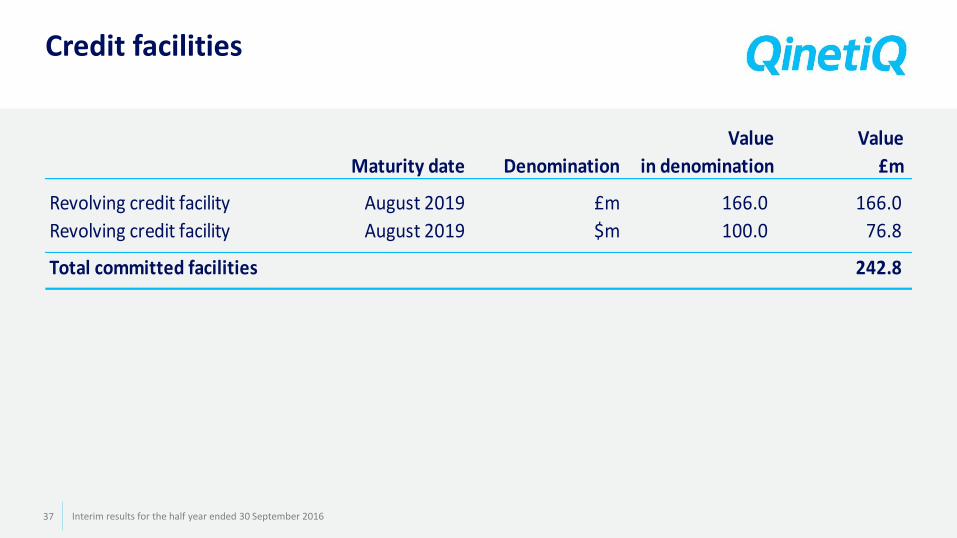
Credit facilities
37 Interim results for the half year ended 30 September 2016
Value Value
Maturity date Denomination in denomination £m
Revolving credit facility August 2019 £m 166.0 166.0
Revolving credit facility August 2019 $m 100.0 76.8
Total committed facilities 242.8

Disclaimer
This document contains certain forward-looking statements relating to the business, strategy, financial performance and results of the Company and/or the industry in which it operates. Actual results, levels of activity, performance, achievements and events are most likely to vary materially from those implied by the forward-looking statements. The forward-looking statements concern future circumstances and results and other statements that are not historical facts, sometimes identified by the words 'believes',' expects’, ’predicts’, ’intends’, ’projects’, ’plans’, ’estimates’, ‘aims’, ‘foresees’, ‘anticipates’, ‘targets’, ‘goals’, ‘due’, ‘could’, ‘may’,'should’, ‘potential’, ‘likely’ and similar expressions, although these words are not the exclusive means of doing so. These forward-looking statements include, without limitation, statements regarding the Company's future financial position, income growth, impairment charges, business strategy, projected levels of growth in the relevant markets, projected costs, estimates of capital expenditures, and plans and objectives for future operations. Forward-looking statements contained in this announcement regarding past trends or activities should not be taken as a representation that such trends or activities will continue in the future. Nothing in this document should be regarded as a profit forecast. The forward-looking statements, including assumptions, opinions and views of the Company or cited from third party sources, contained in this announcement are solely opinions and forecasts which are uncertain and subject to risks. Although the Company believes that the expectations reflected in these forward-looking statements are reasonable, it can give no assurance that these expectations will prove to be correct. Actual results may differ materially from those expressed or implied by these forward-looking statements. A number of factors could cause actual events to differ significantly. These factors include, but are not limited to: - Defence budgets which are subject to review and change from time to time and the level of available funding open to private contractors in the United Kingdom and United States; - The winning of new business or retention of previous business through a competitive bidding process; - The level of pension liability the Company accrues, given market conditions and actuarial factors; - Material adverse changes in economic conditions in the markets served by the Company; and - Future regulatory actions and conditions in the Company's operating areas, including competition from others. Most of these factors are difficult to predict accurately and are generally beyond the control of the Company. Any forward-looking statements made by, or on behalf of, the Company speak only as of the date they are made. Save as required by law, the Company will not publicly release the results of any revisions to any forward-looking statements in this document that may occur due to any change in the Directors’ expectations or to reflect events or circumstances after the date of this document.
38 Interim results for the half year ended 30 September 2016