continuous school practiceeducation.go.ug/files/downloads/continuous school practice_midline... ·...
TRANSCRIPT

19th November, 2018
CONTINUOUS SCHOOL PRACTICE PROGRESS SURVEY
TTE PROJECT
PEDAGOGY COMPONENT

19th November, 2018
1
Activity Title and Reference Number
Continuous School Practice Baseline Survey
Drive X:\J_M&E\J2_CSP\J2b_Results\Reports\Progress\181106_CSP_progress survey report
Document prepared by: Namyalo Hellen
Document commented by:
Hallet Virginie
Last revision date 19th November, 2018

19th November, 2018
2
Table of Contents List of Acronyms/Abbreviations ............................................................................................................ 4
Executive summary ................................................................................................................................ 5
1.0 Background of study ........................................................................................................................ 7
1.1 Introduction .................................................................................................................................. 7
2.0 Survey Methodology ........................................................................................................................ 7
2.1 Study population .......................................................................................................................... 7
2.2 Sample size ................................................................................................................................... 7
2.3 Data collection and data analysis instruments ........................................................................... 8
2.4 Limitations of the study ............................................................................................................... 8
3.0 Biographical summary...................................................................................................................... 8
3.1: Distribution of Respondents ....................................................................................................... 8
3.2: Age of respondents ..................................................................................................................... 8
3.3: Gender of Respondents .............................................................................................................. 9
4.0: Status on key questions related to ATL application..................................................................... 10
4.1: Status on key questions related to CSP ........................................................................................ 14
4.1.1: Have you been taking part in the continuous School Practice activities in the NTC and
partners secondary schools?............................................................................................................ 14
4.1.2: How satisfied are you with the Continuous School Practice activities provided in your
NTC? .................................................................................................................................................. 15
4.1.3: How satisfied are you with the Continuous School Practice activities provided in the
partner secondary schools? ............................................................................................................. 16
4.1.4: Which Continuous School Practice activities have helped you the most to feel confident
for Examination School Practice? .................................................................................................... 17
4.1.5: According to you, what have you learnt through Continuous School Practice? ................. 18
4.1.6: What would you identify as benefits of Continuous School Practice so far? ...................... 18
4.1.7: What challenges have you faced during the implementation of Continuous School
Practice? ........................................................................................................................................... 19
4.1.8: To which level has Continuous School Practice prepared you for Examination School
Practice? ........................................................................................................................................... 20
4.1.9: How satisfied are you with the Examination School Practice? ............................................ 21
4.1.10: In which areas of ESP or CSP do you find most difficulty? ................................................. 22

19th November, 2018
3
5.0 Analysis ........................................................................................................................................... 22
6.0 Recommendations ......................................................................................................................... 24
References ............................................................................................................................................ 25

19th November, 2018
4
List of Acronyms/Abbreviations CSP Continuous School Practice
DES Diploma in Education Secondary
ESP Examination School Practice
MoES Ministry of Education and Sports
NTC National Teachers’ College
PSS Partner Secondary Schools
SPO School Practice Officer
TTE Teacher Training and Education project

19th November, 2018
5
Executive summary The survey, which occurred from 16th July to 11th August 2018, focused on determining the
respondents’ take on the continuous school practice (CSP) system that was piloted in the partner
secondary schools to complement the examination school practice (ESP). A desired number of DES
yr.1s students from the 5 National Teachers’ Colleges (NTCs) of Kabale, Kaliro, Mubende, Muni and
Unyama participated in this survey.
The major aim of CSP is to avail the pre-service NTC students with more opportunities to practice so
that they are not only confident but have more opportunities of evaluating themselves and putting
theory to practice.
The survey applied the random sampling technique with reference made from Krejcie and Morgan
(1970) for the minimum sample size.
The survey aimed
- to find out if the students applied the different ATL elements in school practice
- to get feedback on the piloted CSP system in the NTCs and partner secondary schools (PSS)
- to bring out the role CSP has played towards ESP.
To find out if the students applied the different ATL elements in school practice, the questions asked
were related to the ATL methods, techniques, resources and assessment.
Problem based learning was the ATL method that was used most by the respondents. Brainstorming
was the most used ATL technique and charts were the most used from the various listed ATL
resources. On average, most of the respondents had used at least one ATL assessment during school
practice and classroom assessment, was the most used ATL assessment.
On average, to most of the respondents (55%), the interaction rate with their students in the
classroom was good during school practice. In 3 NTCs, their highest percentages were of
respondents who had had a good interaction with their students in classroom. The highest
percentages for NTCs Kabale and Muni, were of respondents who had had an excellent interaction
with students in classroom.
In the 5 NTCs, majority of the respondents were of the view that the participation rate of their
students in the classrooms was good during school practice thus the rate had an average of 62%.
Those who were of the view that the participation rate of their students in the classrooms was
excellent followed with 30%. The average and poor rates had percentages of 8% and 0%
respectively.
Likewise, when it came to the practicality of the respondents’ lessons during school practice,
majority of them on average, across the 5 NTCs were of the view that it was good (65%). To 22% of
the respondents, it was excellent while to 13%, it was average. The least percentage was that of
respondents who were of the view that it was poor (1%).

19th November, 2018
6
The study also assessed questions that were connected to CSP and ESP. A couple of questions from
the baseline survey, which took place from 29th January to 4th May, 2018 were also considered for
this survey. These included:
- which CSP activities had helped students the most to feel confident for ESP,
- what had students learnt through CSP,
- what would students identify as benefits of CSP so far,
- what challenges had students faced during the implementation of CSP,
- to which level had CSP prepared students for ESP,
- How satisfied the students were with ESP etc.
The study revealed that most of the respondents on average were of the view that CSP moderately
prepared them for ESP. Interestingly, It was also discovered that the benefits of CSP that had the
highest percentages were those which were related to ESP i.e. it improves the respondents’
confidence for ESP and it improves results of ESP. The study also revealed that the most helpful CSP
activities selected by the respondents were those that occurred in the NTCs.
The challenges of CSP included; insufficient transport, financial costs not taken in charge for some
colleges, its negative impact on the NTC timetable. The study also showed that preparing schemes of
work was the area of ESP or CSP where the respondents found most difficulty despite it being
identified as the CSP activity that helped the students most to feel confident for ESP and as one
which was learnt most through CSP.
The survey has already shown the positive change of perception about school practice amongst the
students after the first year of piloting CSP in NTCs and partner secondary schools. However, there
are also several areas of improvement that have been identified. To further strengthen CSP, the
following recommendations could be useful:
a) NTCs need to make the methods courses more practical by including micro-teaching and
lesson plans.
b) There is need to strengthen the partner secondary school teachers to develop and use
instruction/teaching materials.
c) Lecturers as well as the NTC students need to be strengthened on assessment
d) There is need for more focus to be put on self and peer reflection as well as on feedback by
NTC lecturers and partner secondary school teachers.
e) Funding for continuous school practice needs to be considered relevant and essential.

19th November, 2018
7
1.0 Background of study The NTC pre-service students have for long been exposed to the ESP which comes at the end
of each year of their college life. This school practice lasts for seven weeks and at the end of
it, the students are assessed and awarded marks.
The TTE project piloted a system of CSP in partner secondary schools to complement the existing ESP. The aim of CSP is to avail the pre-service NTC students with more opportunities to practice so that they are not only confident but have more opportunities of evaluating themselves and putting theory to practice.
1.1 Introduction Before the piloting of the CSP system in the NTCs and partner secondary schools in February
2018, a baseline survey was carried out by the TTE project with the aim to gain the
respondents’ take on it. This was then followed up with another survey that took place from
16th July to 11th August 2018.
The aim of the survey was to get the NTC students’ insight on CSP and ESP now that they
had taken part in both systems.
2.0 Survey Methodology
2.1 Study population The study population for the CSP progress survey were the DES yr.1 students of the five National
Teachers’ Colleges (NTCs): Kabale, Kaliro, Mubende, Muni, and Unyama.
2.2 Sample size Random sampling was used for the survey so that a required portion of students in the 5 NTCs were
reached. In addition, the minimum sample size of respondents that was required was got using
Krejcie and Morgan (1970) as detailed in the table below:
Name of NTC Respondents’ Categories Minimum Sample
required Actual Sample
NTC students (DES yr.1) NTC students (DES yr.1)
NTC Kabale 531 217 213
NTC Kaliro 432 201 242
NTC Mubende 333 175 170
NTC Muni 370 186 203
NTC Unyama 526 217 247
Total 2192 996 1075
With ±2% marginal error, this indicates that the results got closely reflect the views from the overall
population hence the survey was effective.

19th November, 2018
8
2.3 Data collection and data analysis instruments Google forms that were designed by the pedagogy team of the TTE project were used for data
collection.
With the assistance of field coordinators and NTC SPOs, links to the forms were shared with the NTC
respondents who filled them in.
The data was analysed using Excel and Stata software.
2.4 Limitations of the study Inadequate access to computers and unreliability of internet
3.0 Biographical summary For this survey, NTC DES year 1 students were the only respondents considered.
3.1: Distribution of Respondents
Frequency Percentage
NTC Kabale 213 20%
NTC Kaliro 242 23%
NTC Mubende 170 16%
NTC Muni 203 19%
NTC Unyama 247 23%
Total 1,075 100%
Overall, NTC Unyama had the
highest number of
respondents (23%) followed
by NTC Kaliro (22%). NTC
Mubende had the least
number of respondents
(16%).
3.2: Age of respondents Frequency Percent
Under 25 997 93%
25 to 34 75 7%
35 to 49 1 0%
50 or older 2 0%
Total 1,075 100%
20%
22%
16%
19%
23%
Respondents' DistributionNTC Kabale
NTC Kaliro
NTC Mubende
NTC Muni
NTC Unyama

19th November, 2018
9
The highest number of respondents were under 25 years (997). Those that were 25 to 34 years
followed and only three respondents were in the age bracket of 35 years and above.
3.3: Gender of Respondents
Survey Population Actual Population
Female Male Total Female Male Total
NTC Kabale 83 130 213 202 329 531
NTC Kaliro 106 136 242 168 264 432
NTC Mubende 59 111 170 128 205 333
NTC Muni 53 150 203 100 270 370
NTC Unyama 84 163 247 142 384 526
Total 385 690 1,075 740 1452 2192
In terms of gender
for the survey,
64% were male
students and 36%
were female
students. In
comparison with
the actual
population of the
students in the
NTCs, the male
students’
percentage was
higher by 2% while that of the female students was lower by 2%.
0%
20%
40%
60%
80%
Survey Population Actual Population
36% 34%
64% 66%
Gender Distribution (Survey Population vs Actual Population)
Female Male

19th November, 2018
10
4.0: Status on key questions related to ATL application
4.0.1: Which ATL Methods did you use the most during school practice?
With 80%, problem based learning was the ATL method that was used most by the students.
Learning stations followed with 51% and learning contract had only 7%. Project based learning was
the least used ATL method as it only had 4%.
4.0.2: Which ATL Techniques did you use the most during school practice?
Brainstorming (80%) was the most used ATL technique by the NTC students during school practice.
Second to brainstorming was group work with 63%. It was followed by presentations, which had
47%. With 19%, storytelling was the least used ATL technique by the students during school practice.
0% 20% 40% 60% 80%
Problem based learning
Learning stations
Learning contract
Project based learning
80%
51%
4%
7%
ATL Methods
0% 20% 40% 60% 80% 100%
Brainstorming
Group work
Presentations
Storytelling
80%
63%
47%
19%
ATL Techniques

19th November, 2018
11
4.0.3: Which ATL Resources did you use the most during school practice?
From the various ATL resources, charts (89%) were the most used by the students during school
practice. With 27%, Experiments were the second most used ATL resources during school practice
and were followed by Maps with 24%. The least used ATL resources were social media, multimedia
and textbooks as their percentages were 4%, 2% and 1% respectively.
4.0.4: Did you use any ATL assessments during School Practice?
On average, 71% of the respondents had used ATL assessments during school practice and only 29%
of them had not used any ATL assessments during school practice. Out of the 5 NTCs, NTC Muni
(86%) had the highest percentage of respondents that used ATL assessments and the least
0% 20% 40% 60% 80% 100%
Charts
Experiments
Maps
Social media
Multimedia
text books
89%
27%
24%
4%
2%
1%
ATL Resources
0%
10%
20%
30%
40%
50%
60%
70%
80%
90%
NTC Kabale NTC Kaliro NTC Mubende NTC Muni NTC Unyama Average
80%
56%
76%
86%
55%
71%
20%
44%
24%
14%
45%
29%
ATL Assessment
Yes No

19th November, 2018
12
percentage of those that did not use any ATL assessments (14%). On the other hand, NTC Unyama
had the lowest rate of respondents that used ATL assessments (55%) and the highest percentage of
those that did not use any ATL assessments during school practice (45%).
4.0.5: State the ATL assessments you used during school practice
Classroom assessment (33%) was the ATL assessment that was most used by most of the NTC
students during school practice. It should be noted that the classroom assessment component is
composed of those that mentioned exercises and tests as assessments used. Second to classroom
assessment was formative assessment with 29%. It was followed by continuous assessment, which
had 8%. Other numerous ATL assessments were mentioned and their response rates ranged from
1% to 7% as shown in the chart above.
Despite of the fact that 747 respondents replied yes to the previous question (4.0.4), only 447 of
them answered this question.
4.0.6: To what extent did you interact with your students in the classroom during
school practice?
Averagely, to most of the respondents, 55%, the interaction rate with their students in the
classroom was good during school practice while to 38% of them, the interaction rate with their
students in the classroom was excellent. 7% of the respondents reported that their rate of
interaction with their students in the classroom was average. None of the respondents was of the
view that their interaction with their students in the classroom was poor.
33%
29%
8%
7%
5%
5%
4%4%
2% 2% 1% ATL AssessmentClassroom assessment +Exercises + TestsFormative assessment
Continuous assessment
Questions and answers
summative assessment
Group assessment/work
Assessment lubric
peer assessment
Brain storming
self Assessment

19th November, 2018
13
4.0.7: To what extent did your students participate in your classroom during school
practice?
On average, 30% of the respondents were of the view that the participation rate of their students in
the classroom was excellent during school practice while to 62% of the respondents, it was good. 8%
of the respondents recounted that the participation rate of their students in the classroom was
average and no one reported that the students’ participation rate was poor during school practice.
4.0.8: To what extent were your lessons practical during school practice?
On average, 65% of the respondents reported that the practical rate of their lessons during school
practice was good while to 22% of them, it was excellent. To 13% of the respondents, the practical
0%
10%
20%
30%
40%
50%
60%
70%
80%
NTC Kabale NTC Kaliro NTC Mubende NTC Muni NTC Unyama Average
46%
24%
45%
52%
24%
38%43%
73%
48% 46%
63%
55%
11%
2%7%
2%
13%7%
0% 0% 1% 0% 0% 0%
Interaction rate with students in classroom
Excellent Good Average Poor
0%
10%
20%
30%
40%
50%
60%
70%
80%
90%
NTC Kabale NTC Kaliro NTC Mubende NTC Muni NTC Unyama Average
40%
13%
39% 39%
19%
30%
48%
85%
49%54%
72%
62%
11%
2%10%
6% 9% 8%0% 0% 1% 0% 0% 0%
Students' participation rate in classroom
Excellent Good Average Poor

19th November, 2018
14
rate of their lesson was average and to 1%, it was poor during school practice. It should be noted
that out of the 5 NTCs, with 89%, NTC Kaliro had the highest percentage of respondents whose
practical rate of lessons was good.
4.1: Status on key questions related to CSP In this section, percentages were used for rating the respondents’ responses to the questions that
were mostly close ended.
4.1.1: Have you been taking part in the continuous School Practice activities in the
NTC and partners secondary schools? On average, most of the respondents
(96%) had been taking part in the CSP
activities in the NTC and partner secondary
schools. Only 4% of them indicated that
they had not been taking part in the CSP
activities in the NTCs and partner
secondary schools.
Nevertheless, they also gave responses to
all the questions that were asked in the
survey.
0%
10%
20%
30%
40%
50%
60%
70%
80%
90%
NTC Kabale NTC Kaliro NTC Mubende NTC Muni NTC Unyama Average
27%
5%
32% 32%
11%
22%
58%
89%
49%
60%
67% 65%
15%
5%
17%
8%
21%
13%
0% 0% 2% 0% 1% 1%
Practical rate of lessons during School Practice
Excellent Good Average Poor
96%
4%
Average of CSP Participants' rate
Yes
No

19th November, 2018
15
Most of the respondents in the 5 NTCs had taken part in the CSP activities in the NTCs and PSS. With
99%, NTC Kaliro had that highest percentage of respondents that had taken part in the CSP activities
in the NTCs and PSS. NTC Mubende followed with 97% and then NTC Muni with 96%. The
percentages of respondents that had not taken part in the CSP activities were greatly low for all the
NTCs as they were all below 10%. Their rages were from 1% to 7% respectively as shown in the graph
above.
4.1.2: How satisfied are you with the Continuous School Practice activities provided
in your NTC? On average, for all NTCs, most of the
respondents (44%) were satisfied with the
CSP activities provided in their NTCs while
33% of them were fairly satisfied with
them. For the least percentages, 20% and
4% were those of respondents who were
very satisfied or not at all satisfied with
the CSP activities provided in their NTCs
respectively.
From the NTCs’ perspective, NTC Kabale had the highest percentage of respondents that were very
satisfied (38%) with CSP activities in the NTC. NTC Unyama had the highest percentage of those that
were satisfied (54%), NTC Kaliro had the highest percentage of respondents who were fairly satisfied
(56%) and NTC Mubende had the highest percentage of respondents that were not at all satisfied
(8%) with the CSP activities in their NTC as detailed below.
0%
20%
40%
60%
80%
100%
NTC Kabale NTC Kaliro NTC Mubende NTC Muni NTC Unyama
95% 99% 97% 96% 93%
5% 1% 3% 4% 7%
CSP Participants' rates by NTC
Yes No
20%
44%
33%
4%Average satisfaction rate of CSP
activities provided in NTCs
Very satisfied
Satisfied
Fairly satisfied
Not at all satisfied

19th November, 2018
16
The highest percentages of students in 3 NTCs (Kabale-42%, Muni-48%, Unyama-54%) were of those
who were satisfied with CSP in the PSS. In NTCs Kaliro, the highest percentage was that of students
who were fairly satisfied with the CSP activities provided in the PSS. Interestingly for NTC Mubende,
both fairly satisfied and satisfied had the same percentage rates (39%).
4.1.3: How satisfied are you with the Continuous School Practice activities provided
in the partner secondary schools? Similar to the previous question, for
all NTCs on average, most of the
respondents (41%) were satisfied
with the CSP activities provided in
PSS while 39% of them were fairly
satisfied with them. For the least
percentages, 16% and 4% were those
of respondents who were very
satisfied or not at all satisfied with
the CSP activities provided in the PSS
respectively.
From the NTCs’ perspective, similar to the previous question, NTC Kabale had the highest percentage
of respondents that were very satisfied (31%). NTC Unyama had the highest of those that were
satisfied (55%), NTC Kaliro had the highest percentage of respondents who were fairly satisfied
0%
10%
20%
30%
40%
50%
60%
NTC Kabale NTC Kaliro NTC Mubende NTC Muni NTC Unyama
38%
8%
15%
24%
13%
42%
35%39%
48%
54%
20%
56%
39%
23%28%
1% 1%
8%4% 5%
NTC distribution of students' satisfaction rate of CSP activities provided in NTCs
Very satisfied Satisfied Fairly satisfied Not at all satisfied
16%
41%
39%
4%
Average satisfaction rate of CSP activities
provided in PSS
Very satisfied
Satisfied
Fairly satisfied
Not at all satisfied

19th November, 2018
17
(75%) and NTC Mubende had the highest percentage of respondents that were not at all satisfied
(9%) with the CSP activities in their NTCs.
The highest percentages of students in 3 NTCs (Kabale-49%, Muni-52%, Unyama-55%) were of those
who were satisfied with CSP in the PSS. In NTCs Kaliro and Mubende, the peak percentages were of
students who were fairly satisfied (75% and 45% respectively) with CSP in the NTCs.
4.1.4: Which Continuous School Practice activities have helped you the most to feel
confident for Examination School Practice?
With 59%, development of lesson plans was the CSP activity that was most selected by NTC students
as one that helped them the most to feel confident for ESP. Development of schemes of work
0%
10%
20%
30%
40%
50%
60%
70%
80%
NTC Kabale NTC Kaliro NTC Mubende NTC Muni NTC Unyama
31%
10% 12%19%
11%
49%
15%
34%
52% 55%
20%
75%
45%
25%31%
0% 0%9%
4% 4%
Students' CSP satisfaction rate in PSS by NTC
Very satisfied Satisfied Fairly satisfied Not at all satisfied
0% 10% 20% 30% 40% 50% 60%
DEVELOPMENT OF LESSON PLANS
DEVELOPMENT OF SCHEMES OF WORK
CLASS OBSERVATION IN A PARTNER SECONDARY SCHOOL
OBSERVATION OF A DEMONSTRATIVE LESSON BY A NTC …
DEVELOPMENT OF INSTRUCTION MATERIALS
MICROTEACHING AMONG NTC STUDENTS
LECTURERS' FEEDBACK
CLASS PRACTICE IN A PARTNER SECONDARY SCHOOL
SELF-REFLECTION
TEAM TEACHING WITH ANOTHER NTC STUDENT
METHODS COURSES
TEAM TEACHING WITH 1 SECONDARY SCHOOL TEACHER
SECONDARY SCHOOL TEACHERS' REFLECTION (FEEDBACK)
CONTINUOUS SCHOOL PRACTICE PORTFOLIO DEVELOPMENT
PEERS' REFLECTION (FEEDBACK)
TUTORIALS WITH SECONDARY SCHOOLS' STUDENTS
NO
59%
57%
56%
49%
42%
40%
30%
28%
26%
24%
22%
22%
19%
18%
17%
7%
0%
CSP activities' distribution by selection rate
19th November, 2018
18
followed with 57%, and then class observation in a partner secondary school with 56%. The rest of
the CSP activities were rated 7% to 49% by the NTC students as detailed above.
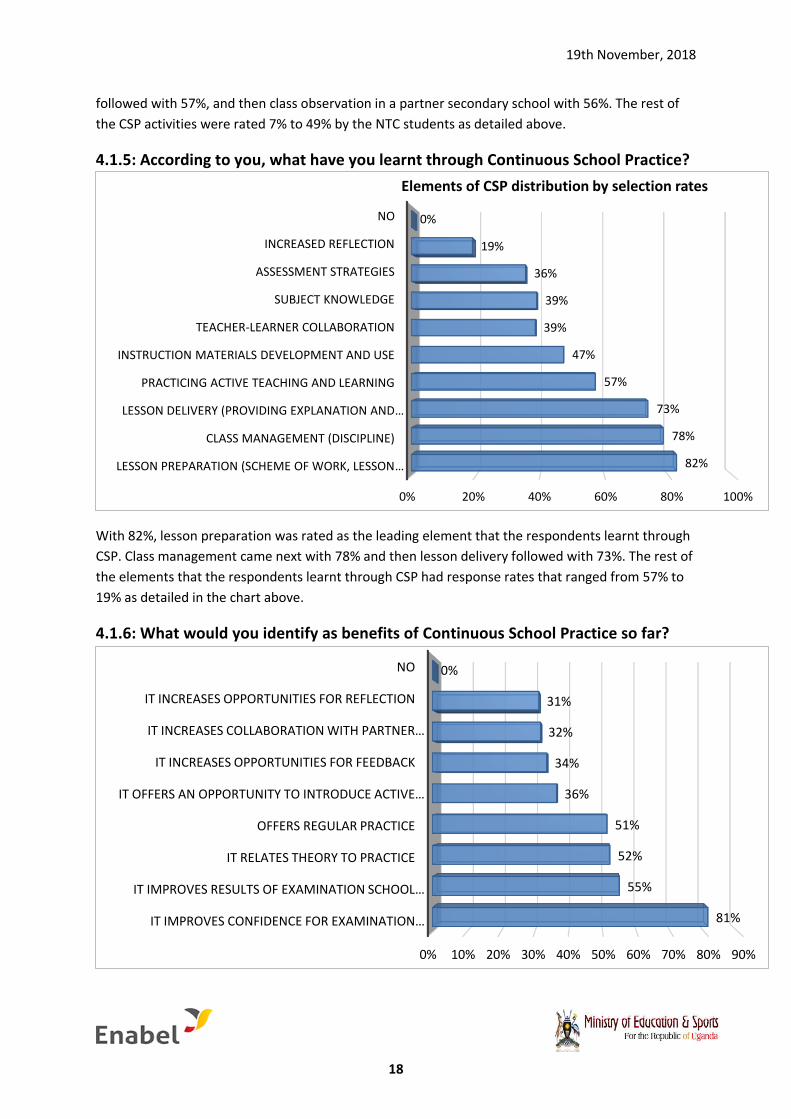
4.1.5: According to you, what have you learnt through Continuous School Practice?
With 82%, lesson preparation was rated as the leading element that the respondents learnt through
CSP. Class management came next with 78% and then lesson delivery followed with 73%. The rest of
the elements that the respondents learnt through CSP had response rates that ranged from 57% to
19% as detailed in the chart above.
4.1.6: What would you identify as benefits of Continuous School Practice so far?
0% 20% 40% 60% 80% 100%
LESSON PREPARATION (SCHEME OF WORK, LESSON …
CLASS MANAGEMENT (DISCIPLINE)
LESSON DELIVERY (PROVIDING EXPLANATION AND …
PRACTICING ACTIVE TEACHING AND LEARNING
INSTRUCTION MATERIALS DEVELOPMENT AND USE
TEACHER-LEARNER COLLABORATION
SUBJECT KNOWLEDGE
ASSESSMENT STRATEGIES
INCREASED REFLECTION
NO
82%
78%
73%
57%
47%
39%
39%
36%
19%
0%
Elements of CSP distribution by selection rates
0% 10% 20% 30% 40% 50% 60% 70% 80% 90%
IT IMPROVES CONFIDENCE FOR EXAMINATION …
IT IMPROVES RESULTS OF EXAMINATION SCHOOL …
IT RELATES THEORY TO PRACTICE
OFFERS REGULAR PRACTICE
IT OFFERS AN OPPORTUNITY TO INTRODUCE ACTIVE …
IT INCREASES OPPORTUNITIES FOR FEEDBACK
IT INCREASES COLLABORATION WITH PARTNER …
IT INCREASES OPPORTUNITIES FOR REFLECTION
NO
81%
55%
52%
51%
36%
34%
32%
31%
0%

19th November, 2018
19
With 81%, CSP improving confidence for ESP was the benefit that was selected most by the
respondents. CSP improving results of ESP (55%) was the second most selected benefit and it was
followed by the fact that it relates theory to practice with 52%. The remaining benefits of CSP had
percentages that differed as shown in the pie chart above.
4.1.7: What challenges have you faced during the implementation of Continuous
School Practice?
With 42%, lack of transport was the biggest challenge that the students faced during the
implementation of CSP. Financial costs not taken in charge came next with 40% while the challenge
of CSP having a negative impact on NTC timetable had a percentage rate of 36%. The rest of the
challenges of CSP had response rates that ranged from 0% to 29% as detailed above.
From each NTC’s perspective, the biggest challenges varied. For NTC Kabale, their biggest challenge
was the negative impact CSP had on the NTC timetable (112 responses). NTC Kaliro’s biggest
challenge was lack of transport (149 responses). That of NTCs Mubende and Muni, was Financial
costs not taken in charge (87 responses and 101 responses respectively) while that of NTC Unyama
was inadequate support from partner secondary schools towards the NTC students (139 times).
More details of the challenges can be viewed in the graph described below.
0% 10% 20% 30% 40% 50%
LACK OF TRANSPORT
FINANCIAL COSTS NOT TAKEN IN CHARGE
NEGATIVE IMPACT ON NTC TIMETABLE
INADEQUATE SUPPORT FROM PARTNER …
LACK OF INTEREST OF PARTNER …
INADEQUATE SUPERVISION OF NTC …
LACK OF INTEREST OF STUDENTS
NEGATIVE IMPACT ON PARTNER …
PARTNER SECONDARY SCHOOLS STAFF …
INADEQUATE COORDINATION OF ACTIVITIES
LACK OF SUSTAINABILITY OF THE SYSTEM
INADEQUATE PEER ASSESSMENT
NON VALUED BY NTC STUDENTS BECAUSE …
LACK OF INTEREST OF NTC STAFF
NO
42%
40%
36%
29%
25%
23%
22%
22%
21%
21%
17%
17%
13%
11%
0%
Challenges faced by students during CSP implementation

19th November, 2018
20
4.1.8: To which level has Continuous School Practice prepared you for Examination
School Practice?
Overall, on average, most of the respondents
from the 5 NTCs (47%), approved that CSP
moderately prepared them for ESP. To 40%
of the respondents, CSP prepared them a lot
for ESP while to 11%, it prepared them a
little for ESP. Only 2% of the respondents
reported that CSP did not prepare them at
all for ESP.
From the NTCs’ viewpoint, for NTCs Kabale and Muni, the highest percentages (63% and 55%
respectively) were those of respondents who were of the view that CSP prepared them a lot for ESP
while for NTCs Kaliro, Mubende and Unyama the highest percentages (73%, 50% and 45%
respectively) were of those who responded that CSP moderately prepared them ESP.
0 100 200 300 400 500
Financial costs not taken in charge
Lack of transport
Partner secondary schools staff not comfortable teach…
Negative impact on NTC timetable
Inadequate supervision of NTC students by NTC staff
Inadequate peer assessment
Lack of sustainability of the system
Inadequate support from partner secondary schools to…
Negative impact on Partner secondary schools timetable
Non valued by NTC students because it is not marked
Lack of interest of students
Inadequate coordination of activities
Lack of interest of partner secondary schools staff
Lack of interest of NTC staff
NO
Challenges faced by students during CSP implementation per NTC
Kabale Kaliro Mubende Muni Unyama
40%
47%
11%
2%Average level CSP prepared students
for ESP
It prepared a lot
It moderatelyprepared
It prepared a little
Did not prepare atall

19th November, 2018
21
4.1.9: How satisfied are you with the Examination School Practice? Averagely from the 5 NTCs, most
of the respondents (47%) were
satisfied with the ESP while 27% of
them were fairly satisfied with it.
For the least percentages, 22% and
3% were those of respondents
who were very satisfied or not at
all satisfied with the ESP
respectively as shown in the graph
above.
Apart from NTC Kaliro, the highest percentages of the other NTCs, NTC Kabale (46%), NTC Mubende
(42%), NTC Muni (51%) and NTC Unyama (58%) were of respondents who were satisfied with ESP.
The highest percentage of the respondents in NTC Kaliro (55%) were fairly satisfied with ESP and
from all the 5 NTCs, NTC Kaliro had the lowest percentage of respondents (7%) who were very
satisfied with ESP. More details are shown in the graph below.
0%
10%
20%
30%
40%
50%
60%
70%
80%
NTC Kabale NTC Kaliro NTC Mubende NTC Muni NTC Unyama
63%
21% 22%
55%
40%
30%
73%
50%
35%
45%
7% 5%
23%
9% 10%0% 0%
5%1% 4%
Level CSP prepared students for ESP by NTC distribution
It prepared a lot It moderately prepared It prepared a little Did not prepare at all
22%
47%
27%
3%
Students' average satisfaction rate with ESP
Very satisfied
Satisfied
Fairly satisfied
Not at all satisfied

19th November, 2018
22
4.1.10: In which areas of ESP or CSP do you find most difficulty?
With 38%, preparing schemes of work was the area of ESP or CSP where the respondents found
most difficulty. Preparing a portfolio came next with 37%, followed by incorporating ATL in teaching
with 35% then preparing a lesson plan with 33%. The rest of the areas of ESP or CSP where the
respondents found most difficulty had different percentage rates as detailed above.
5.0 Analysis The survey aimed:
- To find out if the students applied the different ATL elements in school practice
- To get feedback on the piloted CSP system in the NTCs and PSS
- To bring out the role CSP has played towards ESP.
- To find out if the students applied the different ATL elements in school practice
0%
10%
20%
30%
40%
50%
60%
NTC Kabale NTC Kaliro NTC Mubende NTC Muni NTC Unyama
39%
7%
18%
29%
19%
46%
37%42%
51%
58%
15%
55%
28%
17%22%
0% 1%
12%
2% 1%
ESP satisfaction rate by NTC
Very satisfied Satisfied Fairly satisfied Not at all satisfied
0% 5% 10% 15% 20% 25% 30% 35% 40%
PREPARING INSTRUCTIONAL MATERIALS
PREPARING SCHEMES OF WORK
PREPARING A PORTFOLIO
INCORPORATING ATL IN TEACHING
PREPARING LESSON PLAN
MANAGING DISCIPLINE
REFLECTING ON MY LESSON
39%
38%
37%
35%
33%
31%
18%
Distribution of ESP/CSP Areas where Students find most difficulty

19th November, 2018
23
Problem based learning (80%) was the ATL method that was used most by the respondents.
Brainstorming (80%) was the most used ATL technique and charts (89%) were the most used from
the various listed ATL resources. On average, most of the respondents had used at least one ATL
assessment during school practice and classroom assessment (33%), which included elements like
exercises and tests, was the most used ATL assessment.
On average, to most of the respondents (55%), the interaction rate with their students in the
classroom was good during school practice. In 3 NTCs, their highest percentages were of
respondents who had had a good interaction with their students in classroom. The highest
percentages for NTCs Kabale and Muni, were of respondents who had had an excellent interaction
with students in classroom.
In the 5 NTCs, majority of the respondents were of the view that the participation rate of their
students in the classrooms was good during school practice thus the rate had an average of 62%.
Those who were of the view that the participation rate of their students in the classrooms was
excellent followed with 30%. The average and poor rates had percentages of 8% and 0%
respectively.
Likewise, when it came to the practicality of the respondents’ lessons during school practice,
majority of them on average, across the 5 NTCs were of the view that it was good (65%). To 22% of
the respondents, it was excellent while to 13%, it was average. The least percentage was that of
respondents who were of the view that it was poor (1%).
Additionally, this survey sought to get feedback on the piloted CSP system in the NTCs and PSS as
well as to bring out the role CSP has played towards ESP. The questions that stood out most at
pointing out these views were; which CSP activities had helped students the most to feel confident
for ESP, what had students learnt through CSP, what would students identify as benefits of CSP so
far, what challenges had students faced during the implementation of CSP, to which level had CSP
prepared students for ESP.
Regarding the students’ satisfaction CSP, those who were satisfied with the CSP activities provided in
the NTCs were significantly more than those who were satisfied with the CSP activities provided in
the partner secondary schools by 7%. 64% of the students were satisfied (20% very satisfied, 44%
satisfied) with the CSP activities provided in their NTCs. More than half of the students (57%) were
satisfied (41%- satisfied, 16%- very satisfied) with the CSP activities provided in the partner
secondary schools.
The CSP activities, which take place in the NTCs, that helped students the most to feel confident for
ESP included; Development of lesson plans, Development of schemes of work and Observation of a
demonstrative lesson by a NTC lecturer
For the CSP activities in partner secondary schools, class observation (56%), and class practice (28%)
helped students the most to feel confident for ESP.

19th November, 2018
24
The key aspects learnt through CSP are lesson preparation (82%), class management (78%), and
lesson delivery (73%). The most important benefit of CSP being that it improves confidence for ESP
and results to ESP. For the majority of respondents CSP prepare them for ESP (40% a lot, 47%
moderately).
The most vital challenges of CSP were lack of transport (42%), financial costs not taken in charge
(40%), its negative impact on the NTC timetable (36%) and inadequate support from partner
secondary schools to NTC students, which was rated 29%.
The data still showed the importance of offering teaching practice to the students in the NTC
activities, via microteaching, preparation of instruction materials and class observation in partner
secondary schools.
The survey also showed that lesson preparation, class management, and lesson delivery as well as
practicing of Active teaching and learning were selected most as the elements that the respondents
had learnt through CSP.
Despite the fact that preparing schemes of work was identified as the CSP activity that helped the
students most to feel confident for ESP as well as the element that was learnt most through CSP, it
was identified as the area of ESP or CSP where the respondents found most difficulty (38%). Other
areas where students found most difficulty included; preparing portfolios (37%), incorporating ATL in
teaching (35%) and preparing of lesson plans (33%).
6.0 Recommendations This survey has already shown the positive change of perception about continuous school practice
amongst the students after the first year of piloting CSP in NTCs and partner secondary schools.
However, there are also several areas of improvement that have been identified. To strengthen CSP
further, the following recommendations and actions could be useful to address the identified
shortcomings, thereby contributing to improving the NTC students’ confidence and results for ESP:
f) NTCs need to make the methods courses more practical like micro-teaching and lesson
plans.
g) There is need to strengthen the partner secondary school teachers to develop and use
instruction/teaching materials.
h) Lecturers as well as the NTC students need to be strengthened on assessment
i) There is need for more focus to be put on self and peer reflection as well as on feedback by
NTC lecturers and partner secondary school teachers.
j) Funding for continuous school practice needs to be considered relevant and essential.

19th November, 2018
25
k) Further solidification of CSP follow up mechanisms, in particular feedback meetings with SPOs,
NTC staff and PSS representatives , CSP reports as well as email and phone call reminders to
partner secondary schools staff as these will not only improve the CSP system objective in the
NTCs and PSS but also increase its chances of being rolled out in other institutions.
l) Focused group discussions need to be organized for teachers and students in the NTCs and
PSS to get a better understanding of the results got in the 2nd survey especially.
m) An end-line survey targeting the DES yr.2 students in academic year 2018/19 needs to be
organized in order to have a complete view of the CSP system and thus draw conclusions for
it. A question related to if they would recommend the CSP system to be added into the
colleges’ calendar needs to be added then.
References Krejcie, R.V & Morgan, D.W. (1970). Education and psychological measurement: Determining sample
size for research activities, 30, pp. 607 – 610.