continuous structural monitoring of adobe buildings
TRANSCRIPT
12th International Conference on Structural Analysis of Historical Constructions
SAHC 2020
P. Roca, L. Pelà and C. Molins (Eds.)
CONTINUOUS STRUCTURAL MONITORING OF ADOBE
BUILDINGS: SUMMARY OF A THREE YEARS EXPERIENCE IN
PERU
GIACOMO ZONNO1, RAFAEL AGUILAR
1*, RUBÉN BOROSCHEK
2 AND PAULO
B. LOURENÇO3
1 Department of Engineering, Pontificia Universidad Católica del Perú - PUCP,
Av. Universitaria 1801, San Miguel, Lima 32, Peru
e-mail: [email protected], [email protected] (*corresponding author)
2 University of Chile, Department of Civil Engineering,
Av. Blanco Encalada 2002, Santiago, Región Metropolitana, Chile
e-mail: [email protected]
3 University of Minho, ISISE, Department of Civil Engineering,
Campus de Azurém 4800 - 058 Guimarães, Portugal
e-mail: [email protected]
Keywords: Historic Structure, Andean Church, Structural Monitoring, Environmental
Monitoring, Correlation Analysis
Abstract. The paper describes in detail the application of a vibration-based structural health
monitoring system installed in the “San Pedro Apostol” church of Andahuaylillas located in
Cusco (Peru), a 16th century adobe church considered a representative example of South
America baroque architecture. The results of three years of long-term vibration and
temperature and humidity monitoring program are reported in detail in the paper, with a focus
on the long-term and short-term correlations between natural frequencies and environmental
parameters. The results demonstrate that an accurate estimation of the first eight frequencies
in the range 2-6 Hz is possible in the case of complex adobe structure and the existence of an
annual cyclical behavior of the natural frequencies with a clear correspondence with the
changes in environmental conditions due to seasonal influences. The performed correlations of
ambient conditions and structural parameters confirmed the presence of different timescales
and their not negligible influence in the case of a vibration-based structural health monitoring
assessment of adobe systems with large thermal inertia large thermal inertia.
1 INTRODUCTION
Adobe has a very significant place in the field of civil construction materials. Different types
of structures were made over the centuries and in various parts of the World with this material
due to its attractive characteristics such as low cost, local availability, the possibility to be
self/owner-made, good thermal insulation and acoustic properties [1]. The use of sun-dried

G. Zonno, R. Aguilar, R. Boroschek and P. B. Lourenço
2
blocks dates bakes to 8000 BCE and, in more recent times, it was estimated that around 30%
of the world population lives in earthen constructions [2]. Nowadays, a wide range of earth
buildings can be found in Europe, Asia, Middle East, Africa and America. In particular, adobe
buildings are extensively diffused in Latin America, and in Peru where cultural heritage and
archaeological sites made of this material are a fundamental part of its intellectual richness and
cultural diversity. The sacred city of Caral (2000 BCE), the complexes of “Huaca del Sol” and
“Huaca de la Luna” (100-800 CE), the pre-Colombian city of Chan-Chan (850-1476 CE) are
some of the numerous examples of Peruvian earthen monuments [3].
Unfortunately, these structures require a special attention and investigation due to the high
vulnerability of the adobe heritage buildings affected by anthropological factors (such as lack
of maintenance, inappropriate use and traffic vibrations), natural factors (such as earthquakes,
tsunami and environment conditions) and intrinsic factors (such as aging of the materials and
the low tensile strength and brittle behaviour of the adobe) [4]. Modern tools were developed
to assess existing buildings and reduce their vulnerability. Within the available tools, vibration-
based structural health monitoring (vSHM) is finding an increasing use in the preservation and
conservation of historical constructions such as bell towers [5], stone masonry churches [6] and
buildings [7] due to its low invasiveness, the possibility to increase of the level of knowledge
of structural system with high accuracy and the possibility of check the health state of the
structures [8]. The structural health assessment of existing buildings by vibration-based
monitoring systems is a challenge task because the influence of the environmental parameters
(mainly temperature and humidity) can lead a variation of the boundary conditions [9], in the
system stiffness [10] and others, masking variations due to structural damages. In the case of
earthen existing buildings, the authors show in [11-12] how thermohygrometric variations can
produce significative changes in natural frequencies at long and short scales because the
environmental parameters are time-dependent and non-uniform quantities.
The paper reports the results obtained with the three years of vSHM of a masterpiece of the
Peruvian cultural heritage earthen building, the “San Pedro Apostol” church of the
Andahuaylillas, located in Cusco (Peru). The monitoring system was installed on March 2017
and continuously records the dynamic response of the church by four force-balances
accelerometers and the environmental conditions by temperature and humidity sensors. The
paper in Section 2 describes the cases study and the carried-out monitoring systems, in Section
3 describes the obtained results and Section 4 concludes the paper.
2 THE “SAN PEDRO APOSTOL” CHURCH OF ANDAHUAYLILLAS
2.1. Description of the case study
The “San Pedro Apostol” church is located in the main square of the Andahuaylillas, a
village close to the Cusco city, in southeastern Peru, in the Andean region and it is considered
the most emblematic colonial adobe church of South America (Fig. 1a). The church was built
by Jesuit in the 16th century and is known as the “Sistine Chapel of Latin America” for its
inestimable mural painting (Fig. 1b). The church covers an area of 61 x 27 m (Fig. 1c), with a
main nave of 58 x 12 m and a height of 10 m, and it is connected directly to the baptistery, the
bell tower, two later chapels and, by a triumphal arch, to the presbytery (Fig. 1d). The adobe
walls have a variable thickness from 1.10 m to 2.00 m and a stone masonry foundation with a
height of 1.5 m. The longitudinal walls of the nave are connected by wooden tie-beams and

G. Zonno, R. Aguilar, R. Boroschek and P. B. Lourenço
3
steel tie-rods and the roofing system is composed by a “A-shape” trusses of timber elements
[13].
a b
c d
Figure 1: “San Pedro Apostol” church of Andahuaylillas: (a) exterior view, (b) interior view,
(c) 3D reconstruction, and (d) plan view at the height of the base.
2.2. Description of the monitoring system
For the importance of the building and to increase the knowledge about the dynamic and
thermohygrometric behaviour of the structure, a remote and continuous dynamic monitoring
system and an environmental monitoring system were installed on the church on March 2017.
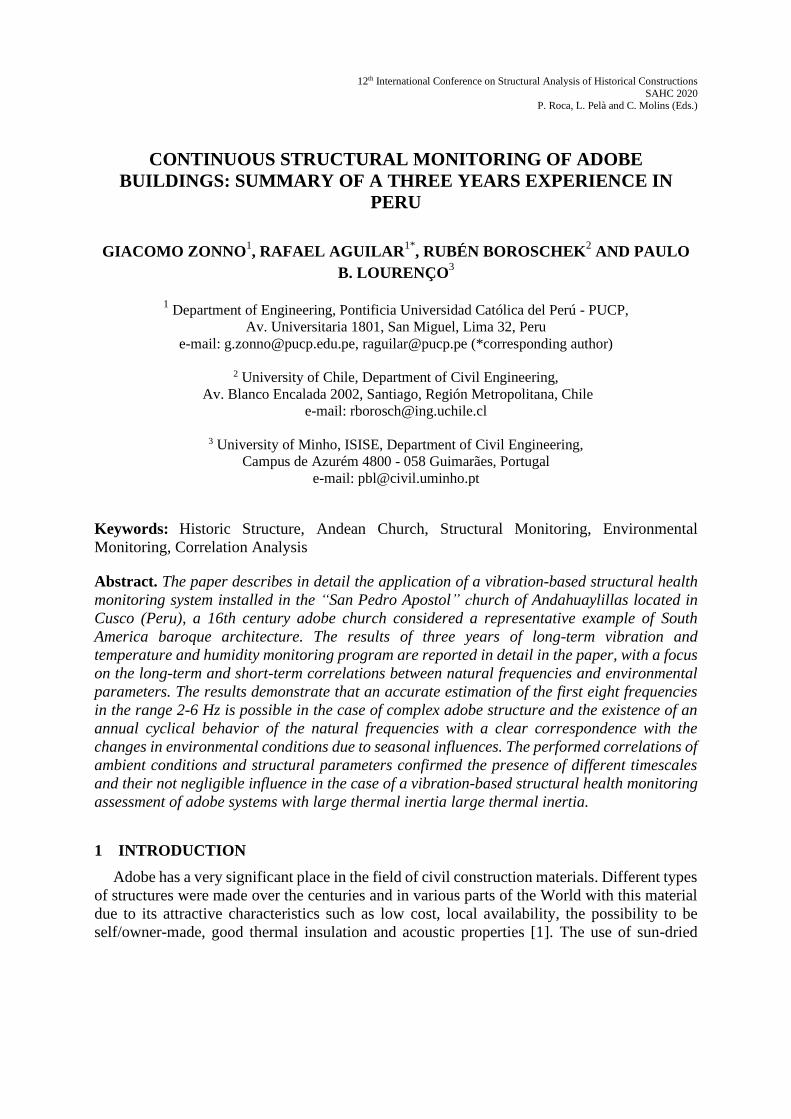
The implemented monitoring systems are summarized in Fig. 2, and consist: (i) local
acquisition and storage of the raw data (dynamic and environmental data), (ii) transmission of
the raw data by a 4g data plan to the central monitoring station, (iii) reception and storage of
data, (iv) processing of raw data, and (v) publishing the results in a web platform using a cloud
engine. For the processing of the dynamic raw data (stage iv of the monitoring system), an
automatic processing tool was developed and tested in [14]. In particular, the developed tool is
able to identify automatically the frequencies, mode shapes and damping values of the structure
through four main steps: (a) digital signal pre-processing of the dynamic data; (b) application
of the SSI-Data method to obtain the stabilization diagram; (c) filtering of the stabilization
diagram with the application of hard and soft validation criteria; (c) automatic detection of the
modal parameters using hierarchical clustering approach and automatic thresholds; and (d) the
Main nave
Triumphal arch
Presbytery
Choir loft
Bell tower
G. Zonno, R. Aguilar, R. Boroschek and P. B. Lourenço
4
application of an adaptive modal tracking for a final cleaning of the dynamic results (see more
details in [14]).
Figure 2: Overview of the structural monitoring system implemented in the “San Pedro Apostol” church.
Within this context, the implemented dynamic monitoring system consists of a Kinemetrics
Obsidian 8x [15], a data acquisition unit with a capacity of 8-channels and 24 bits of resolution
(Fig. 3f) and four uniaxial force balance accelerometers Episensor ES-U2 [16] with a bandwidth
range from DC to 200 Hz, a dynamic range of 155 dB+, a sensitivity of 10 V/g, and an operating
temperature range from −20 °C to 70 °C (Fig. 3c). To generate a stable power supply, an
external battery (Fig. 3h) with a voltage regulator (Fig. 3i), and a battery charging-maintainer
(Fig. 3g) are incorporated. The accelerometers are located at the top height of the north and
south nave walls (see Fig. 3c) to record the horizontal (out of plane) movements of the main
nave. The data acquisition parameters are set at a sampling rate of 200 Hz, at a sampling time
of 900 s for each event and with a time recurrence of one hour.
The environmental monitoring system used to perform the remote and real-time monitoring
of the external and internal temperature and humidity is composed by a HOBO RX-3000 Data
Logger [17] (Fig. 3l) and two S-THB-M008 environmental sensors [18] (Fig. 3m). The S-THB-
M008 sensors have a temperature resolution of 0.02 °C, a humidity resolution of 0.1%, a
temperature measurement range between −40 °C and 75 °C, and a humidity measurement range
between 0 and 100%. The environmental sensors are placed outside (Text and Hext in Fig. 3a)
and near the entrance of the church (Tint and Hint in Fig. 3a) to record the internal and external
temperature and humidity. The environmental parameters are recorded with a time recurrence
of one hour. For remote communication, the Obsidian 8x, and the HOBO RX-3000 Data Logger
were connected by Ethernet cables to a TP-Link modem with a phone data plan (Fig. 3d) to
automatically send the recorded information to the central monitoring station using a safe File
Transfer Protocol (FTP). During the entire monitoring period more than 23000 raw data was
sent from the instrumented building to the central station.
Data
Acquisition
Data
transmission
using 4g data
plan
Data
reception
Real-time data
published in a
web platform
INSTRUMENTED BUILDINGS CENTRAL MONITORING STATION
Environmental
conditions
CLOUD
Automatic
modal
parameters
identification
• Data pre-processing
• SSI-Data method
• Preliminary cleaning stage with
hard/soft validation criteria
• Automatic detection using
hierarchical clustering
• Adaptive modal tracking

G. Zonno, R. Aguilar, R. Boroschek and P. B. Lourenço
5
a
Figure 3: Dynamic and environmental monitoring systems: (a) location of the dynamic and environmental
sensors, (b) 3D reconstruction of the church with the device locations, (c) EpiSensor ES-U2 accelerometer
sensor, (d) TP-Link modem, (e) data acquisition station, (f) Obsidian 8x acquisition system, (g) battery charging-
maintainer, (h) external battery, (i) voltage regulator, (l) HOBO RX-3000 Data Logger, and (m) S-THB-M008
temperature/ humidity sensor.
3 MONITORING SYSTEMS RESULTS
The analysis of the recorded ambient vibration data was performed, and the results are
presented in Fig. 4. As shown, the first eight frequencies of the adobe church were clearly
detected in the range 2 Hz and 7 Hz. As shown, the results indicate a seasonal influence during
the monitoring period. Lower frequency values were reached during colder months (between
June and September), while higher values in the summer months (between December and
March). An irregular behavior was detected close to November 2018 with a local decrease of
all the identified frequencies.
S-THB-M008
environmental sensor
Episensor ES-U2
Accelerometer sensor
Text, Hext
Tint, Hint
E1 E2
E3E4
HOBO RX-3000 Data
Logger
c
b
d
e
f
g
h
i
l
m

G. Zonno, R. Aguilar, R. Boroschek and P. B. Lourenço
6
Figure 4: Time evolution of the first eight natural frequencies of the “San Pedro Apostol” church from March
2017 to November 2019.
The results of the ambient temperature and relative humidity evolution are shown in Fig. 5.
The external ambient temperature (Text) exhibits a not clear seasonal trend of the data with
higher daily variations in the summer period and lower in the winter one (Fig. 5a), reaching a
maximum value of 28°C and a minimum value of 5°C during the monitoring period. On the
contrary, the internal ambient temperature records (Tint) shows clear seasonal trends, with an
increase of the values during the summer period and a decrease in the winter one (Fig. 5a). An
attenuation phenomenon of the daily thermal variation compared to the external ambient
records, reaching a maximum value of 21°C in winter and a minimum value of 11°C in summer.
Similar attenuation between external and internal measurements was recorded in the case of
relative humidity (see the external relative humidity, Hext and the internal relative humidity, Hint
of Fig. 5b). The values of the external relative humidity range between 82% and 7%, in
comparison with the values of the internal relative humidity that range between 71% and 12%.
Clear seasonal trends were also detected with a humidity drop in the winter period (between
June and September) in both external and internal values.
Aiming at developing a single variable that integrates information of ambient temperature
and relative humidity, the external and internal absolute humidity (AbsHext and AbsHint,
respectively) were calculated to achieve a better understanding of the effects of
thermohygrometric parameters on the natural frequencies of the adobe church (see more details
of how this variable is calculated in [13]). In particular, AbsHext and AbsHint were calculated
using the recorded data of Text/Hext, and Tint/Hint sensors, respectively, and they represent the
amount of water vapor in the external and internal air of the church. The results of the calculated
absolute humidity values in the entire monitoring period are showed in Fig. 5c. A clear seasonal
decrease (from 10 g/m3 to 2 g/m3) was recorded for both parameters in the winter period, with
an irregular behavior detected close to November 2018, with a clear similarity of the time
evolution of the identified frequencies. Furthermore, high capacity to reduce the variation
between the external and internal measurements is shown by this calculated parameter.
2
3
4
5
6
7
Fre
quen
cy [
Hz]
F1 F2 F3 F4 F5 F6 F7 F8

G. Zonno, R. Aguilar, R. Boroschek and P. B. Lourenço
7
a
b
c
Figure 5: Time evolution of the church’s ambient temperature and humidity: (a) external and internal ambient
temperatures Text and Tint, (b) external and internal relative humidity Hext and Hint, and (c) external and internal
absolute humidity AbsHext and AbsHint.
4 ANALYSIS OF THE INFLUENCE OF AMBIENT CONDITIONS IN THE
DYNAMIC STRUCTURAL BEHAVIOUR
A detailed study was performed between the first frequency of the “San Pedro Apostol”
church and the external ambient humidity. The external ambient humidity was selected as
parameter for comparison due to:
(a) the absolute humidity has demonstrated to be an effective parameter for performing
correlation analyses [12];
(b) t absolute humidity is less affected by the thermal inertia of the adobe, demonstrated by
a higher correlation between external and internal environmental measurements;
(c) in most structural monitoring, the external environmental parameters are easier to obtain.
Furthermore, in sake of brevity, in the present paper only the results of the first frequency will
be described in detail.
Fig. 6 shows the correlation distributions of the first frequency with the external absolute
5
10
15
20
25
30
Tem
p.
[°C
]
--Text --Tint
0
20
40
60
80
100
Hum
id.
[%]
--Hext --Hint
0
2
4
6
8
10
12
Ab
s. H
um.[
g/m
3]
--AbsHext --AbsHext

G. Zonno, R. Aguilar, R. Boroschek and P. B. Lourenço
8
humidity corresponding to the entire monitoring period. Aiming at analyzing the influence of
the environmental parameters on the frequency with different timescales, the raw data was
filtered by averages with different timescale. In particular, Fig. 6a shows the correlation
distribution obtained by the raw data. Fig. 6b shows the correlation distribution obtained by
filtering the raw data with a daily average (the mathematical average was carried out with the
24 data recorded in one day). Finally, Fig. 6c, Fig. 6d, and Fig. 6e show the correlation
distribution obtained by filtering the raw data by averaging the data of 7 days, 15 days and 30
days, respectively.
The results show that the correlation coefficients between the raw data of the first frequency
and external ambient humidity are almost good (R2=0.35) with a positive trend. The results of
the correlation distribution with the daily average filtered data show a higher value of
correlation coefficient (R2=0.47) with a clearer positive trend. The results improve with the 7
days average filter, reaching a correlation coefficient of 0.58. Finally, with the 15 days average
filter and the 30 days average filter, there is a slight improvement of the results, reaching a
correlation coefficient of 0.65.
a b c
d e
Figure 6: Correlation coefficients distribution between the first natural frequency and external absolute
humidity: (a) raw data, (b) data filtered by a daily average, (c) data filtered by a 7 days average, (d) data filtered
by a 15 days average, and (e) data filtered by a 30 days average.
5 CONCLUSIONS
The paper reports the results of almost three years of environmental and dynamic monitoring
of the emblematic “San Pedro Apostol” adobe church of Andahuaylillas, Cusco (Peru). The
results show on one side the influence of the adobe structure on the diffusion of temperature
and humidity inside the church, and on the other side, the influence of the environmental
R² = 0.352.3
2.4
2.5
2.6
2.7
0 3 6 9 12
1st
Fre
quen
cy [
Hz]
AbHext [g/m3]
R² = 0.472.3
2.4
2.5
2.6
2.7
0 3 6 9 12
1st
Fre
quen
cy [
Hz]
AbHext [g/m3]
R² = 0.582.3
2.4
2.5
2.6
2.7
0 3 6 9 12
1st
Fre
quen
cy [
Hz]
AbHext [g/m3]
R² = 0.632.3
2.4
2.5
2.6
2.7
0 3 6 9 12
1st
Fre
quen
cy [
Hz]
AbHext [g/m3]
R² = 0.652.3
2.4
2.5
2.6
2.7
0 3 6 9 12
1st
Fre
quen
cy [
Hz]
AbHext [g/m3]

G. Zonno, R. Aguilar, R. Boroschek and P. B. Lourenço
9
parameters on the dynamic response of the same structure.
The comparison between the evolution of the internal and external environmental conditions
shows a clear attenuation of the internal measurements, confirming the influence of the thermal
inertia of this type of buildings, mitigating the extreme ambient climatic conditions recorded
outside the church.
The analysis of the influence of the environmental parameters on the dynamic response of
the structure show an annual cyclical behavior in the time evolution of the first eight frequencies
of the church, with a clear similarity with the time evolution of the environmental parameters
(long-term analysis). Furthermore, a medium-term and a short-term analyses were performed
with the calculated external absolute humidity, and improved results were attained when the
daily variation, the 7 days variation, the 15 days variation and the 30 day variation were
removed from the original raw data of natural frequencies and environmental parameters
The successful implementation of an environmental and dynamic monitoring system in a
16th century historical adobe church and the obtained results about the relevant role of the
environmental parameters at different time scales in the dynamic response of adobe systems
make the vibration-based structural health monitoring system a useful tool for the conservation
and protection of the cultural heritage buildings.
REFERENCES
[1] Varum, H., Tarque, N., Silveira, D., Camata, G., Lobo, B., Blondet, M., et al. Structural
behaviour and retrofitting of adobe masonry buildings. Structural rehabilitation of old
buildings. Springer, Berlin, Heidelberg. (2014). pp. 37-75.
[2] Houben, H., Guillard, H. Earth Construction: A Comprehensive Guide. Practical Action,
London. (1994).
[3] Ciocci, M. P., Sharma, S., and Lourenço, P. B. Engineering simulations of a super-complex
cultural heritage building: Ica Cathedral in Peru. Meccanica. (2018). 53(7): 1931-1958.
[4] Karanikoloudis, G., and Lourenço, P. B. Structural assessment and seismic vulnerability of
earthen historic structures. Application of sophisticated numerical and simple analytical
models. Eng. Struc. (2018). 160: 488-509.
[5] Saisi, A., C. Gentile, and A. Ruccolo. Continuous monitoring of a challenging heritage
tower in Monza, Italy. J. Civ. Struct. Health Monit. (2018). 8(1): 77–90.
[6] Elyamani, A., O. Caselles, P. Roca, and J. Clapes. Dynamic investigation of a large
historical cathedral. Struct. Control Hlth (2017). 24(3): e1885.
[7] Lorenzoni, F., F. Casarin, M. Caldon, K. Islami, and C. Modena. Uncertainty quantification
in structural health monitoring: Applications on cultural heritage buildings. Mech. Syst.
Signal Pr. (2016). 66:268–81.
[8] Ramos, L., Marques, L., Lourenço, P. B., De Roeck, G., Campos-Costa, A., Roque, J.
Monitoring historical masonry structures with operational modal analysis: two case studies.
Mech. Syst. Signal Pr. (2010), 24: 1291–1305.
[9] Ubertini, F., C. Gentile, and A. L. Materazzi. Automated modal identification in operational
conditions and its application to bridges. Eng. Struc. (2013). 46:264–78.
[10] Maeck, J., B. Peeters, and G. De Roeck. Damage identification on the Z24 bridge using
vibration monitoring. Smart Mater. Struct. (2001). 10(3):512.

G. Zonno, R. Aguilar, R. Boroschek and P. B. Lourenço
10
[11] Zonno, G., R. Aguilar, R. Boroschek, and P. B. Lourenço. Experimental analysis of the
thermohygrometric effects on the dynamic behavior of adobe systems. Constr. Build.
Mater. (2019). 208:158–74.
[12] Zonno, G., Aguilar, R., Boroschek, R., and Lourenço, P. B. Environmental and ambient
vibration monitoring of historical adobe buildings: applications in emblematic Andean
churches. Int. J. Archit. Herit. (2019). https://doi.org/10.1080/15583058.2019.1653402
[13] Zonno, G., Aguilar, R., Boroschek, R., and Lourenço, P. B. Analysis of the long and
short-term effects of temperature and humidity on the structural properties of adobe
buildings using continuous monitoring. Eng. Struc. (2019). 196: 109299.
[14] Zonno, G., Aguilar, R., Boroschek, R., and Lourenço, P. B. Automated long-term
dynamic monitoring using hierarchical clustering and adaptive modal tracking: validation
and applications. J. Civ. Struct. Health Monit. (2018). 8(5): 791-808.
[15] KINEMETRICS. (2019). Obsidian 8x multichannel seismic recorder.
https://kinemetrics.com.
[16] KINEMETRICS. (2019). EpiSensor ES-U2 uniaxial episensor accelerometer.
https://kinemetrics.com.
[17] ONSET. (2019). HOBO RX3000 remote monitoring station data logger.
http://www.onsetcomp.com.
[18] ONSET. (2019). S-THB-M008 temperature/relative humidity smart sensor.
http://www.onsetcomp.com.