contrast enhancement in mammography imaging including k edge filtering
TRANSCRIPT

6
Contrast Enhancement in Mammography Imaging Including K Edge Filtering
George Zentai Ginzton Technology Center of Varian Medical Systems
USA
1. Introduction
To understand how we can optimize the spectrum of an X-ray beam to obtain the maximum contrast using the minimum dose for a given x-ray exam we need to know a little about how the X-rays are generated, how an x-ray tube works, how the energy spectrum of the output X-ray beam will look and how the X-rays interact with the human body and with the imager.
A general X-ray tube has two electrodes, the cathode and the anode, with a high voltage
applied between them. Electrons are generated at the cathode. After the electrons are
emitted from the cathode they are accelerated by the high voltage toward the anode
(positive) electrode. The high speed electrons hitting the anode material then generate
invisible radiation i.e. X-rays. The energy spectrum of the output X-rays is dependent on the
anode-cathode voltage difference and on the material of the anode and is measured in
electronvolts. The energy spectrum is a so called Brehmstrahlung radiation meaning that it
is continuous over a wide range of energies and has more photons emitted at the lowest
energies. The photon flux decreases to zero at the anode-cathode voltage difference level.
When the Brehmstrahlung radiation of the X-ray beam passes into the human body, some photons are absorbed while others pass through. The ones that have passed through are available for imaging. Because the absorption of the human body is higher at lower energy X-rays, the beam exiting the body has a higher average energy than the beam had when it entered the body. This effect is called beam hardening and it causes a decrease in the contrast of images and difficulties in CT reconstruction. Furthermore, the dose the patient receives from the very low energy X-rays serves no purpose; it does not contribute to the final image in any way.
Figure 1 demonstrates the difference between input and exit X-ray beams showing that the very low energy X-rays do not penetrate the human body at all and only add extra (unwanted) dose to the patient (Sutton 2009). Three cases are shown in the figure. The original input beam, an 80kVp X-ray beam from a W anode filtered through a 2 mm Al filter, is shown in blue and has the highest photon flux and widest energy spectrum. The red series shows the energy of the beam after having passed through simulated soft tissue (150 mm soft tissue and 50 mm water). This exit beam shows that only X-ray photons with >25keV energy will contribute to the image. The green series shows the energy of the beam
www.intechopen.com

Imaging of the Breast – Technical Aspects and Clinical Implication 134
after having passed through simulated tissue and bone (150mm soft tissue + 50 mm water + 30 mm bone). This exit beam now shows that only X-ray photons with >37 keV are available to contribute to the image. The very low energy input photons are completely absorbed in the body, adding extra patient dose, because there is no exit photon for imaging1.
Fig. 1. Comparison of the ratio of the incident photons (original beam) to the exit photons after going through different body tissues including water. Only the exit photons contribute to the imaging.
So, how can we optimize contrast of the x-ray image using the minimum dose?
2. Using the right x-ray energy range
Figure 1 implies that the spectrum of the input x-ray beam has to be optimized for each
imaging modality for minimum patient dose. For instance, a thicker body part such as the
pelvis, which contains lots of bony structures, absorbs most of the low energy X-ray beams
below 30 keV so we need to use higher X-ray beam energies to get a reasonable number of
exiting x-ray photons for imaging while avoiding overdosing the patient with low energy X-
rays which would be completely absorbed in the thick pelvis.
By contrast, imaging of the breast, which is smaller (thinner) relative to the pelvis and does not contain any bony structure, requires much lower X-ray energy to get sufficient X-ray
1 Note that some low energy X-rays are removed by the inherent filtration of the X-ray tube. In many cases the exit window of the X-ray tube is made of 2mm Aluminum which removes most of the X-ray radiation below 15 keV.
www.intechopen.com

Contrast Enhancement in Mammography Imaging Including K Edge Filtering 135
photons for good imaging. Figure 2 shows the contrast/dose relationship for mammography. From the diagram, the optimum X-ray energy for imaging the breast is in the range of 18-21 keV (mean energy).2
Fig. 2. The general relationship of contrast and dose to photon energy in mammography (Sprawls).
There are several methods for limiting the input X-rays to an optimum range. They include dual energy imaging, monochromatic X-ray imaging, and quasi-monochromatic X-ray imaging.
3. Dual energy imaging
In many cases X-ray images must capture both hard (bony) structures and soft tissues,
which may be overlapping, in the same picture. A method to separate two different tissues,
and optimize the contrast between them, is to acquire two images at different x-ray energies
and do a weighted subtraction. This is called dual energy imaging. Taking images at low
and high energies and doing a subtraction can remove either the soft or the bony structure
depending on the techniques used.
3.1 Brief theory of dual energy imaging
The data processing methods that make use of dual energy data are referred to as
decomposition techniques and are divided into three classes based on the type of
information returned by the technique. The three types of information about the object being
imaged that may be returned by decomposition techniques are: (1) effective atomic number
and density; (2) attenuation due to Compton scattering and electron density; or (3) the
physical densities of two known components (Walter, Wu et al. 2004).
2 This range will vary depending on the size and density of the breast.
www.intechopen.com

Imaging of the Breast – Technical Aspects and Clinical Implication 136
The ability to determine material composition from dual energy techniques fundamentally
results from the fact that the linear attenuation coefficient of X-ray absorption, ((E)), for an element has a unique functional dependence on photon energy. Over the range of x-ray photon energies used, the attenuation coefficient is dominated by two major attenuation processes: the photoelectric effect and Compton scattering. A major simplifying factor of the analysis is that each of these two processes has a fixed and unique functional dependence on energy that can serve as a linear basis set for any material. That is,
づ岫E岻 = xづ丹岫E岻 + yづ達岫E岻 (1)
where p(E) is the linear attenuation as a function of energy due to the photoelectric effect and c(E) is the linear attenuation as a function of energy due to the Compton scattering effect and x and y are material specific constants.
A consequence of this relationship is that the energy dependence of any material’s attenuation coefficient can be expressed as the linear combination of any two other materials. Therefore, each material can be characterized by two density values, pA pB, which are derived from the attenuation measured at two different kVp spectra, A(E), B(E). As in,
づ岫E岻 = xづ丹岫E岻 + yづ達岫E岻 = p代づ代岫E岻 + p台づ台達岫E岻 (2)
The important consequence for image formation is that these two material density values are available to encode the pixel values apart from or in combination with Hounsfield units in the case of CT imaging. Materials with similar density can now be differentiated based on average atomic number. Of particular interest is the use of contrast agents with atomic numbers significantly different from the usual materials present in the body as these agents will show up on images in high contrast to the normal materials of the body. Moreover, because the dual energy analysis makes explicit use of the energy dependence of the attenuation, the beam hardening artifacts are absent here, a distinct advantage over conventional CT. Also, in the dual energy technique as opposed to the conventional approach, the accuracy of the CT number associated with pixels is not affected by the beam hardening corrections which must approximate the energy dependent attenuation with data from a single energy value.
3.2 Dual energy imaging applications
Dual energy imaging was used in CT scanning as long ago as 1976 (Alvarez and Macovski 1976) when it was also being used for the exact determination of the atomic number of elements (Rutherford, Pullan et al. 1976). It has been used for mammography as well. Johns et al. described the first applications of dual energy imaging to mammography (Johns, Drost et al. 1983). Later work optimized the method to get the best SNR with minimum dose (Johns and Yaffe 1985). Since that time, several articles were published about optimization of parameters in dual energy breast imaging. Boone at al. (Boone, Shaber et al. 1990) analyzed detector parameters, effects of X-ray parameters and filtrations and the effect of scatter on the quality of the dual energy images. Kappadath et al. (Kappadath, Shaw et al. 2004) used digital subtraction techniques and a method they developed called DEDM (Dual Energy Digital Mammography) to improve the visibility of micro calcifications.
Dual energy techniques have also been used to improve Computed Tomography (CT) imaging. While 3D CT scans and the use of Iodine (I) as a contrast agent have, on their own,
www.intechopen.com

Contrast Enhancement in Mammography Imaging Including K Edge Filtering 137
greatly improved the visibility of malignant cancerous tissues (Chen, Jing et al. 2006; Arvanitis, Royle et al. 2007; Puong, Bouchevreau et al. 2007), the combination of dual energy CT and Iodine contrast together offers yet more improvements to our ability to separate different tissues from one another in an image (Carton, Lindman et al. 2007), (Puong, Patoureaux et al. 2007; Saunders, Samei et al. 2008).
Dual energy imaging is used in many fields of medical imaging, such as for lung imaging when we need to separate (or suppress) the overlapping rib shadows from the soft lung tissues to enhance visualization of lung nodules (Kashani, Varon et al. 2010), or, similarly,
for digital angiography to visualize the heart behind the ribs (Ersahin, Molloi et al. 1994). In many cases dual energy angiography is used in combination with Iodine (I) or Gadolinium (Gd) contrast agents (Fiedler, Elleaume et al. 2000).
Dual energy imaging is an important technique for performing bone densitometry tests (Shimura, Nakajima et al. 1993) and specialized systems have been developed and sold by GE and Hologic (GE ; Hologic).
3.3 Dual energy imaging methods
Generally dual energy imaging is implemented by use of X-ray tube voltage switching to obtain two images; one at low and one at high kVp values. To avoid motion artifacts between the two images quick changes in tube voltage are necessary.
Different methods and detectors have also been developed for dual energy imaging. Coello et al. (Coello, Dinten et al. 2007) built a system where, instead of switching voltages, a filter wheel containing multiple filter materials is rotated in front of the X-ray tube, providing different X-ray spectra. This paper also provides an excellent overview of the theory of dual energy imaging and its optimization for best signal to noise ratio and image contrast.
4. Monochromatic X-ray imaging
Beam hardening has a significantly deleterious effect on the precision of CT reconstruction. It can be avoided by using monochromatic X-ray beams. Furthermore, for each imaging object there is an ideal energy at which enough X-ray photons make it through the object to allow for low noise imaging while still using a low enough X-ray energy to provide the best contrast ratio. Synchrotrons are ideal sources of monochromatic beams of high flux. Some experiments on breast imaging with synchrotrons were made and compared to normal mammographic images (Fiedler and et al. 2004). A further advantage of monochromatic imaging is that it allows for phase contrast imaging, which greatly improves the contrast even between different soft tissues. However, the size and price of a synchrotron make it impractical for general radiographic use. X-ray tubes with monochromators can provide monochromatic x-ray beams but the flux is too low for practical applications (Donath, Pfeiffer et al. 2008).
5. Quasi monochromatic X-ray beam imaging
5.1 Generation of quasi monochromatic beams using diffraction
Different methods have been developed to approximate monochromatic beams i.e. to provide quasi monochromatic beams, which consist of not a single X-ray energy but a narrow range of X-ray energies.
www.intechopen.com

Imaging of the Breast – Technical Aspects and Clinical Implication 138
One method utilizes mosaic crystals to produce quasi-monochromatic X-ray beams. When an X-ray hits the crystalline structure of a material, constructive interference takes place in accordance with the Bragg equation:
にd × sinθ = ぢ × n (3)
where, is the exiting X-ray photon wavelength, d is the spacing between atomic planes of
the crystal and is the diffraction angle and n is an integer. The d-spacings are substance-
specific and like the have an inverse relationship with the energy of the output beam. At
different , different X-ray energy photons are reflected back from the crystal. This is called Bragg reflection and this method was proposed by Baldelli et al. (Baldelli, Taibi et al. 2003) to generate monochromatic X-rays. However, this method has some drawbacks. First of all, because it is a Bragg reflection from a plain surface it provides only a monochromatic fan beam and not a cone beam; furthermore, the intensity of the diffracted beam is very low because only a very small portion of the total incoming X-ray spectrum is reflected back. Moreover, because of the variation of crystal angle in the mosaic crystal and the finite width
of the slits the X-ray beam is only quasi monochromatic with an energy bandwidth of ~E.
Fig. 3. Quasi monochromatic X-ray beam by X-ray diffraction.
A prototype of a quasi monochromatic diffraction system has also been developed for mammography (Baldelli and et al. 2005). Advantages of the system are that it is tunable in the range of 18-24keV, and according to the authors, the dose can be decreased by half. Disadvantages are that it uses little of the available X-ray flux and requires scanning, as it produces only a sheet beam, so the scanning time is a few seconds long (possible motion blur). The resolution of the system is also lower than the best digital mammo systems can produce.
5.2 Applications for quasi monochromatic beams
A similar system to that of Baldelli’s (Baldelli and et al. 2005) was developed for a combined breast SPECT – CT system (Gambaccini, Fantini et al. 2001). It had the same advantages and disadvantages as the mammography system.
www.intechopen.com

Contrast Enhancement in Mammography Imaging Including K Edge Filtering 139
The spatial resolution of such a system was analyzed by Gambaccini et al. (Gambaccini, Tuffanelli et al. 2001) who found that along the direction perpendicular to the diffraction plane the resolution properties of the imaging system mainly depend on the x-ray tube focal spot size and position. Along the diffraction plane the spatial resolution depends on mosaic crystal characteristics and on the geometry of the setup.
6. K edge filters
6.1 Theory of K edge filters
There is another method of generating small energy bandwidth X-ray radiation. It is known that in addition to the Brehmstrahlung radiation, materials bombarded with electrons produce characteristic radiation which increases the intensity of the X-ray radiation at energy levels specific to each material. For instance, a typical X-ray radiation spectrum for a Tungsten (W) anode using 100 kV anode-cathode potential and a 2 mm Al window is shown in Figure 4. As before, the lowest energy X-rays are absorbed by the Al output window. The sharp peeks in the X-ray spectrum are characteristic for the anode material. These peeks are the result of the electron structure of a given material and they show the energy differences between electron shells of the atomic structure.
For example, W has 3 electron shells that play a role in its use as a K edge filter. The 3 innermost electron shells are designated “K”, “L”, “M”, where K is the innermost shell, and M the outermost. For W, K has an energy of 70keV, L has an energy of 11keV, and M has an energy of 3keV. The characteristic peaks for W will occur at “L minus K” and “M minus K”
or at 59keV (designated the K peak) and 67keV (designated the K peak). W also has a second electron in its K shell with a slightly different binding energy which explains the doublets in Figure 4.
The same phenomenon works in the opposite way; materials absorb X-ray photons which are above their binding energy. This is the basis of the K edge filters. Generally at these (energy) levels the X-ray absorption of the material jumps (increases) when the material is used as an X-ray filter. Figure 5 shows the X-ray spectrum for the same W anode and the same X-ray tube voltage as in Figure 4 but with an added 0.2 mm W sheet as a filter. This
Fig. 4. W anode spectra with low energy filter of 2 mm Al.
www.intechopen.com

Imaging of the Breast – Technical Aspects and Clinical Implication 140
added tungsten sheet filters out not only the low energy X-rays but the X-ray spectrum also shows a huge drop in intensity (the absorption increases dramatically) above the tungsten K edge. Please note that the total intensity decreased as well. The scale of Figure 5 is different from that of Figure 4 for better visibility. The total intensity after K edge filtering is always lower than without it for the same energy range but the characteristic K edge radiation peaks are still present. This example shows that material K edge absorption can be used to suppress both low and high energy portions of the original X-ray spectrum to produce narrow bandwidth X-ray radiation or so called quasi-monochromatic X-rays.
Fig. 5. Tungsten (W) anode with 0.2 mm W (K edge) filter.
The absorption spectra of K edge filters can be calculated. If there are no K-edge
discontinuities, then the energy dependence of the linear attenuation coefficient μ(E, x屎王) of
materials can be described by a linear combination of the photo-electric and the Compton
cross-sections 血喧ℎ(E) and 血計軽(E)(Alvarez and Macovski 1976)
づ岫E, x屎王岻 = a丹竪岫x屎王岻 怠醍典 + a大誰岫x屎王岻f啄択岫E/E奪岻 (4)
Here Ee = 510.975 keV denotes the rest mass energy of the electron, and the vector x屎王 describes the space dependence of the attenuation and 1/E3 approximates the energy dependence of the photoelectric interaction. The energy dependence of the Klein–Nishina cross-section (Compton scattering) is given by:
f啄択岫α岻 = 怠袋池池鉄 峙態岫怠袋池岻怠袋態池 − 怠池 ln岫な + にα岻峩 + 怠態池 ln岫な + にα岻 − 怠袋戴池岫怠袋態池岻鉄 (5)
Where 510.975 keV, and aph and FKN are given as:
a丹竪 ≈ K怠 × 茶代 × Z樽n ≈ 4 (6)
a大誰 ≈ K態 × 茶代 × Z (7)
where K1 and K2 are constants, ρ is mass density, A is atomic weight and Z is atomic number. When a material with high atomic number Z is present, the above description of the attenuation properties of the matter has to be modified. To correctly describe the attenuation of a sample containing a single element with K edge discontinuity inside the
www.intechopen.com

Contrast Enhancement in Mammography Imaging Including K Edge Filtering 141
relevant energy range, the decomposition (4) has to be extended by the energy dependent attenuation function of this particular element as a third component (Sukovic and Clinthorne 1999). The decomposition for a high Z element with K edge in the diagnostic energy range becomes:
づ岫E, x屎王岻 = a丹竪岫x屎王岻 怠醍典 + a大誰岫x屎王岻f啄択 岾 醍醍刀峇 +a啄岫x屎王岻f啄岫E岻 = ∑ a叩戴叩退怠 岫x屎王岻f叩岫E岻 (8)
where the values a = 1, 2, 3 represent the photoelectric, Compton and the K edge
components, respectively. In the above formula, aK(x屎王) and fK(E) denote the local density and the mass attenuation coefficient of the K edge material. The latter includes the photoelectric effect, Compton effect and K edge contributions of the material.
6.2 K edge materials, energies, and applications
Table 1 provides a list of some K edge filters whose K edge energies (except for Al and Cu filters) fall into the region where they are or could be applied to X-ray imaging. From the table it is clear that the K edge energy increases with increasing atomic number.
K edge filtering has been used for mammography for some time where different Rhodium (Rh) and Molybdenum (Mo) anode and filter combinations are used to generate energy peaks in the 15- 23 keV energy range.
Table 1. K edge energies for different materials already used or that can be used in K-edge X-ray imaging.
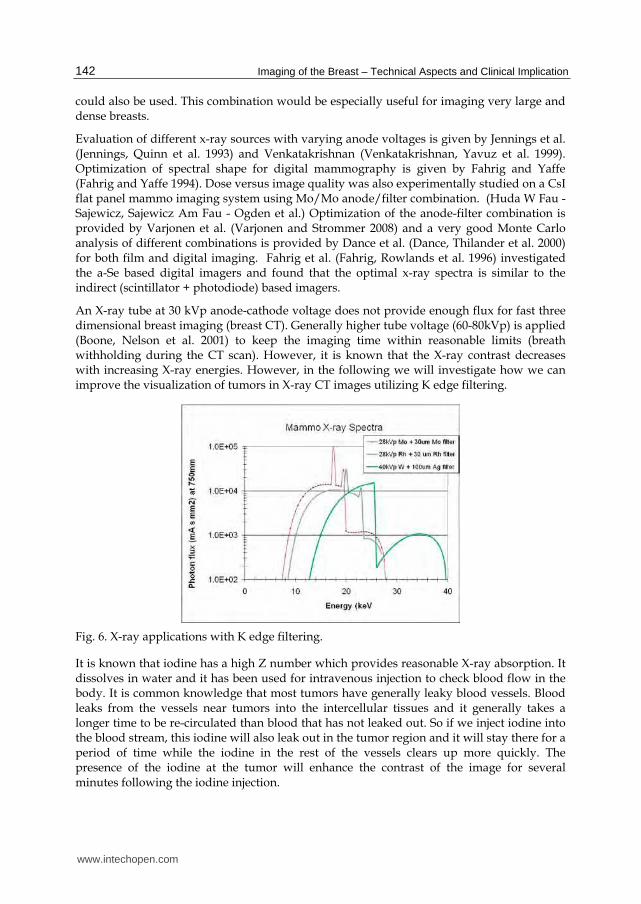
As shown in Figure 6, at an anode voltage of 28 kV, a Mo anode – Mo filter combination gives a lower mean energy of 17.6 keV better suited for thinner, lower density breasts, while the Rh anode – Rh filter combination has a mean energy of 18.3 keV, which is better for thicker and denser breast imaging. Different Mo and Rh anode and filter combinations are used in some specialized mammography imagers and various anode voltages to fine tune the optimum energy spectrum to obtain maximum contrast at minimum dose for different breast types. Tungsten (W) anodes with higher anode voltages (40kV) and Silver (Ag) filters
Material Aluminum Copper Molybdenum Rhodium Silver Tin Iodine
Chemical sign Al Cu Mo Rh Ag Sn I
Atomic number 13 29 42 45 47 50 53
K edge energy in keV 1.6 8.98 20 23.22 25.51 29.2 33.16
Material Barium Cerium Neodimium Europium Gadolinium Holmium
Chemical sign Ba Ce Nd Eu Gd Ho
Atomic number 56 58 60 63 64 67
K edge energy in keV 37.45 40.44 43.56 48.5 50.2 55.6
Material Erbium Ytterbium Tantalum Tungsten Gold Bismuth Uranium
Chemical sign Er Yb Ta W Au Bi U
Atomic number 68 70 73 74 79 83 92
K edge energy in keV 57.5 61.3 67.41 69.5 80.72 90.53 115.6
www.intechopen.com
Imaging of the Breast – Technical Aspects and Clinical Implication 142
could also be used. This combination would be especially useful for imaging very large and dense breasts.
Evaluation of different x-ray sources with varying anode voltages is given by Jennings et al. (Jennings, Quinn et al. 1993) and Venkatakrishnan (Venkatakrishnan, Yavuz et al. 1999). Optimization of spectral shape for digital mammography is given by Fahrig and Yaffe (Fahrig and Yaffe 1994). Dose versus image quality was also experimentally studied on a CsI flat panel mammo imaging system using Mo/Mo anode/filter combination. (Huda W Fau - Sajewicz, Sajewicz Am Fau - Ogden et al.) Optimization of the anode-filter combination is provided by Varjonen et al. (Varjonen and Strommer 2008) and a very good Monte Carlo analysis of different combinations is provided by Dance et al. (Dance, Thilander et al. 2000) for both film and digital imaging. Fahrig et al. (Fahrig, Rowlands et al. 1996) investigated the a-Se based digital imagers and found that the optimal x-ray spectra is similar to the indirect (scintillator + photodiode) based imagers.
An X-ray tube at 30 kVp anode-cathode voltage does not provide enough flux for fast three dimensional breast imaging (breast CT). Generally higher tube voltage (60-80kVp) is applied (Boone, Nelson et al. 2001) to keep the imaging time within reasonable limits (breath withholding during the CT scan). However, it is known that the X-ray contrast decreases with increasing X-ray energies. However, in the following we will investigate how we can improve the visualization of tumors in X-ray CT images utilizing K edge filtering.
Fig. 6. X-ray applications with K edge filtering.
It is known that iodine has a high Z number which provides reasonable X-ray absorption. It dissolves in water and it has been used for intravenous injection to check blood flow in the body. It is common knowledge that most tumors have generally leaky blood vessels. Blood leaks from the vessels near tumors into the intercellular tissues and it generally takes a longer time to be re-circulated than blood that has not leaked out. So if we inject iodine into the blood stream, this iodine will also leak out in the tumor region and it will stay there for a period of time while the iodine in the rest of the vessels clears up more quickly. The presence of the iodine at the tumor will enhance the contrast of the image for several minutes following the iodine injection.
www.intechopen.com
Contrast Enhancement in Mammography Imaging Including K Edge Filtering 143
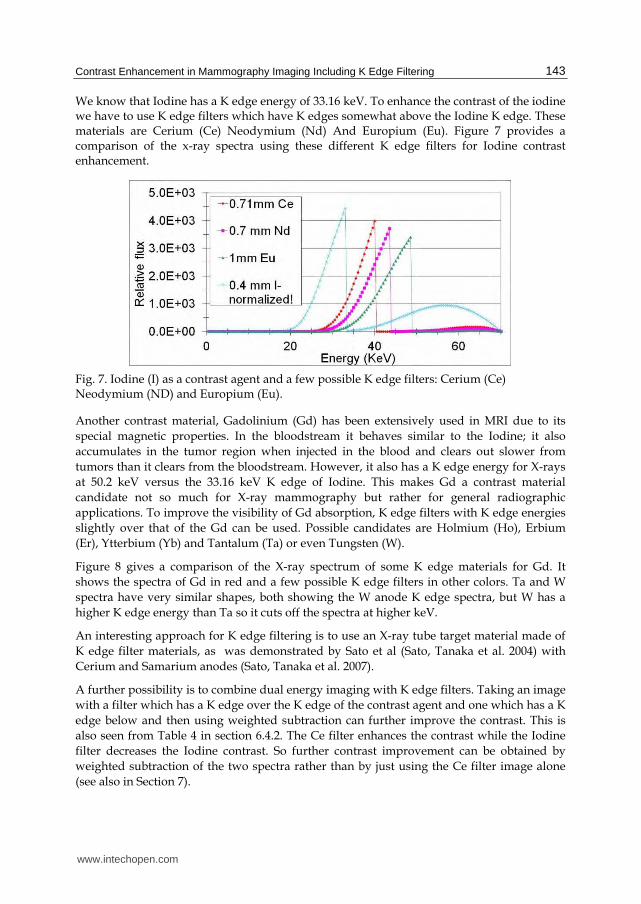
We know that Iodine has a K edge energy of 33.16 keV. To enhance the contrast of the iodine we have to use K edge filters which have K edges somewhat above the Iodine K edge. These materials are Cerium (Ce) Neodymium (Nd) And Europium (Eu). Figure 7 provides a comparison of the x-ray spectra using these different K edge filters for Iodine contrast enhancement.
Fig. 7. Iodine (I) as a contrast agent and a few possible K edge filters: Cerium (Ce) Neodymium (ND) and Europium (Eu).
Another contrast material, Gadolinium (Gd) has been extensively used in MRI due to its
special magnetic properties. In the bloodstream it behaves similar to the Iodine; it also
accumulates in the tumor region when injected in the blood and clears out slower from
tumors than it clears from the bloodstream. However, it also has a K edge energy for X-rays
at 50.2 keV versus the 33.16 keV K edge of Iodine. This makes Gd a contrast material
candidate not so much for X-ray mammography but rather for general radiographic
applications. To improve the visibility of Gd absorption, K edge filters with K edge energies
slightly over that of the Gd can be used. Possible candidates are Holmium (Ho), Erbium
(Er), Ytterbium (Yb) and Tantalum (Ta) or even Tungsten (W).
Figure 8 gives a comparison of the X-ray spectrum of some K edge materials for Gd. It
shows the spectra of Gd in red and a few possible K edge filters in other colors. Ta and W
spectra have very similar shapes, both showing the W anode K edge spectra, but W has a
higher K edge energy than Ta so it cuts off the spectra at higher keV.
An interesting approach for K edge filtering is to use an X-ray tube target material made of
K edge filter materials, as was demonstrated by Sato et al (Sato, Tanaka et al. 2004) with
Cerium and Samarium anodes (Sato, Tanaka et al. 2007).
A further possibility is to combine dual energy imaging with K edge filters. Taking an image
with a filter which has a K edge over the K edge of the contrast agent and one which has a K
edge below and then using weighted subtraction can further improve the contrast. This is
also seen from Table 4 in section 6.4.2. The Ce filter enhances the contrast while the Iodine
filter decreases the Iodine contrast. So further contrast improvement can be obtained by
weighted subtraction of the two spectra rather than by just using the Ce filter image alone
(see also in Section 7).
www.intechopen.com

Imaging of the Breast – Technical Aspects and Clinical Implication 144
Fig. 8. Gd spectrum is in red. To enhance the contrast, Er, Ta or W can serve as K edge filters, which have higher K edges as Gd.
6.3 Experimental work with K edge filters
This section describes some of the author’s own work on different K edge filters used for mammographic CT applications (Zentai 2011).
For the CT tests, so called HU (Hounsfield Unit) Phantoms were prepared. One set was
made for HU calibration. This set consisted of small bottles filled with different water and
alcohol solutions for densities less than water and also with water and glycerin mixtures for
densities higher than water. The bottles were pushed into holes in a large polyethylene
cylinder as shown in Figure 9. Polyethylene plugs were used for keeping the bottles in place
and also for having the same material densities below and above the bottles. However, small
holes were drilled in the center of the plugs for letting the extra air out when pushing the plugs in place. These holes contained air, so HU numbers for the air could also be evaluated
by using the air pocket images of these holes. We found that for alcohol-water and glycerin-
water solutions the X-ray absorption is proportional to the density. So the numbers written
over the bottles of Figure 9 represent the relative densities of the solutions in g/cm3.
As we know, HU numbers are proportional to the absorption (densities) of these liquids; water has HU=0 and air has HU=-1000. HU from 0 to 2000 represent liquids and solids denser than water. For instance, the density of pure alcohol is 0.782 and the approximate Hounsfield number for alcohol can be calculated (-1000 × 0.782) = -782. Similarly, the density of pure glycerin is 1.14 and the Hounsfield number is then 114. So a set of five different solutions and air were used for calibrating the HU numbers for different X-ray tube voltages and different filters.
To compare the HU numbers of different iodine solutions another fixture was designed as shown in Figure 10. The numbers in the figure give the relative density of the iodine solutions in mg/ml.
www.intechopen.com

Contrast Enhancement in Mammography Imaging Including K Edge Filtering 145
Fig. 9. Hounsfield unit CT phantoms.
Fig. 10. Iodine solution phantoms.
A rotational table was used to rotate the phantoms during CT image sequences. First it was verified that the center (focal spot) of the X-ray radiation was lined up with the center of the X-ray imager and that the imaginary line between these two points crossed the pivot-line of the rotation. This alignment was done with the help of a so called Isocal phantom. This phantom consists of a graphite cylinder with BBs, which are arranged in a spiral pattern alongside the perimeter. A detailed description of this method and the phantom is given by A. Jeung et al (Jeung, Sloutsky et al. 2005). We also processed a norm factor calibration when we used a cylindrical object of the same size and material as the bulk of the CT phantoms but without any holes in it. This calibration method is described in more details by Matsinos et al (Matsinos 2005).
The rotational table was driven by a stepper motor for precision rotational speed. 625 images were taken during one 360o rotation. The rotational speed and the imaging speed were synchronized. From these values the angles were calculated for each transmission
www.intechopen.com

Imaging of the Breast – Technical Aspects and Clinical Implication 146
image required for the CT reconstruction. A modified Feldkamp back-projection (Feldkamp, Davis et al. 1984) algorithm was used for cone beam CT reconstruction developed by John Pavkovich at Varian (Pavkovich 1979; Pavkovich).
Imaging was done on a Varian 4030CB CsI/photodiode flat panel imager. The readout ASICs of the imager were set to dynamic gain mode. In this mode the readout ASICs can automatically switch from a high to a low gain mode during the integration time when the signal level exceeds a given limit. This mode provides about 16.5 bit resolution even when the A/D converter has only a 14 bit range. A detailed description of the functions of this readout ASIC is given in (Roos, Colbeth et al. 2004). Imager calibrations were also performed to assure areas of the image where the gain is in transition still appear smooth and continuous.
Different filters were used to evaluate the effect of filtering on the S/N (Signal to Noise) value of the reconstructed CT images and also for the contrast ratio in comparison to CT images without any beam filtering. Lists of the filters and their thicknesses and the corresponding K edges are given in Table 2.
Table 2. Filters applied during the experiments and their consecutive K edge energies.
The entrance doses for each imaging case were measured with a Radcal dose meter, which was placed in the center of the rotational table, where the geometrical center of the object was during the imaging data collection using the exact same conditions.
It is clear that Al and Cu have K edges at very low energies and in this experiment these materials were used as beam hardening filters, filtering out the low energy X-rays. Cerium, Europium and Neodymium all have K edges slightly over the K edge of iodine so they could provide narrow bandwidth filtering for iodine imaging. For comparison we also used a 0.4 mm equivalent thickness iodine solution as a filter. For the K edge filter and no filter experiments we used 60 and 70 kVp X-ray tube anode voltage and 100 kVp for the Cu and Al filters for higher X-ray flux.
6.4 Measurements, results and discussions
6.4.1 Calculation and measurement of X-ray spectra
Spectra of some K edge materials with the given thicknesses were calculated. The
calculation was based on the Report 78 Spectrum Processor Program IPEM 1997 (Cranley,
Gilmore et al. 1997). The original program contained only absorption spectra of a few
materials so additional absorption spectra were obtained from the NIST XCOM website
(NIST 2009). Some calculated spectra are given in Figure 11, Figure 12, and in Figure 13.
Figure 11 shows that the CsI scintillator used in the 4030CB flat panel detector has some filtering effects because of the K edge of Iodine contained in the CsI.
Filter
parameters
Iodine
(I)
Cerium
(Ce)
Neodymium
(Nd)
Europium
(Eu)
Aluminum
(Al)
Copper
(Cu)
Effective
thickness0.4 mm 0.71 mm 0.7 mm 1.0 mm 2.24 mm 0.5 mm
K edge (in
KeV)33.16 40.44 43.56 48.50 1.56 8.98
www.intechopen.com

Contrast Enhancement in Mammography Imaging Including K Edge Filtering 147
Fig. 11. Calculated 60kVp X-ray spectra with 0.4mm Iodine and 0.4 mm CsI filter.
Fig. 12. 60 kVp spectra without any external filter and with 0.4 mm I filter are compared with 100 kVp spectra of 2.24 mm Al and 0.4 mm Cu filters.
From Figure 12 it is clear that while Al effects only the low energy X-rays, copper shifts the mean energy to higher values and K edge filters (Figure 13) significantly decrease the total flux having only single transmission peaks about the K edge energy.
The calculated and measured spectra of the K edge filter materials were compared. Figure
14 contrasts measured and calculated spectra of 0.71mm thick Ce filter. Very good
agreement is shown in the 20 - 69 keV energy range. The flux drop of the measured spectra
over 69 keV is attributed to the so called heel effect, which was simulated by Monte Carlo
method and also measured by Bhat et al (Bhat, Pattison et al. 1999). This effect refers to a
falloff of intensity in the X-ray radiation when the electron beam from the cathode hits the
anode at a small angle. Because of the thick anode material, part of the X-ray generated
deeper in the anode is also absorbed in the anode (in our case tungsten). This is practically
the same filtering effect which is shown in Figure 5. It is especially significant above the 69.5
keV K edge of the tungsten anode where this absorption sharply increases causing a sharp
www.intechopen.com

Imaging of the Breast – Technical Aspects and Clinical Implication 148
decrease above this X-ray energy as can be seen in the measured spectra. However, this
decrease would not affect the filter materials K edge behavior since those energies are much
lower than the tungsten K edge as shown in Figure 13. Furthermore, most of the
measurements with K edge filters were taken only at 60 or 70 kVp X-ray energies, the heel
effect does not even show up at these low energies (below the tungsten K edge).
Fig. 13. Simulated spectra for 70 kVp X-ray source and 0.71 mm Ce, 0.7 mm Nd, 1 mm Eu and 0.4 mm I filtering.
Similarly, good agreement between the calculated and measured spectra for the Nd, I and Eu filters was found. Furthermore, our Ce, Nd and Eu spectra calculations and measurements are also very consistent with similar measurements taken by Crotty et al. (Crotty, McKinley et al. 2006).
Fig. 14. Comparison of calculated and measured X-ray spectra after 0.71 mm Ce filter. Both the measured and the calculated spectra were normalized for the maximum flux value.
www.intechopen.com

Contrast Enhancement in Mammography Imaging Including K Edge Filtering 149
6.4.2 Cone beam measurements
After good agreement between the measured and calculated spectra was demonstrated, CT scans were carried out. It is noted that the K edge filtered X-ray scans require much longer exposure time per frame than scans with the non-filtered or Al and Cu filtered beams in order to get comparable dose results.
CT scans were taken first with the HU phantoms (Figure 9). For each filter and at each kVp, CT reconstructions were carried out and the HU numbers were normalized with the help of the known densities of the HU phantoms. During the normalization an offset and a slope value had to be adjusted at the reconstructed numbers for the best match with the theoretical values.
Next, CT scans were taken of the iodine samples of Figure 10 and the offset and slope calibration numbers from the HU phantom results were applied. A typical CT reconstructed axial view image of the iodine samples with Eu filter is shown in Figure 15. The iodine content increases from top right clockwise.
It is known that HU numbers depend on the energy and spectrum of the X-ray beam and that is why HU calibrations are always performed using the HU phantoms at each X-ray energy and with each filter. Furthermore, some comparisons were made of how much the HU numbers were different if the calibration values from the no filter case were applied instead of applying the calibration values for the proper energy and filter.
Fig. 15. A CT reconstructed axial image slice of iodine bottles. Image sequence was taken at 2 fr/s with 1.0 mm Eu filter at 70 kVp_20 mA continuous X-ray exposure. From top right to clockwise the iodine content of the bottles is 0, 0.5, 1.0, 4.0 and 16.0 mg/ml.
Using the calibrated offset and gain numbers for the iodine samples, HU numbers were obtained for the same iodine filtering as shown in Figure 10. To double check the numbers the air and water (0.00 mg/ml) values were used, which should be close to the nominal -1000 and 0 HU numbers. In this case the largest error is for the air, where the difference between the nominal and reconstructed values was about 20 HU.
www.intechopen.com

Imaging of the Breast – Technical Aspects and Clinical Implication 150
Iodine content in water mg/ml
Nominal (HU) values
Reconstructed (HU) values
Air -1000 -980.00 0.00 0 20.20 0.50 52.00 1.00 73.76 4.00 219.64 16.00 738.37
Table 3. CT reconstruction (HU) values for iodine samples with iodine filter.
Table 3 shows that the HU number increases with increasing iodine content, as expected. The HU slopes for iodine with different filters are plotted in Figure 16. It is shown that higher HU numbers were obtained (better iodine contrast) with Ce, Nd and Eu filters than without using any filter (No-filter case). The K edges all of these materials are above the K edge of iodine as shown in Figure 13. Furthermore, good HU linearity with iodine content was also observed for all cases.
However, if an Iodine filter is used for the iodine samples, lower contrast is obtained than in the no filter case. It is also noticeable that using higher energy X-rays with Al and Cu filters, which filter out the low energy part of the X-ray spectra, the contrast (HU number) further drops. Table 4 summarizes the HU differences with different filters and X-ray energies.
Fig. 16. HU slope with different filters.
www.intechopen.com

Contrast Enhancement in Mammography Imaging Including K Edge Filtering 151
It is quite obvious that the Cerium filter at 60kVp energy significantly increased the HU number (increased the contrast) of iodine. It shows a 26% improvement. Eu and Nd filters also improved the contrast by 16 and 17% respectively. The Al and Cu filters made the X-ray beam harder, so the iodine contrast considerably decreased when these filters and higher X-ray energies were used. However, it is interesting to note that the iodine contrast enhancement with K edge filters drastically depends on the X-ray tube voltage. When the X- ray energies were increased from 60 kVp to 70 kVp, the Ce filter contrast enhancement effect had nearly gone and it gave about the same contrast as the no filter case (see Table 4). This means that to obtain the maximum HU (contrast) improvement with iodine, the right X-ray tube voltage has to be set for each filter material. Furthermore, the material of the imaged object also has an effect on beam hardening, which needs to be considered in the optimization process.
Table 4. HU number difference comparison between the 16 mg/ml iodine and 0 mg/ml (pure water) solutions and the relative HU change for different filters and X-ray energies.
After the iodine contrast improvement, S/N (Signal–to-Noise) ratio was optimized. Dose
per frame was varied to find the highest S/N. Generally the X-ray flux, after the filters were
applied, was an order of magnitude lower than the flux in the no filter case or when the Al
or Cu filters were used. To compensate for this effect the exposure time was increased by
decreasing the framerate. However, the maximum exposure time per frame was also limited
by the heat load limit of the X-ray tube because 625 frames had to be taken for CT
reconstruction. Finally, the dose per frame numbers for the filter cases versus the no filter
case was still about 2-3 times lower.
The S/N ratios were measured at all sample positions and also inside the bulk polyethylene far from the samples. Finally these numbers were averaged for a given measurement to find the (S/N)filter. It is known that for the ideal case, when the electronics noise is negligible, the signal to noise (S/N) value is proportional to the square root of the number of incoming photons (flux). For equivalent image quality the S/N values have to be the same and so we calculated the filtered dose values corresponding to equivalent S/N (Zentai 2011).
第誰坦奪刀桃淘套湯倒嶋刀投盗第誰坦奪唐套嶋盗刀梼 ≈ 岾鍍登峇投搭唐套嶋盗刀梼岻鉄
岾鍍登峇唐套嶋盗刀梼鉄 (9)
Filter HU(16 mg/ml)-
HU(0 mg/ml)
[HU(16)-HU(0)] filter /
[HU(16)-HU(0)] nofilter
No filter (60kVp) 866 1.00
Cu filter (100kVp) 501 0.58
Al filter (100kVp) 599 0.69
I filter (60kVp) 718 0.83
Ce filter (60kVp) 1093 1.26
Ce filter (70kVp) 874 1.01
Eu filter (70kVp)) 1007 1.16
Nd filter (70kVp) 1015 1.17
www.intechopen.com

Imaging of the Breast – Technical Aspects and Clinical Implication 152
Where Doseequivalent is the dose for the filter, which gives the same S/N ratio as the no filter case, and Dosefilter is the dose measured when a given filter was applied. (S/N)nofilter is the signal to noise ratio for the no filter case while (S/N)filter is for the filtered case. The dose per frame difference during the measurement was only 2-3 times lower for the filtered cases so we thought that the above approximation would not introduce significant error. This approximation was double checked with measurements and S/N evaluation at two different dose-rates and for 8 times dose difference the error using the above approximation was less than 10%.
The equivalent dose from equation (9):
Dose奪単探辿旦叩狸奪樽担 ≈ 岾鍍登峇投搭唐套嶋盗刀梼岻鉄岾鍍登峇唐套嶋盗刀梼鉄 × Dose脱辿狸担奪嘆 (1)
After calculating the equivalent doses for each filter, these dose values were divided by the
no filter case dose and dose equivalent S/N dose ratios were obtained. Both the equivalent
doses and dose ratios are reported in Table 5. These numbers tell how much absolute and
relative dose is needed when using these filters to get the same S/N value as the no filter
case.
Table 5 tells that practically all of the filter materials used in these experiments provide the
same S/N ratio at lower dose as the no filter case. From the dose point of view a Cu filter
gives nearly the same very low dose as a Eu filter. However, it is important not just to get
lower dose but at the same time to provide better contrast resolution and therefore higher
HU numbers for iodine as explained previously.
Table 5. Equivalent dose and dose rates.
6.4.3 Some other applications of K edge filters
In addition to mammography, Iodine and K edge filters are used for other medical x-ray imaging applications, such as lung tumor imaging and, frequently, angiography. (Nyman U Fau - Elmstahl, Elmstahl B Fau - Leander et al.), (Sato, Tanaka et al. 2004; Sato, Tanaka et al. 2007), (Sato, Hayasi et al. 2006).
Filter Measured
Dose uR/fr
S/N Average
@ Measured
Dose
S/N
Equivalent
Dose (uR/fr)
Dose
ratio
No filter (60kVp) 1111 94.0 1111 1.00
Cu filter (100kVp) 569 114.3 385 0.35
Al filter (100kVp) 858 121.3 516 0.46
I filter (60kVp) 598 92.8 614 0.55
Ce filter (60kVp) 404 80.3 830 0.50
Ce filter (70kVp) 598 87.9 685 0.62
Eu filter (70kVp)) 648 121.4 389 0.35Nd filter (70kVp) 627 98.5 571 0.51
www.intechopen.com
Contrast Enhancement in Mammography Imaging Including K Edge Filtering 153
A further enhancement of K edge filters involves using these filers in combination with counting mode energy resolution detectors mostly in CT applications (Alvarez and Macovski 1976; Roessl, Brendel et al. 2008; Schlomka and et al. 2008; Watanabe, Sato et al. 2008).
It is interesting to note that K edge imaging is also used in NDT (non Destructive Testing) applications by Jensen et al (Technology ; Jensen, Aljundi et al. 1997), when they measure the total uranium content in reactor fuel plates using the K edge technique. A further interesting application of K edge imaging is in the analysis of paintings where researchers verify authenticity and hunt for paintings that have been painted over (Dik 2004).
7. Conclusion
This chapter presented different methods used in mammography to improve the contrast between adipose and glandular tissues but especially to find cancerous cells and regions.
First of all the right energy range has to be determined for minimum patient dose with maximum contrast. Dual energy imaging, which uses two images taken at different energies, further enhances the contrast between different tissues and especially when contrast material is used.
Monochromatic X-ray beams are ideal for getting high quality images with optimal dose level and avoiding beam hardening artifacts. Moreover, monochromatic imaging can provide phase contrast images with excellent soft tissue contrast. The major drawbacks are that the synchrotrons, which can provide monochromatic beams with enough flux for medical imaging, are very large and expensive sources of X-rays.
Quasi monochromatic X-rays can be obtained by diffraction of X-rays emitted by an X-ray tube onto a mosaic crystal. The output beam has a limited bandwidth, low output flux, and has a fan beam shape. This limits its application only for scanning type imagers.
Another method of generating quasi monochromatic beams uses K edge filters. These filter
materials have K edge electrons with bonding energies in the diagnostic X-ray energy range.
The material can absorb an X-ray photon, whose energy is equivalent to or slightly higher
than the K edge energy, by releasing an electron. The material’s X-ray absorption level
dramatically increases at or above this energy. As a result, x-rays higher than the K edge
energy are suddenly cut off. Using these materials as X-ray filters, a narrow x-ray
transmission energy range below the K edge energy can be obtained. One advantage of the
K edge filters is that they provide cone beam shaped X-ray radiation rather than fan beam
shaped radiation.
Iodine and Gadolinium are contrast agents injected into the blood flow. They absorb the x-rays better than body tissues providing an x-ray shadow. They accumulate in the cancerous cells and remain there longer than they remain in the blood stream. This enhanced x-ray absorption provides extra contrast for better visibility of tumors. Using K edge filters X-ray image contrast of the I or Gd absorption can be further increased. I and Gd are frequently used as contrast agents for CT imaging. The experimental part of this paper describes evaluation of a few K edge filter materials using Iodine contrast material. These filters were compared to the non filtered case and also to Al and Cu filters, which provided only X-ray beam hardening. CT scans were performed and the HU numbers
www.intechopen.com

Imaging of the Breast – Technical Aspects and Clinical Implication 154
were calculated for iodine contrast agents. It was found that the beam hardening Al and Cu filters and even the iodine filter decreased the iodine HU number, but the K edge filters, which have K edge energy slightly above the K edge of iodine, increased the HU number (increased iodine contrast). This increase can be as high as 26% for Ce filter at 60 kVp. However, it is seen that using an Iodine filter for an Iodine contrast agent decreases the HU number to the no-filter case. That creates an option to further enhance the contrast by subtracting the Iodine filtered image from the Ce filtered one. This would provide an additional ~17% contrast enhancement of iodine. A drawback of this method is that we need two images (practically dual energy imaging), which increases the dose to the patient and increases noise.
We also found that the increase of HU number is linearly proportional with the iodine content in water.
Furthermore, the doses required for S/N number equivalent to the no filter case are lower
for each filter material. However, we need not just lower dose but want to increase the
iodine contrast (higher HU number for iodine). From this point of view Eu is a much better
choice than Cu even if their dose improvement is nearly the same. The dose improvement is
nearly 3 times for both filters but Cu decreased the HU number (the iodine visibility) nearly
to half of the no filter case. So both the HU increase and the dose improvement have to be
considered in parallel. From these considerations Ce, Eu and Nd are all promising
candidates for iodine contrast imaging enhancement. Moreover, the HU contrast
enhancement effect depends strongly on the X-ray tube voltage as seen in Table 4 for Ce and
also on the object material, which contains the iodine, so careful optimization is required for
getting the maximum HU improvement with a significantly decreased dose to the patient.
Mc. Kinley et al investigated the effect of K edge filtering on breast CT and found dose
reduction possibility up to 6 times while keeping the same contrast ratio (McKinley Iii,
Tornai et al. 2007).
Watanabe et al (Watanabe, Sato et al. 2008) and Roessl et al (Roessl, Brendel et al. 2008) also
investigated how K edge imaging improves the signal to noise ratio but they used a photon
counting CT method. S/N ratio improvement was demonstrated by using the K edge
technique but the photon counting method is much more expensive and a slower process
than multislice or cone beam CT with K edge filter. These drawbacks come from the high
price of the large area pixellated energy resolution detectors and the counting speed is very
limited.
Finally, it is very important that for HU calibration we have to use the same kVp setting and
filter that we use for scanning the CT object otherwise huge reconstruction errors could be
introduced (Zentai 2011).
We need to add that we used heavy K edge filtering of 200th value layer K edge filters for
Ce, Eu and Nd. These thick filters significantly decreased the X-ray intensity even around
the K edge. From our measurements and calculations we concluded that thinner filters may
provide the same advantages that these thick filters without the large flux reduction. This
could ease the tube flux requirement and so decrease the maximum heat load and/or
increase the CT scanning speed.
www.intechopen.com

Contrast Enhancement in Mammography Imaging Including K Edge Filtering 155
8. References
Alvarez, R.E. and Macovski, A. (1976) Energy-selective reconstructions in X-ray computerized tomography. Physics in Medicine and Biology 21, 733-44.
Arvanitis, C.D., Royle, G. et al. (2007) Dual energy contrast enhanced breast imaging optimization using contrast to noise ratio. In, Medical Imaging 2007: Physics of Medical Imaging, SPIE, San Diego, CA, USA, Vol. 6510, pp. 65102Y-10.
Baldelli, P. and et al. (2005) A prototype of a quasi-monochromatic system for mammography applications. Physics in Medicine and Biology 50, 2225.
Baldelli, P., Taibi, A., Tuffanelli, A. et al. (2003) Quasi-monochromatic x-rays for diagnostic radiology. Physics in Medicine and Biology 48, 3653-3665.
Bhat, M., Pattison, J., et al. (1999) Off-axis x-ray spectra: A comparison of Monte Carlo simulated and computed x-ray spectra with measured spectra. Medical Physics 26, 303-309.
Boone, J.M., Nelson, T.R., et al. (2001) Dedicated Breast CT: Radiation Dose and Image Quality Evaluation. Radiology 221, 657-667.
Boone, J.M., Shaber, G.S., et al. (1990) Dual-energy mammography: a detector analysis. Medical Physics 17, 665-75.
Carton, A.-K., Lindman, K., et al. (2007) Dual-energy subtraction for contrast-enhanced digital breast tomosynthesis. In, Medical Imaging 2007: Physics of Medical Imaging, SPIE, San Diego, CA, USA, Vol. 6510, pp. 651007-12.
Chen, B., Jing, Z., et al. (2006) Dual-energy contrast-enhanced digital mammography (DE-CEDM): optimization on digital subtraction with practical x-ray low/high-energy spectra. In, Medical Imaging 2006: Physics of Medical Imaging, SPIE, San Diego, CA, USA, Vol. 6142, pp. 61422N-10.
Coello, C.S., Dinten, J.-M., et al. (2007) Dual-energy technique for digital flat-panel detectors without x-ray tube voltage switching. In, Medical Imaging 2007: Physics of Medical Imaging, SPIE, San Diego, CA, USA, Vol. 6510, pp. 651005-10.
Cranley, K., Gilmore, B.J., et al. (1997) Catalogue of Diagnostic X-ray Spectra and Other Data. The Institute of Physics and Engineering in Medicine, UK.
Crotty, D.J., McKinley, et al. (2006) Experimental spectral measurements of heavy K-edge filtered beams for x-ray computed mammotomography. In, Medical Imaging 2006: Physics of Medical Imaging, SPIE, San Diego, CA, USA, Vol. 6142, pp. 61421V-11.
Dance, D., Thilander, A., et al. (2000) Influence of anode/filter material and tube potential on contrast, signal-to-noise ratio and average absorbed dose in mammography: a Monte Carlo study. Br J Radiol 73, 1056-1067.
Dik, J. (2004) Using XRF and Dual Energy K-edge Absorption imaging in the study of paintings. In http://neutra.web.psi.ch/cost-g8/presentations/dik.pdf
Donath, T., Pfeiffer, F., et al. (2008) Phase-contrast imaging and tomography at 60 keV using a conventional x-ray tube. In, Developments in X-Ray Tomography VI, SPIE, San Diego, CA, USA, Vol. 7078, pp. 707817-8.
Ersahin, A., Molloi, S.Y. et al. (1994) Scatter and veiling glare corrections for quantitative digital subtraction angiography. SPIEVol. 2163, pp. 172-183.
Fahrig, R., Rowlands, J.A. et al. (1996) X-ray imaging with amorphous selenium: optimal spectra for digital mammography. Med Phys 23, 557-67.
Fahrig, R. and Yaffe, M.J. (1994) Optimization of spectral shape in digital mammography: Dependence on anode material, breast thickness, and lesion journal article. AAPMVol. 21, pp. 1473-1481.
www.intechopen.com

Imaging of the Breast – Technical Aspects and Clinical Implication 156
Feldkamp, L.A., Davis, L.C. et al. (1984) Practical cone-beam algorithm. J. Opt. Soc. Am. A 1, 612-619.
Fiedler, S., Elleaume, H., et al. (2000) Dual-energy coronary angiography in pigs using a Gd contrast agent. In, Medical Imaging 2000: Physics of Medical Imaging, SPIE, San Diego, CA, USA, Vol. 3977, pp. 96-103.
Fiedler, S. and et al. (2004) Imaging lobular breast carcinoma: comparison of synchrotron radiation DEI-CT technique with clinical CT, mammography and histology. Physics in Medicine and Biology 49, 175.
Gambaccini, M., Fantini, A., et al. (2001a) Development of a quasi-monochromatic CT system for breast cancer study with combined emission-transmission tomography. Nuclear Science, IEEE Transactions on 48, 703-706.
Gambaccini, M., Tuffanelli, A., et al. (2001b) Spatial resolution measurements in quasimonochromatic x rays with mosaic crystals for mammography application. Medical Physics 28, 412-8.
GE GE Lunar DPX Bravo Bone Densitometer. In. http://www.mechealthcareonline.com/p-127-ge-lunar-dpx-bravo-bone-densitometer.aspx
Hologic Hologic Bone Densitometry. In. http://www.hologic.com/en/skeletal/osteoporosis-assessment/discovery/
Huda W Fau - Sajewicz, A.M., et al. Experimental investigation of the dose and image quality characteristics of a digital mammography imaging system. Medical Physics (2003), Vol.30 (3) 442-448
Jennings, R.J., Quinn, et al. (1993) Evaluation of x-ray sources for mammography. SPIE Vol. 1896, pp. 259-268.
Jensen, T., Aljundi, T., et al. (1997) X-ray, K-Edge Measurement of Uranium Concentration in Reactor Fuel Plates. In. http://www.osti.gov/bridge/servlets/purl/671994-VS0FZp/webviewable/671994.pdf
Jeung, A., Sloutsky, A., et al. (2005) WE-C-T-617-10: Geometry Calibration of An On-Board KV Imaging System. Medical Physics 32, 2129-2130.
Johns, P.C., Drost, D.J., et al. (1983) Dual Energy Mammographic Imaging. In Fullerton, G.D. (ed.), SPIE Application of Optical Instrumentation in Medicine SPIE, Vol. 0419, pp. 201-208.
Johns, P.C. and Yaffe, M.J. (1985) Theoretical optimization of dual-energy x-ray imaging with application to mammography. Medical Physics 12, 289-96.
Kappadath, S.C., Shaw, C.C., et al. (2004) Dual-energy digital mammography for calcification imaging: theory and implementation. In, Medical Imaging 2004: Physics of Medical Imaging, SPIE, San Diego, CA, USA, Vol. 5368, pp. 751-760.
Kashani, H., Varon, C.A., et al. (2010) Diagnostic Performance of a Prototype Dual-Energy Chest Imaging System: ROC Analysis. Academic radiology 17, 298-308.
Matsinos, E. (2005) Current status of the CBCT project at Varian Medical Systems. In, Medical Imaging 2005: Physics of Medical Imaging, SPIE, San Diego, CA, USA, Vol. 5745, pp. 340-351.
McKinley Iii, R.L., Tornai, et al. (2007) A contrast-detail comparison of computed mammotomography and digital mammography. In, Medical Imaging 2007: Physics of Medical Imaging, SPIE, San Diego, CA, USA, Vol. 6510, pp. 65101D-10.
NIST (2009) Photon Absorption data for elements compounds and mixtures in the 1 keV-100GeV range. In. http://physics.nist.gov/PhysRefData/Xcom/html/xcom1.html
www.intechopen.com

Contrast Enhancement in Mammography Imaging Including K Edge Filtering 157
Nyman U Fau - Elmstahl, B., et al. Are gadolinium-based contrast media really safer than iodinated media for digital subtraction angiography in patients with azotemia? Radiology 2002 Vol. 232 (2) pp. 311-318.
Pavkovich, J. (1979a) Tomographic apparatus and method for reconstructing planar slices from non-absorbed and non-scattered radiation. In, US Patent, Varian Associates, Inc., US Patent # 4149247.
Pavkovich, J.M. (1979b) Apparatus and method for reconstructing data. In, US Patent, Varian Associates, Inc., US Patent # 4149248.
Puong, S., Bouchevreau, X., et al. (2007a) Dual-energy contrast enhanced digital mammography using a new approach for breast tissue canceling. In, Medical Imaging 2007: Physics of Medical Imaging, SPIE, San Diego, CA, USA, Vol. 6510, pp. 65102H-12.
Puong, S., Patoureaux, F., et al. (2007b) Dual-energy contrast enhanced digital breast tomosynthesis: concept, method, and evaluation on phantoms. In, Medical Imaging 2007: Physics of Medical Imaging, SPIE, San Diego, CA, USA, Vol. 6510, pp. 65100U-12.
Roessl, E., Brendel, B., et al. (2008) Sensitivity of photon-counting K-edge imaging: Dependence on atomic number and object size. In, Nuclear Science Symposium Conference Record, 2008. NSS '08. IEEE, pp. 4016-4021.
Roos, P.G., Colbeth, R.E., et al. (2004) Multiple-gain-ranging readout method to extend the dynamic range of amorphous silicon flat-panel imagers. In, Medical Imaging 2004: Physics of Medical Imaging, SPIE, San Diego, CA, USA, Vol. 5368, pp. 139-149.
Rutherford, R.A., Pullan, B.R. et al. (1976) X-ray energies for effective atomic number determination. Neuroradiology 11, 23-8.
Sato, E., Hayasi, Y., et al. (2006) K-edge angiography utilizing a tungsten plasma X-ray generator in conjunction with gadolinium-based contrast media. Radiation Physics and Chemistry 75, 1841-1849.
Sato, E., Tanaka, E., et al. (2004) Demonstration of enhanced K-edge angiography using a cerium target x-ray generator. Medical Physics 31, 3017-3021.
Sato, E., Tanaka, E., et al... (2007) Demonstration of Enhanced K-edge Angiography Utilizing a Samarium X-ray Generator. In, World Congress on Medical Physics and Biomedical Engineering 2006, Springer, Vol. 14 (10), pp. 1359-1362.
Saunders, R., Samei, E., et al. (2008) Optimization of dual energy contrast enhanced breast tomosynthesis for improved mammographic lesion detection and diagnosis. In, Medical Imaging 2008: Physics of Medical Imaging, SPIE, San Diego, CA, USA, Vol. 6913, pp. 69130Y-11.
Shimura, K., Nakajima, N., et al. (1993) Basic investigation of dual-energy x-ray absorptiometry for bone densitometry using computed radiography. SPIE Vol. 1896, pp. 121-129.
Sukovic, P. and Clinthorne, N.H. (1999) Basis material decomposition using triple-energy X-ray computed tomography. In, IEEE 16th Instrumentation and Measurement Technology Conference 1999, IEEE, Venice, Italy, Vol. 3, pp. 1615-18.
Sutton, D. (2009) Spectral Impact on Dose and Image Quality in Conventional Radiography. In. Technology, I. Portable X-Ray, K-Edge Heavy Metal Detector. In.
www.dundee.ac.uk/medphys/documents/SPIMAPCT.pdf Varjonen, M. and Strommer, P. (2008) Optimizing the anode-filter combination in the sense of
image quality and average glandular dose in digital mammography. In, Medical Imaging 2008: Physics of Medical Imaging, SPIE, San Diego, CA, USA, Vol. 6913, pp. 69134K-8.
www.intechopen.com
Imaging of the Breast – Technical Aspects and Clinical Implication 158
Venkatakrishnan, V., Yavuz, M., et al. (1999) Experimental and theoretical spectral optimization for digital mammography. SPIEVol. 3659, pp. 142-149.
Walter, D.J., Wu, X., et al. (2004) Dual kVp material decomposition using flat-panel detectors. In, Medical Imaging 2004: Physics of Medical Imaging, SPIE, San Diego, CA, USA, Vol. 5368, pp. 29-39.
Watanabe, M., Sato, E., et al. (2008) Energy-discriminating K-edge x-ray computed tomography system. In, SPIE Penetrating Radiation Systems and Applications IX, SPIE, San Diego, California, Vol. 7080, pp. 70800B-1-5.
Zentai, G. (2011) Signal-to-Noise and Contrast Ratio Enhancements by Quasi-Monochromatic Imaging. IEEE Transactions on Instrumentation and Measurement Vol. 60, 908-915.
www.intechopen.com
Imaging of the Breast - Technical Aspects and Clinical ImplicationEdited by Dr. Laszlo Tabar
ISBN 978-953-51-0284-7Hard cover, 224 pagesPublisher InTechPublished online 16, March, 2012Published in print edition March, 2012
InTech EuropeUniversity Campus STeP Ri Slavka Krautzeka 83/A 51000 Rijeka, Croatia Phone: +385 (51) 770 447 Fax: +385 (51) 686 166www.intechopen.com
InTech ChinaUnit 405, Office Block, Hotel Equatorial Shanghai No.65, Yan An Road (West), Shanghai, 200040, China
Phone: +86-21-62489820 Fax: +86-21-62489821
Early detection of breast cancer combined with targeted therapy offers the best outcome for breast cancerpatients. This volume deal with a wide range of new technical innovations for improving breast cancerdetection, diagnosis and therapy. There is a special focus on improvements in mammographic image quality,image analysis, magnetic resonance imaging of the breast and molecular imaging. A chapter on targetedtherapy explores the option of less radical postoperative therapy for women with early, screen-detected breastcancers.
How to referenceIn order to correctly reference this scholarly work, feel free to copy and paste the following:
George Zentai (2012). Contrast Enhancement in Mammography Imaging Including K Edge Filtering, Imagingof the Breast - Technical Aspects and Clinical Implication, Dr. Laszlo Tabar (Ed.), ISBN: 978-953-51-0284-7,InTech, Available from: http://www.intechopen.com/books/imaging-of-the-breast-technical-aspects-and-clinical-implication/contrast-enhancement-in-mammography-imaging-including-k-edge-filtering

© 2012 The Author(s). Licensee IntechOpen. This is an open access articledistributed under the terms of the Creative Commons Attribution 3.0License, which permits unrestricted use, distribution, and reproduction inany medium, provided the original work is properly cited.