contrasting the perception and response of domestic ... · 1 contrasting the perception and...
TRANSCRIPT

University of Kent
School of Economics Discussion Papers
Contrasting the Perception and Response of
Domestic Manufacturing Firms to FDI in
Sub-Saharan Africa
Penélope Pacheco-López
October 2014
KDPE 1410

1
Contrasting the Perception and Response of Domestic
Manufacturing Firms to FDI in Sub-Saharan Africa
Penélope Pacheco-López
University of Kent
October 2014
Abstract
This paper uses the data set from the fourth survey by UNIDO of manufacturing firms in Sub-Saharan
Africa to identify whether foreign direct investment affects the behaviour of local firms with respect
to investment, product innovation and process innovation. We look at the perception and response of
1,140 manufacturing firms in 9 sectors in 19 countries. Using Probit models the results suggest that,
once controlling for firm’s characteristics, there is a marked difference between perception and
reality. The presence of foreign investment has not affected the behaviour of the vast majority of
domestic firms in terms of their investment, production of similar products to foreign firms,
production of different products to avoid competition or adopt similar production technologies.
Key words: FDI, investment, technology, Sub-Saharan African countries.
JEL classification: O14; 031; O55
School of Economics, University of Kent, School of Economics, Keynes College, Office Lg15, E-mail: [email protected]

2
1. Introduction
There is a general consensus in the literature that foreign direct investment (FDI) can improve
the economic performance of a country, although some have argued that the emphasis that
the international community gives to the role of FDI is out of proportion when it is contrasted
to the empirical evidence.1 However, the United Nations and other international organisations
promote the idea: “We [the United Nations General Assembly] resolve therefore to take
special measures to address the challenges of poverty eradication and sustainable
development in Africa, including debt cancellation, improved market access, enhanced
Official Development Assistance and increased flows of Foreign Direct Investment, as well
as transfer of technology” (UN Millennium Declaration, A/55/L.2, 8 September 2000). A few
years earlier, on the same lines, the World Bank stated “if developing countries are to get
more global knowledge, they need to attract more FDI” (World Bank, 1998/99, p.29).
Theoretically, FDI is regarded as one of the main channels to transfer technology from more
advanced economies to less developed ones. The knowledge of foreign companies can spill
over to domestic firms through learning by their workers and domestic suppliers and through
backward and forward linkages. It is also argued that foreign investors can provide local
firms with an incentive to innovate as a means to compete, which induces local firms to
respond to defend their markets and retain market share (Chung, 2001). It is expected that
local firms try to improve their productivity, and this is the area where most of the empirical
research has focused on (e.g. Aitken and Harrison, 1999; Haddad and Harrison, 1993;
Javorcik, 2004; Xu, 2000).
But one important aspect of FDI which is missing from the literature relates to the difference
between the perception of the effect of FDI and the actual response of domestic firms to FDI.
The purpose of this paper is to explore this difference using a survey published by UNIDO
(2012) containing information on approximately 7,000 firms based in 19 Sub-Saharan
African countries in 2010 of which 64 per cent were domestic and 36 per cent were partly or
wholly foreign-owned. The purpose of the survey was to generate a reliable informative data
platform to assist Sub-Saharan African countries develop foreign investment promotion
strategies. It collected information on investor (firm) characteristics; investment performance
indicators; financial data; and various responses of domestic firms to the presence of FDI. Do
domestic firms undertake more investment as a result of FDI? Do they carry on producing
1 Moss et. al. (2006) argue that “many of the purported benefits of FDI are frequently challenged directly, on
both ideological and empirical grounds” (p.343).

3
similar products, or produce different products to avoid competition? Do they adopt similar
production technologies? Does the response depend on whether the domestic firms are
exporting or not? The richness of the data makes it possible to contrast the perception that
managers have about the presence of foreign investment and the actual response to FDI on
investment, innovation and technology upgrading.
After analysing the data using Probit analysis, it has to be said that the enthusiasm for FDI
has to be tempered with caution. In the Sub-Saharan African case analysed here, the
spillovers seem to be minimal. The conclusions of the much-cited paper by Görg and
Greenaway (2004), “Much Ado About Nothing? Do Domestic Firms Really benefit from
Foreign Direct Investment?” still apply: “‘general’ policies aimed at altering the
fundamentals are more important than specific policies geared to particular investments.”
The paper is organised as follows. The next section refers to a succinct description of the
literature review, presenting the theoretical and empirical arguments about the relationship
between FDI and local firms’ response. The third section deals with the description of the
data focusing mainly on the characteristics of the local manufacturing firms in the 19 Sub-
Saharan African countries. The fourth section gives the results of our analysis using Probit
analysis, and the marginal effects on each of the dependent variables we look at such as
increased investment due to the presence of foreign investors; production of similar products
to those produced by foreign companies; adoption of similar production technologies; etc.
Here the differences between the perception and actual response of local firms to the presence
of foreign firms are highlighted. The last section concludes with some policy suggestions.
2. Literature review
Economic theory gives some guidance of what to expect from FDI. It is recognised that FDI
not only leads to an inflow of capital to a country, but also that foreign firms have specific
advantages (e.g. production methods, marketing, management, etc.) which can benefit
domestic firms through technological spillovers via imitation, labour mobility and
competition. These spillovers have the potential to increase productivity, but the potential for
host countries to benefit from them depends on their structural characteristics, in particular
their absorptive capacity, which in turn depends on the stock of human capital, the dynamism
of entrepreneurship, the quality of institutions, and the desire for progress (Abramovitz,
1986). Theoretically, Kokko (1994) identifies at least four ways in which technology might

4
be diffused from foreign companies to domestic firms in the host economy: (i)
demonstration-imitation; (ii) competition; (iii) foreign linkage; and, (iv) training. Two
arguments on technological distance and spillovers are present in the literature on FDI and
technology transfer. The first argues that the wider the technology gap between foreign and
domestic firms, the more the scope for spillovers (Findlay, 1978). The other argument
suggests that the narrower the gap the easier it is to bridge the gap (Glass and Saggi, 1998).
Görg and Greenaway (2004) and Kokko (1994) suggest that the latter argument is more
plausible than the former.
Various papers have contributed to assess the externalities on productivity generated by FDI,
for example, Haddad and Harrison (1993); Aitken and Harrison (1999); Djankov and
Hoekman (2000); Xu (2000); Javorcik (2004); Keller and Yeaple (2009); Arnold, Javorcik
and Mattoo (2011); Guadalupe et. al. (2012); Fernadez and Paunov (2012), among many
others. However, as our interest is exploring the answers of local firms to the perception and
actual response to FDI, to the best of our knowledge we only find three relevant recent papers
related to our research question: García et. al. (2013), Ge Bao and Chen (2013) and Boly et.
al. (2013).
García et.al. (2013) use data from 1799 Spanish manufacturing firms from 1990 to 2002.
They analyse the relationship between industry-level and firm-level inward FDI and the
innovative performance of local firms. They found that inward FDI into Spanish firms is
negatively associated with the ex post innovation. Inward FDI blunts domestic innovation.
“Specifically, we find that firm-level FDI inflows are negatively related to the ex post patent
applications of multinational affiliates.”(p.242). Also, they find a negative relationship
between industry-level FDI inflows and the ex post product innovation of local firms,
meaning that foreign entry crowds out domestic innovation and/or relegates domestic firms to
less profitable niches. In other words, they argue that inward FDI may actually hinder the
development of technological capabilities among local firms and, hence, the long-term
growth prospects of local economies.
Ge Bao and Chen (2013) apply a very novel approach to separate the response of domestic
firms to the presence of foreign investment and the effect of actual foreign competition by
exploring the time lags between the foreign investment news and actual investments. They
construct a data set of foreign investment news between 2001 and 2007. Their results suggest
that domestic firms respond significantly to the ‘threat’ of foreign investor competition by
increasing productivity, R&D, training, patent applications, product diversification and

5
advertising expenditure. However, the actual arrival of foreign investors is found to have
weak effects or none at all on productivity.
In a recent paper, Boly et. al. (2014) use the same data base as in our paper to explore the
channels through which foreign investors have an impact on the local firms and the
characteristics which could make them net ‘winners’ or ‘losers’. By using Probit models,
their analysis suggests that the effects of FDI inflows on domestic Sub-Saharan African firms
are heterogeneous across countries. They find evidence to argue that large, newly established
and highly productive domestic firms are those more likely to benefit from interactions with
foreign firms. The found that the effects of inward FDI on Sub-Saharan Africa firms are
heterogeneous across countries, and the differences are influenced by domestic firms
characteristics and contrasting macroeconomic environments within which domestic and
foreign firms compete.
In the next section, we are going to describe the data set and characteristics of the firms used
in our study to differentiate the perception from the actual response of FDI on Sub-Saharan
African firms.
3. Data and empirical analysis
3.1 Data
In the present study we use firm-level data on 1,140 manufacturing firms in 19 Sub-Saharan
African countries, collected by UNIDO in the Africa Investor Survey 2010. This is the fourth
survey of investors under the UNIDO’s Investment Programme and it is designed in the
context of the Network of African Investment Promotion Agencies (AfriPANet).2 In
particular, our study in this analysis contributes to the second out of the six components of
the Programme, “b) Analysis of the data to assess perceptions, performance and plans of
different types of investors and investigate the impact of their operations on the socio-
economic development objectives of host countries;” (UNIDO, 2012: p.30).
The survey was conducted from 2010 to 2011 covering almost 7000 firms, in four broad
sectors: agriculture, mining, manufacturing and others (e.g. electricity, gas and water supply;
and, construction). 3
The purpose of the survey was to provide reliable firm data to look at the
2 See www.unido.org/afripanet or www.afripanet.org 3 For a detailed description of the database see UNIDO, 2012.

6
impact of FDI and to formulate investment promotion strategies which could attract potential
foreign and domestic investment in Africa. The vast survey contains detailed information on
over 700 variables.
The description of the statistics is revealing in itself about the characteristics and composition
of manufacturing firms in Sub-Saharan Africa. The empirical analysis discussed later will
refer to 1,140 domestic firms distributed among 19 Sub-Saharan African countries. The
distribution of firms across countries and their size is shown in Table 1. The country
distribution of firms is very wide ranging from 201 in Ethiopia to 1 in Burkina Faso. In terms
of size, the majority of the firms are categorized as medium size in terms of full time
employees, from 22 to 75.
[Table 1]
In Table 2 the distribution of manufacturing firms according to industries and locations is
presented. Most of the firms are in the sector containing coke and refined petroleum,
chemicals, plastics and rubber, and non-metallic mineral products (240 firms); followed by
food, beverage and tobacco (228 firms) and basic metals and fabricated metal products
(166 firms). The smallest sectors are recycling (9 firms) and motor vehicles, trailers and
other transport equipment (14 firms). Another characteristic to highlight is the composition
of manufacturing industries regarding their level of technological sophistication, high,
medium or low, according to the OECD criteria. Table 3 shows this structure: high-
technology manufacturing, with 13.5% of the sample; medium technology manufacturing
with 27.7%, and low technology with 58.8%. For all the countries this composition is
skewed towards the low technology spectrum, but notice that there are four countries
(Rwanda, Niger, Burundi and Burkina Faso) that do not have any firms in the high
technological category at all.
[Table 2]
[Table 3]

7
3.2 Dependent and independent variables in the model
In this section we describe the dependent and independent variables used in the modelling.
UNIDO’s survey contains the answers for three specific sets of questions that we are
interested in analysing. Regarding domestic firms’ perception of foreign entry, they were
asked to assess, on a five-point scale (1. strongly negative/ 2. slightly negative/ 3. no effect/
4. slightly positive/ 5. strongly positive), how the presence of foreign firms has affected seven
different areas related to their business (see Table 4). For example, they answered to the
question “How do you rate the effect of the presence of foreign investors on this company’s
overall ability to compete in the market?” Notice that we build dummy variables equal to 1 if
firms respond that they perceive a slightly positive and strongly positive effect and 0
otherwise.
Domestic firms were asked about their response to the entry of foreign firms. We consider
the dichotomous answers (yes or no) given to the following four specific questions: 1) Have
you undertaken investment that can be attributed to the presence of foreign investors? 2)
What has been the response of this company to the presence of foreign investors? Produce
similar products; 3) produce different products to avoid direct competition; and 4) adopt
similar production technologies. Table 4 summarizes the description of all the variables used
in the probit models and the estimation of marginal effects. Most of the variables are
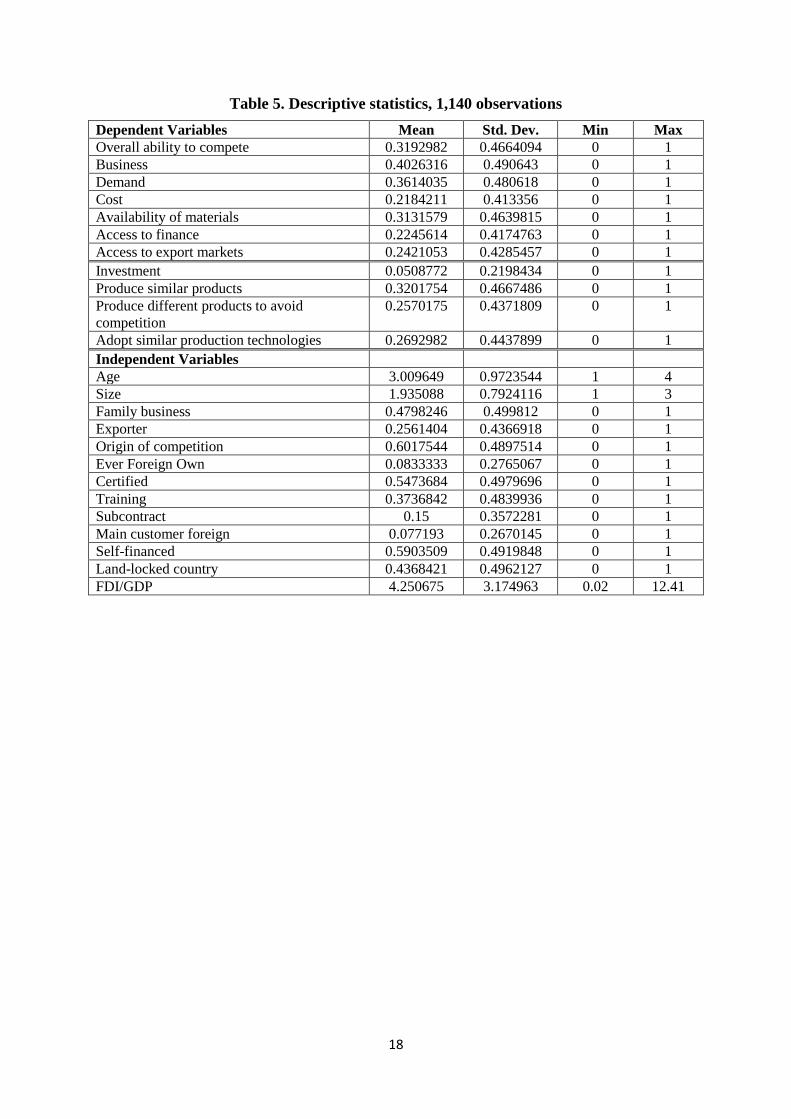
dichotomous. Table 5 shows the descriptive statistics related to each variable, including the
mean, standard deviation, minimum and maximum values.
Table 6 show the frequency of the dependent and independent variables. Notice that all the
dependent variables have a percentage of over 50 as a negative answer.
[Table 4]
[Table 5]
[Table 6]
3.3 Model and Results

8
In order to analyse the perception and response of Sub-Saharan manufacturing firms to the
presence of foreign investors, Probit models are estimated. As shown in Table 4, seven
dependent variables are related to the perception of firms and four to the response of firms.
As our dependent variables, yi, take only two values (1 and 0), their distribution is binomial
with one tail, with a probability of pi.. {
-
Our interest is modelling p as a function of regressors x. The probability mass function for the
observed outcome, y, is ( ) with ( ) and ( ) ( ). A regression
model is formed by parameterizing p to depend on an index function where x is a K x 1
regressor vector and β is a vector of unknown parameters. In standard binary outcome
models, the conditional probability has the form:
( ) (1)
where F(•) is the standard normal cumulative distribution function of on (- ) thus
ensuring that the bounds 0 ≤ p ≤ 1 are satisfied (see Cameron and Trivedi, 2010).
Table 7 presents the results showing which firms’ characteristics explain firms’ perception of
the impact of FDI. Seven different variables are considered as dependent variables: 1) overall
ability to compete, 2) business opportunities, 3) demand for the company’s products, 4) cost
of skilled labour, 5) availability of raw materials and other inputs, 6) access to finance, and 7)
access to export markets. For each of these dependent variables, the same set of ten
independent variables are considered. Two variables are added to control for the location of
the country in which each firm is located (land-locked) and for the magnitude of the FDI
received by the country (FDI as a share of GDP). If we look across the rows of the
characteristics of domestic firms, the size of firms and whether products are certified seems
to matter most in determining the positive perception that domestic firms have about the
presence of FDI, while being a family firm affects perception negatively. The estimated
parameters for certification are statistically significant in six out of the seven regressions,
while firm’s size and family ownership are statistically significant in five of the seven
regressions. Whether firms train labour seems to matter with regard to the overall ability to
compete with FDI and also access to finance.
[Table 7]

9
Table 8 shows the results of the response of firms to FDI, controlling for the characteristics of
the firms. Four dependent variables are considered: 1) investment undertaken attributed to the
presence of foreign investors, 2) produce similar products to FDI investors, 3) produce
different products to avoid direct competition, and 4) adopt similar production technologies
to FDI investors. As far as encouraging domestic investment is concerned, the only
characteristics that seem to matter are whether firms have training, whether firms are sub-
contractors and source of funding. Firm size, or whether the firm exports, do not seem to
matter. With regard to the production of similar products, the firm being locally owned
appears to affect negatively the probability of producing similar products whereas if the
competition comes from imports or foreign owned companies, the probability of producing
similar products increases. Certification encourages the production of similar products. Being
land-locked reduces the probability of producing similar products. In terms of producing
different products to avoid direct competition, variables such as firm size and whether
products are exported, don’t seem to matter. Only ‘tangential’ variables appear as significant,
such as finance (positively), and certification and training (negatively). The latter is hard to
explain. Finally, the adoption of similar production technologies is confined to firms that
have formal employment training and act as sub-contractors.
[Table 8]
The results presented in Table 7 and Table 8 show weak effects in terms of the perception
and response of local manufacturing firms to the presence of foreign investors. Moreover, the
probability of a change in firms’ behaviour is not consistent across the explanatory variables
(taken as control variables). Perhaps the most consistent variables are whether firms have
formal training programmes and whether their products are certified. Theses results, though
with their limitations, also suggest that it cannot be automatically assumed that the presence
of FDI will induce innovation and technological upgrading in Sub-Saharan African
manufacturing firms. There needs to be more emphasis on designing and implementing
policies to promote the interaction between local and foreign firms in the manufacturing
industries if the intention is for FDI to contribute to the sustainable industrialisation of the
Sub-Saharan countries.
10
4. Conclusions
By using data from the UNIDO investor survey (AIS) of 1,140 manufacturing firms in 19
Sub-Saharan African countries the results reported here show that the perception of firms
towards the entry of foreign investors contrasts with the actual response to FDI once the
foreign investment has established. The survey has specific questions which allow
distinguishing between both reactions. In other words, there is a response from domestic
firms prior the arrival of foreign investment, and in advance there is anticipation and
preparation for the threat that FDI could imply (see again Ge Bao and Chen, 2013), but in
reality not much happens.
On balance, the evidence suggests that Sub-Saharan African manufacturing firms do not
modify significantly their behaviour after the entry of foreign investors. They do not increase
their investment, they do not produce different products to avoid direct competition nor adopt
similar production technologies as those used by foreign investors.
With the ongoing interest of foreign investment in Africa, in particular from rapidly
industrializing countries such as China, Brazil and South Korea, it is interesting and
important to consider the effects that their investment is generating in the manufacturing
sector in Sub-Saharan African countries to see whether it is contributing towards the
upgrading of the industrialization process of these countries. The nature of the survey
impedes applying alternative quantitative methods of analysis of the performance of firms
over time, but the snapshot picture we have portrayed for the year 2010 does not provide
grounds for optimism.

11
References
Abramovitz, M. (1986), Catching-up, Forging Ahead and Falling Behind, Journal of
Economic History, Vol. 46, No. 2, 385-406.
Aitken, B. and Harrison, A. (1999), ‘Do Domestic Firms Benefit from Direct Foreign
Investment? Evidence from Venezuela’, American Economic Review 89, 605-618.
Arnold, J. Javorcik, B.S. and Matoo, A. (2011), ‘Does Services Liberalization Benefit
Manufacturing Firms?’ Journal of International Economics, Vol. 85, No. 1, 136-146.
Blalock, G. and Gertler, P. J., (2008) ‘Welfare Gains from Foreign Direct Investment through
Technology Transfer to Local Suppliers’, Journal of International Economics, Vol. 74, No. 2,
March, 402–421.
Boly, A., Coniglio N., Prota, F., and Seric, A., (2012), ‘Which Domestic Firms Benefit from
FDI? Evidence from Selected African Countries?’ Working Paper 8/12, Development Policy
and Research Branch, UNIDO, Vienna, Austria.
Cameron, A. C. and Trivedi, P.K. (2010), Microeconometrics Using Stata, Stata Press, USA.
Chung, W. (2001), ‘Identifying Technology Transfer in Foreign Direct Investment; Influence
of Industry Conditions and Investing Firm Motives’, Journal of International Business
Studies, Vol. 32. No. 2, 211-229.
Djankov, S. and Hoekman, B. (2000), ‘Foreign Investment and Productivity Growth in Czech
Enterprises’, World Bank Economic Review, 14, 49-64.
Fernadez, A. and Paunov, C. (2012), ‘Foreign Direct Investment in Services and
manufacturing Productivity: Evidence for Chile’, Journal of Development Economics, Vol.
97, 305-321.
Findlay, R. (1978), ‘Relative Backwardness, Direct Foreing Direct Investment, and the
Transfer of Technology: A Simple Dynamic Model’, Quarterly Journal of Economics, 92, 1-
16.
García, F., Jin B. and Salomon, R. (2013), ‘Does Inward Foreign Direct Investment Improve
the Innovative Performance of Local Firms?’, Research Policy, 42, 231-244.
Ge Bao, C. and Chen, M. X. (2013) When Foreign Rivals are Coming to Town: Firm
Responses to Multinational Investment News, Paper presented at the American Economic
Association, 3-5 January 2014, Philadelphia, USA.
Glass, A. and Saggi K. (1998), ‘International Technology Transfer and the Technology Gap’,
Journal of Development Economics, 55, 369-398.
Görg, H. and Greenaway, D. (2004), ‘Much Ado About Nothing? Do Domestic Firms Really
Benefit from Foreign Direct Investment?’, World Bank Research Observer, 19, 171-197.
Guadalupe, M. Kuzmina, O. and Thomas, C. (2012), ‘Innovation and Foreign Ownership’,
American Economic Review, Vol. 102, No. 7, 3594-3627.
Haddad, M. and Harrison, A.E. (1993), ‘Are there Positive Spillovers from Direct Foreign
Investment? Evidence from Panel Data for Morocco’, Journal of Development Economics,
Vol. 42, No.1, 51-74.
Javorcik, B. S. (2004), ‘Does Foreign Direct Investment Increase the Productivity of
Domestic Firms? In Search of Spillovers Through Backward Linkages’, American Economic
Review, Vol. 94, No. 3, 605-627.

12
Javorcik, B.S. and Spatareanu M. (2009), ‘Tough Love: Do Czech Suppliers Learn from their
Relationships with Multinationals?’, The Scandinavian Journal of Economics, 111(4): 811–
833.
Keller, W. and Yeaple S. (2009), ‘Multinational Enterprises, International Trade, and
Productivity Growth: Firm-Level Evidence from the United States’, Review of Economics
and Statistics, Vol. 91, No. 4, 821-831.
Kokko A. (1994), ‘Technology, Market Characteristics, and Spillovers’, Journal of
Development Economics, 43:279-293.
Moss, T. J., Ramachandran, V. and Shah M. K. (2006), ‘Is Africa's Skepticism of Foreign
Capital Justified? Evidence from East African Firm Survey Data’, in T. H. Moran, E. M.
Graham, and M. Blomström (eds), Does Foreign Direct Investment Promote Development?,
Washington, Institute for International Economics Center for Global Development, USA.
United Nations Millennium Declaration (2000), General Assembly Resolution 55/2, 8
September 2000 (www.un.org/millennium/declaration/ares552e.htm)
United Nations Conference on Trade and Development (UNCTAD) (2013), Economic
Development in Africa Report 2013, Intra-African Trade: Unlocking Private Sector
Dynamism. Geneva: UNCTAD.
United Nations Industrial Development Organization (UNIDO) (2012), Africa Investor
Report 2011, Towards evidence-based investment promotion strategies. Vienna: UNIDO.
Xu, Bin (2000), Multinational enterprises, technology diffusion, and host country
productivity growth, Journal of Development Economics, 62: 477-493.
World Bank (1998/99), World Bank Development Report, Knowledge for Development,
World Bank and Oxford University Press, New York.

13
Table 1. Number of manufacturing firms according to location and size
Country
Size in terms of full-time employees Number of firms
Small
(less than 21)
Medium (22-75)
Large (more than 75)
Ethiopia 23 73 105 201
Nigeria 38 53 48 139
Tanzania 72 36 27 135
Uganda 83 35 16 134
Kenya 23 56 49 128
Ghana 42 38 16 96
Zambia 12 28 18 58
Cape Verde 32 14 1 47
Mozambique 13 25 2 40
Malawi 9 11 12 32
Mali 12 17 3 32
Cameroon 6 10 8 24
Madagascar 5 4 8 17
Senegal 5 6 5 16
Rwanda 3 9 2 14
Lesotho 12 1 0 13
Niger 6 2 0 8
Burundi 1 2 2 5
Burkina Faso 0 0 1 1
Total 397 420 323 1,140

14
Table 2. Distribution of manufacturing firms according to industries and location
Country /
Industry Food
1 Textiles
2 Wood
3 Paper
4 Coke
5 Metals
6 Machinery
7 Vehicles
8 Recycling
9 Total
Ethiopia 40 39 13 22 46 33 4 1 3 201
Nigeria 24 18 9 12 43 24 5 4 0 139
Tanzania 33 19 21 18 24 8 6 3 3 135
Uganda 26 14 31 13 22 22 5 0 1 134
Kenya 25 12 13 16 32 14 14 2 0 128
Ghana 9 7 24 9 22 20 2 2 1 96
Zambia 18 8 2 5 14 8 3 0 0 58
Cape Verde 13 3 8 7 6 8 2 0 0 47
Mozambique 0 4 6 11 5 10 3 1 0 40
Malawi 5 2 8 4 7 4 2 0 0 32
Mali 12 2 3 7 5 3 0 0 0 32
Cameroon 5 2 0 6 2 8 0 0 1 24
Madagascar 3 3 4 2 3 2 0 0 0 17
Senegal 5 1 1 2 4 1 1 1 0 16
Rwanda 6 0 3 1 3 1 0 0 0 14
Lesotho 2 6 2 1 1 0 1 0 0 13
Niger 1 1 0 6 0 0 0 0 0 8
Burundi 1 2 0 2 0 0 0 0 0 5
Burkina
Faso
0 0 0 0 1 0 0 0 0 1
Total 228 143 148 144 240 166 48 14 9 1,140
Notes: 1Food, beverage and tobacco;
2Textiles, garments and leather;
3Wood, wood products and
furniture; 4Paper and publishing and printing;
5Coke and refined petroleum, chemicals, plastics
and rubber, and non-metallic mineral products; 6Basic metals and fabricated metal products;
7Electro-mechanical machinery and equipment;
8Motor vehicles, trailers and other transport
equipment; and 9Recycling and other manufacturing.

15
Table 3. Technological classification of manufacturing firmsa
Country High
technology
Medium
technology
Low
technology Total
Ethiopiab 18 66 116 200
Nigeria 24 52 63 139
Tanzaniab 18 23 93 134
Ugandab 14 35 84 133
Kenya 30 32 66 128
Ghanab 15 31 49 95
Zambia 8 17 33 58
Cape Verde 4 12 31 47
Mozambique 6 13 21 40
Malawi 5 8 19 32
Mali 4 4 24 32
Cameroonb 1 9 13 23
Madagascar 2 3 12 17
Senegal 3 4 9 16
Rwanda 0 4 10 14
Lesotho 2 0 11 13
Niger 0 0 8 8
Burundi 0 0 5 5
Burkina Faso 0 1 0 1
Total 154 314 667 1,135
Note: a
Based on OECD definition. b
One firm is not classified, hence the
difference in the total number of firms.

16
Table 4. Description of variables
Dependent Variables Description of variable/Question in the
survey
Value
Per
cep
tio
n v
aria
ble
s
How do you rate the effect of the presence of foreign investors in this country on this company?
Overall ability to
compete
Ability to compete in the market
1: Positive
0: Negative or no
effect
Business Business opportunities
Demand Demand for the company’s products
Cost Increase cost of skilled labour
Availability of materials Greater availability of raw materials and
other inputs
Access to finance Better access to finance
Access to export
markets
Greater access to export markets
Act
ual
res
ponse
Investment Have you undertaken investment that can
be attributed to the presence of foreign
investors?
1: Yes
0: No
Produce similar
products
What has been the response of this
company to the presence of foreign
investors?
1: Yes
0: No
Produce different
products to avoid
competition
What has been the response of this
company to the presence of foreign
investors?
1: Yes
0: No
Adopt similar
production technologies
What has been the response of this
company to the presence of foreign
investors?
1: Yes
0: No
Independent Variables
Age Age of the firm 1: 0-5 year
2: 6-10 years
3: 11-20 years
4: +21 years
Size Size of firm in terms of full time employees 1: small <21
2: medium 22-75
3: large >76
Family business Company owned by family 1: if more than 0%
share
0: otherwise
Exporter Exports 1: if company exports
0: otherwise
Origin of competition Main competition come from: 1: locally-owned
companies
0: imports or
foreign-owned
companies based in
this country
Ever Foreign Owned Has this company ever had a foreign
partner or joint venture?
1: Yes
0: No
Certified Are any of this company’s products or
services certified?
1: Yes
0: No
Training Does this company provide
internal/external training to its employees?
1: Yes
0: No

17
Sub-Contract Work Does this company undertake sub-contract
work, such as manufacturing operations, or
business services for other companies in
this country?
1: Yes
0: No
Financed Sources of financing for the initial
investment?
1: Personal savings,
family and friends
0: Other sources
FDI Foreign direct investment as a share of
GDP
Various values
Landlocked country Is the company located in a landlocked
country?
1: Landlocked
0: Not landlocked
18
Table 5. Descriptive statistics, 1,140 observations
Dependent Variables Mean Std. Dev. Min Max
Overall ability to compete 0.3192982 0.4664094 0 1
Business 0.4026316 0.490643 0 1
Demand 0.3614035 0.480618 0 1
Cost 0.2184211 0.413356 0 1
Availability of materials 0.3131579 0.4639815 0 1
Access to finance 0.2245614 0.4174763 0 1
Access to export markets 0.2421053 0.4285457 0 1
Investment 0.0508772 0.2198434 0 1
Produce similar products 0.3201754 0.4667486 0 1
Produce different products to avoid
competition
0.2570175 0.4371809 0 1
Adopt similar production technologies 0.2692982 0.4437899 0 1
Independent Variables
Age 3.009649 0.9723544 1 4
Size 1.935088 0.7924116 1 3
Family business 0.4798246 0.499812 0 1
Exporter 0.2561404 0.4366918 0 1
Origin of competition 0.6017544 0.4897514 0 1
Ever Foreign Own 0.0833333 0.2765067 0 1
Certified 0.5473684 0.4979696 0 1
Training 0.3736842 0.4839936 0 1
Subcontract 0.15 0.3572281 0 1
Main customer foreign 0.077193 0.2670145 0 1
Self-financed 0.5903509 0.4919848 0 1
Land-locked country 0.4368421 0.4962127 0 1
FDI/GDP 4.250675 3.174963 0.02 12.41

19
Table 6. Frequency of dependent and independent variables for 1,140 firms Variables Code Percent frequency
Dep
end
ent
va
ria
ble
s:
Per
cepti
on
to
th
e pre
sen
ce o
f fo
reig
n I
nv
esto
rs
Overall ability to compete
Positive 1 31.93%
Negative 0 68.07%
Business
Positive 1 40.26%
Negative 0 59.74%
Demand
Positive 1 36.14%
Negative 0 63.86%
Cost
Positive 1 21.84%
Negative 0 78.16%
Availability of materials
Positive 1 31.32%
Negative 0 68.68%
Access to finance
Positive 1 22.46%
Negative 0 77.54%
Access to export markets
Positive 1 24.21%
Negative 0 75.79%
Dep
end
ent
vari
ab
les:
Res
ponse
to
the
pre
sence
of
fore
ign I
nves
tors
Investment
Yes 1 5.05%
No 0 94.91%
Produce similar products
Yes 1 32.02%
No 0 67.98%
Produce different products to avoid direct
competition
Yes 1 25.70%
No 0 74.30%
Adopt similar production technologies
Yes 1 26.93%
No 0 73.07%
Ind
epen
den
t v
ari
ab
les
Age
0-5 years 1 9.82%
6-10 years 2 17.28%
11-20 years 3 35.00%
21+ years 4 37.89%
Size
Small 1 34.82%
Medium 2 36.84%
Large 3 28.33%
Family business
Yes 1 47.98%
No 0 52.02%
Exporter
Yes 1 25.61%
No 0 74.39%

20
Variables Code Percent frequency
Origin of Competition
Locally-owned manufacturers 1 60.18%
Imports or From foreign-owned
companies
0 39.82%
Ever had a foreign partner
Yes 1 8.33%
No 0 91.67%
Certified
Yes 1 54.74%
No 0 45. 26%
Training
Yes 1 37.37%
No 0 62.63%
Sub-contract
Yes 1 15.00%
No 0 85.00%
Main Customer Foreign
Yes 1 7.72%
No 0 92.28%
Initial source of finance
Family and friends 1 59.04%
Commercial banks and other institutions 0 40.96%
Firm located in a landlocked country
Yes 1 43.68%
No 0 56.32%
FDI as percentage of GDP
0.02 0.44%
0.38 11.23%
0.68 0.09%
0.79 17.63%
0.98 2.81%
1.15 2.81%
2.26 1.23%
2.58 1.40%
3.34 2.11%
4.46 11.84%
5.05 12.19%
5.43 5.09%
5.68 11.75%
7.42 4.12%
9.13 8.42%
9.3 3.51%
10.34 1.14%
11.7 0.70%
12.41 1.49%

21
Table 7. Marginal effects using perception variables as dependent variables
(7.1) (7.2) (7.3) (7.4) (7.5) (7.6) (7.7)
VARIABLES Overall
ability to
compete
Business Demand Cost Availabilit
y of
materials
Access to
finance
Access to
export
markets
Age -0.00932 -0.0237 -0.0203 9.90e-05 -0.00361 -0.0221* -0.0270**
(0.0151) (0.0159) (0.0156) (0.0132) (0.0150) (0.0133) (0.0136)
Size 0.0610*** 0.0811*** 0.0567*** 0.0130 0.0660*** 0.0267 0.0517***
(0.0212) (0.0224) (0.0219) (0.0185) (0.0210) (0.0186) (0.0190)
Family business -0.0985*** -0.0781** -0.0651** -0.0503** -0.0794*** -0.0283 -0.00292
(0.0291) (0.0308) (0.0302) (0.0256) (0.0290) (0.0259) (0.0267)
Exporter -0.0326 -0.0203 -0.0489 -0.0126 -0.0386 0.0493 0.113***
(0.0331) (0.0359) (0.0346) (0.0297) (0.0333) (0.0310) (0.0331)
Origin of
competition
-0.0458 -0.0530* -0.0354 -0.0195 -0.0134 -0.103*** -0.0591**
(0.0289) (0.0304) (0.0297) (0.0253) (0.0286) (0.0260) (0.0265)
Ever Foreign
Own
0.0421 0.0551 0.131** -0.0170 0.00785 0.103** -0.00282
(0.0521) (0.0549) (0.0553) (0.0430) (0.0509) (0.0504) (0.0465)
Certified 0.128*** 0.115*** 0.111*** 0.0507** 0.0395 0.0583** 0.0517*
(0.0290) (0.0309) (0.0302) (0.0257) (0.0293) (0.0260) (0.0268)
Training 0.0558* 0.0294 0.0270 -0.0233 0.0310 0.0643** 0.0108
(0.0299) (0.0315) (0.0308) (0.0258) (0.0297) (0.0268) (0.0272)
Sub-Contract
Work 0.0961** 0.0622 0.0768* 0.0500 0.0966** 0.0323 0.0303
(0.0419) (0.0427) (0.0421) (0.0365) (0.0412) (0.0364) (0.0382)
Financed -0.00642 -0.0123 0.000562 0.00254 0.0846*** -0.0371 -0.0113
(0.0298) (0.0315) (0.0308) (0.0261) (0.0290) (0.0264) (0.0269)
Landlocked
country
0.0127 0.0604* 0.0448 -0.0155 0.0533* 0.0162 0.0703**
(0.0312) (0.0329) (0.0322) (0.0270) (0.0310) (0.0276) (0.0286)
FDI 0.0147*** 0.00879* 0.0185*** 0.0136*** 0.0128*** 0.00362 -0.00890**
(0.00490) (0.00519) (0.00507) (0.00425) (0.00488) (0.00430) (0.00452)
Log likelihood
function
-676.5814
-739.4554
-718.2778
-585.3504
-689.4772
-576.5864
-596.6338
LR Chi Square 74.89 57.96 55.07 26.08 38.30 61.21 68.70
Pseudo R2 0.0524 0.0377 0.0369 0.0218 0.0270 0.0504 0.0544
Observations 1,140 1,140 1,140 1,140 1,140 1,140 1,140
Note: Standard errors in parentheses *** p<0.01, ** p<0.05, * p<0.1. Software used Stata12.

22
Table 8. Marginal effects using response variables as dependent variables
(8.1) (8.2) (8.3) (8.4)
VARIABLES Investment Produce Similar
Products
Produce
Different
Products
Adopt similar
production
technologies
Age 0.0104 0.0142 0.000870 0.0123
(0.00640) (0.0152) (0.0141) (0.0144)
Size 0.000249 -0.00607 0.0217 0.00709
(0.00840) (0.0213) (0.0197) (0.0199)
Family business -0.0113 0.0390 0.0211 0.0121
(0.0115) (0.0295) (0.0272) (0.0278)
Exporter 0.0215 -0.0367 -0.00782 0.0400
(0.0154) (0.0339) (0.0320) (0.0330)
Origin of
competition
-0.0159 -0.0594** -0.0117 -0.0270
(0.0117) (0.0291) (0.0269) (0.0273)
Ever Foreign
Own
0.0173 -0.0123 0.0816 0.0440
(0.0224) (0.0505) (0.0518) (0.0501)
Certified 0.00216 0.0548* -0.0487* 0.0422
(0.0116) (0.0295) (0.0278) (0.0280)
Training 0.0340** 0.00924 -0.0471* 0.0640**
(0.0133) (0.0299) (0.0273) (0.0285)
Sub-Contract
Work 0.0655*** 0.130*** 0.0205 0.0761*
(0.0232) (0.0418) (0.0379) (0.0394)
Financed 0.0190* 0.0566* 0.0629** 0.0320
(0.0112) (0.0297) (0.0272) (0.0278)
Landlocked
country
-0.00767 -0.0567* 0.0389 -0.0408
(0.0119) (0.0305) (0.0288) (0.0289)
FDI 0.00255 0.0228*** -0.00482 -0.000513
(0.00176) (0.00488) (0.00463) (0.00463)
Log likelihood
function
-206.93714
-677.01427
-638.5607
-650.10435
LR Chi Square 44.61 75.54 22.28 28.03
Pseudo R2 0.0973 0.0528 0.0171 0.0211
Observations 1,140 1,140 1,140 1,140
Note: Standard errors in parentheses *** p<0.01, ** p<0.05, * p<0.1. Software used Stata12.