contribution of the arts and culture industry to the ... · centre for economics and ... art and...
TRANSCRIPT
Contribution of the arts and culture industry to the national economy An update of our analysis of the macroeconomic contribution of the arts and culture industry to the national economy Report for Arts Council England July 2015

Centre for Economics and Business Research
2
© Centre for Economics and Business Research
Disclaimer
While every effort has been made to ensure the accuracy of the material in this document, neither Centre for Economics and
Business Research Ltd nor the report’s authors will be liable for any loss or damages incurred through the use of the report.
Authorship and acknowledgements
This report has been produced by Cebr, an independent economics and business research consultancy established in 1992. The
views expressed herein are those of the authors only and are based upon independent research by them.
The report does not necessarily reflect the views of Arts Council England. London, April 2015
Centre for Economics and Business Research
3
© Centre for Economics and Business Research
Contents
Foreword 4
Introduction 5
Executive summary 7
1 About this report 9
1.1 Background and aims of the study 9
1.2 Structure of the report 9
2 Scope and methodology 10
2.1 Scope of the study 10
2.2 Overview of approach and methodology 11
3 Contribution of the arts and culture industry to the ‘business economy’ 12
3.1 Turnover 12
3.2 Gross value added 14
3.3 Labour productivity 15
3.4 Employment 16
3.5 Market structure of the arts and culture industry 18
3.6 Structure of incomes from employment in the arts and culture industry 19
3.7 Consumer expenditure on the arts and culture 22
3.8 Funding of Arts Council England’s national portfolio organisations 23
3.9 Exchequer contributions by the arts and culture industry 25
4 Macroeconomic contributions of the arts and culture 26
4.1 Embedding the arts and culture within our macroeconomic impacts framework 26
4.2 ‘Industrial’ output multiplier for the arts and culture 27
4.3 The arts and culture industry’s contribution to GVA 28
4.4 Contribution of the arts and culture to employment 29
4.5 Impact of the arts and culture industry on household incomes 30
4.6 Regional variation in our multiplier estimates 31
Appendix I: SIC-based definition of the arts and culture industry 35

Centre for Economics and Business Research
4
© Centre for Economics and Business Research
Foreword
All of us working in – and enjoying – arts and culture in England find ourselves in a contradictory situation. On the one hand this is a golden age for the arts, which has seen a rejuvenation of our arts and museums infrastructure, great critical success and significant improvement in bringing the arts to more people, wherever they live. On the other, it's also an age of public austerity when it's no longer enough to simply point at the quality and reach of what we do. As Sir Howard Davies wrote last year in our journal Create, there's no getting away from playing the impact game. All recipients of public funds have to show how that money benefits the public - and the nation. But (as Sir Howard also observed) when it comes to economic impact, art and culture have a very good story to tell. We should never be too shy to tell it. The Arts Council first commissioned Cebr to assess the economic impact of the art and culture sector two years ago. This second independent report continues the strong narrative of the first. A separate, independent report into the economic contribution of museums in England was published in March 2015. This is a growing sector that makes a strong economic contribution both regionally and nationally. Crucially, it incubates the talent for the creative industries and the wider economy as a whole. These are booming: they are now drivers of growth and they need that talent. Business leaders in the creative industries are explicit and vocal about the importance of public investment in art and culture. You can read what they think in the Creative Industry Federation’s latest report, Arts and Growth. We know that it's not only about economic benefit. The arts enrich all our lives in many intertwined ways: in our schools, in our communities and in the status they give our nation. By drawing out the explicit economic contribution we are not ignoring the intrinsic, transformative value of art. Rather, we are saying that when you support great art and culture, great things happen for everyone. Sir Peter Bazalgette Chair, Arts Council England

Centre for Economics and Business Research
5
© Centre for Economics and Business Research
Introduction
How can we measure the value of art and culture? We acknowledge its’ crucial importance, and yet what art is and what it does is so bound up with our lives that it’s a challenge to unpick the threads. We should not obsess about measurement, but we invest public money on behalf of the tax payer so we have a responsibility to demonstrate the value of that investment. The more we understand - and talk about - what art does for us, in terms of the economy, our education, health and wellbeing, the lives of our communities and of our nation, the more we can give government and the taxpayer the confidence to invest. It was with this in mind that Arts Council England first asked the Centre for Economics and Business Research to take a hard look at the economic effects of investment in art and culture. The result was an eye opening report, showing how the nation as a whole benefitted from a modest amount of public investment. We are encouraged to see how this latest report confirms - and strengthens - those findings. In that first, 2013 report, the Cebr found that based on figures for 2011, the arts and culture sector had a turnover of £12.4 billion. This updated version of the report shows that figure has swelled to £15.1 billion based on 2013 figures, growing by nearly a quarter in three years. Arts and culture incubates the talent for the wider creative sector, which provides more than one in 20 jobs in the UK. So this growth is good news for the future of the creative sector as a whole, and for the national economy. If you look at the figures for art and culture in terms of Gross Value Added (GVA), which is the net benefit once the external cost has been stripped out, there’s also pleasing progress – a buoyant 35.8% increase between 2010 and 2013 to a respectable £7.7billion. And it’s progress that is benefitting the workers in the sector. The new report reveals the average arts and culture worker is paid well over the national average, at nearly £28,000. That wage rose 2.4 percent between 2010 and 2013, against a backdrop of relatively low inflation. Employment is strong in the sector too. This report shows a four percent increase in the numbers of those employed, from 123,000 to 128,000 between 2010 and 2013. The kinds of skills learned in the arts feed the expanding need of a jobs market in which ‘traditional occupations’ are being replaced by a more knowledge and skills based economy. The growth of the sector will be of particular interest to young people entering into the jobs market. Given the role that public investment plays in developing the arts, we have to look at the details and ask how the taxpayers are benefitting from these new jobs; are they getting value for money? Again, the news is good. GVA per full time equivalent job –this means the value added to the economy by the average job – stands at £58,000 a year compared with the UK average of £39,500 over the 2009-13 period. Labour productivity over the period 2009-13 in arts and culture looks like a real strength, especially in areas such as book publishing, sound recording and music publishing, which record an average of £85,000 – more than double the UK average. If this is narrowed down to just sound recording and music publishing and factor in the latest 2013 figures, you get £130,800 GVA per full time job equivalent. This is Premier League stuff. Even support staff are generating £105,700.

Centre for Economics and Business Research
6
© Centre for Economics and Business Research
Overall, the arts and culture sector is more than paying its way in the returns it brings to the Treasury. Every pound of public funding going to the Arts Council’s national portfolio organisations pays back £5 in tax contributions from the sector as a whole. The most recent figures show an annual return of £2.35 billion to the Treasury. The new report also estimates that tourism contributed close to a billion pounds per annum to the arts and culture economy, a significant increase on the previous available figures of £860million. While it’s a fact that London’s extraordinary combination of cultural attractions and its position as a tourist gateway gives it advantages in attracting visitors and audiences all year round, we are seeing growth in the regions too. This report finds that the contribution to regional economies of arts and culture is growing in the East of England and the East Midlands - at more than the average rate for the UK as a whole. And, whereas this growth is now slowing in London, it is gathering momentum in these areas. This economic impetus is keenly appreciated in some of the regions of England that have been slow to recover from the recession. In the North East, the arts and culture sector has almost recovered to pre-recession levels of contribution to the regional economy. These figures may be modest compared to bigger sectors of the economy: but they show that the arts and culture sector has a sustainable and growing economic success story. The report not only justifies the faith shown by current levels of public investment. It offers a vision of what more could be done. The report also contains some data that is of particular significance. For every £1 of turnover art and culture generates, 51p of GVA is added to the economy. That is up by 4p per £1 since the last report. What does this mean? Well, it shows that the arts and culture sector have successfully cut costs, increasing their GVA, and are thereby making a greater contribution to the UK’s GDP. It tells a story of resilience and efficiency, and how the sector has, without losing its creative ambition, succeeded in making more productive use of public funds. Cebr’s positive findings confirm the results of other recent reports, including the most recent on the Economic Impact of Museums is England, published in March, which found that our museums contributed £1.45 billion of economic output to the national economy. Seen in this context, public investment in art and culture is a winner. The sector grows each year, yet costs us less and is more productive. And among its products are those most precious to all of us - entertainment, inspiration, happiness and wellbeing. Richard Russell Director, Policy and Research

Centre for Economics and Business Research
7
© Centre for Economics and Business Research
Executive summary
This is an update of the Centre for Economics and Business Research’s (Cebr) 2013 study1, on behalf of Arts Council England, on the contribution made by the arts and culture industry to the UK’s national and regional economies.
Scope and methodological overview
In Section 2 we provide an analysis of the ‘business economy’ and macroeconomic impacts of the arts and culture industry. This section draws upon official data provided by the Office for National Statistics (ONS) for the years 2008-13. The ONS data provides economic indicators including revenues, costs of production and value added for hundreds of disaggregated industries. This data is broken down according to the Standard Industrial Classification (SIC) framework, which provides the underlying data collection framework for much of the data produced by the ONS.
‘Business economy’ highlights
This section is based on our review of data that is provided almost exclusively by business enterprises through surveys. Our main findings are that:
The arts and culture industry generated £15.1 billion in turnover in 2012-13, an increase of 26 per cent since 2010. Book publishing, performing arts and artistic creation were the largest sets of productive activities based on turnover in 2013, accounting for 29, 26 and 19 per cent respectively.
Businesses in the arts and culture industry contributed an estimated £7.7 billion of gross value added (GVA) in 2013.
Employment in the arts and culture industry peaked in 2012; this is likely due to the impact of the London 2012 Olympic Games. It fell again in 2013, returning to a similar level as 2011, with approximately 108,800 full-time equivalent (FTE) jobs in the industry. Performing arts was the largest contributor to total employment in the arts and culture industry, amounting to 32 per cent of FTE jobs.
Household spending on recreation and culture fell between 2008 and 2010, as a result of the recession, but recovered in 2011. Weekly spending on recreation and culture declined again in 2012, but subsequently recovered in 2013, with an average weekly spend of £63.90. This was above the 2008 level of £62.80 per week. Note that the category of recreation and culture used by the ONS is broader than our definition of the arts and culture industry, for example, it includes historical monuments, national parks, zoological and botanical gardens, as well as license fees and subscriptions for TV networks.
The greatest contributor to the overall funding of the arts and culture industry continued to be earned income2, this increased by 6 per cent between 2012-13 and 2013-14, from £683 million to £722 million.
1 ‘The contribution of the arts and culture to the national economy’ Report for Arts Council England and the National Museums
Directors’ Council. May 2013. 2 Earned income includes ticket sales and merchandise.

Centre for Economics and Business Research
8
© Centre for Economics and Business Research
Macroeconomic impacts of the arts and culture
Based on our analysis of the arts and culture industry within the ONS national accounting framework, specifically the supply-use tables and Cebr’s input-output models, we conclude that in the UK:
When direct, indirect and induced impacts are taken into account, the arts and culture industry is responsible for an aggregate GVA impact of £15.8 billion. The GVA multiplier is smaller than in our previous report, which suggests that there has been an efficiency gain in the arts and culture industry, with less supply chain spend per £1 of output produced by the industry.
In 2013, we estimate that the arts and culture industry had a total FTE employment impact, including direct, indirect and induced impacts, of 259,000 FTE jobs.
Based on this employment impact, we estimate that for every gross salary of £27,948, the arts and culture industry was responsible for approximately £57,600 of gross salary earned elsewhere in the economy.
Spillover impacts
The impacts covered in this report do not include spillover impacts. However, these impacts are equally important in terms of the role of the sector.3 In our previous report for the Arts Council we considered the value of these spillover impacts, however, we do not expect there to have been any significant changes to these impacts. As such, we have not updated this part of the previous report in this study.
To recap, we previously identified the following spillover impacts of the arts and culture:
– Through tourism – The arts and culture can create additional spending by tourists in two ways. Some visit the UK primarily to visit arts and cultural attractions, while others take part in arts and cultural activities during trips that are made for other purposes, potentially extending trips and generating additional spending as a result. We estimated total spending by visitors to the UK that was directly motivated by the arts and culture amounted to at least £856 million in 2011.
– Developing skills, nurturing innovation and fostering growth in the commercial creative industries – The arts and culture industry supports commercial creative industries, consuming many of the outputs from creative businesses. Therefore, the arts and culture industry indirectly contributes to employment in these creative industries. Many arts and cultural organisations also provide support to the creative businesses they interact with in their day-to-day activities.
– Improving national productivity – The arts and culture industry also supports productivity in the commercial creative workforce as a whole. Engagement with the arts and culture helps to develop people’s critical thinking, to cultivate creative solutions to problems and to encourage effective personal communication and expression. For both adults and children, these skills improve intellectual ability and wellbeing, enabling greater success in day-to-day endeavours. When these individual-level benefits are taken in aggregate, they represent improvements to the effectiveness and flexibility of the nation’s workforce, with positive impacts on productivity.
– As a catalyst for economic regeneration – Investment in the arts and culture can drive improvements in the quality of the local environment and the standard of life enjoyed by local communities.
3 As well as the ‘direct’ contribution of the arts and culture, as measured by macroeconomic indicators like GVA, employment
and household incomes, we also examine the ‘indirect’ contributions made by the arts and culture to the wider economy and other sectors. These spillover impacts are highlighted in this report.

Centre for Economics and Business Research
9
© Centre for Economics and Business Research
1 About this report This is a report by the Centre for Economics and Business Research (Cebr), on behalf of Arts Council England, on the economic contribution of the arts and culture industry to the UK and its constituent national and regional economies. It provides an update to the original study, which was undertaken in 2013.
1.1 Background and aims of the study
The purpose of this study was to help Arts Council England develop an up-to-date picture of the contribution of the arts and culture to the national economy, based on our previous report in 2013.
Arts Council England is a public body that supports a range of activities across the arts, museums and libraries. Its remit for the arts includes a wide range of visual, performing and literary artforms. It has funding responsibilities for regional museums and a development role across libraries and the wider museum sector. Arts Council England is sponsored by the Department for Culture, Media and Sport (DCMS) in order to make the arts, and the wider culture of museums and libraries, an integral part of everyday public life, accessible to all, and understood as essential to the national economy and to the health and happiness of society.
Our analysis considers the direct contribution of the arts and culture industry, measured by macroeconomic indicators such as gross value added (GVA), a measure of economic output, employment and household incomes. However, we also examine the indirect contributions made by the arts and culture to the wider economy, for example through the additional jobs supported in the wider economy as a result of employment in the arts and culture industry.
1.2 Structure of the report
The report is structured as follows:
Section 2 explains how we have defined the arts and culture industry and the scope of the study. It also gives an overview of our methodology.
Section 3 assesses the contribution of the arts and culture to the ‘business economy’. We consider this in terms of employment, turnover and value-added contributions.
Section 4 sets out our findings on the macroeconomic contributions of the arts and culture industry. This includes indirect and induced multiplier impacts. This section firstly estimates the contributions to gross domestic product (GDP), GVA, employment and household incomes in the UK and England. It then examines the impacts across other UK nations and English regions.
Appendix I provides a Standard Industrial Classification (SIC)-based definition of the arts and culture industry used in this study in tabular form.
Centre for Economics and Business Research
10
© Centre for Economics and Business Research
2 Scope and methodology The scope of the study and the methodology used are broadly the same as in the previous report. This section recaps the definition we use for the arts and culture industry, and the scope of the study.
2.1 Scope of the study
In the previous study, we set out to cover the six artforms funded by Arts Council England: theatre, dance, literature, visual arts, music, combined arts, as well as museums. Libraries were not to be incorporated nor were creative industries such as film or video games. However, while undertaking the previous study, we discovered that museums would need to be excluded. This was mainly because much of the value generated by museums was not captured within the Office for National Statistics (ONS) Annual Business Survey (ABS)4 estimates for museum activities.5
For the original study in 2013, we considered the relevant set of activities that make up the arts and culture industry in the context of industrial classification and national statistics. The SIC system provides the underlying data collection framework for much of the economic data produced by the ONS. This includes the UK business economy and national accounting frameworks, which are the foundation on which the macroeconomic models, developed by Cebr, are used to estimate the impact of the arts and culture presented in this report.
As we are providing an update to our original study, the scope of this study follows the same set of productive activities captured by the arts and culture industry. This industry is made up of sets and/or subsets, dependent on the level of industry aggregation, of the product and industry groups defined under the SIC system.6 Therefore our definition includes the following set of activities, identified by three- or four-digit SIC codes:
J58.11 - book publishing
J59.2 - sound recording and music publishing
R90.01 - performing arts
R90.02 - support activities to performing arts
R90.03 - artistic creation
R90.04 - operation of arts facilities
Note that as with our previous study, creative industries, museums and libraries are again outside the scope of this study.
The final definition of the arts and culture industry used in this study, and a breakdown of the activities listed above, are provided in Appendix I. This traces the definition from the relevant one-digit broader sector SIC classifications through to the relevant five-digit activities.
4 http://www.ons.gov.uk/ons/rel/abs/annual-business-survey/2013-provisional-results/index.html
5 Museum activities are covered by the 91.02 SIC code.
6 The SIC system breaks down the economy into 21 broad sectors (officially ‘Sections’ A to U) at the one-digit level. Section R, for
example, is the ‘Arts, Entertainment and Recreation’ sector. However, Section R does not include a range of activities related to literature and music, two of the six art forms that the study was to cover. For these, we looked to Section J, the ‘Information and Communications’ sector. The next level of disaggregation is the two-digit divisions, however, this includes a range of industry groups at that are not within Arts Council England’s remit, such as gambling and betting and sports activities. Drilling deeper into the three- and four- digit SIC levels brought us closer to the required level of industry disaggregation.
Centre for Economics and Business Research
11
© Centre for Economics and Business Research
2.2 Overview of approach and methodology
To undertake our analysis of the ‘business economy’ and macroeconomic impacts of the arts and culture industry, we have used official data provided by the ONS. Since the publishing of our previous study, all the ONS data has been updated, providing two further years’ worth of data, 2012 and 2013.
The ABS discloses economic indicators, including revenues, costs of production and value-added across hundreds of disaggregated industries. These are broken down according to the SIC framework, as discussed above. By identifying arts and cultural activities within the SIC framework, and using the corresponding figures for these activities from the datasets, we can measure the economic characteristics of the arts and culture industry and its direct macroeconomic impacts on the economy.
We estimate the multiplier impacts of the arts and culture industry using our input-output models, which draw on the ONS’ national accounting framework. The input-output models determine the sectors from which the arts and culture industry purchases its inputs (for example, advertising services). They trace the industry’s economic footprint through its supply chain relationships with other sectors. This generates output (for example, artistic products) and employment in those sectors and increases earnings and employee spending in the wider economy.

Centre for Economics and Business Research
12
© Centre for Economics and Business Research
3 Contribution of the arts and culture industry to the ‘business economy’ This section provides an assessment of the importance of the arts and culture industry to the UK economy in terms of turnover, GVA and employment. We examine the performance of these indicators over the period 2008–13. We also look at market structure, income from employment, consumer expenditure, funding of arts and culture and exchequer contributions
This section is called a ‘business economy’ review because the data used is provided by enterprises. To provide the analysis to the same granularity as the previous study, the ONS datasets used include the Annual Business Survey (ABS)7 and the Business Register and Employment Survey (BRES).8 Both of these sources have been updated since the last study, providing two further years of data, 2012 and 2013.9 Our analysis of the structure of income from employment in the sector is also based on the most recent data from the Annual Survey of Hours and Earnings (ASHE)10.
The ABS data is not presented in a geographically disaggregated form, therefore the analysis in this section covers the arts and culture industry at the UK level only.
3.1 Turnover
Turnover is defined as revenues generated by businesses as a result of undertaking productive value-adding activities. Subsidies and donations received by the arts and culture industry are transfers of value that has been generated elsewhere and are therefore excluded.
Figure 1: Turnover generated by the arts and culture industry in the UK, 2008-13, £m current prices
Source: ONS Annual Business Survey 2008-13, Cebr analysis
7 http://www.ons.gov.uk/ons/rel/abs/annual-business-survey/2013-provisional-results/index.html
8 http://www.ons.gov.uk/ons/rel/bus-register/business-register-employment-survey/2013-provisional/index.html
9 Annual Business Survey 2013 published by the ONS in November 2014. Business Register and Employment Survey 2013
released in September 2014. 10
http://www.ons.gov.uk/ons/rel/ashe/annual-survey-of-hours-and-earnings/index.html
0
2,000
4,000
6,000
8,000
10,000
12,000
14,000
16,000
2008 2009 2010 2011 2012 2013
Turn
ove
r (£
m)

Centre for Economics and Business Research
13
© Centre for Economics and Business Research
Figure 1 illustrates the turnover generated by the arts and culture industry from 2008-13. In 2013, the arts and culture industry generated £15.1 billion in turnover, up from £12.8 billion in 2008. In the recession year of 2009, turnover fell by 8 per cent to £11.9 billion. However, it recovered slightly in 2010, increasing by 1 per cent, and has since performed well with turnover reaching £15.1 billion by 2013. Turnover increased by 26 per cent from 2010–13 and by 16 per cent from 2012 to 2013.
Figure 2 shows disaggregated estimates for each of the activities that make up our definition of the arts and culture industry based on the three- and four-digit SIC codes. Book publishing, performing arts and artistic creation are the three largest sets of productive activities. They accounted for 29, 26 and 19 per cent respectively, of the turnover of the arts and culture industry in 2013.
Operation of arts facilities represents the smallest share of the sector’s turnover at £720 million. Support activities to performing arts saw the largest percentage increase in turnover between 2010 and 2013, increasing by 518 per cent from £222 million to £1.4 billion over the period. However, this increase is starting from a very low base, and given the size of this subsector, it is likely to suffer from some volatility in turnover. Employment in this subsector has also increased more rapidly than other subsectors over the same period.11
Artistic creation was the only subsector that has yet to recover its 2008 turnover levels. Turnover in this subsector totalled £2.9 billion in 2013, 13 per cent lower than in 2008.
Figure 2: Turnover in the arts and culture industry by SIC three- and four-digit productive activity, 2008-13, £m current prices
Source: ONS Annual Business Survey 2008-13, Cebr analysis
11 It is also possible that part of this increase could be due to the ONS reclassifying some of the industries within subsectors.
0
500
1,000
1,500
2,000
2,500
3,000
3,500
4,000
4,500
Book publishing Sound recording Performing arts Support activitiesto performing arts
Artistic creation Operation of artsfacilities
Turn
ove
r (£
m)
2008
2009
2010
2011
2012
2013

Centre for Economics and Business Research
14
© Centre for Economics and Business Research
3.2 Gross value added
This section examines the economic contribution of the arts and culture industry in terms of gross value added (GVA).12 GVA is a measure of the value from production used in the national accounts and can be thought of as the value of ‘industrial’ output less the value of input used to produce that output.13
Figure 3 illustrates that the GVA contribution of the arts and culture industry amounted to £7.7 billion in 2013. After a fall of 2 per cent to £5.6 billion in 2010, GVA recovered in 2011, increasing by 7 per cent. The following two years also saw healthy increases in GVA, of 12 per cent in 2012, taking GVA to £6.7 billion, and of 14 per cent in 2013.
Figure 3: Approximate GVA at basic prices of the arts and culture enterprises in the UK, 2008-13, £m
Source: ONS Annual Business Survey 2008-13, Cebr analysis
12 The Annual Business Survey refers to this measure as ‘approximate gross value added at basic prices’.
13 That is, the value of what is produced less the value of the intermediate goods and services used as inputs to produce it. GVA
is also commonly known as income from production and is distributed in three directions – to employees, to shareholders and to government. GVA is linked as a measurement to GDP, both being measures of economic output. That relationship is (GVA + Taxes on products - Subsidies on products = GDP). Because taxes and subsidies on individual product categories are only available at the whole economy level (rather than at the sectoral or regional level), GVA tends to be used for measuring things like gross regional domestic product and other measures of economic output of entities that are smaller than the whole economy, like the arts and culture. GVA must be distinguished from turnover measures, which capture the entire value of sales. By contrast, GVA captures the value added to a set of inputs by a firm on their journey from raw materials to finished consumer products. Thus the value added of a firm that uses oil imports to make plastics is equal to the price that it sells the plastic for minus the cost of the oil it uses as inputs. Similarly the value added of a manufacturer that uses that plastic to make a bus shelter is equal to the price that it sells the bus shelter for minus the cost of the plastic it uses as an input. The concept of added value enables the avoidance of double counting when estimating the size of an economy.
0
1,000
2,000
3,000
4,000
5,000
6,000
7,000
8,000
2008 2009 2010 2011 2012 2013
GV
A (
£m
)

Centre for Economics and Business Research
15
© Centre for Economics and Business Research
As with turnover, Figure 4 shows the GVA contributions made by the individual three- and four- digit SIC activities that constitute the arts and culture industry, over the period 2008-13.
Figure 4: Approximate gross value added at basic prices of the arts and culture by SIC three- and four-digit productive activity, 2008-13, £m
Source: ONS Annual Business Survey 2008-13, Cebr analysis
Between 2008 and 2013, the largest GVA contributions were provided by book publishing and artistic creation. These accounted for 29 and 26 per cent respectively, of the arts and culture industry’s GVA in 2013. In 2010, book publishing surpassed artistic creation as the largest contributor to the industry’s GVA. However, its growth over the period 2010–13 has been the weakest of the subsectors that make up the industry. GVA in this subsector over the period 2010-13 fell by 0.8 per cent, from £2.3 billion in 2010 to £2.2 billion in 2013. The strongest growth over the same period was experienced by support activities to performing arts, which saw its GVA increase by 251 per cent to almost £500 million. Sound recording also performed well between 2010 and 2013, with its GVA increasing by 186 per cent from approximately £340 million to almost £1 billion.
3.3 Labour productivity
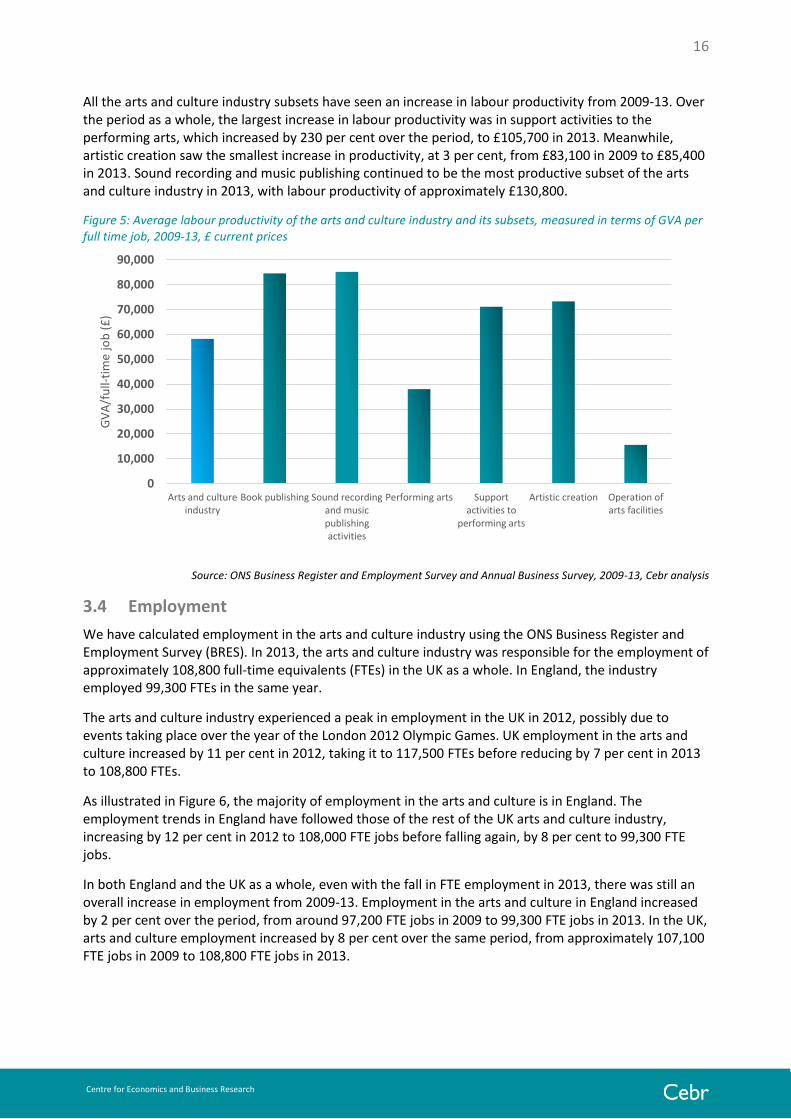
We have used the GVA contributions along with BRES employment data to produce estimates of the labour productivity of the arts and culture industry as a whole, as well as of the subsets of productive activities that fall within our industry definition. As illustrated in Figure 5, GVA per full time job in the arts and culture industry averaged £58,000 over the period 2009-13. This is greater than the equivalent figure for the UK as a whole, which was £39,500 over the same period. This indicates that many workers in the arts and culture industry produce value at a high rate, while drawing on comparatively few resources as inputs.
A number of segments of the arts and culture industry have very high productivity compared to the industry as a whole. For example, GVA per full time job in book publishing, sound recording and music publishing activities were significantly above the average for arts and culture industry over the period 2009-13, with labour productivity of approximately £85,000.
0
500
1,000
1,500
2,000
2,500
Book publishing Sound recording Performing arts Support activitiesto performing
arts
Artistic creation Operation of artsfacilities
GV
A (
£m
)
2008
2009
2010
2011
2012
2013
Centre for Economics and Business Research
16
© Centre for Economics and Business Research
All the arts and culture industry subsets have seen an increase in labour productivity from 2009-13. Over the period as a whole, the largest increase in labour productivity was in support activities to the performing arts, which increased by 230 per cent over the period, to £105,700 in 2013. Meanwhile, artistic creation saw the smallest increase in productivity, at 3 per cent, from £83,100 in 2009 to £85,400 in 2013. Sound recording and music publishing continued to be the most productive subset of the arts and culture industry in 2013, with labour productivity of approximately £130,800.
Figure 5: Average labour productivity of the arts and culture industry and its subsets, measured in terms of GVA per full time job, 2009-13, £ current prices
Source: ONS Business Register and Employment Survey and Annual Business Survey, 2009-13, Cebr analysis
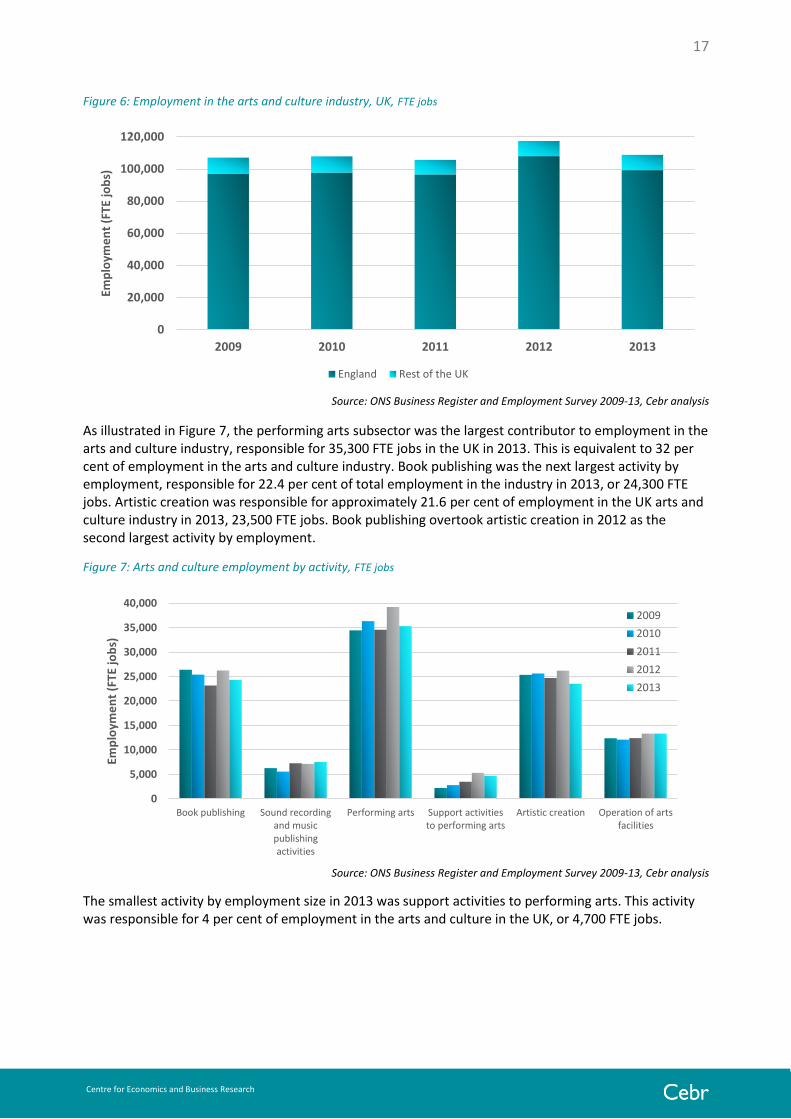
3.4 Employment
We have calculated employment in the arts and culture industry using the ONS Business Register and Employment Survey (BRES). In 2013, the arts and culture industry was responsible for the employment of approximately 108,800 full-time equivalents (FTEs) in the UK as a whole. In England, the industry employed 99,300 FTEs in the same year.
The arts and culture industry experienced a peak in employment in the UK in 2012, possibly due to events taking place over the year of the London 2012 Olympic Games. UK employment in the arts and culture increased by 11 per cent in 2012, taking it to 117,500 FTEs before reducing by 7 per cent in 2013 to 108,800 FTEs.
As illustrated in Figure 6, the majority of employment in the arts and culture is in England. The employment trends in England have followed those of the rest of the UK arts and culture industry, increasing by 12 per cent in 2012 to 108,000 FTE jobs before falling again, by 8 per cent to 99,300 FTE jobs.
In both England and the UK as a whole, even with the fall in FTE employment in 2013, there was still an overall increase in employment from 2009-13. Employment in the arts and culture in England increased by 2 per cent over the period, from around 97,200 FTE jobs in 2009 to 99,300 FTE jobs in 2013. In the UK, arts and culture employment increased by 8 per cent over the same period, from approximately 107,100 FTE jobs in 2009 to 108,800 FTE jobs in 2013.
0
10,000
20,000
30,000
40,000
50,000
60,000
70,000
80,000
90,000
Arts and cultureindustry
Book publishing Sound recordingand musicpublishingactivities
Performing arts Supportactivities to
performing arts
Artistic creation Operation ofarts facilities
GV
A/f
ull-
tim
e jo
b (
£)
Centre for Economics and Business Research
17
© Centre for Economics and Business Research
Figure 6: Employment in the arts and culture industry, UK, FTE jobs
Source: ONS Business Register and Employment Survey 2009-13, Cebr analysis
As illustrated in Figure 7, the performing arts subsector was the largest contributor to employment in the arts and culture industry, responsible for 35,300 FTE jobs in the UK in 2013. This is equivalent to 32 per cent of employment in the arts and culture industry. Book publishing was the next largest activity by employment, responsible for 22.4 per cent of total employment in the industry in 2013, or 24,300 FTE jobs. Artistic creation was responsible for approximately 21.6 per cent of employment in the UK arts and culture industry in 2013, 23,500 FTE jobs. Book publishing overtook artistic creation in 2012 as the second largest activity by employment.
Figure 7: Arts and culture employment by activity, FTE jobs
Source: ONS Business Register and Employment Survey 2009-13, Cebr analysis
The smallest activity by employment size in 2013 was support activities to performing arts. This activity was responsible for 4 per cent of employment in the arts and culture in the UK, or 4,700 FTE jobs.
0
20,000
40,000
60,000
80,000
100,000
120,000
2009 2010 2011 2012 2013
Emp
loym
en
t (F
TE jo
bs)
England Rest of the UK
0
5,000
10,000
15,000
20,000
25,000
30,000
35,000
40,000
Book publishing Sound recordingand musicpublishingactivities
Performing arts Support activitiesto performing arts
Artistic creation Operation of artsfacilities
Emp
loym
en
t (F
TE jo
bs)
2009
2010
2011
2012
2013

Centre for Economics and Business Research
18
© Centre for Economics and Business Research
3.5 Market structure of the arts and culture industry
Using the Business Population Estimates 2013 dataset14, we were able to look at the market structure of the broad industries from which the arts and culture industry, as defined for this study, is drawn. This helps to show the numbers of enterprises in different employment size bands, as illustrated in Table 1. The industries that make up our definition of the arts and culture industry, as detailed in Appendix I, comprise of a large number of small enterprises. Meanwhile, large organisations typically account for a relatively small proportion of the total enterprises within the arts and culture industry.
Firms with one or no employees make up 91 per cent of the businesses operating within the wider sectors from which we take our definition of the arts and culture industry.15 This contrasts with firms employing 250 or more employees, which accounted for less than 0.1 per cent of businesses in 2013. In the wider economy, the share of firms with one or no employees is much lower, accounting for 79 per cent of businesses. Education is the only sector that has a comparably high proportion of firms this size, at approximately 94 per cent.
Table 1: Market structure of the broader industry groups from which the arts and culture industry is drawn, enterprise size by employment in the UK, 2013
Employment size bands
SIC J58: Publishing activities
SIC J59: Motion picture, video and
television programme
production, sound recording and music publishing activities
SIC R90: Creative, arts and
entertainment activities
All industries
# of firms
% of firms
# of firms
% of firms
# of firms
% of firms
# of firms % of firms
With no employees 28,460 84.8 43,760 88.7 101,550 92.7 3,684,745 75.3
1 205 0.6 260 0.5 1,425 1.3 162,465 3.3
2-4 2,605 7.8 3,585 7.3 4,780 4.4 594,655 12.1
5-9 1,015 3 855 1.7 1,065 1.0 229,765 4.7
10-19 625 1.9 480 1 465 0.4 121,530 2.5
20-49 380 1.1 255 0.5 165 0.2 65,215 1.3
50-99 125 0.4 65 0.1 60 0.1 20,180 0.4
100-199 55 0.2 45 0.1 20 0.0 8,765 0.2
200-249 15 0.0 5 0.0 5 0.0 1,745 0.0
250-499 30 0.1 15 0.0 5 0.0 3,410 0.1
500 or more 45 0.1 15 0.0 0 0.0 3,180 0.1
Source: Department for Business Innovation and Skills, Cebr analysis
14 https://www.gov.uk/government/collections/business-population-estimates
15 Note that our definition includes all industries within creative, arts and entertainment activities (SIC 90). 94 per cent of
businesses operating within this sector have one or no employees.

Centre for Economics and Business Research
19
© Centre for Economics and Business Research
3.6 Structure of incomes from employment in the arts and culture industry
We have used the ONS’ Annual Survey of Hours and Earnings (ASHE) to look at earnings within the arts and culture industry. As illustrated in
Figure 8, in creative, arts and entertainment activities (SIC R90), average full-time gross pay in 2013 was £33,784. Over the period 2008-13, full-time earnings increased by 6 per cent, meanwhile, part-time earnings increased by 17 per cent. Between 2013 and 2014, average part-time earnings fell by 7 per cent, meaning that over the period 2008-14, part-time earnings increased by 9 per cent.16
Figure 8: Comparison between UK full-time and part-time earnings in SIC R90: creative, arts and entertainment activities, £
Source: ONS Annual Survey of Hours and Earnings, Cebr analysis
16 A similar comparison for full-time earnings is not possible as the 2014 data is incomplete.
0
5,000
10,000
15,000
20,000
25,000
30,000
35,000
2008 2009 2010 2011 2012 2013 2014
Earn
ings
(£
)
Full-time All workers Part-time
Centre for Economics and Business Research
20
© Centre for Economics and Business Research
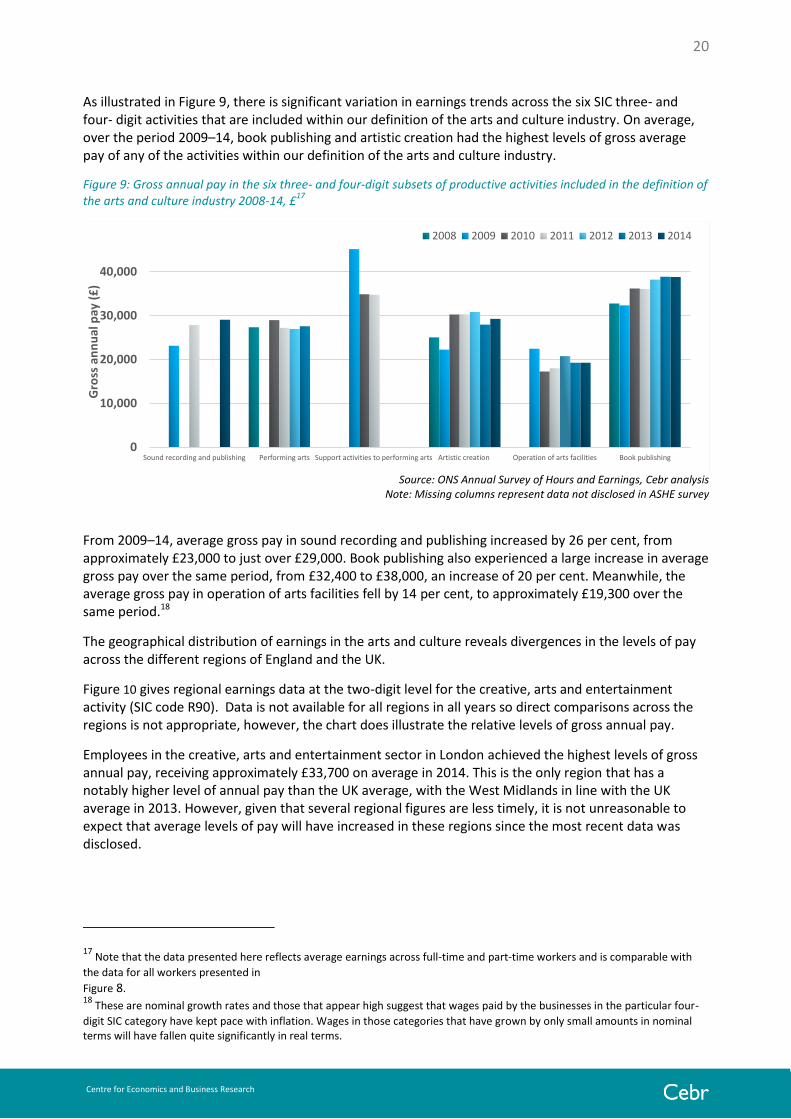
As illustrated in Figure 9, there is significant variation in earnings trends across the six SIC three- and four- digit activities that are included within our definition of the arts and culture industry. On average, over the period 2009–14, book publishing and artistic creation had the highest levels of gross average pay of any of the activities within our definition of the arts and culture industry.
Figure 9: Gross annual pay in the six three- and four-digit subsets of productive activities included in the definition of the arts and culture industry 2008-14, £
17
Source: ONS Annual Survey of Hours and Earnings, Cebr analysis Note: Missing columns represent data not disclosed in ASHE survey
From 2009–14, average gross pay in sound recording and publishing increased by 26 per cent, from approximately £23,000 to just over £29,000. Book publishing also experienced a large increase in average gross pay over the same period, from £32,400 to £38,000, an increase of 20 per cent. Meanwhile, the average gross pay in operation of arts facilities fell by 14 per cent, to approximately £19,300 over the same period.18
The geographical distribution of earnings in the arts and culture reveals divergences in the levels of pay across the different regions of England and the UK.
Figure 10 gives regional earnings data at the two-digit level for the creative, arts and entertainment activity (SIC code R90). Data is not available for all regions in all years so direct comparisons across the regions is not appropriate, however, the chart does illustrate the relative levels of gross annual pay.
Employees in the creative, arts and entertainment sector in London achieved the highest levels of gross annual pay, receiving approximately £33,700 on average in 2014. This is the only region that has a notably higher level of annual pay than the UK average, with the West Midlands in line with the UK average in 2013. However, given that several regional figures are less timely, it is not unreasonable to expect that average levels of pay will have increased in these regions since the most recent data was disclosed.
17 Note that the data presented here reflects average earnings across full-time and part-time workers and is comparable with
the data for all workers presented in
Figure 8. 18
These are nominal growth rates and those that appear high suggest that wages paid by the businesses in the particular four-
digit SIC category have kept pace with inflation. Wages in those categories that have grown by only small amounts in nominal terms will have fallen quite significantly in real terms.
0
10,000
20,000
30,000
40,000
Sound recording and publishing Performing arts Support activities to performing arts Artistic creation Operation of arts facilities Book publishing
Gro
ss a
nn
ual
pay
(£
)
2008 2009 2010 2011 2012 2013 2014

Centre for Economics and Business Research
21
© Centre for Economics and Business Research
Figure 10: Regional breakdown of gross annual pay in R90: creative, arts and entertainment, 2014 (unless otherwise stated), £
Source: ONS Annual Survey of Hours and Earnings, Cebr analysis
0
5,000
10,000
15,000
20,000
25,000
30,000
35,000
United Kingdom London WestMidlands(*2013)
Wales(*2009) South East Yorkshire andThe
Humber(*2013)
Scotland South West East(*2012)
An
nu
al P
ay (
£)
Centre for Economics and Business Research
22
© Centre for Economics and Business Research
3.7 Consumer expenditure on the arts and culture
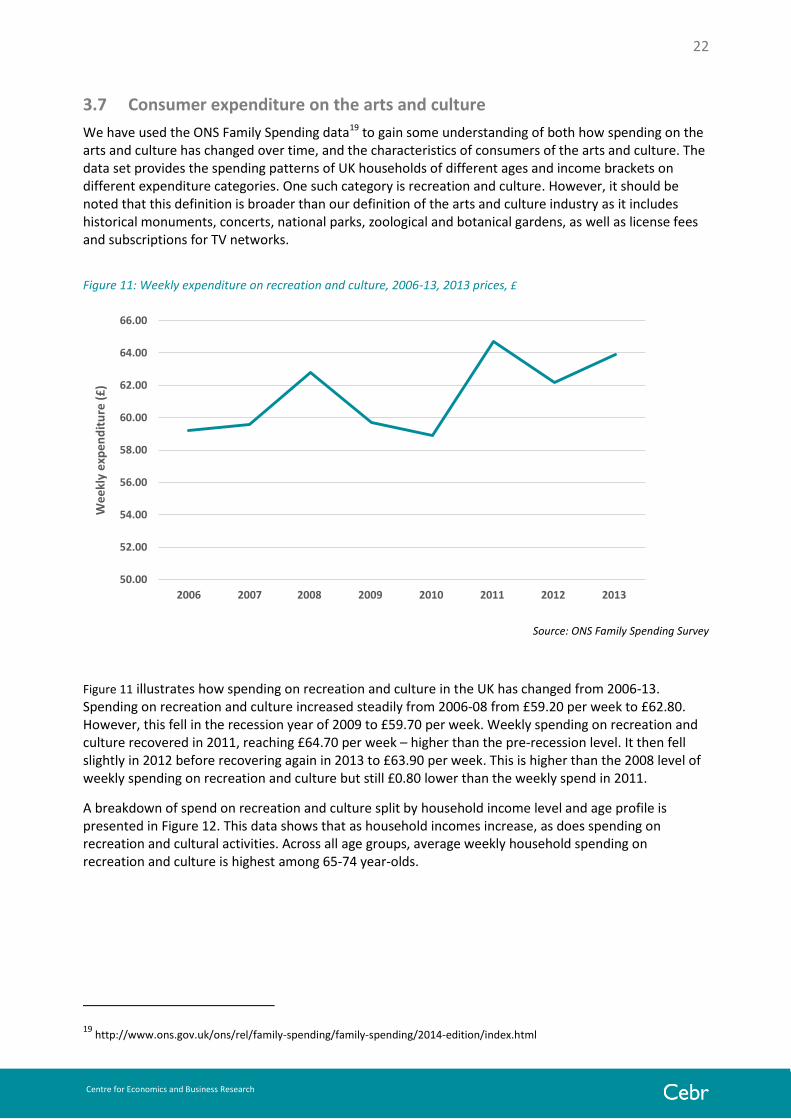
We have used the ONS Family Spending data19 to gain some understanding of both how spending on the arts and culture has changed over time, and the characteristics of consumers of the arts and culture. The data set provides the spending patterns of UK households of different ages and income brackets on different expenditure categories. One such category is recreation and culture. However, it should be noted that this definition is broader than our definition of the arts and culture industry as it includes historical monuments, concerts, national parks, zoological and botanical gardens, as well as license fees and subscriptions for TV networks.
Figure 11: Weekly expenditure on recreation and culture, 2006-13, 2013 prices, £
Source: ONS Family Spending Survey
Figure 11 illustrates how spending on recreation and culture in the UK has changed from 2006-13. Spending on recreation and culture increased steadily from 2006-08 from £59.20 per week to £62.80. However, this fell in the recession year of 2009 to £59.70 per week. Weekly spending on recreation and culture recovered in 2011, reaching £64.70 per week – higher than the pre-recession level. It then fell slightly in 2012 before recovering again in 2013 to £63.90 per week. This is higher than the 2008 level of weekly spending on recreation and culture but still £0.80 lower than the weekly spend in 2011.
A breakdown of spend on recreation and culture split by household income level and age profile is presented in Figure 12. This data shows that as household incomes increase, as does spending on recreation and cultural activities. Across all age groups, average weekly household spending on recreation and culture is highest among 65-74 year-olds.
19 http://www.ons.gov.uk/ons/rel/family-spending/family-spending/2014-edition/index.html
50.00
52.00
54.00
56.00
58.00
60.00
62.00
64.00
66.00
2006 2007 2008 2009 2010 2011 2012 2013
We
ekl
y e
xpe
nd
itu
re (
£)

Centre for Economics and Business Research
23
© Centre for Economics and Business Research
Figure 12: Average weekly household spend on recreation and culture, by income quintile and age of household reference person, 2011-13, £
Source: ONS Family Spending Survey, 2014
3.8 Funding of Arts Council England’s national portfolio organisations
In this section we consider funding arrangements specific to the arts and culture industry. This analysis is based on the 2012/13 and 2013/14 data provided by National Portfolio Organisations (NPOs) supported by the Arts Council, which the Arts Council made available for Cebr’s analysis. While these organisations may not represent the funding structure that is typical for all the arts and culture organisations in the industry, they are nevertheless representative of a significant proportion of the aggregate economic activities of that industry. However, they are unlikely to be representative of organisations operating within the book publishing or sound recording and publishing industries, which are likely to contain a much higher proportion of organisations that are less reliant on direct public funding.
Funding of the arts and culture sector is derived from three main channels: earned income, such as from ticket sales and merchandise; public funding, for example from Arts Council England, local authorities and other public bodies; and contributed income, which includes sponsorship, trusts and donations. Between March 2012 and April 2015, the Arts Council invested £1.37 billion of public money from government and £866 million from the National Lottery to help more people experience arts and culture.
0
20
40
60
80
100
120
140
Lowest 20 per cent Second quintile group Third quintile group Fourth quintile group Highest 20 per cent
Ave
rage
we
ekl
y h
ou
seh
old
sp
en
d o
n
recr
eat
ion
an
d c
ult
ure
(£
)
Under 30
30-49
50-64
65-74
75+

Centre for Economics and Business Research
24
© Centre for Economics and Business Research
Figure 13 illustrates the importance of each of the income streams using data supplied by the arts and culture organisations that receive regular funding from the Arts Council, relating to the financial years 2012/13 and 2013/14. This data covers all regions, all disciplines (excluding museums) and all organisations.
In total, the NPOs received £1.39 billion in 2013/14, an increase of 4 per cent on 2012/13. The largest contributor to this was earned income, responsible for 52 per cent of the total in 2013/14. Funding from earned income increased by 6 per cent from 2012/13 to 2013/14, from £683 million to £722 million. When taken together Arts Council, local authority and other public subsidies make the next largest contribution, amounting to £500 million, 36 per cent of total income. Between 2012/13 and 2013/14 Arts Council subsidy increased by 2 per cent to £385 million. However, there was a decrease of 5 per cent in local authority subsidy and of 11 per cent in other public subsidies, to £80 million and £35 million respectively. Contributed income was the third most significant individual component of total income in 2013/14, accounting for £169 million of the total income (12 per cent), an increase of 7 per cent from 2012/13 figures.
Figure 13: Arts Council England’s National Portfolio Organisations (excluding museums) income by source, 2012-14, £ million
Source: Arts Council England, Cebr analysis
0
100
200
300
400
500
600
700
800
Earned Income Arts CouncilEngland subsidy
Contributedincome
Local authoritysubsidy
Other publicsubsidy
£m
2012/13 2013/14

Centre for Economics and Business Research
25
© Centre for Economics and Business Research
3.9 Exchequer contributions by the arts and culture industry
The arts and culture industry is a significant recipient of public funding, however, as a result of its productive revenue and value-generating activities, it also contributes to the exchequer via tax. The estimated contribution of the creative industries to the exchequer, broken down by type of tax, over the period 2012-13 is illustrated in Table 2.
Table 2: Tax contributions of the arts and culture 2012-13, £m
Type of tax Tax paid (£m) Percentage of UK
VAT 1,130 1.4%
Corporation tax 228.8 0.6%
Income tax 428.7 0.3%
National Insurance contributions 566.5 0.6%
Source: ONS, HMRC, Cebr analysis
Based on the data provided by Arts Council England on the public funding of NPOs for our analysis in Section 0, Cebr calculates that there is £5 of tax contributed by the arts and culture industry per £1 of public funding provided.20
20 Public funding includes the Arts Council England subsidy, local authority subsidy and other public subsidies. Note that this is
based on a comparison of 2012/13 public funding (which totalled £501 million, excluding museums) taken from the Arts Council NPO annual submission and 2012/13 tax contributions.
Centre for Economics and Business Research
26
© Centre for Economics and Business Research
4 Macroeconomic contributions of the arts and culture In this section we set out our findings on the macroeconomic contributions of the arts and culture industry, including indirect and induced multiplier impacts.21 We outline the estimated contributions made by the arts and culture industry to GVA and ‘industrial’ output at basic prices using the national accounting data. We also look at the contributions made to employment and household incomes using the Business Register and Employment Survey (BRES) and Annual Survey of Hours and Earnings (ASHE), examining the impacts across other UK nations and regions.
4.1 Embedding the arts and culture within our macroeconomic impacts framework
In this subsection we give a broad overview of the way in which we embed the arts and culture within our macroeconomic impacts modelling framework. We adopt the framework provided by the ONS supply-use tables to establish the size and economic impact of the arts and culture. Using this framework to analyse the arts and culture is one of the best means of ensuring consistency with the national accounting framework. The process of embedding a specific subset of productive activities within the framework involves assigning the arts and culture industry an explicit role within the supply-use tables and Cebr’s input-output models. By doing this we provide the foundation for establishing the economic size (direct impact) of the arts and culture, and the wider economic impact of the arts and culture on the UK economy and its constituent countries and regions.
We then use the multipliers along with the direct impacts data to produce estimates of the total impacts of the industry through the supply chain response (indirect impacts) and through the income from employment generated and spent in the wider economy (induced impacts). We produce these impacts for the UK and England as a whole before analysing regional differences.
21 Note that the estimates of the macroeconomic impacts of the arts and culture industry presented in this section do not take
into account ‘additionality’. The concept of ‘additionality’ in this context would be concerned with the impacts that are additional as a result of the existence of the arts and culture industry and that would not have been generated elsewhere in the absence of the industry.

Centre for Economics and Business Research
27
© Centre for Economics and Business Research
4.2 ‘Industrial’ output multiplier for the arts and culture
Conceptually, ‘industrial’ output is similar to turnover in business accounting. It is comprised of all revenues earned before any costs are subtracted. Excluding taxes and subsidies, these revenues must cover wages paid to employees, a reasonable rate of return on capital and what is paid to suppliers for the inputs required for the relevant industry’s production process. This measure is typically larger than GVA as it still includes the costs of intermediate inputs.
As outlined in Section 2, based on the ABS data, we estimate turnover of £15.1 billion for the arts and culture industry in 2013. This turnover estimate is the direct economic contribution made by the arts and culture.
However, in supplying its products, the arts and culture industry draws upon inputs from many sectors of the economy. Our input-output modelling suggests that the arts and culture industry’s output multiplier
is 2.15, as illustrated in Figure 14. This means that for every £1 increase in the arts and culture industry’s output, the economy-wide increase in output due to direct, indirect and induced impacts is £2.15.
Figure 14:'Industrial' output multiplier for the arts and culture
Source: Cebr analysis
Based on this multiplier effect, the arts and culture industry’s output contribution to the UK economy of £15.1 billion in 2013 is consistent with an aggregate output contribution, including indirect and induced multiplier impacts, of £32.5 billion.
Centre for Economics and Business Research
28
© Centre for Economics and Business Research
4.3 The arts and culture industry’s contribution to GVA
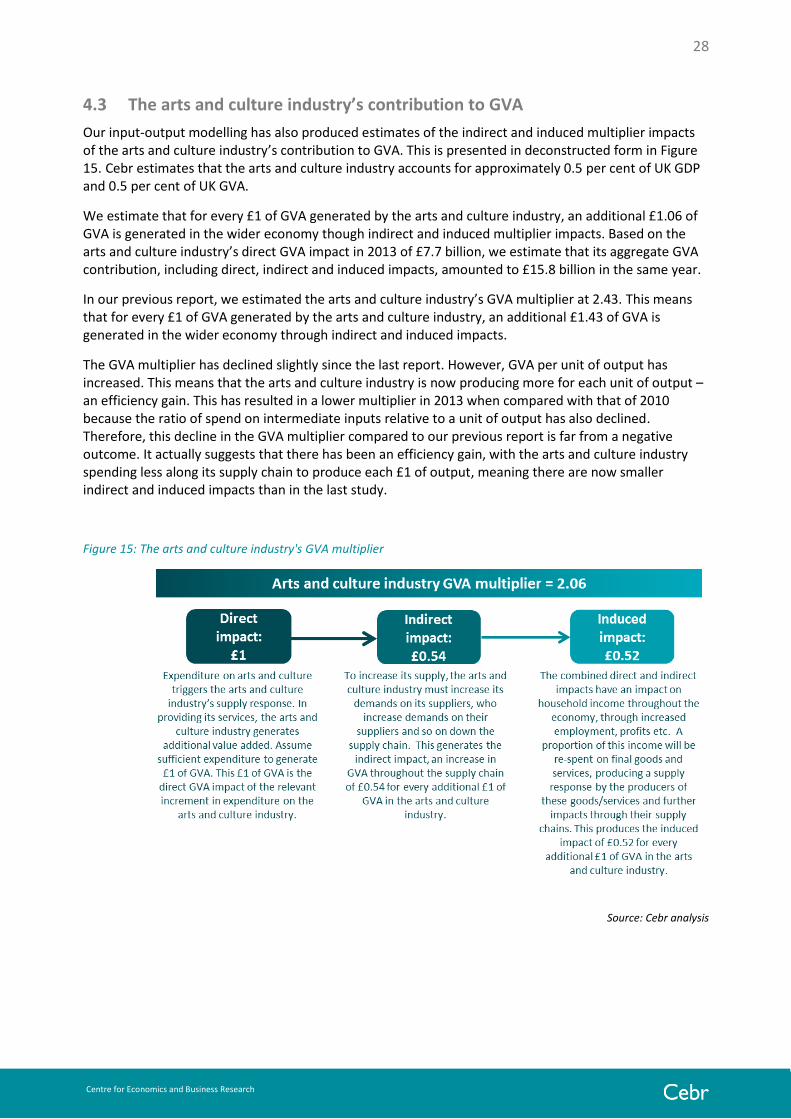
Our input-output modelling has also produced estimates of the indirect and induced multiplier impacts of the arts and culture industry’s contribution to GVA. This is presented in deconstructed form in Figure 15. Cebr estimates that the arts and culture industry accounts for approximately 0.5 per cent of UK GDP and 0.5 per cent of UK GVA.
We estimate that for every £1 of GVA generated by the arts and culture industry, an additional £1.06 of GVA is generated in the wider economy though indirect and induced multiplier impacts. Based on the arts and culture industry’s direct GVA impact in 2013 of £7.7 billion, we estimate that its aggregate GVA contribution, including direct, indirect and induced impacts, amounted to £15.8 billion in the same year.
In our previous report, we estimated the arts and culture industry’s GVA multiplier at 2.43. This means that for every £1 of GVA generated by the arts and culture industry, an additional £1.43 of GVA is generated in the wider economy through indirect and induced impacts.
The GVA multiplier has declined slightly since the last report. However, GVA per unit of output has increased. This means that the arts and culture industry is now producing more for each unit of output – an efficiency gain. This has resulted in a lower multiplier in 2013 when compared with that of 2010 because the ratio of spend on intermediate inputs relative to a unit of output has also declined. Therefore, this decline in the GVA multiplier compared to our previous report is far from a negative outcome. It actually suggests that there has been an efficiency gain, with the arts and culture industry spending less along its supply chain to produce each £1 of output, meaning there are now smaller indirect and induced impacts than in the last study.
Figure 15: The arts and culture industry's GVA multiplier
Source: Cebr analysis

Centre for Economics and Business Research
29
© Centre for Economics and Business Research
4.4 Contribution of the arts and culture to employment
Our estimate of the direct employment contribution of the arts and culture industry to employment is outlined in Section 3. However, the employment impact of the arts and culture industry is not confined to these direct job contributions.
As illustrated in Figure 16, using our input-output models, we find that the arts and culture industry has an employment multiplier of 2.38. This is remarkably similar to the 2.37 employment multiplier estimated in 2012. The change is well within the margin of error that enables us to conclude that there is little change. However, to the extent that the data is representative, this slight increase in the multiplier suggests a small efficiency loss in the arts and culture industry’s supply chain.22
This means that for every one FTE job supported by the arts and culture industry, an additional 1.38 FTE jobs are supported in the wider economy, through indirect and induced multiplier impacts. This employment multiplier produces an estimated total FTE employment impact of 259,000 FTE jobs in 2013.
Figure 16: The arts and culture industry’s employment multiplier
Source: Cebr analysis
22 Note that in Section 4.3, the efficiency gain relates to the arts and culture industry and its GVA. However, in this section, we
are referring to the supply chain of the arts and culture industry when we discuss efficiency. Here, the increased multiplier suggests that those industries which supply the arts and culture industry have become less efficient i.e. when the arts and culture industry hires one additional FTE, more FTEs are required along the supply chain than previously.

Centre for Economics and Business Research
30
© Centre for Economics and Business Research
4.5 Impact of the arts and culture industry on household incomes
Based on official earnings data taken from the Annual Survey of Hours and Earnings (ASHE), the arts and culture industry paid a median salary of £27,948 per FTE employee in 2013. This compares with a median salary of £27,291 based on 2010 data for the purposes of the original study.
Using our input-output modelling, we estimate that for every £1 of income from employment generated in the arts and culture, an additional £1.06 of income from employment is generated in the wider economy through indirect and induced multiplier impacts, as illustrated in Figure 17.
This is down significantly on the multiplier estimate of £3.01 presented in our original study.23 This is a reflection of more accurate data on the structure of the economy since our previous estimate, subdued wage growth across the economy and the fact that the arts and culture industry is placing proportionately less demands on its supply chain per unit of its own output.
This means that for every gross salary of £27,948 paid by the arts and culture industry, a further £29,700 of gross salary was earned elsewhere in the economy through indirect and induced impacts.
Figure 17: The arts and culture industry's income multiplier
Source: Cebr analysis
23 Meaning that for every £1 of income from employment generated in arts and culture, an additional £2.01 of income from
employment is generated in the wider economy through indirect and induced impacts.

Centre for Economics and Business Research
31
© Centre for Economics and Business Research
4.6 Regional variation in our multiplier estimates
Using our multiplier modelling we have been able to estimate the contribution made by the arts and culture industry to national and regional economies across the UK in 2011.
Table 3 illustrates the importance of the arts and culture industry across the UK in terms of its contribution to regional GVA.
Across the UK nations and regions, the arts and culture industry contributes, on average, 0.5 per cent of the region’s GVA. This ranges from a high of 0.81 per cent of GVA in London, to a low of 0.32 per cent in Wales. The largest absolute regional contribution of the arts and culture is in London, estimated at £2.5 billion. Meanwhile, the smallest contribution of the arts and culture is to the economy in Northern Ireland, estimated at £112 million.outh East and East of England.
Table 4 gives the results of our input-output modelling at the level of the UK nations and regions. Separate (Type II) multipliers24 are shown for each of the variables GVA, industrial output and employment and are ordered according to the magnitude of the GVA multiplier.25
Table 3: Direct GVA contributions of the arts and culture industry to UK nations and English regions, 2011
UK nation/English region GVA (£m) Percentage of area’s GVA
London 2,454 0.81%
South East 1,348 0.69%
England 6,507 0.56%
United Kingdom 7,269 0.53%
East of England 546 0.48%
Scotland 500 0.47%
North West 552 0.43%
North East 177 0.43%
East Midlands 334 0.42%
West Midlands 383 0.39%
Northern Ireland 112 0.39%
Yorkshire and the Humber 345 0.37%
South West 368 0.37%
Wales 149 0.32%
Source: Cebr analysis
24 Type II multipliers capture direct, indirect and induced impacts.
25 Note that these estimates capture the impacts of the arts and culture industry of a region on that region itself. They do not
take account of the potential impacts on the arts and culture industries of other regions when other regions need to draw on suppliers in that region for which the multiplier estimate is being produced.

Centre for Economics and Business Research
32
© Centre for Economics and Business Research
These estimates suggest that the arts and culture industry in the East of England has the largest multiplier impacts of all the English nations and regions. Increasing spending on the arts and culture in these regions will have more of a localised impact compared to other areas of the UK.
The East Midlands and West Midlands have lower multiplier impacts. In these cases, the regional economy is relatively less able to supply the goods and services demanded as a result of increased demand for the arts and culture. This means that more of these goods and services must be sourced from outside the region, reducing the multiplier effects realised within the region itself.26
London is estimated to have the lowest multiplier impacts but this is unlikely to be the case in practice. Our models consistently underestimate the magnitude of multiplier impacts in London. This is because of the size of the London economy and the fact that it is heavily weighted towards financial services. This makes the location quotients27 for every other sector smaller than they should be, which work their way through the model to produce lower than expected multipliers. In reality, we would expect the London multipliers to be only very slightly smaller, if not the same, as the UK multipliers. This seems logical also, as it is difficult to imagine many London-based arts and culture organisations sourcing inputs outside the local economy, except perhaps around the edges where there might be some leakage to the South East and East of England.
Table 4: Type II multipliers by country and region
UK nation/English region GVA Output Employment
East of England 2.09 2.20 2.36
North West 2.08 2.19 2.33
United Kingdom 2.04 2.14 2.25
Northern Ireland 1.98 2.09 2.22
South West 1.98 2.08 2.21
Total England 1.97 2.06 2.19
Yorkshire and the Humber 1.91 2.00 2.12
Scotland 1.90 1.99 2.11
Wales 1.90 1.99 2.11
North East 1.89 1.99 2.11
South East 1.89 1.97 2.09
East Midlands 1.88 1.97 2.10
West Midlands 1.86 1.95 2.07
London 1.78 1.85 1.96
Source: Cebr analysis
26 Note that the differences between the regional multipliers in this study and those in the 2013 study is due in part to the ONS
refining their models and the use of more up to date data. 27
Location quotients represent the ability of an entity within a particular region to supply the goods and services demanded by
the regional economy, taking into account the relative sizes of the sectors providing and purchasing inputs.
Centre for Economics and Business Research
33
© Centre for Economics and Business Research
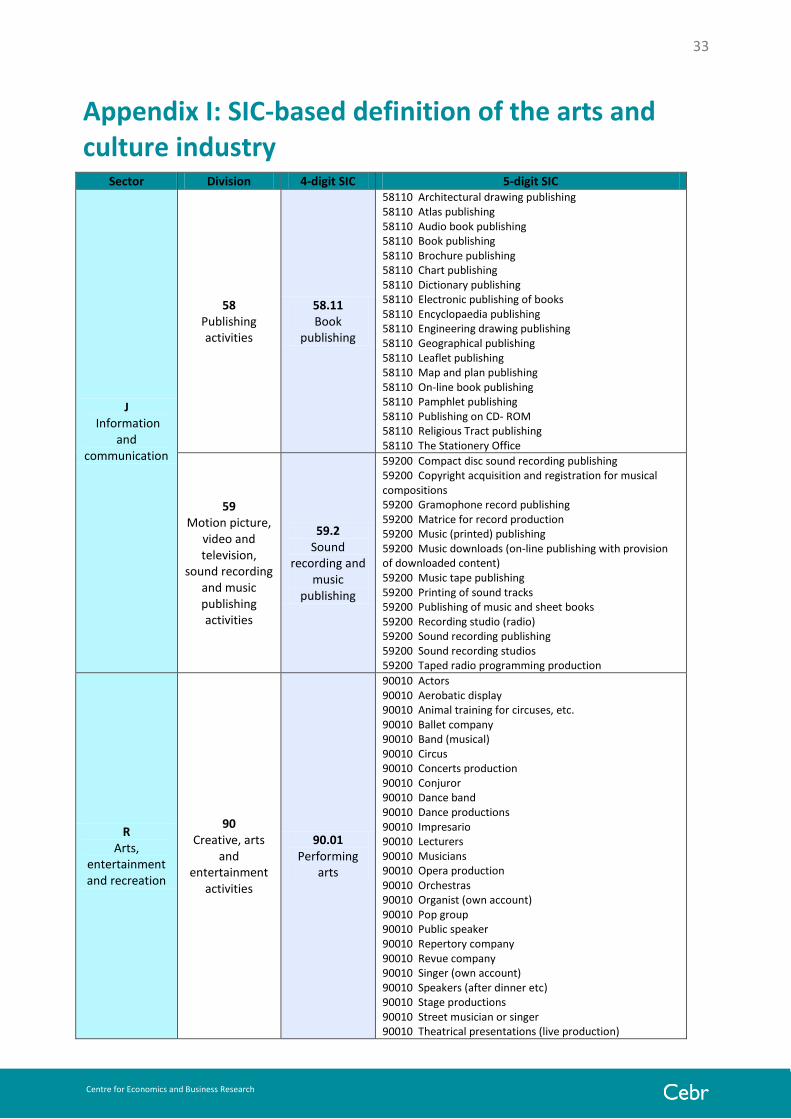
Appendix I: SIC-based definition of the arts and culture industry
Sector Division 4-digit SIC 5-digit SIC
J Information
and communication
58 Publishing activities
58.11 Book
publishing
58110 Architectural drawing publishing 58110 Atlas publishing 58110 Audio book publishing 58110 Book publishing 58110 Brochure publishing 58110 Chart publishing 58110 Dictionary publishing 58110 Electronic publishing of books 58110 Encyclopaedia publishing 58110 Engineering drawing publishing 58110 Geographical publishing 58110 Leaflet publishing 58110 Map and plan publishing 58110 On-line book publishing 58110 Pamphlet publishing 58110 Publishing on CD- ROM 58110 Religious Tract publishing 58110 The Stationery Office
59 Motion picture,
video and television,
sound recording and music publishing activities
59.2 Sound
recording and music
publishing
59200 Compact disc sound recording publishing 59200 Copyright acquisition and registration for musical compositions 59200 Gramophone record publishing 59200 Matrice for record production 59200 Music (printed) publishing 59200 Music downloads (on-line publishing with provision of downloaded content) 59200 Music tape publishing 59200 Printing of sound tracks 59200 Publishing of music and sheet books 59200 Recording studio (radio) 59200 Sound recording publishing 59200 Sound recording studios 59200 Taped radio programming production
R Arts,
entertainment and recreation
90 Creative, arts
and entertainment
activities
90.01 Performing
arts
90010 Actors 90010 Aerobatic display 90010 Animal training for circuses, etc. 90010 Ballet company 90010 Band (musical) 90010 Circus 90010 Concerts production 90010 Conjuror 90010 Dance band 90010 Dance productions 90010 Impresario 90010 Lecturers 90010 Musicians 90010 Opera production 90010 Orchestras 90010 Organist (own account) 90010 Pop group 90010 Public speaker 90010 Repertory company 90010 Revue company 90010 Singer (own account) 90010 Speakers (after dinner etc) 90010 Stage productions 90010 Street musician or singer 90010 Theatrical presentations (live production)

Centre for Economics and Business Research
34
© Centre for Economics and Business Research
90010 Theatrical touring company 90010 Travelling show 90010 Variety artiste (own account) 90010 Ventriloquist
Sector Division 4-digit SIC 5-digit SIC
R Arts,
entertainment and recreation
90 Creative, arts
and entertainment
activities
90.02 Support
activities to performing
arts
90020 Direction, production and support activities to circus performances 90020 Directors (theatre) 90020 Performing arts support activities 90020 Scene shifters and lighting engineers 90020 Stage set designers and builders 90020 Support activities to performing arts e.g. stage set-up, costume and lighting design etc.
90.03 Artistic
creation
90030 Art expert 90030 Artist 90030 Author 90030 Cartoonists 90030 Copper plate engraver (artistic) 90030 Designing (artistic) 90030 Engravers 90030 Etchers 90030 Fine art expert 90030 Freelance journalist 90030 Heraldic painting 90030 Illuminating (illustrating) 90030 Journalists 90030 Librettist 90030 Lithographic artist (own account) 90030 Lyric author 90030 Music composer 90030 Music copyist and transcriber (own account) 90030 Painters (artistic) 90030 Picture restoring 90030 Playwright 90030 Poet 90030 Repair and restoration of works of art 90030 Scenario writer 90030 Scenic artist 90030 Sculptors 90030 Song writer 90030 Technical and training manual authors 90030 Wood engraver (artistic)
90.04 Operation of arts facilities
90040 Arts facilities operation 90040 Concert halls operation 90040 Local authority concert halls and theatres 90040 Music hall 90040 Opera house 90040 Theatre halls operation

Centre for Economics and Business Research
© Centre for Economics and Business Research
Arts Council England The Hive
49 Lever Street Manchester
M1 1FN
Email: [email protected] Phone: 0845 300 6200
Textphone: 020 7973 6564
www.artscouncil.org.uk @ace_national
facebook.com/artscouncilofengland
Charity registration number: 1036733
You can get this publication in Braille, in large print, on audio CD and in
electronic formats. Please contact us if you need any of these formats.
ISBN: 978-0-7287-1558-5
© Arts Council England, July 2015