contribution to the study of severity of illness...
TRANSCRIPT

CONTRIBUTION TO THE STUDYOF SEVERITY OF ILLNESS ASSESSMENT
IN THE ADULT INTENSIVE CARE
Didier LedouxService des Soins Intensifs Généraux
Université et CHU de Liège
Thèse présentée en vue de l'obtention du gradede docteur en Sciences Médicales
2008-2009
Université de LiègeFaculté de Médecine


Cover: “Escaping prognosis ...” (We are very thankful to those who accepted to have their picture published on this cover)


In memory of my mother, Carmela Menotti


1
Table of contents
Abbreviations ............................................................................................................................. 3
Remerciements........................................................................................................................... 5
Summary ..................................................................................................................................... 7
Résumé ..................................................................................................................................... 13
1 Introduction ...................................................................................................................... 19
1.1 An overview of existing generic outcome models for adult ICU patients ................. 20
1.1.1 First generation .................................................................................................. 20
1.1.2 Second generation: ............................................................................................ 22
1.1.3 Third generation ................................................................................................. 25
1.1.4 Fourth generation............................................................................................... 28
1.2 Development of outcome prediction models ........................................................... 33
1.2.1 Patient population of interest ............................................................................ 33
1.2.2 Dependent variable (outcome variable) ............................................................ 34
1.2.3 Independent variables (risk predictors) ............................................................. 34
1.2.4 Data collection .................................................................................................... 35
1.2.5 The predictive model .......................................................................................... 35
1.2.6 Assessing the fit of the model ............................................................................ 38
2 Considerations about the existing severity models .......................................................... 41
2.1 Quality of data collection ........................................................................................... 41
2.2 External validation of the SAPS 3 admission score .................................................... 49
3 How to improve severity models? Seeking for new variables .......................................... 57
3.1 From GCS to FOUR ..................................................................................................... 59
3.2 The cystatin C ............................................................................................................. 63
3.3 The troponin T and the pro-BNP ............................................................................... 71
4 About the use of severity scores ....................................................................................... 79
4.1 Individual patient outcome prediction ...................................................................... 79
4.2 Evaluation of ICU performance ................................................................................. 80
4.3 Outcome models and resource use ........................................................................... 82
4.4 Risk adjustment in therapeutic trials ......................................................................... 84

2
5 Ethical issues related to the use of severity of illness models ......................................... 87
6 Conclusion and perspectives ............................................................................................ 93
References ................................................................................................................................ 97
7 Appendix I – scientific papers ......................................................................................... 105
7.1 Impact of operator expertise on collection of the APACHE II score and on the
derived risk of death and standardized mortality ratio. Ledoux D, Finfer S, McKinley S.
Anaesthesia and Intensive Care (2005) 33(5): 585-90. ...................................................... 107
7.2 SAPS 3 admission score: an external validation in a general intensive care
population. Ledoux D, Canivet J-L, Preiser J-C, Lefrancq J, Damas P. Intensive Care Medicine
(2008) 34(10): 1873-7. ........................................................................................................ 115
7.3 Quantifying consciousness. Laureys S, Piret S, Ledoux D. Lancet Neurology
(2005)4(12): 789-90. ........................................................................................................... 129
7.4 Cystatin C blood level as a risk factor for death after heart surgery. Ledoux D,
Monchi M, Chapelle J-P, Damas P. European Heart Journal (2007)28(15): 1848-53. ....... 133
7.5 End-of-life practices in European intensive care units: the Ethicus Study. Sprung C,
Cohen S, Sjokvist P, Baras M, Bulow H, Hovilehto S, Ledoux D, Lippert A, Maia P, Phelan D,
Schobersberger W, Wennberg E, Woodcock T. Journal of the American Medical
Association (2003). 290(6): 790-7 ...................................................................................... 141
7.6 Relieving suffering or intentionally hastening death: where do you draw the line?
Sprung C, Ledoux D, Bulow H, Lippert A, Wennberg E, Baras M, Ricou B, Sjokvist P, Wallis
C, Maia P, Thijs L, Solsona Duran J. Critical Care Medicine (2008). 36(1): 8-13. ................ 151
7.7 Reasons, considerations, difficulties and documentation of end-of-life decisions in
European intensive care units: the ETHICUS Study. Sprung C, Woodcock T, Sjokvist P, Ricou
B, Bulow H, Lippert A, Maia P, Cohen S, Baras M, Hovilehto S, Ledoux D, Phelan D,
Wennberg E, Schobersberger W. Intensive Care Medicine (2008) 34(2): 271-7............... 159
8 Appendix II – Contribution to other scientific articles. ................................................... 169
3
Abbreviations
APACHE acute physiology and chronic health evaluation
APS acute physiology score
AUROC area under receiver operating characteristic curve
BMI body mass index
BNP B-type natriuetic peptide
CABG coronary artery bypass graft
CI confidence interval
COMPLEX surgery other than coronary artery bypass graft
COPD chronic obstructive pulmonary disease
CRP C-reactive protein
EuroSCORE European system for cardiac operative risk evaluation
FOUR full outline of unresponsiveness
GCS Glasgow coma scale
GFR glomerular filtration rate
GLS Glasgow Liège scale
GNP gross national product
HR hazard ratio
IABP intra-aortic balloon counter-pulsation
ICNARC intensive care national audit & research centre
ICU intensive care unit
IQR inter quartile range
LIS locked-in syndrome
LVEF left ventricular ejection fraction
MCS minimally conscious state
MDRD modification of diet in renal disease
MPM mortality prediction model
NYHA New York heart association
OR odds ratio
QOL quality of life
ROC receiver operating characteristic
SAPS simplified acute physiology score
SMR standardized mortality ratio
SRU standardized resource use
TISS Therapeutic Intervention Scoring System
TNT troponin T

4

5
Remerciements
Avant toute chose, je pense aujourd’hui aux patients et à leurs familles qui ont le courage
d’accepter de participer à nos recherches alors qu’ils traversent des épreuves difficiles et
angoissantes. J’ai une pensée particulière pour ces femmes et ces hommes qui ne survivent
pas à ces épreuves, je garde pour toujours en mémoire nombre de leurs visages.
Ma vie professionnelle ne serait rien sans Maurice Lamy et Pierre Damas. Je les associe car,
si j’ai la chance d’exercer ce métier, c’est à eux que je le dois. Je n’oublie pas Jean-Luc
Canivet et le jour où il me glissa dans les mains ce projet d’étude de René Chang et son Riyad
Intensive Care Program.
Je dois également beaucoup aux collaborations ayant donné jours aux publications
mentionnées dans cette thèse: Simon, Sharon, Pierre, Jean-Luc, Mehran, Jean-Charles,
Joëlle, Steven, Charles et l’Ethicus study group, travailler avec vous m’a apporté davantage
que des enrichissements scientifiques.
Ceux qui connaissent Steven Laureys savent combien son enthousiasme est communicatif. Je
lui suis très reconnaissant pour le soutien qu’il m’a apporté dans la réalisation de ce travail.
Les encouragements constants et les précieux conseils qu’il m’a prodigués au cours des
derniers mois sont certainement des éléments qui m’ont aidé à mener à bien ce projet.
Je tiens également à témoigner ma gratitude à Philippe Lambert, le promoteur de mon
mémoire de Master en Statistique et aux enseignants de l’Institut de Statistique de
l’Université Catholique de Louvain. Par la qualité de leur enseignement ils m’ont aidé à
acquérir des connaissances précieuses dans ma pratique de la recherche clinique.
Je souhaite aussi remercier les membres du jury, Adelin Albert (président), Jean-François
Brichant (secrétaire), Jean-Roger Le Gall, Johan Decruyenaere, Maurice Lamy, Pierre Damas,
Jacques Rigo et Steven Laureys pour le temps qu’ils consacreront à la lecture de cette thèse
et pour les pistes de recherches ultérieures que leurs questions ne manqueront pas de
susciter.
Je n’aurais pas pu faire ces travaux de recherche clinique sans l’étroite collaboration de
toute l’équipe de Soins Intensifs Généraux du CHU de Liège: médecins, infirmiers, stagiaires,
psychologue, kinésithérapeutes, … J’ai beaucoup de reconnaissance pour ces différents
acteurs de terrain. Les citer tous ici me serait impossible, qu’ils sachent que je n’ignore pas
que sans eux nous ne pourrions mener à bien notre mission.
Je suis très reconnaissant également envers les différents collaborateurs de recherche qui
nous ont permis générer nos bases de données. Je pense en particulier à Catherine
Henrioulle et à Joëlle Lefrancq dont je me sens l’obligé.
Enfin je ne peux clôturer ces remerciements sans avoir une pensée pour celle et ceux qui me
sont chers et qui ont supporté, avec effort parfois mais indulgence aussi d’avoir un papa
souvent absent. A leur manière ils m’ont apporté leur soutien au cours de ce travail.

6

7
Summary
In this work we approached various aspects of generic outcome models study for intensive
care adult patients. After a review of the main generic models developed during these last
30 years, we discuss some methodological fundamentals of outcome prediction model
development. The objective of these theoretical and methodological descriptions is to help
the reader in his comprehension of what severity of illness models are and how they are
developed. We did not intend here to present an exhaustive review of the existing models;
we do not either have the ambition to offer to the reader a method allowing him to develop
its own severity model.
In a first research paper, we studied the problem of severity of illness data collection. This
issue may appear trivial; however adequate data collection is a necessary prerequisite to the
accurate score calculation that will guarantee the best performances possible of these
indices. In this study where we surveyed three groups of data collectors: untrained junior
clinical staff, trained research coordinator and senior clinical staff with an extensive
experience in collecting the APACHE II score (Ledoux, Finfer et al. 2005). We evaluated the
impact of the expertise on collection of the APACHE II score and on the derived risk of death.
We could show that, for most of the APACHE II score variables, the lower rate of agreement
was found between the inexperienced group versus the others groups. Interestingly, if the
discrimination of the APACHE II score was not affected, the calibration proved to be bad for
predictions established from the data collected by the junior clinical staff. It resulted that the
ratio between observed mortality and mortality predicted by the score APACHE II
(Standardized Mortality Ratio - SMR) tended to be higher, leading to a falsely pejorative the
evaluation of the ICU. These results bring us, like other authors (Goldhill and Sumner 1998;
Polderman, Jorna et al. 2001), to stress the importance of accurate severity score data
gathering and to recommend that ICUs provide with sufficient resources to train and employ
dedicated data collectors.
Another problem encountered with severity of illness indices is that their performance is not
stable over time. Various authors, indeed, showed that severity of illness indices and their
risk of death models see their performance deteriorating with time (Rowan, Kerr et al. 1993;
Apolone, Bertolini et al. 1996; Moreno, Miranda et al. 1998). Two characteristics may explain

8
the deterioration of performance: changes in the intensive care population and the
evolution of available therapeutics. Actually, when one uses APACHE II score to compute a
death prediction for a group of patients admitted to the intensive care in 2009, the returned
prognosis refers to the ICU population and treatments of the years 1979-1982. Yet, the
intensive care population clearly changed over these last 30 years; Hariharan et al. showed,
for instance, that the proportion of octogenarians doubled in the last 10 years (6% in 1996,
12.5% in 2008) and that ICU stay of patients admitted after elective surgery lengthened
(Hariharan and Paddle 2009).
Given these observations, new models were developed. Among these models, the SAPS 3
admission score is certainly most interesting (Metnitz, Moreno et al. 2005; Moreno, Metnitz
et al. 2005). Among recent models, it is indeed the only one that was developed from a vast
international patients’ sample in a large number of countries distributed on three continents
(Europe, America and Oceania); thus allowing for model customization according to
geographical areas. However, even if this severity score appears promising, external
validation studies in independent patients’ samples are still scarce. We present here a study
which is, to our knowledge, the first to validate SAPS 3 score in a independent general
intensive care population and to show SAPS 3 admission score superiority as compared to
the APACHE II score (Ledoux, Canivet et al. 2008). In this study, that included more than 800
patients, we observed that SAPS 3 admission score customized for Western Europe had
better performance (better discrimination and calibration) than APACHE II score. One can
deplore that, to date, few clinical studies – therapeutic trials in particular – refer to the SAPS
3 model. The APACHE II score remains indeed – except in France – leading model in spite of
the fact that even Knaus, the APACHE II original developer, advised that researchers should
discontinue the use of APACHE II for outcome assessment (Knaus 2005).
We then turned to the possible ways of generic indices improvements. We started from the
observation that explanatory power of the acute physiology model component tended to
decrease in the more recent models. As a matter of fact, it was shown in the APACHE III
score (Knaus, Wagner et al. 1991), that 73% of explanatory power was due to physiology
variables (Ridley 1998); whereas this rate falls to less than 30% in SAPS 3 admission score
(Moreno, Metnitz et al. 2005). The reduction in the contribution of physiological

9
disturbances to SAPS 3 model explanatory power may partly be explained by the input of
patient’s preadmission characteristics. One cannot exclude however that physiology
variables used in the current prediction models lack of discrimination. We therefore
explored other physiology variables than those commonly used in outcome models. We
considered three organ systems: brain, heart and kidneys. In severity models, cerebral
function is generally evaluated using the Glasgow Coma Scale (GCS). However this scale
presents several flaws: it does not assess brainstem function, it is theoretically not applicable
to intubated patients, and finally it lacks discrimination to identify conditions such as
minimally conscious state (MCS) or locked-in syndrome (LIS). We describe here the Full
Outline of UnResponsiveness (FOUR) (Wijdicks, Bamlet et al. 2005) which could
advantageously replace the Glasgow coma scale in future model developments. The renal
function is a well-known risk factor for morbidity and mortality (Anderson, O'Brien et al.
1999; Franga, Kratz et al. 2000; Penta de Peppo, Nardi et al. 2002). In the outcome models,
renal dysfunction is often evaluated by serum creatinine. However several authors showed
that serum creatinine is not a good marker of glomerular filtration rate (Perrone, Madias et
al. 1992; Herget-Rosenthal, Marggraf et al. 2004). Cystatin C could be a better marker than
creatinine to estimate ICU patients’ risk of death. We therefore conducted in patients
admitted to the ICU after open heart surgery. In this work, we showed that the glomerular
filtration rate (GFR) estimated using serum cystatin C was a better risk marker for 1-year
mortality than the GFR estimated by serum creatinine (Ledoux, Monchi et al. 2007). Hence,
the use of cystatin C in outcome prediction models could prove to be interesting. In the
severity of illness indices, the circulatory function markers are limited to blood pressure and
heart rate. In an unpublished study (Ledoux 2008) including more than 500 patients
admitted in intensive care after open cardiac surgery, we showed that a prediction model for
1-year mortality based on objective variables such as the age, troponin T, pro-BNP and CRP
levels had at least equivalent performance as compared to the EuroSCORE. Although we
focused on an ICU patients’ subgroup, it seems reasonable to think that introducing
variables indicating the degree of cardiac ischemia such as troponin T or the degree of
ventricular dysfunction such as pro-BNP could be valuable for in future model
developments.

10
Developing severity indices is not a self-sufficient objective. The outcome prediction models
are instruments whose purpose is to help the clinician in improving quality of cares. These
models can play a role at various levels of the medical practice. Although they are not
designed for, outcome prediction models can help in individual prediction. They indeed bring
objective information on patient’s condition that may strengthen clinical perception and
hence make the physician more confident in his decision. The patient also takes advantage
of this objectivity. However when they are used for individual risk assessment, outcome
prediction models must interpreted taking into account the whole patient clinical picture. A
more common use of the severity scores is the ICU performance evaluation; these
instruments allow comparing observed and predicted mortality, to compute the SMR and
hence to check the ICU efficacy and to make benchmarking. However ICU evaluation using
the SMR presents limitations. To be used in this application, it is important that the severity
models are correctly calibrated; a poor calibration may indeed lead to false conclusions.
Moreover, hospital mortality may be influenced by factors that are not related to ICU
efficacy such as: hospitals discharge practices, the availability of step down structure like
nursing home or palliative care institutions, or patients and families priorities. Finally, if
hospital outcome is an important endpoint, there are other endpoints like long-term survival
and quality of life which may be more meaningful and more relevant for the patient and his
relatives.
The study of the outcome prediction models inevitably leads to ethical considerations,
especially ethical issues related to ICU end-of-life decisions. The Ethicus study demonstrated
that end-of-life decisions are routine in the ICU. Life support therapy was limited in 3 out
every 4 patients who died in the ICU (Sprung, Cohen et al. 2003). The outcome prognostic
models information could help physicians in their decision-making process. Previous studies
demonstrated that end-of-life decisions were difficult in up to 72% of discussions (Sharma
2004); using severity models may help reducing physicians’ burdens related with end-of-life
decisions. Outcome models may also be more equitable for patients since they do not
incorporate value-based judgments. Nonetheless there are several factors that limit the use
of severity score in end-of-life decision; the main being clinicians resistance.

11
In this work, we showed that in spite of their limitations, the generic outcome indices are
likely to contribute to quality of care improvement. Several countries set up national
projects aiming to ICU evaluation (ICNARC ; de Keizer, Bonsel et al. 2000; Villers, Fulgencio et
al. 2006). We think that it would be useful to launch a similar program in Belgium allowing
for ICU benchmarking across the country. It is however important to keep in mind that the
goal of such a project should not be to classify ICUs but rather to create a base of knowledge
in order to make it possible for each ICU to progress. Thinking this way, it seems important
to us that such a project is led by the actors of health under the support of their scientific
society.

12

13
Résumé
Dans ce travail nous avons abordé différents aspects de l’étude des modèles d’évaluation de
la gravité des patients admis en soins intensifs. Après une revue des principaux scores
génériques qui ont été développés au cours de ces 30 dernières années, nous abordons les
éléments méthodologiques nécessaires au développement d’indices d’évaluation de la
gravité. L’objectif de cette description théorique et méthodologique est de permettre au
lecteur de comprendre ce que sont les modèles d’évaluation de la gravité et comment ils
sont développés. Nous ne prétendons cependant pas présenter ici une revue absolument
exhaustive des modèles existants; nous n’avons pas non plus pour ambition d’offrir au
lecteur une méthode lui permettant de développer ses propres indices de gravité.
Dans une première étude, nous avons étudié le problème de la collecte des données
nécessaire au calcul des indices de gravité (Ledoux, Finfer et al. 2005). Si cette question peut
paraître triviale ; elle n’en est pas moins critique; en effet, recueillir adéquatement les
données nécessaires au calcul des scores de gravité conditionne les performances de ces
indices. Nous avons suivi trois groupes de collecteurs de données : des cliniciens juniors non
entraînés, des coordinateurs de recherche entraînés et des cliniciens seniors ayant une
expertise dans la collecte des données du score APACHE II. Nous avons évalué l’impact de
l’expertise dans la collecte des données sur la précision du score APACHE. Nous avons pu
montrer que, pour la plupart des variables du score APACHE II, le taux d’accord plus faible
entre le groupe non entraîné et les autres groupes que pour ces derniers entre eux. De
manière intéressante, il ressortait que, si le pouvoir de discrimination du score APACHE II ne
s’en trouvait pas affecté, la calibration s’avérait mauvaise pour les prédictions établies à
partir des données collectées par le groupe non entraîné. Il en découlait en outre que le
rapport entre la mortalité observée et la mortalité prédite par le score APACHE II
(Standardized Mortality Ratio – SMR) tendait à être plus élevé rendant l’évaluation de l’USI
erronément péjorative. Ces résultats nous amènent, comme d’autres auteurs (Goldhill and
Sumner 1998; Polderman, Jorna et al. 2001), à souligner l’importance d’un recueil précis des
données nécessaires au calcul des indices de gravité et à encourager le recours à des
collaborateurs entrainés à la collecte de données sous peine d’aboutir une interprétation

14
erronée des indices de gravité, notamment en ce qui concerne la performance des unités de
soins intensifs.
Un autre problème qui se pose avec les indices de gravité réside dans l’instabilité de leurs
performances dans le temps. Deux caractéristiques semblent pouvoir expliquer l’altération
des performances : les modifications de la population des soins intensifs et l’évolution des
thérapeutiques disponibles. Divers auteurs ont, en effet, montré que les indices d’évaluation
de la gravité et de pronostic de décès voient leurs performances s’altérer avec le temps
(Rowan, Kerr et al. 1993; Apolone, Bertolini et al. 1996; Moreno, Miranda et al. 1998).
Calculer une prédiction de décès, pour un groupe de patients hospitalisés en soins intensifs
en 2009, au moyen du score APACHE II revient en effet de considérer que ce groupe est issu
d’une population équivalente à celle des patients hospitalisés aux soins intensifs entre 1979
et 1982 et qu’il bénéficie de soins semblables à ceux de cette époque. Or la population des
soins intensifs à nettement changé au cours de ces 30 dernières années ; Hariharan et al. ont
notamment montré qu’en 10 ans la proportion d’octogénaires a doublé (6% en 1996, 12 .5%
en 2008) et que les durées de séjours des patients admis après chirurgie programmée se
sont allongées (Hariharan and Paddle 2009).
C’est dans ce contexte que logiquement de nouveaux modèles ont été développés. Parmi
ceux-ci le score SAPS 3 est certainement le plus intéressant (Metnitz, Moreno et al. 2005;
Moreno, Metnitz et al. 2005). C’est en effet le seul parmi les modèles récents qui ait été
conçu à partir d’un échantillon de patients issus d’un grand nombre de pays répartis sur trois
continents (Europe, Amérique et Océanie) autorisant ainsi l’adaptation du modèle en
fonction de zones géographiques. Cependant, même si cet indice semble très intéressant, les
études de validation dans des échantillons de patients indépendants sont encore rares. Nous
présentons ici une étude qui est probablement la première à valider le score SAPS 3 dans
une population indépendante de soins intensifs généraux et à en démontrer la supériorité
par rapport au score APACHE II (Ledoux, Canivet et al. 2008). Dans cette étude, menée sur
un échantillon de plus de 800 patients, nous avons observé que le score SAPS 3 adapté à
l’Europe de l’ouest présentait de meilleures performances (meilleures discrimination et
calibration) que le score APACHE II. On peut dès lors déplorer qu’à ce jour peu d’études
cliniques, notamment les essais thérapeutiques, y fassent référence comme indice

15
d’évaluation de la gravité. En effet, le score APACHE II reste – hormis en France - quasi
indélogeable en dépit du fait qu’il est, de l’aveu même de Knaus, son concepteur,
résolument dépassé en tant que modèle pronostic (Knaus 2005).
Notre réflexion s’est ensuite tournée vers de futures améliorations possibles des indices de
gravité. Nous sommes partis du constat que la quotepart des variables physiologiques dans
la prédiction de décès tendait à diminuer dans les modèles plus récents. Ainsi dans le score
APACHE III (Knaus, Wagner et al. 1991), 73% du pouvoir pronostic était dû aux variables
physiologiques (Ridley 1998); alors que ce taux tombe à moins de 30% dans le score SAPS 3
(Moreno, Metnitz et al. 2005). Si la diminution de la contribution des perturbations
physiologiques dans le pronostic peut s’expliquer en partie par l’apport d’informations
relatives à la situation clinique préalable des patients, on ne peut exclure l’hypothèse selon
laquelle les variables physiologiques utilisées dans les modèles de prédiction manquent de
pouvoir de discrimination. Aussi avons-nous voulu explorer d’autres variables physiologiques
que celles communément utilisée dans les scores de gravité. Notre réflexion s’est portée sur
trois organes: le cerveau, le cœur et les reins. Dans les indices de gravité, la fonction
cérébrale est le plus souvent évaluée au moyen de l’échelle de coma de Glasgow (Glasgow
Coma Scale – GCS). Cependant cette échelle présente certaines faiblesses : elle n’évalue pas
la fonction du tronc cérébral, elle n’est théoriquement pas applicable aux patients intubés,
enfin elle manque de finesse pour identifier des états tels l’état de conscience minimal ou
encore le locked-in syndrome. Nous présentons ici l’échelle full outline of unresponsiveness
(FOUR) (Wijdicks 2006) qui pourrait avantageusement remplacer l’échelle de Glasgow. La
fonction rénale est un facteur de risque de morbidité et de mortalité bien connu (Anderson,
O'Brien et al. 1999; Franga, Kratz et al. 2000; Penta de Peppo, Nardi et al. 2002). Dans les
indices de gravité, la dysfonction rénale est souvent évaluée au moyen de la créatinine
sérique; cependant divers auteurs ont montré que celle-ci n’est pas un bon marqueur de la
filtration glomérulaire (Perrone, Madias et al. 1992; Herget-Rosenthal, Marggraf et al. 2004).
La cystatin C pourrait être un indicateur supérieur à la créatinine dans l’estimation du risque
vital aux soins intensifs. Dans une étude menée chez des patients admis en soins intensifs
après chirurgie cardiaque, nous avons montré que le taux de filtration glomérulaire
(Glomerular Filtration Rate – GFR) estimé au moyen de la cystatine C sérique était un
meilleur marqueur du risque de décès à un an après chirurgie cardiaque que la GFR estimée

16
par la créatinine sérique (Ledoux, Monchi et al. 2007). L’utilisation de la cystatine C dans les
modèles d’évaluation de la gravité pourrait dès lors s’avérer intéressante. Dans les scores de
gravité, les indicateurs de la fonction circulatoire se limitent à la tension artérielle et à la
fréquence cardiaque. Dans une étude non publiée (Ledoux 2008) portant sur plus de 500
patients admis en soins intensifs après chirurgie cardiaque, nous avons montré qu’un
modèle de prédiction de la mortalité à 1 an basé uniquement sur des variables objectives
telles que l’âge, le taux de troponine T, de pro-BNP et de CRP présentait des performances
équivalentes, voire supérieures, à l’EuroSCORE. Bien que notre étude portait sur un sous-
groupe de patients de soins intensifs, il semble raisonnable de penser que l’introduction de
variables indiquant le degré d’ischémie myocardique telle que la troponine T ou de la
dysfonction ventriculaire telle que la pro-BNP pourrait s’avérer appréciable dans des
développements futurs.
Développer des indices de gravité n’est pas un objectif qui se suffit à lui seul. Les scores de
gravité sont des instruments qui ont pour but d’aider le clinicien à améliorer la qualité des
soins dépensés. Ainsi ces scores peuvent intervenir à différents niveaux de la pratique
médicale. Bien qu’à la base ils ne soient pas conçus à cet effet, les indices pronostiques
peuvent être un complément utile à l’évaluation du pronostic individuel en apportant un
éclairage objectif sur une situation clinique donnée. Néanmoins, lorsqu’ils sont utilisés dans
ce contexte, les indices pronostiques doivent être intégrés à la situation clinique globale.
Une utilisation plus courante des scores de gravité est l’évaluation des performances des
unités de soins intensifs ; ces instruments permettent en effet de comparer la mortalité
observée à la mortalité prédite par le modèle, de calculer le SMR et ainsi de vérifier
l’efficacité d’une unité de soins intensifs voire de faire du benchmarking. Toutefois
l’évaluation des unités de soins intensifs au moyen du seul SMR présente des limitations.
Pour être utilisable dans cette application, il est important que les scores de gravité soient
correctement calibrés. En outre, la mortalité hospitalière peut être influencée par les
pratiques de transfert des hôpitaux, l’existence d’alternative comme les maisons de repos et
de soins et les institutions de soins palliatifs ou encore par les préférences des patients et de
leurs familles. Enfin si diminuer la mortalité hospitalière est un objectif important, il en est

17
d’autres tels que la survie à long terme et surtout la qualité de vie qui ont davantage de
signification et d’implication pour les patients et leurs proches.
L’étude des scores de gravité conduit inévitablement à des réflexions d’ordre éthique en
rapport notamment avec les décisions de fin de vie prises aux soins intensifs. L’étude Ethicus
a montré que la plupart des patients (76%) qui décèdent aux soins intensifs ont, au
préalable, fait l’objet d’une limitation des traitements prodigués (Sprung, Cohen et al. 2003).
L’utilisation des scores de gravité pourrait être une aide lors de ces prises de décisions qui
souvent ébranlent le clinicien (Sharma 2004). Cependant plusieurs freins limitent l’usage
d’outil de prédiction, le principal étant la réticence des cliniciens à en tenir compte.
Nous avons montré dans ce travail que bien qu’ils présentent des limitations, les indices de
gravité génériques sont susceptibles d’aider à l’amélioration de la qualité des soins.
Différents pays ont mis en place des projets visant l’évaluation à l’échelle nationale des
performances des unités de soins intensifs (ICNARC ; de Keizer, Bonsel et al. 2000; Villers,
Fulgencio et al. 2006). Nous pensons qu’il serait utile de lancer, en Belgique, un programme
similaire dont l’ambition serait de permettre du benchmarking entre les unités de soins
intensifs du pays. Il est cependant important de garder à l’esprit que l’objectif d’une telle
démarche ne vise pas le classement des unités mais bien de créer une base de connaissance
permettant à chaque unité de soins intensifs progresser. Dans cet ordre d’idée, il nous
semble fondamental qu’un tel projet soit conduit par les acteurs de la santé sous l’égide de
leur société scientifique.

18

19
1 Introduction
The purpose of intensive care medicine can be summarized in the following way. On the one
hand, to save the life of patients whose acute affection causes organs failures bringing into
play the immediate survival prognostic but which are reversible, or at least can be improved
so that quality of life would be as close as possible to that existing before and satisfy the
patient. On the other hand, when recover cannot be achieved and death become
unavoidable, the intensive care physician duty is to allow the patients whose fatal outcome
is inescapable to die peacefully and with dignity.
In this context, correctly identifying between these two groups of patients appears to be of a
great interest, not only to allow a rational use of medical and economic resources, but also
from a moral perspective since, thanks to the adequate risk estimation, patients, theirs
relatives and physicians may benefit from this evaluation to take sensible decisions.
Prognostic assessment using severity of illness scales allows a precise and objective
description of ICU patients’ risk. These scales or severity scores can be disease specific or
generic. They are based on clinical and biological features associated with the outcome.
Several severity of illness systems were developed over these last thirty years; their main
purpose being to compare patients with similar severity of illness in order to assess the
efficacy of the provided cares.
In this work, we will mainly focus on the generic severity of illness scores. We justify this
choice by the fact that the severity scores proved to be powerful in the characterization of a
large number of clinical entities met in the intensive care and, furthermore, they allow a
global approach of ICU patients’ severity of illness.

20
1.1 An overview of existing generic outcome models for adult ICU patients
In this section, we do not pretend to propose an exhaustive description of all intensive care
outcome models but rather to illustrate the evolution of outcome research in the field of
critical care with the most important ones (Figure 1). From the analysis of the literature we
can distinguish four generations of generic outcome models. This distinction between
generations is not only chronological, but also based on the progressive simplification
(reduction of the number of included variables by removing those which do not improve the
precision of the model) and on the evolution from an empirical design to an increasingly
sophisticated mathematical modelling.
Figure 1. Timeline representing the major severity of illness model described over the last 30 years.
1.1.1 First generation
The scores TISS and APACHE constitute this first generation of the generic severity scores.
Their principal interest was their innovative nature: they were the first severity of illness
systems allowing the assessment of intensive care patients’ severity using objective data.
Their principal limitations were of a practical nature - they were very heavy to use because
of the large number of variables needed - and methodological since there was no model
checking during their development to verify that the variable of interest (hospital death) was
adequately predicted. In addition, these severity systems were not very sophisticated from a
statistical point of view and in particular for the probability of death estimation. If the TISS
will be largely used as workload index, besides the first version APACHE score will only be
MPMTeres
CCM 1987
APACHE IIIKnaus
Chest 1991
APACHE IIKnaus
CCM 1985
GCSTeasdale
Lancet 1974
SAPS IILe Gall
JAMA 1993
EuroScoreNashef
Eur J Card-Thor Surg 1999
SOFAVincent
ICM 1996
1974 2004
MPM IILemeshowJAMA 1993
SAPSLe Gall
CCM 1984
MPM IIIHiggins
Chest 2005
APACHE IKnaus
CCM 1981
SASP 3Moreno
ICM 2005
APACHE IVZimmermanCCM 2006
LODLe Gall
JAMA 1996
TISSCullen
CCM 1974

21
the topic few publications, its authors regarding it as being a “prototype” (Wagner, Knaus et
al. 1983; Wagner, Draper et al. 1984).
Therapeutic Intervention Scoring System (TISS – 1974)
The first generic ICU severity of illness system described in the literature is the Therapeutic
Intervention Scoring System (TISS) published more than thirty years ago by Cullen et al.
(Cullen, Civetta et al. 1974). The TISS was based on 76 items describing medical and nursing
activity. These items were chosen and weighted according to the clinical judgment of a panel
of experts in critical care medicine. Although TISS was originally designed to assess severity
of illness, its use as severity score was rapidly abandoned and, from the early eighties, its
main use was for the quantification of the nursing workload and the calculation of nursing
staff requirements (Dick, Pehl et al. 1992; Malstam and Lind 1992). However calculating the
TISS was time consuming precluding its regular use in most intensive care units. In 1996,
Miranda et al. proposed a simplified version, the TISS-28 (Miranda, de Rijk et al. 1996) which
was shown as good as TISS-76 for the assessment of nursing workload (Moreno and Morais
1997).
Acute Physiological and Chronic Health Evaluation (APACHE – 1981)
In 1981, Knaus et al. published the first version of the Acute Physiological and Chronic Health
Evaluation (APACHE) (Knaus, Zimmerman et al. 1981). The APACHE score was designed to
stratify patients according to their risk of in-hospital death. In this evaluation system, the 34
physiological variables were selected by a college of experts in intensive care medicine.
These experts assigned a value from 0 to 4 (weight) to the variables according to their
degree of derangement from normal. The scoring values of physiological variables were the
most deranged in the first 32 hours of ICU admission. The sum of the variables weights gave
or score termed Acute Physiology Score (APS). A premorbid health status category (A – D)
was then assigned based on a simple questionnaire. The APACHE score was tested on 805
successive ICU admissions from two general ICUs in the United States (data collection
between April and November 1979). Patients with acute myocardial infarction, burns and
those with an ICU stay shorter than 16 hours were excluded from analysis. The acute
physiological score combined with premorbid health status, age, sex, primarily organ failure
and operative status allowed to calculate the number of patients expected to die in hospital.

22
Applied to their test case mix and setting the probability at a cut off point of 0.5, the model
demonstrated a good sensitivity (0.97) but a poor specificity (0.49). The methodology of this
model was criticised. First, because unmeasured variables were considered to be within
normal range and second, because the large number of variables entered into the model
could cause over fitting.
1.1.2 Second generation:
In this second generation, three scoring systems are represented: the Simplified Acute
Physiological Score (SAPS) published by Le Gall et al. in 1984 (Le Gall, Loirat et al. 1984), the
Acute Physiological and Chronic Health Evaluation II (APACHE II) published by Knaus et al. in
1985 (Knaus, Draper et al. 1985) and the Mortality Prediction Model (MPM) described by
Lemeshow et al. in 1988 (Teres, Brown et al. 1982; Lemeshow, Teres et al. 1985; Lemeshow,
Teres et al. 1988). The SAPS and the APACHE II score were directly derived from the original
APACHE score through a reduction of the number of variables entering into the model.
Compared to the later score, the MPM introduced original statistical features using logistic
regression techniques for the variables selection and weighting rather than panel of experts.
Simplified Acute Physiological Score (SAPS – 1984)
The SAPS score (Le Gall, Loirat et al. 1984) was designed to overcome the problems
encountered with the APACHE model. The number of variables was reduced to 13 keeping
the same weighing as in the APACHE model. In addition to physiological variables, age was
attributed a weight from 0 to 4 and the respiratory rate item was replaced by a weight of 3
for patients who were on mechanical ventilation or on continuous positive airway pressure
(CPAP). The observation period was reduced to 24 hour after ICU admission. The authors
tested the SAPS model on 679 consecutive patients from 8 French ICUs and concluded that
this simplified model performed at least as well as the APACHE score. The SAPS score
became quite popular in France and to a less extent in Europe.
Acute Physiological and Chronic Health Evaluation II (APACHE II – 1985)
To build the APACHE II score (Knaus, Draper et al. 1985), Knaus et al. used multivariable
analysis techniques to reduce the number of variables included in the APS component of the
APACHE model. The variables selection was made on a database of 5030 patients from 13

23
ICUs in the United States during a 4 years recruitment period (from 1979 to 1982). Twelve of
the 34 initial variables were selected for the APS component of the APACHE II. The APS
variables were attributed a weight from 0 to 4, except the Glasgow Coma Score (GCS)
(Teasdale and Jennett 1974) whose weight was 15 minus the GCS. The APS was calculated
from the most deranged value in the first 24 hours of ICU stay. To the acute physiological
score (APS) was added a score from 0 to 6 for age and a chronic health score was attributed
to patients suffering from at least one of the following severe chronic health derangement (2
or 5 according to the admission status: medical, emergent surgery, scheduled surgery):
chronic heart failure, chronic respiratory failure, chronic renal failure, chronic liver failure
and immune-depression. The APACHE II score is then the sum of the acute physiological, age
and chronic health scores. The APACHE II score could be combined with a list of 50 weighted
admission diagnoses in a logistic regression model to provide a hospital mortality
probability. The APACHE II model performed well on the developmental database, as
demonstrated by its good discriminative power judged by an area under the receiver
operating characteristic curve (AUROC) of 0.863. However, a number of studies revealed
that when tested on an external database, the APACHE II model had poor calibration – i.e. a
lack of agreement between predicted and observed mortality rates in mortality risk strata
(Rowan, Kerr et al. 1993; Apolone, Bertolini et al. 1996; Moreno and Morais 1997; Moreno
and Reis Miranda 1998; Metnitz, Valentin et al. 1999).
The APACHE II score is the most widely used ICU outcome model; it was cited in more than
5000 publications [Search "Acute Physiology and Chronic Health Evaluation" OR "APACHE"
NOT "APACHE III" NOT "APACHE IV" NOT "Indians" Limits: Publication Date from 1985/01/01
to 2008/12/31 = 5088 citations] (Figure 2). More than 20 years after its original publication,
its use is still largely predominant in clinical research with more than 500 citations during the
year 2008 [Search "Acute Physiology and Chronic Health Evaluation" OR "APACHE" NOT
"APACHE III" NOT "APACHE IV" NOT "Indians" Limits: Publication Date from 2008/01/01 to
2008/12/31 = 507 citations]. Most clinical studies in particular those from pharmaceutical
companies still use the APACHE II score even though its author, Knaus WA recommends to
discontinue its use as an outcome prediction model (Knaus 2005).

24
Figure 2. Annual number of publications making reference to the APACHE II score (MEDLINE search performed in February 2009).
Mortality Prediction Model (MPM – 1985/1988)
The Mortality Prediction Model (Lemeshow, Teres et al. 1985; Lemeshow, Teres et al. 1988)
takes a special position in the outcome model history. Its authors, biostatistician and
epidemiologists, introduced for the first time sophisticated statistical methodologies. They
collected a large number of historical, demographic and physiological variables (up to 377)
on 2644 consecutive ICU admission from a single US ICU between 1983 and 1985. Data were
collected on admission, after 24 and 48 hour if patients were still in ICU. Excluded patients
were coronary artery disease, cardiac surgery, burns and patients under 14 years of age. As
for the previously described models, hospital outcome was chosen as the outcome variable.
The authors developed four models: the MPM0 (probability of death from data collected on
admission), MPM24 (probability of death from data collected at 24 hours), MPM48
(probability of death from data collected at 48 hours) and MPMOT (probability overtime,
based on change in probability between MPM0, MPM24 and MPM48). All models had a good
calibration. However, if in these model specificity was also very good they presented a low
sensitivity, like the APACHE, APACHE II and SAPS scores.
0
100
200
300
400
500
600
1985 1990 1995 2000 2005
Nu
mb
er o
f p
aper
ref
erin
g to
th
e A
PAC
HE
II s
core
Year

25
1.1.3 Third generation
There are three models in this generation: the APACHE III score (Knaus, Wagner et al. 1991),
the SAPS II score (Le Gall, Lemeshow et al. 1993) and the MPM II score (Lemeshow, Teres et
al. 1993). These severity scoring systems offered considerable improvement as compared to
the previously described generations: they were all based on large multicentre case mixes,
data selection relied on statistical methodology, each score provided with statistical model
for hospital mortality prediction, reliability of data collection was checked and, finally, these
models were tested on a validation sample.
Acute Physiological and Chronic Health Evaluation III (APACHE III – 1991)
The APACHE III score was launched in 1991 by Knaus et al. (Knaus, Wagner et al. 1991).
To build their new score’s version, these authors used a large case mix of 17440 patients
from 42 ICUs admitted in 40 US hospitals from 1988 to 1990. To guarantee that selected
units were representative of US ICUs, the hospitals were selected via a randomisation
process to avoid geographical and hospital size bias. Each ICU cohort was fixed to
approximately 400 consecutive ICU admissions. The number of included patients per units
was therefore similar. Patients whose ICU stay was shorter than 4 hours, burns, patients
younger than 16 years of age and patient admitted for coronary care were excluded. Data
from patients admitted after coronary artery bypass surgery were collected in an
independent data file and analysed separately (Becker, Zimmerman et al. 1995). Special
efforts were made to optimise the quality of data collection: in addition to a complete
documentation, data collectors of selected centres had a 3-day training course at
George Washington University Medical Center (Washington DC). In each centre, the 20 first
patients were reviewed for accuracy and if accuracy or completeness were inadequate data
collector received additional training. Finally, data were entered into computers using a
dedicated software with internal checking algorithm to increase data collection accuracy.
Twenty candidate physiological variables were chosen based on previous experience in
severity assessment and on clinical judgment; among these variables, 17 were selected using
logistic regression methods. To estimate the weight for the variables, authors used a
multivariable logistic regression analyses. Similarly weights were estimated for preadmission
co-morbidities and age. In addition to physiology data, patients had to be assigned to one of

26
the 78 predefined major disease categories within the 24 hours of ICU admission. Finally, the
location before the ICU admission was recorded. In the APACHE III model, the hospital
mortality predictive equation uses the APACHE III score, major diseases categories and
information on treatment location immediately prior to ICU admission. Not surprisingly, the
discriminative power of the APACHE III equation on the developmental dataset were very
good with an area under the ROC curve of 0.9; however the authors give no information
about the calibration of the model. Several independent validation studies conducted in
different countries confirmed the good discrimination power of the APACHE III, yet they all
concluded to a poor calibration (Bastos, Sun et al. 1996; Beck, Taylor et al. 1997; Rivera-
Fernandez, Vazquez-Mata et al. 1998; Zimmerman, Wagner et al. 1998). The APACHE III
equation is proprietary and was available under licence from APACHE Medical Systems
(APACHE Medical Systems Inc, McLean, VA) before it was bought in by Cerner Corporation
(Cerner Corporation, VA) and marketed as Cerner APACHE III.
Simplified Acute Physiological Score II (SAPS II – 1993)
In 1993, Le Gall et al. published the SAPS II (Le Gall, Lemeshow et al. 1993). It was the first
refined version of the original SAPS released 10 years earlier. The score was developed from
a large international database: 12997 patients from 137 hospitals in 10 European and 2
North American countries were included in the project. Data were collected over a five-
month period (September 30, 1991 to February 28, 1992). The score developmental dataset
consisted in 8369 randomly selected patients, the remaining 4628 patients constituted the
validation sample. Patients younger than 18 years of age, burned patients, coronary care
patients and cardiac surgery patients were excluded from the study. Data were entered into
a specifically designed software with built-in out-of-range and logical-error checking. For
each centre, a 5% random sample of included patients was re-abstracted for interrater
quality control. The variables were weighted using locally weighted least squares smoothing
(LOWESS) function and multivariable logistic regression analysis. Among the 37 collected
variables, 17 were selected using bivariate analyses: 12 physiological variables, age, type of
admission (scheduled surgical, unscheduled surgical, or medical), acquired
immunodeficiency syndrome, metastatic cancer and hematologic malignancy. From SAPS II
score, the authors developed a prediction model for hospital mortality using the logistic

27
regression method. The SAPS II prediction model had a very good discriminative power both
on the developmental (AUROC = 0.88) and validation (AUROC = 0.86) datasets. In contrast
with the APACHE III equation, the authors assessed the calibration of their model and found
that SAPS II calibrated well on their developmental (Hosmer-Lemeshow goodness-of-fit test,
p = 0.883) and validation (Hosmer-Lemeshow goodness-of-fit test, p = 0.104) groups. A
number of independent validation studies were published on the SAPS II score; and most
found that the SAPS II model calibration was poor on the independent case mix (Apolone,
Bertolini et al. 1996; Moreno and Morais 1997; Metnitz, Valentin et al. 1999; Livingston,
MacKirdy et al. 2000).
Mortality Prediction Model II (MPM II – 1993)
In 1993, Lemeshow et al. published their MPM II system (Lemeshow, Teres et al. 1993), a
revision of the initial Mortality Prediction Model published in 1988. To develop their model,
the authors merged two datasets: data of the first dataset were collected in 6 adult mixed
medical-surgical ICUs from the North-eastern United States (n=3127); data of the second
dataset were collected in the same ICUs as for the SAPS II score (137 ICUs in 12 European
countries and North America). As for the SAPS II study, patient eligible for enrolment were
older than 18 years of age with the exception of burns patients, coronary care and cardiac
surgery patients. The quality of data collection was checked by re-collecting 5% of the
enrolled patients. As for the SAPS II survey the data were computerized, in each ICU using,
specially written program with built-in checks for out-of-range values and logical errors. Data
were collected (n=19124 patients) over 4 period of time during the years 1989-1992, they
were randomly assigned to the developmental (n= 12610 patients, 65%) or the validation
sample (n=6514 patients, 35%). Bivariate analyses were used to select variables elligible for
entry into a multiple logistic regression model. The MPM II system proposed two hospital
mortality prediction models: the MPM0-II and the MPM24-II. The MPM0-II contained 15
variables: 3 physiologicy variables, 3 chronic diseases, 5 acute diagnoses, age,
cardiopulmonary resuscitation prior ICU admission, mechanical ventilation and medical or
non-elective surgery. The MPM24-II was determined from 5 variables gathered on ICU
admission (age, cirrhosis, intracranial mass effect, metastatic neoplasm and medical or non-
elective surgery) plus another 8 variables collected at 24 hours (5 physiology variables,

28
confirmed infection, mechanical ventilation and intravenous vasoactive drugs). Both MPM0-II
and MPM24-II had a good discriminative power and were well calibrated either on the
developmental (AUROC = 0.837 and 0.844, Hosmer-Lemeshow goodness-of-fit test: p= 0.623
and 0.764 respectively for the MPM0-II and MPM24-II) or the validation sample (AUROC =
0.824 and 0.836, Hosmer-Lemeshow goodness-of-fit test: p= 0.327 and 0.231 respectively
for the MPM0-II and MPM24-II). The authors emphasised the fact that, at the time of its
publication, MPM0-II was the only model giving a outcome prediction from ICU admission
data and considered the MPM24-II as a companion model to the MPM0-II. In 1994,
Lemeshow et al. published two further indices, the MPM48-II and the MPM72-II (Lemeshow,
Klar et al. 1994) based on 6,290 patients from 6 US ICUs. These latter models contained the
same 13 variables and coefficients as the MPM24-II and differed only in their constant terms,
which increased in a manner that reflected the increasing probability of mortality with
increasing length of stay in the ICU. Literature on independent validation of the MPM II
system is scarce (Moreno, Miranda et al. 1998; Nouira, Belghith et al. 1998), however
available publication allow drawing the same conclusion as for to previously described
generic outcome models: when applied to an external dataset, the discriminative power of
the MPM II is good but the model suffered from a lack of calibration.
1.1.4 Fourth generation
The fourth generation of outcome prediction models is made of the currently more recent
and most sophisticated severity of illness assessment tools which are chronologically: the
SAPS 3 admission model (Moreno, Metnitz et al. 2005), the APACHE IV (Zimmerman, Kramer
et al. 2006). An update of the MPM0-II, the MPM0-III was also recently published by Higgins
et al. (Higgins, Teres et al. 2007) . The models of this generation are based on larger case mix
and build using more sophisticated statistical methods than the previous generations.
Simplified Acute Physiological Score 3 (SAPS 3 – 2005)
The recently published SAPS 3 admission score (Moreno, Metnitz et al. 2005) is a model
build to predict hospital mortality from admission data (recorded within ± 1 hour). This
model is based on a large cohort of patients (16784 patients) consecutively admitted to 303
intensive care units from 35 countries around the world. The model includes 20 variables
and is the arithmetic sum of 3 sub scores (boxes) describing the patients’ characteristics

29
before ICU admission (box I, 5 variables), the circumstances of ICU admission (box II, 5
variables) and the degree of physiological derangement at the time of ICU admission ± 1
hour (box III, 10 variables). From this admission score are derived not only a global equation
for hospital mortality prediction based on the whole case mix, but also equations customized
for different geographic regions (Australasia, Central and South America, Central and
Western Europe; Eastern Europe; North Europe, Southern Europe and Mediterranean
countries, North America). Beside the use of a worldwide database, the SAPS 3 model brings
several improvements as compared to the APACHE II and SAPS II models. First, the statistical
methodology used for the model development controlled for patients’ clustering within ICUs
taking into account the possible existence of risks’ factors at the ICU level. Second, since the
model is based on admission data, it allows not only evaluation of patients’ outcome but
also the assessment of ICU practices effectiveness. Third the regional equation allow for a
better comparison of ICUs from the same geographic area. Finally the SAPS 3 model also
demonstrated good performances for major patient typologies (trauma, non-operative
admission, emergency surgery, community and hospital acquired infections) and not only on
a mixed pathologies samples. Although the SAPS 3 admission model is a promising and
elegant tool, there is a need for its external validation to verify its performances on an
independent population sample.
Acute Physiological and Chronic Health Evaluation IV (APACHE IV – 2006)
The fourth version of the Acute Physiological and Chronic Health Evaluation score was
published in 2006 by Zimmerman et al. (Zimmerman, Kramer et al. 2006). The authors based
their new APACHE IV model, on 110558 patients admitted consecutively during the years
2002-2003 to 104 ICUs in the 45 US hospitals. These 104 units were selected because they
installed the APACHE III system. Patients admitted for less than 4 hours, patients younger
than 16 years of age, patients with burns and patients admitted after transplant operation
(excepted renal and liver transplant) or after a coronary artery bypass graft operation
(CABG) were excluded from analysis. Patients staying in hospital for more than 1 year and
those who were admitted from another ICU during the same hospitalisation were also
excluded. The outcome variables were hospital stay and hospital mortality. As for the
previous versions, the APACHE IV is based on the worst value recorded over the first 24

30
hours in the ICU. The model variables were similar to those in the APACHE III but new
variables were added. The APACHE IV mortality equation was estimated using a random
sample that comprised 60% of the patients (n = 66270); the other 40 % were used for the
model validation (n = 44288). Contrary to the previous version, the calibration of the
APACHE IV model was assessed. The APACHE IV performed very well on the validation model
as shown by an excellent discriminative power (AUROC = 0.88) and a good calibration
(Hosmer-Lemeshow goodness-of-fit test = 16.8, p = 0.08). Like the APACHE III, the new
APACHE IV is commercialised by Cerner Corporation (Cerner Corporation, VA) which
represents, together with the single country nature of the model, a serious limitation for a
worldwide use.
Expended SAPS II (2005)
The expended SAPS II score is not a completely innovative. However expended SAPS II is
more than a simple model customisation since it adds new meaningful variables. This model
was developed from a retrospective analysis of a large French database. The aim of the
authors was to propose a model that would adequately estimate the standardised mortality
ratio (SMR) for French ICUs in order to allow appropriate benchmarking (Le Gall, Neumann
et al. 2005). From January 1998 to December 1999, data were obtained for 107652 patients
from 106 ICUs, of these records 77490 (72%) were valid for further analysis and split in a
training set (50%) and a validation set (50%). In their analysis, the authors added several
variables to the original SAPS II: age, gender, length hospital stay before ICU admission,
patient location before ICU admission, a clinical category and whether there was a drug
overdose on ICU admission. The expended SAPS II had a good calibration and discrimination
both in the development and validation datasets. The SMR magnitude was reduced when
the expended SAPS II was used as compared to the original SAPS II. Although this recent
amendment of the original SAPS II may appear attractive, the authors acknowledged some
limitations: the model was designed based on data whose quality may be criticized (lack of
completeness, and data inaccuracy). Because it was build from a single country database and
in the absence of external validation study, the use of the expanded SAPS II will probably be
limited to France.

31
Mortality Prediction Model III admission model (MPM0-III – 2007)
To propose an update of the Mortality Prediction Model II at the ICU admission (MPM0-II),
Higgins et al. (Higgins, Teres et al. 2007) retrospectively analysed data from 124855 patients
consecutively admitted to 135 ICUs at 98 hospitals who participated to the Project IMPACT
between 2001 and 2004. All hospitals but 4 were in the United States; three were Canadian
and one was Brazilian. The Project IMPACT was set up in the early 1990’s by the Society of
Critical Care Medicine (SCCM) which recognised the necessity for ICUs to measure patients
cares and outcomes and to compare the results with their peers. It is now traded by Cerner
Corporation (Cerner Corporation, VA), the SCCM remains however 50 % shareholder in the
Project IMPACT, Inc (PICCM). ICUs that joined the Project IMPACT may submit either data
from all ICU admissions or from a random sample of at least 50% of all ICU admissions.
Records for patients who did not meet MPM0-II applicability criteria (i.e., cardiac surgery,
acute myocardial infarction, burns, patients under the age of 18, and subsequent ICU
readmission during a hospitalization) were excluded from analysis. The sample was
randomly split into development (60%, n = 74578 patients) and a validation (40%, n= 50307
patients) subsets. The variables considered for model building were the 15 MPM0-II
variables, the time before ICU admission and the code status at the admission (a full-code
status being defined as no restriction on therapies or interventions at the time of ICU
admission). The authors found that only one additional variable, the code status, had to be
added to those from the MPM0-II model. Applying the new model to the validation data set,
the authors found that both the discrimination and calibration power were good as shown
by the area under the ROC curve of 0.823 and the Hosmer-Lemeshow statistic of 11.62 (p =
0.31). Like the SAPS 3 admission model, the MPM0-III has the advantage of being computed
within 1 hour of ICU admission. The MPM0-III comprised 16 variables which are the MPM0-II
variables plus two new variables: the “full-code” resuscitation status at the ICU admission
and a “zero factor”, corresponding to the absence of any risk factor from the MPM0-II except
age. The equation is published, although with a lack of clarity, in the original article and a
calculator is available for risk computing at the Cerner Corporation web site
(http://www.cerner.com/public/Cerner_3.asp?id=27087).

32
Among the severity assessment models we overviewed, the SAPS 3 admission score appears
to be the most attractive in particular for non US ICUs. Several reasons support this view:
- This model is based on a large worldwide case mix, which is not the case for other
recently developed severity of illness models like the APACHE IV, the expended
SAPS II or the MPM0-III.
- For a better calibration, the authors of the SAPS 3 score proposes customized
mortality prediction models for several geographical areas, allowing
benchmarking.
- The SAPS 3 model does not require specifying a diagnosis or reason for ICU
admission, alleviating the risk of inter-observer variation since choosing a single
diagnosis or reason for ICU is often difficult.
- The model provides a mortality prediction from admission data (like MPM II & III).
This allows the mortality prediction to be done before ICU interventions take
place.
- Unlike the other recent generic outcome models, the SAPS 3 also apply to
patients admitted after cardiac surgery or acute myocardial infarction.

33
1.2 Development of outcome prediction models
In the ICU setting, outcome prediction models estimate the probability for the outcome to
occur in a given patient treated in a hypothetical reference ICU. The later being an “average”
of those ICU used for model building. For model development, several aspects have to be
considered: the patient population, the outcome variable, the risk factors, the data
collection and the model construction process itself. In this section we will discuss these
different issues related with model building.
1.2.1 Patient population of interest
One interesting characteristics of generic outcome models is that they propose to create
homogeneous patients’ categories from an inhomogeneous patients’ case mix. Generic
outcome model try to avoid patient selection bias by including consecutive admission to the
ICU in the development database. However one cannot exclude that some specific patient
diagnoses have more weight than other and hence influence the outcome prediction. In
addition, generic models exclude some subgroups from analysis. In all generic adult outcome
models, patients younger than 16 years of age are excluded from analysis (Knaus,
Zimmerman et al. 1981; Knaus, Wagner et al. 1991; Le Gall, Lemeshow et al. 1993;
Lemeshow, Klar et al. 1994; Knaus 2005; Moreno, Metnitz et al. 2005; Zimmerman, Kramer
et al. 2006). Post coronary artery bypass graft (CABG) and patient admitted for coronary care
were only included in the SAPS 3 admission model. All the described severity score but the
SAPS 3 excludes burned patients in their model. However, in this later model the number of
burns patient is very low (n=38; 0.23% of the patients’ case mix) and hence the prediction
adequacy in this category of patient is uncertain.
In general, prediction models should be used only if the population of interest is similar to
the reference population used to develop them. If this is not the case then the accuracy
should be validated in the intended population prior to its clinical or research application. If
model’s predictive accuracy is found to be inadequate, one should consider to customization
in order to obtain a satisfactory model fitting.

34
1.2.2 Dependent variable (outcome variable)
Almost all the ICU severity models use hospital mortality as the outcome variable. This
variable has several advantages: it is an objective variable; it can be easily obtained for every
patient; being binary, this end point variable is easily used in prognosis statistical models;
short term mortality outcome can provide a reliable endpoint to assess ICU efficiency.
However other outcomes of interest could be investigated. Endpoints such as long-term
survival and quality of life after ICU are probably more relevant outcomes than hospital
mortality. Although quality of life is less easily obtained and more difficult to quantify, it
should be more studied in the future. This could be performed using tools like the EuroQOL
(The EuroQOL Group 1990) or the Short Form 36 (Jenkinson, Coulter et al. 1993).
1.2.3 Independent variables (risk predictors)
The development of a predictive instrument requires the identification of relevant
epidemiologic, clinical and laboratory observations, called predictor variables (or, in the
context of regression analysis, covariates). In the intensive care, a large number of patients’
data are generated: past medical history, vital signs, laboratory values, specific therapies,
results from diagnostic procedures. Predictors for severity of illness models should be
available at the very early phase of ICU stay. In the literature, one can find three different
approaches for risk factors selection. The first approach is subjective method; it was mainly
employed in the older generation of severity models and consisted in a selection of variables
considered as being clinically meaningful to predict the outcome (Knaus, Zimmerman et al.
1981; Le Gall, Loirat et al. 1983; Knaus, Draper et al. 1985). The second approach is based on
statistical techniques to reduce the initial variables list (Lemeshow, Teres et al. 1987). A third
approach is to combine statistical techniques and clinical judgment to select the
independent variables of interest (Metnitz, Moreno et al. 2005). Regardless which selection
method is used, the predictors should be objective and easy to obtain. Variables that require
interpretation – such as the diagnosis of infection - should be defined very clearly to avoid
misinterpretation and hence bias in the model.

35
1.2.4 Data collection
The outcome prediction models require valid and reliable data. Basically one could consider
modelling the severity of illness either from prospective or retrospective data. However
prospective data collection should be preferred. This approach maximises the data accuracy
and completeness: it allows the use of adequate methods for data collection such as the use
of dedicated software with build in error checking system and the collection highest and
lowest values for each continuous physiological variables. In addition prospective data
collection permits an ongoing analysis for data accuracy and hence minimizes the risk of
errors and missing data that would alter the quality of the derived model.
Severity assessment systems development was based on manual data collection. Nowadays,
an increasing number of intensive care units take advantage of clinical information systems
that computed severity score. However if some authors have shown that reliability of data
obtained from clinical information systems was satisfactory (Ward, Snyder et al. 2004)
others observed that these systems affected severity models accuracy (Bosman, Oudemans
van Straaten et al. 1998; Suistomaa, Kari et al. 2000).
1.2.5 The predictive model
1.2.5.1 The logistic model
The goal of any model building technique used in statistics is to find the best fitting and most
parsimonious model to describe the relationship between an outcome variable (dependent
variable or response) and a set of independent variables (independent variables, covariates
or predictors). The most common example of modelling is the usual linear regression model
where the outcome variable is assumed to be continuous. The problem with severity
prediction models is that they usually use a binary data, the survival status, as the outcome
variable. Logistic regression technique allows developing equation relating this kind of
outcome to specific predictors.
What distinguishes the logistic regression model from the linear regression model is the fact
that, in logistic regression model, the dependent variable is dichotomous. Once this
difference is accounted for, methods employed in analysis using logistic regression follow

36
the same general principles as in linear regression. There are however some important
differences between logistic and linear regression: the nature of the relationship between
the outcome variables and covariates is different, the conditional distribution of the
outcome variable does not follow the same distribution and the model fitting cannot be
based on least squares method.
Nature of the relationship between the outcome variable and covariates
In any regression problem, the key quantity is the mean value of the outcome variable given
the value of the independent variable. This quantity is called the conditional mean and is
expressed as 𝐸 𝑌|𝑥 where 𝑌 denotes the outcome variable and 𝑥 denotes a value of the
independent variable. In linear regression this mean may be expressed as an equation linear
in 𝑥 :
𝐸 𝑌|𝑥 = 𝛽0 + 𝛽𝑥𝑥
This implies that 𝐸 𝑌|𝑥 may take any value as 𝑥 ranges between -∞ and +∞. However, with
dichotomous outcome variable, the conditional mean – 𝐸 𝑌|𝑥 – must be greater than or
equal to zero and less than or equal to 1. The change in 𝐸 𝑌|𝑥 per unit of change in 𝑥
becomes progressively smaller as the conditional mean becomes closer to zero or 1. This S-
shaped curve is adequately modelised using the logistic distribution (Figure 3). The logistic
regression has the advantage to provide clinically meaningful interpretation.
The logistic regression model may be written as follow:
𝐸 𝑌|𝑥 = 𝜋 𝑥 =𝑒𝛽0+𝛽1𝑥1+𝛽2𝑥2+⋯+𝛽𝑝𝑥𝑝
1 + 𝑒𝛽0+𝛽1𝑥1+𝛽2𝑥2+⋯+𝛽𝑝𝑥𝑝
A transformation that is central to the severity of illness model study is the logit
transformation. This transformation is defined in terms of 𝜋 𝑥 as:
𝑔 𝑥 = 𝑙𝑛 𝜋(𝑥)
1 − 𝜋(𝑥) = 𝛽0+𝛽1𝑥1 + 𝛽2𝑥2 + ⋯ + 𝛽𝑝𝑥𝑝
This transformation has many desirable properties: the logit 𝑔 𝑥 is linear in its parameters,
it may be continuous and it may range from -∞ to +∞ depending on the range of 𝑥.

37
Figure 3. Plot of the observed mortality with the SAPS II score (dots). The dots denotes the actual mortality while the line curve represents predicted mortality obtained using the SAPS II logistic model – 12955 patients admitted from 1997 to 2006 – General Intensive Care Department – Liege University Hospital (unpublished data).
Conditional distribution of the outcome variable.
The conditional distribution of the outcome variable is the second important difference
between the logistic and the linear models.
In the linear regression, an outcome observation may be expressed as 𝑦 = 𝐸 𝑌|𝑥 + 𝜀 ;
where the error 𝜀 expresses the observation’s deviation from the conditional mean. There is
an assumption on this error: it is supposed to follow a normal distribution with a mean of
zero and some variance that is constant across the independent variable levels. It follows
that the conditional distribution of the dependent variable given 𝑥 will be normal with mean
𝐸 𝑌|𝑥 and a variance that is constant.
The situation is quite different in the logistic model, 𝑦 = 𝑥 + 𝜀. In this case, the error
term follows a binomial distribution. The error is 𝜀 = 1 − 𝑥 with probability 𝑥 when
𝑦 = 1 and 𝜀 = − 𝑥 with probability 1 − 𝑥 when 𝑦 = 0. Consequently the error 𝜀 has a
distribution with mean zero and a variance equal to 𝑥 1 − 𝑥 . Hence, the conditional
distribution of the independent variable follows a binomial distribution with probability
given by the conditional mean, 𝑥 .
0.0
0.2
0.4
0.6
0.8
1.0
0.0
0.2
0.4
0.6
0.8
1.0
0 20 40 60 80 100
pred
icte
d m
orta
lity
ob
served
mo
rta
lity
rate
SAPS II score
Observed death rate SAPS II logistic model

38
Fitting the logistic regression model
In linear regression, the method used for estimating unknown parameters i is generally the
least squares method. That method selects the values of i that minimize the sum of squared
deviations of the observed dependent variable from the predicted values based upon the
model. Under the assumptions for the linear model method, the least square estimator is
unbiased and has the minimum variance (best linear unbiased estimator). This is
unfortunately not true with logistic regression for which a more general method for the
parameters estimation – the maximum likelihood – as to be applied. In a very general sense,
the maximum likelihood method produces values for the unknown parameters i which
maximize the probability of obtaining the observed data. The resulting maximum likelihood
estimators are consequently those which agree most closely with the observed data.
1.2.6 Assessing the fit of the model
Once the model is build, it is important to verify that it performs adequately the task it has
been build for. Model performance should be assessed using measures of discrimination and
calibration.
Model discrimination
Definition: the ability to discriminate between those who will likely die and those who will
survive. To be highly discriminant, the model must consistently predict higher probabilities
of death among those who actually die than among those who survive.
Significance: discrimination is more important for models that are used to inform individual
patient’s decisions – we are interested in predicting whether a particular patient is likely to
die.
The area under the receiver operating characteristic (ROC) curve provides a description of
classification accuracy. ROC curve originates from the radio signal detection research where
it was used to show how the receiver operates the detection of signal in the presence of
noise. This curve is the plot of the probability of detecting a true signal (sensitivity), death for
instance and false signal (1 – specificity) for an entire range of possible cutpoints. The area
under the ROC curve (AUROC) provides a measure of the model capability to discriminate

39
between those subjects who will experience the outcome of interest and those who will not.
If the area under the ROC curve is 0.5, this suggest that the model has no discrimination –
i.e. model prediction is equivalent to the toss of a coin. The discrimination is generally
interpreted as fellow:
If AUROC = 0.5: no discrimination
If 0.7 AUROC < 0.8: acceptable discrimination
If 0.8 AUROC < 0.9: excellent discrimination
If AUROC 0.9: outstanding discrimination
Model calibration
Definition: the ability of a model to predict results that are “calibrated” with real life
situation. To be well calibrated, the proportion of patients predicted to die by the model
should be very closed to the actual proportion observed to die.
Significance: calibration is more important for hospital performance assessment (e.g., in risk
adjusted hospital profiling) – we are not interested in predicting which particular patient
dies, but just what proportion of all patients “should” have died.
In the literature, the most commonly used test to assess calibration is the Hosmer-
Lemeshow goodness-of-fit test (Ĉ). The Hosmer-Lemeshow statistic evaluates the degree of
correspondence between estimated probability of death and observed patients mortality
rate across risk strata by creating 10 groups of subjects ordered according to their predicted
mortality. The 10 ordered groups may be created based on estimated probabilities strata
(Ĥ statistic) or according to deciles of patients ordered according their probability of death
(Ĉ statistic). The latter method is generally preferred since the strata are of similar sample
size. The test statistic is a chi-square statistic with a desirable outcome of non-significance,
indicating that the model prediction does not significantly differ from the observed
mortality.

40
External validation
Internal validation refers to the performance in patients from a similar population as where
the sample originated from. Although there are several internal validation methods
available, the performance of a predictive model is overoptimistic when simply determined
on the subjects’ sample that was used to construct the model. A validation based on a
dataset independent from the developmental database is a more appropriate approach to
assess model performance. This process is called external validation.

41
2 Considerations about the existing severity models
2.1 Quality of data collection
From: Impact of operator expertise on collection of the APACHE II score and on the derived risk of death and standardized mortality ratio. Ledoux D, Finfer S, McKinley S Anaesthesia and Intensive Care (2005) 33(5): 585-90.
The improvement of severity of illness models is a fundamental step towards the
improvement of intensive care assessment. However if the intrinsic quality of the severity
score covariables is an essential feature, severity models can be accurately exploited only if
these data are collected with a maximum of precision, following rigorously the criteria
established during the development of the models.
Although a number of studies have examined the usefulness or validity of the APACHE II
score in various settings (Rowan, Kerr et al. 1993; Goldhill and Withington 1996; Beck, Taylor
et al. 1997; Goldhill and Sumner 1998; Katsaragakis, Papadimitropoulos et al. 2000;
Livingston, MacKirdy et al. 2000; Markgraf, Deutschinoff et al. 2000; Beck, Smith et al. 2003),
assessment of data collection quality is frequently missing in such studies. Only a few papers
have considered the impact of interobserver correlation on the reliability of scoring systems.
Holt et al. reported that although interobserver variability had minimal impact on predicted
mortality among a large population of patients the impact on individual prediction was
significant (Holt, Bury et al. 1992). More recent studies have drawn opposing conclusions.
Goldhill et al. concluded that the potential differences in severity scores due to data
collection are sufficient to alter considerably the average predicted mortality and mortality
ratio (Goldhill and Sumner 1998). Polderman et al. also observed a wide variability of
APACHE II score in individuals when APACHE II variables were recorded by junior clinical staff
or senior clinical staff (Polderman, Thijs et al. 1999). In a study where all data collectors
attended a 1-day training session, Chen et al. found no significant effect of variability in data
collection from different hospitals (Chen, Martin et al. 1999). Polderman et al. found that

42
following a training guideline could markedly decrease interobserver variability in APACHE II
scoring (Polderman, Jorna et al. 2001).
Collectively these studies suggest that training in data collection plays a significant role in the
accuracy of derived severity of illness scores and that it merits considerable attention.
However, data collection may sometimes be given a low priority and delegated to more
junior members of the medical team.
We conducted a study that intended to assess the impact of data collection expertise on the
accuracy of data collected to derive the APACHE II score and to evaluate the influence that
data variability may have on APACHE II scoring and on derived prediction of mortality.
The study was conducted in the intensive care unit at the Royal North Shore Hospital in
Sydney, Australia. The ICU is a 29-bed level III unit in a metropolitan, tertiary, university-
affiliated hospital. Data were analysed on all consecutive admissions over a seven-month
period. As in the original APACHE II study (Knaus, Draper et al. 1985), patients under 16
years of age, those admitted after cardiac surgery and for the treatment of burns were
excluded from the analysis.
For each patient, two groups of data collectors gathered data. One group was composed by
two registered nurse research coordinators with a previous experience of collecting the
APACHE II score, who received detailed training, and a written procedures manual
documenting how the scores should be collected (research coordinator group). The second
group consisted of 12 ICU residents working an alternating week-on, week-off roster of 12-
hour day and night shifts. These residents, who had no previous experience in collecting the
APACHE II score, were given informal ward-based training on data collection (junior clinical
staff group). Both groups collected data prospectively and independently. Of the scores
included in the study, 20% were randomly selected and rescored retrospectively from the
medical record by two of the authors (DL, SF) (senior clinical staff group). The senior clinical
staff has extensive experience in collecting the APACHE II score with access to the original
data collection instructions from Knaus’ study (Knaus, Draper et al. 1985) and a research
interest in the question being answered. The APACHE II score and its derived risk of death
were calculated for each dataset (research coordinator, junior clinical staff and senior clinical
staff datasets) using the published equation and coefficient (Knaus, Draper et al. 1985). The

43
data to derive APACHE II scores were collected for 465 patients by the junior clinical staff
and research coordinator groups. The senior clinical staff group reabstracted one hundred
patients (21.5%); complete data were available for 83 of these patients (18% of the initial
dataset).
We found that the level of expertise of data collectors had a significant effect on the data
collected to calculate the APACHE II score and this in turn influenced the derived risk of
death and standardised mortality ratio estimates. The junior clinical staff appeared to be less
reliable. Their agreement with research coordinator and senior clinical staff groups was poor
for almost all the variables from the Acute Physiology Score (Table 1).
Table 1. Agreement of physiologic points assigned by the acute physiology score of the Acute Physiologic and Chronic Health Evaluation (APACHE) II score between junior clinical staff, research coordinators and senior clinical staff.
WBC, white blood cells; GCS, Glasgow Coma Scale. From Ledoux D, Finfer S, McKinley S, Anaesthesia and Intensive Care (2005) 33(5): 585-90.
Variables
Junior clinical staff vs.
Research coordinators
Junior clinical staff vs.
Senior clinical staff
Research coordinators vs.
Senior clinical staff
Agreement Rate (%)
Kappa coefficient
Agreement Rate (%)
Kappa coefficient
Agreement Rate (%)
Kappa coefficient
Temperature 71.3 0.51 71.0 0.51 90.2 0.83
Mean Blood Pressure 65.5 0.52 59.8 0.50 87.0 0.78
Heart Rate 67.5 0.55 63.3 0.53 83.3 0.79
Respiratory Rate 58.1 0.35 54.8 0.34 76.4 0.68
Oxygenation 70.0 0.56 66.0 0.48 75.5 0.69
Arterial pH 67.3 0.53 67.4 0.51 71.3 0.64
Sodium 90.6 0.50 89.2 0.46 98.9 0.91
Potassium 78.8 0.41 78.5 0.50 92.3 0.80
Creatinine 81.3 0.52 82.8 0.68 83.5 0.74
Hematocrit 80.7 0.52 77.0 0.56 89.7 0.74
WBC count 77.3 0.59 78.5 0.68 84.3 0.75
GCS 44.4 0.51 75.3 0.57 52.8 0.54
Age 100 1.00 100 1.00 100 1.00
Chronic Health Status 63.8 0.10 80.9 0.30 70.9 0.37
Emergency code 70.1 0.11 61.3 0.23 83.9 0.5
Diagnosis 60.5 69.7 60.9

44
The observed inaccuracy led to a lack of overall agreement between the junior clinical staff
group and other groups for the APACHE II score and its derived risk of death (Table 2).
Table 2. APACHE II score and risks of death calculated from the three data sets
Variables Junior clinical staff Research coordinators Senior clinical staff
APACHE II 13.4 ± 9.2*1 16.8 ± 8.5 17.1 ± 7.7
ROD 14.7 ± 22.4*2 21.6 ± 22.6 20.8 ± 22.4
*1 p < 0.001 for junior clinical staff versus research coordinator and senior clinical staff, *2 p < 0.01 for junior clinical staff versus research coordinator and senior clinical staff. From Ledoux D, Finfer S, McKinley S, Anaesthesia and Intensive Care (2005) 33(5): 585-90.
The poor agreement of the APACHE II score did not alter its discriminating power, which was
good for all groups as shown by an area under the ROC curve above 0.8. However, its
calibration was affected by the quality of data collection; the goodness-of-fit test revealed
poor calibration for risk of death calculated from the junior clinical staff group. The
agreement for disease diagnosis – i.e. chronic health disease, emergency surgery status and
principal diagnostic category – was poor between each pair of groups (Table 3).
Table 3. Assessment of the discrimination power and calibration of the APACHE II score calculated from the three data sets.
Risk of Death Area under ROC curve Goodness-of-fit test
Junior clinical staff 0.85 (0.81-0.89) 0.001
Research coordinators 0.83 (0.78-0.87) 0.26
Senior clinical staff 0.86 (0.76-0.96) 0.41
ROC curve, Receiver operating characteristic curve. From Ledoux D, Finfer S, McKinley S, Anaesthesia and Intensive Care (2005) 33(5): 585-90.
Junior clinical staff and research coordinator completed the data collection prospectively;
the senior clinical staff group reabstracted the data retrospectively. This led to an increased
rate of missing data (83% of the reabstracted patients had complete data). However as our
protocol was designed to review 20% of the patients prospectively included, the senior
clinical staff dataset was large enough to allow suitable statistical analysis.
Comparisons of the APACHE II score variables collected by different observers are scarce in
the literature. The originality of the present study was to assess junior clinical staff and
research coordinator data collectors prospectively in a real life situation as the data

45
collectors were not aware of the interobserver evaluation. To our knowledge only one study
has compared junior clinical staff with senior clinical staff (Polderman, Thijs et al. 1999); in
that study the authors observed that there was a great variability in individual patients,
however interobserver correlation of the APACHE II score variables was not reported. The
good to excellent agreement between research coordinator and senior clinical staff has been
reported in previous studies (Damiano, Bergner et al. 1992; Holt, Bury et al. 1992; Chen,
Martin et al. 1999; Polderman, Jorna et al. 2001) and our results support these findings.
However, in common with other authors we found agreement in scoring the GCS to be poor
regardless of the expertise of the data collectors.
Our results suggest that the APACHE II score and its derived risk of death are materially
affected by the level of expertise of those collecting the data. In our study, the mean
APACHE II score and the mean risk of death were significantly lower when calculated from
the junior clinical staff dataset. Goldhill et al made a similar observation (Goldhill and
Sumner 1998). They found that rescoring APACHE II looking at the strict interpretation of the
APACHE II criteria led to a 1.73 points mean increase in the APACHE II score resulting in a 3%
increase in predicted mortality. In contrast, Chen et al. observed that although there were
significant discrepancies in some of its components, the APACHE II score was not affected
(Chen, Martin et al. 1999). Polderman et al found that once reabstracted the mean APACHE
II score was 3.9 points lower than the original (Polderman, Girbes et al. 2001). The observed
differences in the APACHE II score did not significantly influence the discrimination power of
the APACHE II score as shown by the area under the ROC curve. However, the calibration
was poor when the APACHE II score was calculated from the junior clinical staff dataset and
this affected the reliability of the score for risk stratification. Moreover, the inaccuracy of the
APACHE II score risk of death lead to differences in the standardized mortality ratio (SMR),
which was higher when calculated from the junior clinical staff dataset. The SMR derived
from the APACHE II score has been proposed as a tool for assessing ICU quality of care
(Knaus, Draper et al. 1986; Gunning and Rowan 1999; Le Gall 2000). This has been criticised
by several authors (Boyd and Grounds 1994; Sherck and Shatney 1996; Glance, Osler et al.
2000) and our results support these criticisms. Depending on which dataset is used, the ICU
where the study was conducted could be considered to have either low-performance (SMR

46
from junior clinical staff dataset = 1.22) or high-performance (SMR from research
coordinator dataset = 0.87) (Figure 4).
Figure 4. Standardized Mortality Ratio (SMR ± SD) obtained by the ratio of the
observed mortality and the expected mortality calculated from junior clinical staff, research coordinators and senior clinical staff dataset. From Ledoux D, Finfer S, McKinley S, Anaesthesia and Intensive Care (2005) 33(5): 585-90.
In common with other authors (Chen, Martin et al. 1999) we found that determining a
correct diagnosis on admission and correct chronic health scores is challenging. The reason
might be the poor definition of diagnosis in the APACHE II system but also the lack of clarity
in the patients’ charts.
Like others, we found that the three items with poorer reliability were GCS, chronic health
condition and the primary diagnosis. New scoring systems should focus on improving the
definitions of chronic health conditions and ICU admission diagnoses. In new severity scores
neurological assessment could be better achieved by using the motor component of GCS
instead of the aggregate GCS (Healey, Osler et al. 2003).
In conclusion, our study confirms that the expertise of data collectors influences inter-
observer agreement of APACHE II scoring and illustrates that great caution is required when
using severity scores to compare the performance of ICUs.
0.00
0.50
1.00
1.50
2.00
Junior clinical staf Research coordinators
Senior clinical staff
SM
R
Group
Standard Mortality Ratio obtained from each dataset

47
The use of severity score for risk stratification – in clinical trials for example – requires
proper training of data collectors and appropriate data quality checks. A more recent
development has been the use of the APACHE II score to determine whether individual
patients should from particular therapy. The Food and Drug Administration indeed
recommends the use of the APACHE II score to screen patients who would most probably
benefit from treatment with drotrecogin alfa activated (Food and Drug Administration
2001). However, given the results of our study, the use of the APACHE II score to determine
the prescription of new and expensive therapies in the ICU needs to be approached with
caution. Our study demonstrates that using untrained data collectors to determine the
APACHE II score could deny treatment to a number of patients who would benefit from such
treatments. Our results suggest that the scores used for such purpose should be collected by
staff with training and experience in determining the APACHE II score.
The results of our study demonstrate the importance of strict guidelines and proper training
to ensure that data collection is accurate. Given the importance of collecting such data and
the worldwide drive to improve quality and safety in healthcare, all ICUs should be allocated
appropriate resources to train and employ dedicated data collectors.

48

49
2.2 External validation of the SAPS 3 admission score
From: SAPS 3 admission score: an external validation in a general intensive care population Ledoux D, Canivet J-L, Preiser J-C, Lefrancq J, Damas P Intensive Care Medicine (2008) 34(10): 1873-7.
The first scoring systems dedicated to the assessment of severity of illness of ICU patients
were launched more than 25 years ago (Knaus, Zimmerman et al. 1981; Le Gall, Loirat et al.
1984; Knaus, Draper et al. 1985; Lemeshow, Teres et al. 1985).Among these severity of
illness scoring systems, the second version of the Acute Physiology And Chronic Health
Evaluation score (APACHE II) (Knaus, Draper et al. 1985) became used worldwide while the
use of the first version of the Simplified Acute Physiology Score (SAPS) score (Le Gall, Loirat
et al. 1984) and the Mortality Prediction Model (MPM) (Lemeshow, Teres et al. 1987) were
essentially confined respectively to French and North American ICUs. Although more recent
severity scores versions were developed in the nineties (Knaus, Wagner et al. 1991; Le Gall,
Lemeshow et al. 1993; Lemeshow, Teres et al. 1993) the APACHE II remains, to date, the
most widely used scoring system for ICUs assessment and for clinical trials conducted in the
field of critical care medicine. Nevertheless several studies showed a deterioration of both
APACHE II and SAPS II scores performances, mainly revealed by a lack of agreement between
predicted and observed mortality rates in mortality risk strata (Rowan, Kerr et al. 1993;
Apolone, Bertolini et al. 1996; Moreno and Morais 1997; Moreno, Miranda et al. 1998;
Metnitz, Valentin et al. 1999). That alteration of prognosis performance may be explained by
several factors such as: the case mix changes, the improvement in treatment effectiveness,
the use of new diagnostic methods and the modifications in age related health status. These
changes may have led to an alteration of the relationship between the degree physiology
derangement and mortality which is a key component of severity assessment models. The
recently published SAPS 3 admission score (Moreno, Metnitz et al. 2005) is a model build to
predict hospital mortality from admission data (recorded within ± 1 hour). This model is
based on a large cohort of patients (16784 patients) consecutively admitted to 303 intensive
care units from 35 countries around the world (Metnitz, Moreno et al. 2005). The model
includes 20 variables and is the arithmetic sum of 3 sub scores (boxes) describing the

50
patients’ characteristics before ICU admission (box I, 5 variables), the circumstances of ICU
admission (box II, 5 variables) and the degree of physiologic derangement at the time of ICU
admission ± 1 hour (box III, 10 variables). From this admission score are derived not only a
global equation for hospital mortality prediction based on the whole case mix, but also
equations customised for different geographic regions. Although the SAPS 3 admission
model is a promising and elegant tool, there is a need for its external validation to verify its
performances on an independent population sample.
We therefore conducted a study whose main aim was to assess SAPS 3 admission score in a
patients’ cohort from a mixed medical-surgical ICU located in a Western Europe country. A
secondary end point of the study was to compare the SAPS 3 score performances with those
of the older APACHE II and SAPS II scores.
The study was conducted in a 26-bed general intensive care unit at the Liege University
Hospital, Belgium. Data were analysed on all consecutive admissions over an eight-month
period. For patients admitted more than once to the ICU during their hospital stay, only data
recorded during the first ICU admission were analysed. As for the APACHE II and SAPS 3
scores (Knaus, Draper et al. 1986; Metnitz, Moreno et al. 2005), patients under 16 years of
age were excluded from the analysis. Patients admitted for the treatment of burns were also
excluded from the study, since in our institution these patients are treated in a specific burns
unit. Finally we decided to include patients admitted after heart surgery in the case mix since
those patients are taken into account in the SAPS 3 admission score. In addition, previous
studies showed that performance of the APACHE II and SAPS II is adequate in case mix of
patients admitted to the ICU after heart surgery (Martinez-Alario, Tuesta et al. 1999; Kuhn,
Muller-Werdan et al. 2000; Hekmat, Kroener et al. 2005).
Data were collected prospectively by a research nurse with a previous experience in data
collection for the APACHE II and SAPS II scores. That nurse was trained for SAPS 3 variables
collection and she had access to the variables definitions published in the ESM from the
original SAPS 3 paper (Metnitz, Moreno et al. 2005). The scores and their derived
probabilities of death were calculated using the published equations and coefficients.
During the study period, 865 patients were admitted to the ICU. Forty nine of these patients
(5.7%) were readmitted during the same hospital stay and 14 patients (1.6%) were younger

51
than 16 years of age. Those patients were not included in the study, leaving 802 (92.3%)
patients for analysis. Patient’s characteristics are presented in Table 4.
Table 4. Patient’s demographic characteristics
Patients’ characteristics
Age, years - median (IQR) 66 (53 – 75) Male, n (%) 486 (60.6) No surgery, n (%) 232 (28.9) Scheduled surgery, n (%) 397 (49.5) Unscheduled surgery, n (%) 173 (21.6) Origin
Home 109 (13.6) Same Hospital 551 (68.7) Chronic care facility 1 (0.1) Public place 11 (1.4) Other hospital 130 (16.2)
Co-morbidities Alcoholism 69 (8.6) Arterial hypertension 444 (55.6) Chemotherapy 10 (1.3) Chronic heart failure 355 (44.4) Chronic pulmonary failure 18 (2.3) COPD 127 (15.9) Chronic renal failure 39 (4.9) Cirrhosis 25 (3.1) EV drug addict 6 (0.8) Haematological cancer 17 (2.1) HIV positive 3 (0.4) Immunosupression, other 15 (1.9) Diabetes 191 (23.9) Cancer 69 (8.6) Radiotherapy 7 (0.9) Steroid treatment 13 (1.6)
Ventilated on admission, n (%) 594 (74.1) Length of stay in ICU, days - median (IQR) 3 (2 – 7) Length of stay in hospital, days - median (IQR) 14 (10 – 26) ICU mortality, n (%) 106 (13.2) Hospital mortality, n (%) 140 (17.5)
Definition for co-morbidities can be found in the electronic supplementary material of the original SAPS 3 paper (Moreno, Metnitz et al. 2005). From Ledoux D, Canivet J-L, Preiser J-C, Lefrancq J, Damas P. Intensive Care Medicine (2008) 34(10): 1873-7.

52
Apart from basic and observational admission (n=105/802, 13%), the main reasons for ICU
admission were: cardiovascular, respiratory and neurological. These reasons encountered
for 70% of the ICU admissions. Additional details on patients’ characteristics may be found
in the ESM (Table E2 and E3, ESM). During the study period, the overall hospital mortality
was 140 (17.5 %) patients. The performances of the three models are summarized in Table 5.
The discriminative power, assessed using the area under the ROC curves, was significantly
lower for the APACHE II model (AUROC: 0.823 ± 0.020) as compared with SAPS II (AUROC:
0.850 ± 0.019) and SAPS 3 (AUROC: 0.854 ± 0.019) model (p = 0.037). The Hosmer-
Lesmeshow goodness-of-fit test (Ĉ) revealed a poor calibration for the APACHE II models
(Ĉ =16.38, p = 0.037) and for the SAPS 3 global model (Ĉ =16.59, p = 0.035). On the contrary,
the calibration of SAPS II model (Ĉ =5.78, p = 0.671) and SAPS 3 customized for Central and
Western Europe (Ĉ =8.30, p = 0.405) was appropriate (Figure 5).
Figure 5. Hosmer-Lemeshow Ĉ goodness of fit test; calibration curves for the APACHE II, SAPS II, global SAPS 3 (SAPS 3) and SAPS 3 customized for Central and Western Europe (SAPS 3w) models.
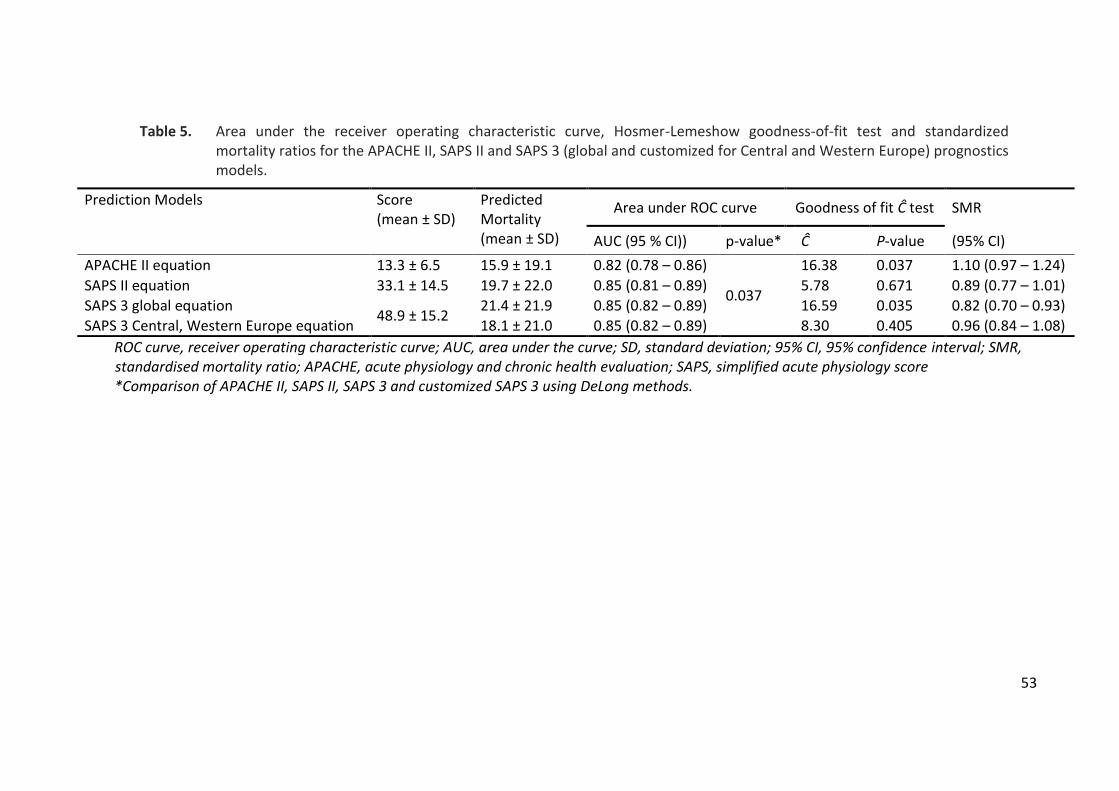
53
Table 5. Area under the receiver operating characteristic curve, Hosmer-Lemeshow goodness-of-fit test and standardized mortality ratios for the APACHE II, SAPS II and SAPS 3 (global and customized for Central and Western Europe) prognostics models.
Prediction Models Score (mean ± SD)
Predicted Mortality (mean ± SD)
Area under ROC curve Goodness of fit Ĉ test SMR
AUC (95 % CI)) p-value* Ĉ P-value (95% CI)
APACHE II equation 13.3 ± 6.5 15.9 ± 19.1 0.82 (0.78 – 0.86)
0.037
16.38 0.037 1.10 (0.97 – 1.24)
SAPS II equation 33.1 ± 14.5 19.7 ± 22.0 0.85 (0.81 – 0.89) 5.78 0.671 0.89 (0.77 – 1.01)
SAPS 3 global equation 48.9 ± 15.2
21.4 ± 21.9 0.85 (0.82 – 0.89) 16.59 0.035 0.82 (0.70 – 0.93)
SAPS 3 Central, Western Europe equation 18.1 ± 21.0 0.85 (0.82 – 0.89) 8.30 0.405 0.96 (0.84 – 1.08)
ROC curve, receiver operating characteristic curve; AUC, area under the curve; SD, standard deviation; 95% CI, 95% confidence interval; SMR, standardised mortality ratio; APACHE, acute physiology and chronic health evaluation; SAPS, simplified acute physiology score *Comparison of APACHE II, SAPS II, SAPS 3 and customized SAPS 3 using DeLong methods.

54
The analysis of the standardised mortality ratios revealed that the best predictive results
were achieved with the SAPS 3 model customized for Central and Western Europe. The
global SAPS 3 model significantly overestimated hospital mortality, the 95% confidence
interval did not indeed contain 1 (SMR = 0.82; 95% CI: 0.70 – 0.93). While APACHE II tended
to underestimate mortality; the SAPS II model, on the contrary, tended to overestimate
mortality (Figure 6).
Figure 6. Standardized mortality ratios (SMR) estimated from APACHE II, SAPS II, global SAPS 3 (SAPS 3) and SAPS 3 customized for Central and Western Europe (SAPS 3w) models.
To the best of our knowledge, this work was the first SAPS 3 external validation study
conducted on a general intensive care population. Both the global model and the model
customised for Central and Western Europe of the SAPS 3 admission score had a very good
discriminative power as shown by an area under the ROC curve very close to the one
published in the original SAPS 3 paper (Moreno, Metnitz et al. 2005). However the fit of the
global SAPS 3 mortality prediction model was inadequate in our patients’ sample from a
Western Europe ICU. The global SAPS 3 model significantly overestimated hospital mortality
in our studied patients’ cohort. These findings are not surprising since, in the original SAPS 3
hospital outcome cohort, Moreno et al. already reported that the SAPS 3 global mortality
0.60
0.70
0.80
0.90
1.00
1.10
1.20
1.30
APACHE II SAPS II SAPS 3 SAPS 3w
SMR

55
prediction model fit was poor for Central and Western Europe ICUs (Moreno, Metnitz et al.
2005). On the contrary, the SAPS 3 model customized for Central and Western Europe region
was adequate. The discriminative power was very good; close to the one published in the
original publication and the calibration was appropriate. Moreover this model produced the
best predictive results as shown by a standardised mortality ratio close to one.
The present study shows that older severity of illness scoring systems performances may not
be satisfactory anymore. In our patients’ case mix, the APACHE II score suffered from both a
lower discriminative power, as compared with the other assessed severity scores, and from a
significant lack of calibration. These findings were previously described by several authors
(Rowan, Kerr et al. 1993; Castella, Artigas et al. 1995; Moreno and Morais 1997; Markgraf,
Deutschinoff et al. 2000; Gupta and Arora 2004). Nevertheless, other authors found
acceptable calibration of the APACHE II score even in recent case mix population sample
(Capuzzo, Valpondi et al. 2000; Ho, Lee et al. 2007). It appears however that the APACHE II
score is nowadays outdated. Interestingly, Knaus, the APACHE II original developer, advised
that researchers should discontinue the use of the APACHE II for outcome assessment
(Knaus 2005).
In our patients’ sample, the SAPS II score performed well, its discriminative power was very
good and its calibration was appropriate. These results are divergent from most published
results. Several authors indeed showed that if the SAPS II model has a good discriminative
power, its calibration is poor when applied to an independent case mix (Moreno and Morais
1997; Metnitz, Valentin et al. 1999; Metnitz, Lang et al. 2000; Le Gall, Neumann et al. 2005).
However, although it seemed to perform adequately in our patients’ sample, we found, like
other authors, that the SAPS II predictive model tended to overestimate the hospital
mortality (Moreno and Morais 1997; Metnitz, Valentin et al. 1999; Capuzzo, Valpondi et al.
2000; Le Gall, Neumann et al. 2005).
In conclusion, in the present study we found that the SAPS 3 admission score was superior to
the APACHE II model. However, in our case mix, it was not significantly better than the SAPS
II score; both having a good discriminative power and calibration.

56

57
3 How to improve severity models? Seeking for new variables
Since the first severity of illness models’ description were developed, outcome research in
critical care made important progress. One of the major advances was the introduction of
sophisticated statistical methods for not only model building and validation but also for
variables selection. These methods allowed selecting the most appropriate variables
available in the datasets. However if during this evolution process main prognostic
determinants of outcome changed, the physiological component remained based on very
classical variables such as the GCS, the blood pressure or the creatinine. The contribution of
acute physiological disturbance in the explanatory power has decreased in recent models:
from 73% in the APACHE III (Ridley 1998), it dropped below 30% in the SAPS 3 admission
model (Moreno, Metnitz et al. 2005). If this decrease may be explained partly by the input of
information relating to patients’ preadmission clinical condition, one cannot exclude that
selected acute physiology variables lack of discrimination. To date generic severity of illness
model research did not explore less conventional physiological variables that could possibly
improve the description of physiological derangements.
In this section, we describe and explore variables that could provide a better description of
three major organs – the brain, the heart and the kidneys – and hence improve severity
model performances. These variables are: the FOUR score, the cystatin C, the troponin T and
the pro-BNP.

58

59
3.1 From GCS to FOUR
From: Quantifying consciousness Laureys S, Piret S, Ledoux D Lancet Neurology (2005)4(12): 789-90.
The Glasgow Coma Scale (GCS) was published by Teasdale and Jennett’s in 1974 (Teasdale
and Jennett 1974). This standardized bedside tool to quantify consciousness became a
medical classic. Despite its indisputable worldwide success it has also been criticised. Several
investigators disagree that scoring eye opening is sufficiently indicative of activity in
brainstem arousal systems and have proposed coma scales that include brainstem reflexes,
such as the comprehensive level of consciousness scale, the clinical neurologic assessment
tool, the Bouzarth coma scale, and the Maryland coma scale (Laureys, Majerus et al. 2002).
However none of these scales have known widespread use because they generally are more
complex than the Glasgow coma scale. A simpler system, the Glasgow Liège scale (Born,
Hans et al. 1982), combined the Glasgow coma scale with five brainstem reflexes but also
failed to convince the medical community outside its country of origin. Another shortcoming
of the Glasgow coma scale is that the increasing use of intubation has rendered its verbal
component immeasurable in many patients in coma. A Swedish team, therefore, developed
the reaction level scale, which does not include a verbal response criterion but combines
different responses into an ordinal eight-graded scale (Laureys, Majerus et al. 2002). Outside
of Sweden, however, the use of this scale remains very limited.
The Glasgow Coma Scale is used as part of several ICU scoring systems, including APACHE II,
SAPS II, and SAPS 3 to assess central nervous system. However, several authors observed
that, when applied to severity assessment model, this scale had a poor reliability. Polderman
et al. indeed observed that points for loss of consciousness were often erroneously
attributed (Polderman, Girbes et al. 2001). Goldhill et al. showed that it is with the Glasgow
Coma Scale that the biggest potential for error arises (Goldhill and Sumner 1998). Chen et al.
found consistency for only 60% of reabstracted GCS (Chen, Martin et al. 1999). Like these
authors, we also found a poor reliability of the GCS (Ledoux, Finfer et al. 2005) with an
agreement between observer being as low as 45%. Among the reasons for this unreliability,

60
one can mention that verbal assessment cause problems in intubated patients. In addition,
Gill et al. showed that even in non intubated patients the verbal component of the GCS had
the lower reliability (Gill, Reiley et al. 2004).
Wijdicks and colleagues (Wijdicks, Bamlet et al. 2005) have proposed a new coma scale: the
full outline of unresponsiveness (FOUR). This acronym reflects the number of components
tested (eye, motor, brainstem, and respiratory functions) and the maximum score assigned
to each of these (E4, M4, B4, and R4) (Table 6). The researchers tested 120 patients in
intensive care and compared FOUR scores made by neurology residents, neurointensivists,
and neuroscience nurses with scores using the Glasgow coma scale. Their scale explicitly
tests for eye movements or blinking on command – requesting to open eyes manually if
closed. This test facilitates the early detection of locked-in syndrome and is very much
welcomed, given that recent studies have shown that medical carers did not recognise signs
of consciousness during the first weeks in more than half of patients with locked-in
syndrome (Laureys, Pellas et al. 2005). Unlike the Glasgow coma scale, FOUR also tests for
eye tracking of a moving object. Most commonly, this is the first sign heralding the transition
from a vegetative to a minimally conscious state (Majerus, Gill-Thwaites et al. 2005). The
rest of the FOUR’s E-score is identical to that of the Glasgow coma scale. Most innovative is
the hand-position test, in which patients are asked to make thumbs-up, fist, or peace signs.
This is a smart alternative to the V-score of the Glasgow coma scale and remains testable in
intubated patients. The rest of the M-score is taken from the Glasgow coma scale, with the
exception that no difference is made between abnormal stereotyped flexion and normal
flexion to pain (similar to the early version of the Glasgow coma scale1). This difference may
be difficult for inexperienced observers to appreciate but might lead to lower prognostic
power of the FOUR scale. Generalised myoclonic status epilepticus, which is a sign of poor
prognosis in anoxic coma, is scored the same as absent motor response to pain.

61
Table 6. The Full Outline UnResponsiveness (FOUR) score (Wijdicks et al., 2005).
E EYE RESPONSE
4 eye tracking (at least 3 times), or eyelids blinking to command (at least 2 of 3). Open eyes and assess tracking (horizontally and vertically) if necessary.
3 eyelids open but not tracking
2 eyelids closed but open to loud voice
1 eyelids closed but open to pain*1
0 eyelids remain closed with pain*1
M MOTOR RESPONSE
4 thumbs-up, fist, or peace sign (at least one of these)
3 localizing to pain*1
2 flexion response (normal or stereotyped) to pain*1
1 extension response to pain*1
0 no response to pain or generalized myoclonus status
B BRAINSTEM RÉFLEXES
4 pupil and corneal reflexes present*2
3 one pupil wide and fixed
2 pupil OR corneal reflexes absent
1 pupil AND corneal reflexes absent
0 absent pupil AND corneal, AND cough reflex*3
R RESPIRATION
4 not intubated, regular breathing pattern
3 not intubated, Cheyne–Stokes breathing pattern
2 not intubated, irregular breathing
1 breathes above ventilator rate*4
0 breathes at ventilator rate OR apnea*5
Adapted from Wijdicks (Wijdicks, Bamlet et al. 2005) Instructions for the assessment of the individual categories of the FOUR score: Grade the best possible response. *1 Temporomandibular joint or supraorbital nerve nociceptive stimulation. *2 Corneal reflexes are tested by instilling two to three drops sterile saline on the cornea from a distance of 10-15 cm (this minimizes corneal trauma from repeated examinations). *3 The cough reflex to tracheal suctioning is tested only when both pupil and corneal reflexes are absent. *4 No adjustments are made to the ventilator while the patient is graded, but grading is done preferably with PaCO2 within normal limits. *5 A standard apnoea (oxygen-diffusion) test may be needed when patient breathes at ventilator rate (R0).

62
Amending the Glasgow coma scale’s lack of brainstem-reflexes assessment, FOUR tests
pupil, cornea, and cough reflexes. The last category of FOUR scores respiration as
spontaneous regular, irregular, Cheyne-Stokes, ventilator-assessed patient-generated
breaths, or absent. With all FOUR categories graded zero, the scale alerts to consider brain
death or standard apnoea (oxygen-diffusion) testing.
In the past 30 years, many coma scales have been proposed as an alternative to the Glasgow
coma scale, but none with success. The FOUR score has not been widely validated yet. To
date only one study validated the score and assessed the inter-rater agreement (Wolf,
Wijdicks et al. 2007). The validity of this new scale needs to be corroborated when used in a
general ICU setting by examiners other than neuroscience professionals. Nevertheless, since
the FOUR score provides more neurologic information than the GCS, one can postulate that
it could bring valuable improvement to future severity models.

63
3.2 The cystatin C
From: Cystatin C blood level as a risk factor for death after heart surgery Ledoux D, Monchi M, Chapelle J-P, Damas P European Heart Journal (2007)28(15): 1848-53.
The identification of preoperative risk factors for adverse outcomes after heart surgery is
important to determine which resources and interventions will ensure an optimal outcome.
Another benefit is risk adjustment in studies of quality of care.
Renal dysfunction increases the risk of perioperative morbidity and mortality in patients
undergoing heart surgery (Anderson, O'Brien et al. 1999; Durmaz, Buket et al. 1999; Franga,
Kratz et al. 2000; Khaitan, Sutter et al. 2000; Surgenor, O'Connor et al. 2001; Weerasinghe,
Hornick et al. 2001; Penta de Peppo, Nardi et al. 2002; van de Wal, van Brussel et al. 2005).
The rate of chronic renal impairment is increasing in the general population, and mild renal
impairment often escapes recognition (Sarnak, Levey et al. 2003). In numerous studies
including patients with cardiovascular disease or diabetes, glomerular filtration rate (GFR)
was an independent risk factor for overall mortality and new cardiovascular events (Sarnak,
Levey et al. 2003). In clinical practice, GFR is estimated from the serum creatinine level.
However, serum creatinine is of limited value for the early detection of renal impairment,
because creatinine is not only filtered by the glomeruli, but also secreted by the tubules
(Perrone, Madias et al. 1992). Moreover, serum creatinine may not adequately assess acute
changes in GFR (Herget-Rosenthal, Marggraf et al. 2004). Serum creatinine is influenced not
only by renal function, but also by lean body mass (i.e., muscle mass), sex, age, and ethnicity
(Levey 1990).
Serum cystatin C is a newly identified marker of renal function. Cystatin C is a low-molecular-
weight protein (13,359 Dalton) that is produced by all nucleated cells at a constant rate,
released into the bloodstream, freely filtered by the renal glomeruli, and catabolised in the
proximal tubules (Randers, Kristensen et al. 1998). Serum cystatin C concentration is
independent of age, sex, and muscle mass. Several studies have shown that serum cystatin C
is a better indicator of GFR and a more reliable marker of mild renal dysfunction, compared

64
to serum creatinine (Newman, Thakkar et al. 1995; Coll, Botey et al. 2000; O'Riordan, Webb
et al. 2003). In an observational study, Shlipak et al. find that serum cystatin C was an
independent risk factor for heart failure in elderly adults and a better risk marker than serum
creatinine (Shlipak, Sarnak et al. 2005).
We hypothesized that preoperative GFR estimated from serum cystatin C would be a better
predictor of postoperative mortality and morbidity than GFR estimated from serum
creatinine in patients undergoing heart surgery. We therefore conducted a prospective
study in which we recruited all consecutive patients admitted for heart surgery
In this study, we collected preoperatively demographic characteristics, established risk
factors for heart surgery complications (Roques, Nashef et al. 1999), cystatin C and details on
the surgical procedure. With these information, we calculated the EuroSCORE (Nashef,
Roques et al. 1999) for all patients. At the end of the hospital stay, we recorded new cardiac
events, ICU stay length, hospital stay length, and vital status. Finally, 1 year after surgery we
contacted each patient’s general practitioner to obtain information on vital status and
hospital admissions. Our primary endpoint was 1-year mortality. Secondary endpoints were
hospital mortality and hospital morbidity defined as a hospital stay length greater than the
75th percentile, determined in the study population. The choice of this length of stay
threshold was made arbitrarily but was justified by the fact that it maximized the probability
that these patients truly presented comorbidity and that they were those who inflated
significantly care cost.
Three hundred and seventy six patients were included in the study. Patients’ characteristics
are described in table 7. The following surgical procedures were performed: coronary artery
bypass graft (CABG) 235/376 (62.5%), valve surgery 81/376 (21.5%), combined CABG and
valve surgery 38/376 (10.1%), ascending aorta surgery 15/376 (4%), atrial septal defect
closure 5/376 (1.3%) and left atrial myxoma surgery 2/376 (0.5%). Median follow-up was 368
days; 4 patients (1.1%) were lost to follow-up. Of the 376 patients, 21 (5.6%) died during the
hospital stay, 83 (22.1%) had a prolonged hospital stay (longer than percentile 75), and 38
(10.2%) died within the first year.

65
Table 7. Baseline characteristics of the study patients (n = 376) by estimated GFR quartiles*
Patient characteristics All patients
GFR estimated from serum cystatin C concentration
P value Quartile 1 < 48 ml/min/1.73 m
2
(n = 93)
Quartile 2 48 – 65 ml/min/1.73 m
2
(n = 90)
Quartile 3 66 – 81 ml/min/1.73 m
2
(n = 98)
Quartile 4 ≥ 82 ml/min/1.73 m
2
(n = 95)
Age, y 71 (63 – 76) 75 (70 – 78) 74 (69 – 78) 68 (60 – 72) 64 (57 – 71) < 0.001 Female, n (%) 122 (32.4) 39 (40.6%) 35 (38.9%) 21 (21.6%) 27 (29.0%) 0.015 Body mass index, kg/m
2 26.1 (23.5 – 28.7) 26.3 (22.7 – 28.3) 25.7 (23.7 – 28.7) 26.4 (23.5 – 29.3) 25.4 (23.5 – 28.7) 0.765
EuroSCORE 5 (3 – 8) 6 (7 – 9) 6 (4.8 – 8.0) 5 (3.0 – 7.0) 3 (2.0 – 5.0) < 0.001 Preoperative LVEF, % 63 (50 – 74) 58 (46 – 70) 62 (47 – 73) 69 (54.3 – 76.3) 65 (56.0 – 75.5) 0.003 COPD, n (%) 106 (28.2) 37 (38.5) 20 (22.2) 27 (27.8) 22 (23.7) 0.060 Diabetes, n (%) 81 (21.5) 29 (30.2) 20 (22.2) 15 (15.5) 17 (18.3) 0.077 Hypertension, n (%) 267 (71) 76 (79.2) 63 (70.0) 69 (71.1) 59 (63.4) 0.120 Pulmonary hypertension, n (%) 83 (22.1) 24 (25.0) 27 (30.0) 22 (22.7) 10 (10.8) 0.009 NYHA class IV
2 31 (8.4) 16 (16.8) 4 (4.5) 6 (6.4) 5 (5.4) 0.013
Recent myocardial infarction, n (%) 51 (13.6) 14 (14.6) 11 (12.2) 16 (16.5) 10 (10.8) 0.667 Previous heart surgery, n (%) 24 (6.4) 12 (12.5) 2 (2.2) 5 (5.2) 5 (5.4) 0.035 Extracardiac arteriopathy, n (%) 94 (25) 35 (36.5) 20 (22.2) 26 (26.8) 13 (14.0) 0.004 Emergency surgery, n (%) 19 (5.1) 7 (7.3) 5 (5.6) 5 (5.2) 2 (2.2) 0.392 Complex surgery
1, n (%) 134 (35.6) 45 (46.9) 35 (38.9) 29 (29.9) 25 (26.9) 0.017
IABP3, n (%) 14 (3.7) 9 (9.4) 2 (2.0) 3 (3.4) 0 (0) 0.004
Serum cystatin C, mg/L 1.16 (1.0 – 1.41) 1.69 (1.53 – 1.99) 1.27 (1.21 – 1.33) 1.08 (1.06 – 1.1) 0.95 (0.83 – 0.98) < 0.001 Serum creatinine, mg/L 10.3 (8.7 – 12.1) 13.0 (11.1 – 16.4) 10.4 (9.0 – 12.0) 10.1 (8.7 – 11.2) 8.7 (7.7 – 9.9) < 0.001 Estimated GFR, cystatin C (ml/min) 66 (49 – 81) 35 (26 – 41) 55 (51 – 61) 73 (70 – 77) 91 (85 – 110) < 0.001 Estimated GFR, creatinine (ml/min) 71 (58 – 84) 50 (39 – 61) 66 (57 – 77) 77 (68 – 88) 87 (79 – 100) < 0.001 ICU stay, days 3 (2.3 – 5.0) 3 (2.0 – 4.0) 2 (2.0 – 4.0) 2 (2.0 – 3.0) < 0.001 Hospital stay, days 12 (10 – 16.8) 11 (10.0 – 14.3) 11 (10.0 – 14.0) 10 (10 – 12.0) 0.001 Death in the ICU, n (%) 9 (9.4) 1 (1.1) 2 (2.1) 0 (0 ) 0.001 Death in hospital, n (%) 21 (5.6) 13 (13.5) 4 (4.4) 3 (3.1) 1 (1.1) 0.002 One-year re-admission, n (%) 42 (11.3) 16 (34.8) 13 (15.3) 10 (10.8) 7 (7.7) 0.098 One-year mortality, n (%) 38 (10.1) 19 (19.8) 11 (12.2) 6 (6.2) 2 (2.2) < 0.001
*Data are presented as median and interquartile range for continuous variables and count plus percentage for categorical variables.
1major cardiac surgery other than or in addition to coronary artery bypass grafting
2NYHA: New York Heart Association classification system for heart dysfunction;
3Intra-aortic balloon counter-pulsation during the postoperative period. IABP was used in case of failure to wean
patient from cardiopulmonary bypass; LVEF: left ventricular ejection fraction; COPD: chronic obstructive pulmonary disease; GFR: glomerular filtration rate; ICU: intensive care unit

66
Cardiovascular risk factors and outcomes associated with cystatin C (Table 7).
Patients in the lower quartile of GFR based on cystatin C were older, more likely to be
female, and more likely to have risk factors for postoperative morbidity and mortality as
shown by higher EuroSCORE values. These patients were also more likely to experience a
prolonged ICU stay, a prolonged hospital stay, and death within the first year after surgery.
Factors associated with 1-year mortality (Table 8).
Full follow-up data were obtained for all patients. In the univariate analysis, in addition to
estimated GFR, six variables were significantly associated with 1-year mortality: age,
EuroSCORE, COPD, recent myocardial infarction, extracardiac arteriopathy, and emergency
surgery. The Cox regression model with backward stepwise variable selection kept
EuroSCORE and GFR estimated from cystatin C in the model (hazards ratio per 10 ml/min of
GFR decrease, 1.26 (1.09 – 1.46), P = 0.002).
Table 8. Univariate and multivariable Cox regression analysis for 1-year mortality rate
Patient characteristics Univariate analysis Multivariable analysis
Hazard ratio (95%CI)
P value Hazard ratio (95%CI)
P value
Age, y 1.06 (1.02 – 1.10) 0.005 Female 0.85 (0.42 – 1.72) 0.653 EuroSCORE 1.23 ( 1.14 – 1.33) < 0.001 1.19 (1.09 – 1.29) <0.001 COPD 2.18 (1.15 – 4.14) 0.017 Extracardiac arteriopathy 2.02 (1.05 – 3.87) 0.034 Previous heart surgery 1.39 (0.43 – 4.53) 0.581 Active endocarditis 1.02 (0.14 – 7.42) 0.986 Critical preoperative state 4.98 (2.416 – 10.26) < 0.001 Unstable angina 2.51 (1.26 – 4.97) 0.008 Preoperative LVEF, % 0.99 (0.97 – 1.01) 0.175 Recent myocardial infarction 2.78 (1.38 – 5.60) 0.004 Pulmonary hypertension 1.32 (0.64 – 2.72) 0.449 NYHA class IV
2 1.37 (0.484 – 3.85) 0.557
Emergency surgery 4.82 (2.12 – 10.96) < 0.001 Complex surgery
1 0.87 (0.44 – 1.73) 0.697
Diabetes 1.54 (0.77 – 3.11) 0.225 Creatinine (mg/dl) 1.44 (1.11 – 1.86) 0.006 Cystatin C (mg/l) 1.67 (1.27 – 2.18) < 0.001 GFR estimated from cystatin C, ml/min/1.73 m
2 0.97 (0.96 – 0.98) < 0.001 0.97 (0.96 – 0.99) 0.002
GFR estimated from creatinine, ml/min/1.73 m2 0.97 (0.95 – 0.98) <0.001
1Complex surgery: major cardiac surgery other than or in addition to coronary artery bypass grafting
2NYHA: New York Heart Association classification system for heart dysfunction; LVEF: left ventricular ejection
fraction; COPD: chronic obstructive pulmonary disease; 95% CI: 95% confidence interval.

67
Factors associated with hospital morbidity or mortality (Table 9).
In the univariate analysis, hospital mortality and morbidity were significantly associated with
GFR, as well as with seven of the 15 assessed risk factors (age, EuroSCORE, COPD, diabetes
mellitus, recent myocardial infarction, previous cardiac surgery, extracardiac arteriopathy,
emergency surgery and complex surgery). Table 9 lists the other risk factors. After
adjustment for other risk factors, GFR estimated from cystatin C appeared to be a better
marker for hospital morbidity or mortality (odds ratio per 10 ml/min of GFR decrease, 1.20
(1.07 – 1.34), P = 0.001).
Table 9. Univariate and multivariable logistic regression analysis to identify factors associated with hospital morbidity and mortality
Patient characteristics Univariate analysis Multivariable analysis
Odds ratio (95%CI) P value Odds ratio (95%CI) P value
Age, y 1.03 (1.01 – 1.06) 0.013 Female 0.77 (0.46 – 1.29) 0.316 EuroSCORE 1.23 (1.15 – 1.33) < 0.001 1.18 (1.10 – 1.28) <0.001 COPD 1.69 (1.03 – 2.78) 0.040 Extracardiac arteriopathy 2.45 (1.48 – 4.07) 0.001 Previous heart surgery 4.02 (1.73 – 9.32) 0.001 Active endocarditis 3.16 (0.89 – 11.17) 0.074 Critical preoperative state 5.94 (2.69 – 13.11) < 0.001 Unstable angina 1.52 (0.829 – 2.77) 0.177 Preoperative LVEF, % 0.99 (0.98 – 1.01) 0.447 Recent myocardial infarction 1.82 (0.97 – 3.41) 0.063 Pulmonary hypertension 1.13 (0.65 – 1.97) 0.672 NYHA class IV
2 1.81 (0.83 – 3.94) 0.135
Emergency surgery 4.61 (1.80 – 11.85) 0.001 Complex surgery
1 1.14 (0.70 – 1.85) 0.599
Creatinine (mg/dl) 2.84 (1.48 – 5.48) 0.002 Cystatin C (mg/l) 3.07 ( 1.74 – 5.41) < 0.001 GFR estimated from cystatin C, ml/min/1.73 m
2 0.97 (0.96 – 0.98) < 0.001 0.98 (0.97 – 0.99) 0.001
GFR estimated from creatinine, ml/min/1.73 m2 0.97 (0.96 – 0.99) < 0.001
1Complex surgery: major cardiac surgery other than or in addition to coronary artery bypass grafting
NYHA: New York Heart Association classification system for heart dysfunction; LVEF: left ventricular ejection fraction; COPD: chronic obstructive pulmonary disease; 95%CI: 95% confidence interval.
In this study, we found that preoperative GFR estimated from serum cystatin C was strongly
associated with 1-year mortality and with hospital mortality and morbidity. GFR estimated
from serum cystatin C was better than GFR estimated using MDRD equation based on serum
creatinine for predicting adverse outcomes. Several reasons may explain our findings, as
serum cystatin C is more sensitive than serum creatinine for detecting renal dysfunction.
Serum creatinine tends to overestimate GFR in patients with renal dysfunction. The
relationship between serum creatinine and GFR is not linear, and serum creatinine starts to
rise only when GFR falls below 50% of normal (Hsu, Chertow et al. 2002). Therefore, serum

68
creatinine often misses mild to moderate renal function impairment. Several mechanisms
may contribute to worsen outcomes after heart surgery in patients with renal dysfunction.
Renal dysfunction is associated with other risk factors such as older age, left ventricle
dysfunction, and extracardiac arteriopathy (included in EuroSCORE). Renal dysfunction is
also associated with a wide range of metabolic derangements, including
hyperhomocysteinemia (Perna, Acanfora et al. 2004), elevated asymmetrical
dimethylarginine (Fliser, Kronenberg et al. 2005), elevated lipoprotein (a) (Sechi, Zingaro et
al. 1998), chronic inflammation, and increased oxidative stress (Sela, Shurtz-Swirski et al.
2005). These derangements, which have been identified even in patients with moderate
renal dysfunction, are associated with adverse outcomes in patients with kidney disease
(Cressman, Heyka et al. 1992; Stubbs, Seed et al. 1998; Mallamaci, Zoccali et al. 2002; Lu,
Ding et al. 2003) and may have mediated the higher risk seen in patients with cystatin C
elevation in our study.
GFR estimated from serum cystatin C adds information to the EuroSCORE in terms of
hospital mortality and morbidity. This may be ascribable to the use of serum creatinine in
the EuroSCORE to estimate renal function. GFR estimated from serum cystatin C was the
only variable in our study that added information to the EuroSCORE regarding 1-year
mortality. Although the EuroSCORE is not designed to predict long-term outcomes, our
findings constitute further evidence that serum creatinine is not an optimal marker of renal
function and risk associated with heart surgery.
Serum creatinine assay is less expensive (0.4 US Dollars) than cystatin C assay (5 US Dollars).
Whether the greater accuracy of cystatin C in estimating renal function is associated with
clinical benefits needs to be determined. Our results suggest that the increased cost related
to a single preoperative cystatin C measurement may be acceptable in the setting of patient
evaluation before heart surgery. Shlipak et al. also found that cystatin C was a better marker
for the risk of death and cardiovascular events than serum creatinine in elderly individuals
(Shlipak, Sarnak et al. 2005). In patients with acute coronary syndrome, cystatin C performs
better than creatinine in discriminating between survivors and nonsurvivors (Jernberg,
Lindahl et al. 2004). Thus, cystatin C assay may have a favourable cost/benefit ratio.

69
Although the present study has to be considered as preliminary, cystatin C appears to be a
promising marker for impaired renal function that provides more information than the
established estimates of GFR, thereby improving the identification of high-risk patients
before heart surgery. Further research should assess the possible improvement Cystatin C
could bring to generic severity of illness models.

70

71
3.3 The troponin T and the pro-BNP
From: Development of a prediction model for 1-year mortality after heart surgery Ledoux D. – promoter: Pr P Lambert, Master Thesis for the degree of Master of Statistics Université Catholique de Louvain – Institut de Statistique
In Western countries, cardiovascular diseases are still the most important cause of morbidity
and mortality (World Health Organisation 2009). These diseases often require expensive
interventional procedures such open heart surgery and hence make an important use of
medical resources. Consequently achieving a better knowledge of the vital risk encountered
by these patients is of most interest in order to improve patients’ management. Several
researchers worked on tools to assess the severity of illness of patients proposed to cardiac
surgery. Among severity of illness models dedicated to heart surgery patients’ assessment,
the most commonly cited in the literature are the Parsonnet score and the EuroSCORE
(Parsonnet, Dean et al. 1989; Nashef, Roques et al. 1999). These models were published
respectively 20 and 10 years ago and over this long period of time surgical procedures, but
also patients case mix have markedly changed.
Different authors showed that these rather old models do not perform adequately anymore
and tend to overestimate mortality (Gummert, Funkat et al. 2009; Osswald, Gegouskov et al.
2009; Parolari, Pesce et al. 2009). Moreover, several of the risk factors these scores are
based on are somewhat subjective (Table 10). Items such as “chronic obstructive disease”,
“neurological dysfunction” or “catastrophic states” are poorly described and rather
subjective.
We therefore designed a prospective study whose aim was to develop a preoperative
prognostic model that would only be based on commonly used and easily obtained objective
variables selected among published risk factors. These variables were: age (AGE), gender
(GENDER), type of surgery (COMPLEX), troponin T (TNT), pro-B-type natriuretic peptide (BNP),
glomerular filtration rate estimated using the Modification of Diet in Renal Disease study
formula (GFR) (Levey, Bosch et al. 1999) and the C-reactive protein (CRP). All these data
were collected preoperatively. These variables provided information on the global

72
physiological status (AGE and GFR), on the cardiac ischemia, and on the heart dysfunction.
Following the joint recommendation of the European Society of Cardiology and the
American College of Cardiology (ESC/ACC 2000); Troponin T was preferred to the creatine
kinase MB isoenzyme. Data required to compute the EuroSCORE were also recorded
preoperatively. To the classical hospital mortality, we preferred the 1-year survival status
since we considered that the latter better reflects the success of heart surgery.
Table 10. EuroSCORE and Parsonnet score variables
EuroSCORE risk factors.
Patient-related factors
Age Female gender Chronic pulmonary disease Extracardiac arteriopathy Neurological dysfunction Previous cardiac surgery Serum creatinine Active endocarditis Critical preoperative state
Cardiac-related factors
Unstable angina Left ventricular dysfunction Recent myocardial infarct Pulmonary hypertension
Operation-related factors
Emergency Other than isolated CABG Surgery on thoracic aorta Post infarct septal rupture
Parsonnet score risk factors
Patient-related factors
Age Female gender Family history Elevated cholesterol Diabetes Hypertension Smoking Previous cardiac surgery Obesity Catastrophic states
Cardiac-related factors
Left ventricular ejection fraction Left ventricular aneurysm Preoperative intra-aortic balloon pump Aortic valve disease Mitral valve disease
Operation-related factors
Emergency Isolated CABG CABG + other procedure
Patients
All adult patients consecutively addressed to open cardiac surgery were included in the
study. Five hundred and sixty eight patients were included in the protocol, among them 51
(9%) died during the first postoperative year. Patients’ characteristics at baseline are shown
in Table 11.

73
Table 11. Patients’ baseline characteristics
Patient’s characteristics
Age 70 (61 – 76) Male gender, n (%) 383 (67%) BMI 26.2 (23.6 – 28.9) Diabetes, n (%) 125 (22%) Hypertension, n (%) 393 (69%) COPD, n (%) 167 (29%) Pulmonary hypertension, n (%) 125 (22%) Endocarditis, n (%) 19 (3%) LVEF 63 (51 – 73) NYHA class IV, n (%) 71 (13%) Recent MI, n (%) 81 (14%) TNT < 0.01, n (%) 421 (75%) TNT > 0.01 & <0.03, n (%) 31 (6%)
TNT 0.03, n (%) 108 (19%)
Pro-BNP 589 ( 206 – 1868) Estimated GFR 72 (58 – 85) CRP below threshold level, n (%) 192 (34%) CRP serum level 4 (0 – 12) EuroSCORE 7 (4 – 9) Death in the ICU, n (%) 17 (3%) Death in hospital, n (%) 29 (5%) Death after 1 year, n (%) 51 (9%)
Data are presented as median and interquartile range for continuous variables and count plus percentage for categorical variables.
The commonest surgical procedure was coronary artery bypass graft (table 12); as in
previous research on severity of illness, we choose to categorise surgical procedures into
non-complex (CABG) or complex surgery (other than isolated CABG) (Roques, Nashef et al.
1999). Thirty six patients (8%) were referred for emergent surgery.
Table 12. Surgical procedures performed.
Type of surgery n (%)*
CABG 407 (61%) Aortic valve 144 (21%) Mitral valve 80 (12%) Tricuspid valve 4 (0.6%) Thoracic aorta 29 (4%) Septum atrial defect 9 (1%)
Complex surgery 236 (35%) *Several procedures could be performed in the one patient

74
Model development
Univariate analysis
Of the 568 patients, 472 (83%) had complete data available. The univariate logistic
regression was used to select potential predictors for 1-year survival status. Although in
logistic regression no assumptions are made about the distributions of the explanatory
variables, we found that pro-BNP showed a better association with the outcome variable
after logarithmic transformation. Troponin T and C-reactive protein had high rate of
observations below the laboratory detection level (respectively 75% and 34% of the
observations were below the detection threshold). We used two different approaches to
handle these difficulties. The troponin T was discretized into 3 categories according
information from the literature: TNT < 0.01 µg/l (laboratory detection level), 0.01 µg/l TNT
< 0.03 µg/l and TNT 0.03 µg/l (Wallace, Abdullah et al. 2006). Since there was not such
information for the CRP, we decided to include two terms for CRP, one that is a dichotomous
dummy variable (CRPd) recording zero (CRPd = 0) versus non-zero CRP level (CRPd = 1) and
one term for the actual serum CRP concentration (Hosmer and Lemeshow 2000).
The univariate analysis showed that, excepted for the type of surgery, all the preselected
variables were strongly associated with the outcome (Table 13).
Table 13. Univariate analysis for the selected variables.
Variable Coeff. Std. Err. OR 95% CI p-value
AGE*1 0.6079 0. 1885 1.84 1.27 – 2.66 0.0003
COMPLEX 0.4213 0.3117 1.52 0.83 – 2.81 0.1741
TNTcat2*3 1.9962 0.5362 7.33 2.56 – 20.98 < 0.0001
TNTcat3*3 2.2438 0.3534 9.43 4.72 – 18.85
LnBNP*4 0.6390 0.1117 1.90 1.52 – 2.36 < 0.0001
GFR*5 -0.2766 0.0766 0.76 0.65 – 0.88 0.0002
CRPd -0.2197 0.3693 0.80 0.39 – 1.66 < 0.0001
CRP*6 0.2058 0.0500 1.23 1.11 – 1.36
*1
Coefficient, Standard Error and Odds Ratio for 10 years of age increase. *
3 Discretized TNT variable.
*4 Logarithmic Transformation of the pro-BNP serum level.
*5 Coefficient, Standard Error and Odds Ratio for 10 ml/min glomerular filtration rate.
*6 Coefficient, Standard Error and Odds Ratio for 10 mg/l increase in CRP serum level.

75
According to Hosmer and Lemeshow recommendation (Hosmer and Lemeshow 2000), we
fixed a p-value < 0.25 in the univariate analysis to select the candidate variables for the
multivariable analysis. This choice aimed to potentiate the identification of important
variables while avoiding the inclusion of variables that could be of questionable importance
for model building. We therefore kept all the variables as candidate for model building.
Multicollinearity among predictors was checked by computing the Spearman correlation
coefficients (r) between variables two by two. An r < 0.5 was considered as low enough to
exclude correlation between predictors. All the covariates r values were < 0.5 (from 0.03 to
0.41) indicating that chances were low to have problematic collinearity and hence that
predictors.
Multivariable analysis
We began our model determination from the complete principal effects model. Since our
goal was to elaborate a model that could adequately predict the outcome rather than to
identify covariables associated with the outcome variable we fixed a p-value of 0.15 for a
variable to be kept in the model. In the preliminary model, the TNT categories had similar
coefficients. This was consistent with data from the literature (Wallace, Abdullah et al.
2006); we therefore discretized troponin T into a binary variable (coded 0 if troponin T < 0.01
and 1 otherwise). The type of surgery and the glomerular filtration rate had a p-value above
0.15 and were successively removed from the model. None of the two by two interactions
reached a significant level and therefore no interaction coefficient was added to the model.
The final model is displayed in table 14.
Table 14. Final prediction model for 1-year mortality after open heart surgery
Variable Coef. Std. Err. z 95% CI p-value
AGE 0.0450 0.0204 2.21 0.0050 – 0.0850 0.027
TNT 0.01 1.6649 0.4053 4.11 0.8706 – 2.4592 0.000
LnBNP 0.3067 0.1342 2.28 0.0436 – 0.5697 0.022
CRPd -.7008 0.4115 -1.70 -1.5073 – 0.1057 0.089
CRP 0.0101 0.0051 1.97 0.0001 – 0.0201 0.049
Constant -7.9310 1.6024 -4.95 -11.0716 – -4.7905 0.000

76
Assessment of model performance
The goodness-of-fit test showed a very good agreement between observed and expected
mortality rates with a Hosmer-Lemeshow statistic (Ĉ) of 7.56 (p = 0.478). The area under the
receiver operating characteristic curve (AUROC) was 0.825 and was significantly higher than
the AUROC obtained for the EuroSCORE (p = 0.028, figure 7).
Figure 7. Area under the receiver operating characteristic curve for the developed model and for EuroSCORE.
In the present study, we found that mortality rate 1 year after open heart surgery was
almost doubled as compared to hospital mortality (Table 11). This observation was
consistent with other authors finding. In a study including 6222 cardiac surgical procedure,
Nilsson found that 1-year mortality (6.1%) was doubled as compared to 30-day mortality
(2.9%) (Nilsson, Algotsson et al. 2006). This finding weakens the usefulness of the classical
hospital outcome as endpoint. The success of heart surgery which is an elective procedure in
most situations (92% in our case mix) should rather be based on a longer observation period.
The discrimination capacity of our model was superior to the EuroSCORE; this was expected
since comparison was made a developmental case mix. One could also argue that
EuroSCORE was not made to predict 1-year mortality. We found however that, in our case
0.0
00.2
50.5
00.7
51.0
0
Sen
sitiv
ity
0.00 0.25 0.50 0.75 1.001-Specificity
rodscore ROC area: 0.8247 euroscore ROC area: 0.7419
Reference

77
mix, the performances of the EuroSCORE to predict 1-year mortality was similar to those
described performance described in the original EuroSCORE publication (TABLE 15) (Nashef,
Roques et al. 1999). The good calibration and discrimination observed in the development
case mix appears promising; however an external validation is required.
Table 15. EuroSCORE performance in the validation sample from the original study (EuroSCORE original) and in our study (BNP study).
EuroSCORE original
BNP study
Area under ROC 0.76 0.76 (0.69 – 0.82) Hosmer-Lemeshow goodness-of-fit test Ĉ = 7.5 ; P = 0.68 Ĉ = 9.53 ; P = 0.30
The use of biomarkers that could detect ischemia (TNT) and heart failure (pro-BNP) might be
of interest in generic severity of illness models. The BNP could be of a particular interest,
several publications have indeed shown that elevated BNP is related with a poor outcome in
diverse illness conditions such as renal failure or sepsis (Aneja 2008; Sun, Sun et al. 2008;
Svensson, Gorst-Rasmussen et al. 2009).
The four covariates model we developed appears to perform adequately and present
interesting features: it has good calibration and discrimination capacity, it is based on
objective variables, it can be easily obtained preoperatively and could for instance be add in
the laboratory preoperative results. An external validation on a larger multicenter
population sample is however required.

78

79
4 About the use of severity scores
The question often addressed about severity of illness models is: why should we bother
gathering data to obtain these scores? If severity scores are not the absolute answer to
physicians’ indecision about their patients’ prognostic they certainly allow an objective
lessening of that uncertainty. We here present some of the possible applications where
severity score may be useful if not required.
4.1 Individual patient outcome prediction
When the intensivist is confronted with a patient he often raises the question to know what
the patient’s chances to survive are. This estimate will condition the therapeutic approach
but also the dialogue with the patient and with the relatives. However our clinical judgment
suffers from subjectivity. Several studies indeed showed that if the doctors have a good
capacity to discriminate the patients who will not survive; their judgment lacks of calibration
resulting in a poorer discrimination in the lower risk strata (Kruse, Thill-Baharozian et al.
1988; Brannen, Godfrey et al. 1989; Knaus, Wagner et al. 1991). If ICU physicians are capable
of correct discrimination, their uncertainty often makes them uncomfortable in making
clinical decisions. In this context it may be useful to take advantage of an objective
assessment tool. The ability to strengthen clinical perception of patient prognostic thanks to
the help of objective model will make the physician more confident in his decisions.
There are nevertheless a number of caveats in regards of applying severity of illness models
in individual patients. Prognostic models cannot predict outcome with 100% specificity
(Table 16); a high score will never indicate an absolute certitude of death. Similarly low risk
of death will not warrant that patient will survive. As quoted by Le gall, there is often
confusion between probability of death and predicting survival or death (Le Gall 2005).
Severity models can only provide estimates of the proportion of death that one can expect in
a group of similar patients; this is inherent to the statistical methods they are based on. They
are not capable to detect which patients will actually die.

80
Table 16. Death and survival according to risk of death obtained from SAPS II
Probability of death
0 0.05 0.1 0.2 0.3 0.4 0.5 0.6 0.7 0.8 0.9 0.95
Alive 2346 2989 2791 922 526 216 187 103 81 43 19 4
Dead 64 141 276 175 167 146 194 146 206 147 80 69
This table illustrates the distribution of survivors and non-survivors across risk of death strata. Although, in the high risk stratum, survival rate is low one cannot state that, from the patient point-of-view, this is not significant. Conversely, even if it is limited, mortality in the lower risk stratum is not “non-significant” for the individual patient. SAPS II risk of death and outcome were obtained on 12955 consecutive patient admissions to the General Intensive Care Department – Liege University Hospital 12955 observations from 1997 to 2006 (unpublished data).
The most appropriate use of severity assessment models in guiding individual patient
management is to view the prognostic estimate as strong additional information about the
patient. This estimate should be merged with the whole clinical picture, including physician’s
judgment, knowledge from prior clinical experience, medical literature and the inputs of
other care givers. Clinical decision should never rely on severity of illness models alone.
4.2 Evaluation of ICU performance
Intensive care uses a considerable amount of medical and economical resources and there is
a growing pressure optimizing the use of these means. An adequate estimation of ICU
performance is therefore important.
Garland et al. proposed to establish ICU evaluation on 4 domains (Garland 2005): medical,
economic, psychological/ethical and institutional outcomes (Table 17). As shown in table 17
hospital outcome is one of the important measures of quality. However mortality rate
cannot be interpreted without any risk adjustment. It is one of the main purposes of
outcome prognostic models development over the last 30 years. Prognostic models allow
adjustment for underlying patient’s characteristics. This is made possible through the
standardization of the mortality rate – standardized mortality ratio (SMR) being defined as
the observed mortality divided by the predicted mortality obtained for severity of illness
models in the given population (Figure 8). Indicators such as SMR are a prerequisite for the
performance assessment of an ICU. In the benchmarking process – i.e. comparing an ICU
with the best performing units – these indicators provide important information regarding

81
strengths and weaknesses of a given ICU as compared to others. The ultimate aim of this
process being to identify appropriate actions for quality improvement.
Table 17. Domains and Measures of ICU Performance
Domain Measures
Medical outcomes Survival rate: ICU, hospital, long term
Complication rates related to care
Medical error
Symptom control adequacy
Economic outcomes Resource use: ICU, hospital, post hospital
Cost-effectiveness of care
Psychosocial and ethical outcomes
Long-term quality of life
Patient satisfaction
Family satisfaction
Concordance of desired and actual EOL decisions
Institutional outcomes Staff satisfaction and turnover rate
Effectiveness of ICU bed utilization
Satisfaction of other hospital collaborator with care and services supplied by the ICU
Adapted from Garland, A. (2005). "Improving the ICU: part 1." Chest 127(6): 2151-64.
There are however caveats using standards mortality ratio. This index is relevant only if it is
based on a well calibrated severity model. A decline in mortality may be due to modification
in hospital discharge practices, patient and family preferences and selection of alternative
sites for death such as nursing home facilities rather than to an actual improvement of the
ICU. Some progress may be explained by the Hawthorne effect, that is, observation influence
behavior and may enhance performance. Despites all these limitations hospital outcome still
is a keystone of quality evaluation as this is shown by the number of national and
international database that have been set up over the last few years (Metnitz, Moreno et al.
2005; Villers, Fulgencio et al. 2006; Zimmerman, Kramer et al. 2006; Moran, Bristow et al.
2008).
However these efforts should not preclude the development and the implementation of
indices for the assessment of other domains of ICU performances such as patient’s quality of
life, appropriateness of end-of-life decisions or staff satisfaction.

82
Figure 8. Evolution of the standardized mortality ratio (SMR) over the past five years in the General Intensive Care Department – Liege University Hospital. This graph show that, for 3 of the 5 years, overall yearly mortality was significantly lower than predicted by SAPS II (* : p < 0.05; **: p < 0.01). The SMR were obtained using SAPS II predicted mortality on 5578 consecutive admissions from 2004 to 2008 (unpublished data).
4.3 Outcome models and resource use
As Garland et al. stated (Garland 2005) resource use in the ICU is another important domain
for the assessment of ICU quality (Table 17). A number of methods have been proposed to
measure this dimension (Kern and Kox 1999; Miranda 1999; Sznajder, Aegerter et al. 2001)
most of these methods need to gather the wide variety of actual cost generated by the ICU
or to collect burdensome items of therapeutic indices such as TISS (Cullen, Civetta et al.
1974; Keene and Cullen 1983) making these procedures cumbersome and their
implementation problematic.
Rapoport et al. introduced an interesting approach to assess ICU performance and cost-
effectiveness (Rapoport, Teres et al. 1994). These authors proposed a method where they
combined two dimensions: the first dimension is the clinical performance assessed using
normalized difference between actual and predicted mortality provided by the admission
mortality prediction model (MPM II0) (Lemeshow, Teres et al. 1993), the other dimension is
economic performance (resource use) which was estimated through a measure of a length of
stay index as it was shown that length of stay is a valuable surrogate of costs (Angus, Linde-
Zwirble et al. 1996; Rapoport, Teres et al. 2003). Using this two dimension approach allows a
0.4
0.6
0.8
1
1.2
1.4
1.6
2004 2005 2006 2007 2008
Standardized mortality ratio (SMR)

83
graphical representation making it easy to summarize ICU efficiency and to identify those
ICUs who are out of a specified range (Figure 9).
Figure 9. Two dimension graph representation of the effectiveness. Adapted from Rothen et al. (Rothen and Takala 2008)
Rothen et al. published an adaptation of Rapoport’s method. These authors assessed the
clinical performance dimension using the SMR derived from the SAPS 3 score and the
economic performance dimension using an index called the standardized resource use (SRU)
based on severity-adjusted ICU length of stay per surviving patient (Rothen, Stricker et al.
2007).
This evaluation method has limitations. One could criticize the fact that this two way
indicator refers to hospital mortality. In the ICU setting, the choice of mortality as clinical
performance indicator is however straightforward; one of the key mission of ICUs is indeed
to care for acutely ill patients suffering from life threatening diseases. Risk-adjustment
models need to be regularly assessed and recalibrated if required. Finally there is a
possibility that hospital transferring policies lead to changes in hospital mortalities that
would not reflect actual ICU improvement.
0
0.5
1
0 0.5 1
Re
sou
rce
use
Outcome
High
Low
Average
Good Average Poor
Effective but at the expense of high resource
Least efficient
Most efficientPoor performance

84
In spite of these drawbacks, the assessment of ICU based on this quality indicator appears to
be an interesting approach for ICU benchmarking (Figure 10) and hence to identify
opportunities for improvement.
Figure 10. Standardized mortality ratio (SMR) and standardized resource use (SRU). An SMR higher than 1 indicates that mortality is “above average”. Similarly, an SRU above 1 denotes “above average” resource use per surviving patient. The blue lines divide the graph into four quadrants making it possible to distinguish between most efficient and least efficient ICUs. The white dots symbolize the ICUs involved in the SAPS 3 project; the red dots represent the Belgian ICUs who participated (n=7). At the national level, mean SMR was 0.90 and mean SRU was 0.94. This adapted graph was made available courtesy of Pr H. U. Rothen.
4.4 Risk adjustment in therapeutic trials
In any therapeutic clinical trial conducted in acutely ill patients it is important to guarantee
that severity of illness is similar both in treatment and control groups. Severity of illness
models allow to control such a risk and to operate adjustment when necessary. Nowadays
most if not all intervention studies conducted in the intensive care setting use one or
another of the severity scores.

85
There are caveats when using severity of illness models. In most studies, the population
under investigation is not similar to the case mix used to build severity scores and hence
discrimination and especially calibration may not be adequate for a proper risk assessment.
To overcome this issue, authors have proposed adaptation of generic severity of illness
models such as SAPS II to the population being studied such severe sepsis patients (Le Gall,
Lemeshow et al. 1995). Timing is another issue, generic severity of illness models were all
developed either on admission or on the first 24 hours data. In most therapeutic trials
severity score are calculated based on the inclusion’s day physiological data which is often
different from day one. In this condition one cannot warrant that model performances are
unaltered. APACHE II score is still the most widely used model even in very recent and well
conducted studies (Bernard, Vincent et al. 2001; Rivers, Nguyen et al. 2001; van den Berghe,
Wouters et al. 2001; Finfer, Norton et al. 2004; Finfer, Chittock et al. 2009). However it is
now well accepted that APACHE II is no longer a recommendable model for risk assessment
and stratification; even Knaus, the APACHE II original developer, advised that researchers
should discontinue the use of the APACHE II for outcome assessment (Knaus 2005).
At the present time, study design instructions usually do not comply with recommendation
of model creators and there is no information about severity models accuracy when used
the way they are in therapeutic trials. Future research looking at the potential benefit of new
treatment should adapt their design to ascertain an optimal use of severity of illness models
and hence an adequate risk stratification.

86

87
5 Ethical issues related to the use of severity of illness models
From:
End-of-life practices in European intensive care units: the Ethicus Study Sprung C, Cohen S, Sjokvist P, Baras M, Bulow H, Hovilehto S, Ledoux D, Lippert A, Maia P, Phelan D, Schobersberger W, Wennberg E, Woodcock T Journal of the American Medical Association (2003). 290(6): 790-7 Relieving suffering or intentionally hastening death: where do you draw the line? Sprung C, Ledoux D, Bulow H, Lippert A, Wennberg E, Baras M, Ricou B, Sjokvist P, Wallis C, Maia P, Thijs L, Solsona Duran J Critical Care Medicine (2008). 36(1): 8-13. Reasons, considerations, difficulties and documentation of end-of-life decisions in European intensive care units: the ETHICUS Study Sprung C, Woodcock T, Sjokvist P, Ricou B, Bulow H, Lippert A, Maia P, Cohen S, Baras M, Hovilehto S, Ledoux D, Phelan D, Wennberg E, Schobersberger W Intensive Care Medicine (2008) 34(2): 271-7.
The Ethicus study (Sprung, Cohen et al. 2003) was conducted in ICUs in 37 centres located in
17 countries. During the study period 31417 patients were admitted to the ICU, 4248 died or
had life-sustaining treatments limited in some fashion (14% of those admitted to ICUs). Of
these 4248 patients, limitation of life-sustaining therapy occurred in 3086 (72.6%), that is,
10% of ICU admissions and 76.0% of dying patients (3086/4058) (Table 18). In the southern
European countries, CPR was used more (30.1%) and withdrawing (17.9%) and shortening of
the dying process (0%) were used less frequently than those in the central (17.9%, 33.8%,
6.5%) or northern (10.2%, 47.4%, 0.9%) countries (P < 0.001).
Withholding preceded or accompanied withdrawal of therapy in 1335 of 1398 patients
(95.4%) who underwent withdrawing treatment. All patients who underwent shortening of
the dying process – defined as a circumstance in which someone performed an act with the
specific intent of shortening the dying process – already had previous therapies withheld or
withdrawn. Shortening of the dying process was used at 9 centres in 7 countries.

88
Table 18. Frequencies of patient end-of-life categories by region (N = 4248)*
Patients, No (%)
Unsuccessful CPR
Brain Death
Withholding Life-Sustaining
Treatment
Withdrawing Life-Sustaining
Treatment
Active Shortening of
the Dying Process
Regions
Northern (n=1505) 154(10.2) 48(3.2) 575(38.2) 714(47.4) 14(0.9)
Central (n=1209) 217(17.9) 92(7.6) 412(34.1) 409(33.8) 79(6.5)
Southern (n=1534) 461(30.1) 190(12.4) 607(39.6) 275(17.9) 1(0.1)
Total (N=4248) 832(19.6) 330(7.8) 1594(37.5) 1398(32.9) 94(2.2)
Range between countries,%
5-48 0-15 16-70 5-69 0-19
Hospital mortality, % 100 100 89 99 100
Abbreviation: CPR, cardiopulmonary resuscitation.
*P < 0.001, 2 test for the association between region and end-of-life practice. Brain death was excluded from the analysis.
The median (IQR) time from the first decision to limit treatment until death was 14.7 (2.9-
54.7) hours. The median (IQR) time from the decision for the most active form of limitation
of therapy until death was 6.6 (1.5-31.7) hours for all patients, 14.3 (2.2-67.1) hours for
withholding, 4.0 (1.0-17.2) hours for withdrawing, and 3.5 (1.5-8.5) hours for shortening of
the dying process (P<.001) patients. Increasing doses of opiates and benzodiazepines were
associated with a shorter time to death (HR for morphine: 1.10 (95% CI: 1.04 – 1.16), HR for
diazepam: 1.12 (95% CI: 1.03 – 1.22) (Sprung, Ledoux et al. 2007). The study demonstrates
clinical differences between withholding and withdrawing treatments: withdrawal of therapy
was associated with earlier and more frequent mortality. Nevertheless, both withdrawing
and withholding of life support have widespread acceptance in Europe.
The Ethicus study demonstrated that end-of-life actions are routine in European ICUs. Life
support was limited in 3 out every 4 patients who died in the ICU. The choice of limiting
therapy rather than continuing life-sustaining therapy was related to patient age, acute and
chronic diagnoses, number of days in ICU, frequency of patient turnover, region, and
physician religion. The primary reasons given by physicians for the end-of-life decision
mostly concerned the patient’s medical condition (79%) (Sprung, Woodcock et al. 2007). Yet

89
the patient’s severity of illness on admission or at the time of decision-making was not
recorded.
Indeed, although outcome prediction models are naturally linked to end-of-life ethical
issues, only a small number of studies evaluated the relationship between end-of-life
decision and severity of illness models. A study, conducted in a heterogeneous intensive care
population from French ICUs, directly evaluated the relationship between provision outcome
probability and treatment limitation and reported only a small increase of withdrawal
decisions in patient who were predicted as very unlikely to survive (Knaus, Rauss et al. 1990).
Similarly, in the United States, providing objective probability estimates to the clinicians
treating severely ill head injured patients led to a reduced intensity of treatment in patients
unlikely to survive (Murray, Teasdale et al. 1993). On the contrary, the Study to Understand
Prognoses and Preferences for Treatment (SUPPORT) did not find change in treatment
among patients who were randomized to have their 6-month predicted mortality placed in
their medical record (Knaus, Harrell et al. 1995).
Potential benefit of outcome prediction models
One have to acknowledge that ICUs resource, in terms of number of beds and qualified staff
available, has limits and that resources the country can allocate to health care are not
unlimited. It therefore appears clearly that end-of-life decisions in the intensive care have an
important societal impact. ICU physicians make daily decisions to limit or withdraw life-
sustaining treatment, to write do-not-resuscitate order or to decide which patient will get
the remaining ICU bed. Several reasons support the idea that outcome prediction tools could
potentially help physicians taking the most adequate decisions based on patient’s likelihood
of benefiting from treatment. Acting this way will not dehumanize decision-making process
but, rather, help eliminate physician reliance on emotional, heuristic, poorly calibrated, or
overly pessimistic subjective estimates. Previous studies demonstrated that end-of-life
decisions were difficult in up to 72% of discussions (Sharma 2004); using severity models
may also help reducing physicians’ burdens related with end-of-life decisions. Outcome
prediction models may be more equitable for patients since they do not incorporate value-
based judgments to decide whether one life has more worth than another. Finally, outcome

90
models may facilitate end-of-life discussion with families, making them more comfortable
with decisions taken based on objective indices.
Barrier to the use of outcome prediction models
Among the many limitations to the use of outcome prediction models for medical decision
making, Benato et al. quote the following: reliability, availability, relevance and physician’s
resistance (Barnato and Angus 2004).
The reliability issue is directly related to the prediction model. Even if this one performs very
well it can only, at best, predict whether a patient is more likely to die than another.
Prediction models will never be able to determine with 100% accuracy if a patient will die.
One major limit to the availability of prediction models is data collection. Not all ICUs can
afford to hire data manager or few hospitals have the technology to gather automatically
data from the medical records. Moreover most models predictions are based on data
collected after ICU admission and hence cannot inform admission decision. In addition
mortality prediction models usually require quite complex calculations which may make
their use uneasy. However the expansion of electronic medical records and the accessibility
to calculation through internet (www.sfar.org) make such processing readily accessible.
The utility of intensive care is not only a matter of survival. Quality of life after intensive care
is also of a great importance. The majority of prediction models that are available at present
only provide information on hospital survival which is certainly not the most relevant issue
for the patient and his family. Critical illness is indeed associated with a wide array of serious
and concerning long-term sequelae that interfere with optimal patient-centered outcomes.
Fried et al. showed that the majority of patients aged over 60 years and with a limited life
expectancy would not choose low or high-burden treatment if the outcome was survival
with severe functional or cognitive impairment (Fried, Bradley et al. 2002). This finding
suggests that the functional and cognitive outcomes of a given therapy play an even greater
part than mortality in patients’ preferences.
The lack of reliability, availability and relevance certainly contribute to physicians’ resistance
using information provided by outcome predictions models. However even if the
information was highly reliable, accessible and provided information that interest the most

91
patients and their families chances are high that clinicians would still be reluctant using
them. Yet, physicians do decide on the appropriateness of their treatments using their
subjective prediction which is doubtfully the best estimate. Various studies indeed showed
physician’s judgment is not always as accurate as one could wish and that models
outperform physicians (Chang, Lee et al. 1989; Knaus, Harrell et al. 1995). Finally one cannot
exclude the concern about loss of professional prestige or authority if physician had to
reconsider their own judgment according to objective estimates.

92

93
6 Conclusion and perspectives
The evaluation of hospital treatment outcomes is said to have begun in the late nineteenth
century with Florence Nightingale’s 1863 publication of notes on Hospitals (Nightingale
1863). In the early twentieth century, Ernest Codman challenged his surgical colleagues at
the Massachusetts General Hospital to evaluate the effects of specific intervention on
patient’s outcomes which he labelled the “end result idea” (Donabedian 1989). Ernest
Codman worked very hard along his life vainly trying to make his concept accepted by his
colleagues’ surgeons (Figure 11). Nightingale’s and Codman’s concept supported the idea
that there were two components to patient’s mortality: patient’s illness severity and the
effectiveness of clinical interventions they undergo.
Figure 11. Ernest Codman’s cartoon. At a meeting of the Suffolk County Medical Society dedicated to a "Discussion of Hospital Efficiency." Ernest Codman unveiled a cartoon which depicted the residents of Boston's Back Bay as an ostrich with its head deep in the sand, kicking back golden eggs of remunerative surgical interventions in the direction of Harvard's doctors (on the left), while the trustees of the Massachusetts General Hospital on one side of the river, and the president of the university on the other, cannot decide whether or not the truth about the inappropriateness of these interventions can be disclosed (on the right). Form Donabedian; The End Results of Health Care: Ernest Codman's Contribution to Quality Assessment and Beyond. - The Milbank Quarterly, 1989. 67(2): p. 233-256

94
Similarly, if outcome prediction models are supposed to be severity of illness models, they
cannot in fact completely distinguish patient’s risk and the degree to which the risk is
modified by treatments. As stated by Barnato and coworkers (Barnato and Angus 2004): “in
the absence of clinical trial in which patients with comparable severities are randomized to
no treatment versus standard of care, it is impossible to disentangle the relationship
between severity and treatment effectiveness”. Nevertheless these models do predict
mortality allowing calculation of risk adjusted mortality rates for groups of patients and
hence, the identification of quality outliers whose observed mortality exceeds their
predicted risk adjusted rate. One have however to be attentive that outcome prediction
models are developed on groups of patients aggregated from several ICUs of presumably
variable quality. They cannot therefore be considered as providing a benchmark of the
lowest expected mortality (mortality expected given the best possible treatments) but
instead comparisons allow the identification of ICUs performing above or below average.
Future directions
Models “Automated Data Collection Ready”
We have shown like other authors that accurate data collection is the keystone of outcome
prediction models (Holt, Bury et al. 1992; Goldhill and Sumner 1998; Polderman, Thijs et al.
1999; Ledoux, Finfer et al. 2005). With the expansion of electronic medical records,
automated data collection appears to be a natural way to improve data quality. However
outcome prediction models that are available at present were developed based on data
manually abstracted from the medical records and studies have shown that models
performance may be affected by automated data collection (Bosman, Oudemans van
Straaten et al. 1998; Suistomaa, Kari et al. 2000). Future model development could therefore
take into account the possibilities that new technologies offer.
Introducing new variables
Recent outcome prediction models have introduced new variables related to the health
condition preceding ICU admission such length of hospital stay before ICU, the presence of
an infection or the presence of intoxication (Le Gall, Neumann et al. 2005; Moreno, Metnitz
et al. 2005). However variables collected at the ICU level have barely changed over the past

95
twenty years (Table 19). In the present work we pointed out some variables that could be
worthwhile for outcome prediction models.
Table 19. Acute physiology variables of main outcome prediction models.
Variables APACHE
II APACHE
III SAPS
II MPM
II SAPS II exp
SAPS 3
MPM III
APACHE IV
1985 1991 1993 1993 2005 2005 2006 2007
Temperature X X X X X X Blood Pressure X X X X X X X X Heart rate X X X X X X X X Resp rate X X X Oxygenation X X X X X Glucose X X pHart X X X HCO3 X X X Na X X X X X K X X X Creatinine X X X X Urea X X X X Urine output X X X X Ht X X X WBC X X X X X X GCS X X X X X X X X Albumin X X Bilirubin X X X X X Platelets X
This table summarizes the acute physiology variables for the main outcome prediction
models. Off the 10 physiology variables of the SAPS 3 (2005), 7 are common to the SAPS II
(1993).
As discussed previously, the Glasgow coma scale is probably the weakest point of outcome
models as it cannot reliably applied in intubated patients. Neurological assessment has a
major weight in severity of illness models, therefore using an neurological assessment scale
such as the FOUR score (Wijdicks, Bamlet et al. 2005) that would better describe cerebral
impairment could improve models’ prediction.
The evaluation of renal function using serum creatinine is also subject to critique; mild renal
impairment often escapes recognition (Sarnak, Levey et al. 2003). Recent studies have
shown that Cystatin C is a better indicator of GFR (Newman, Thakkar et al. 1995; Coll, Botey
et al. 2000; O'Riordan, Webb et al. 2003) and a better risk marker than serum creatinine
(Shlipak, Sarnak et al. 2005; Ledoux, Monchi et al. 2007). Although further studies are

96
required, serum Cystatin C could advantageously replace serum creatinine in future outcome
prediction models.
Finally the use of biomarkers that could detect ischemia and heart failure – such as troponin
T and pro-BNP – might be of interest in a generic severity of illness model. The pro-BNP
could be of a particular interest, several publications have indeed shown to be related with a
poor outcome in diverse illness conditions (Aneja 2008; Sun, Sun et al. 2008; Svensson,
Gorst-Rasmussen et al. 2009).
Changing the endpoint.
Although short-term outcomes, such as hospital mortality, remain very important, they are
not likely to be adequate endpoints patient-centered outcomes. It is important that future
researches focus specifically on how critical illness and intensive care affects a patient’s and
relatives’ long-term health and well-being. In addition, future clinical trials on new therapies
should include long-term follow-up of survival as well as quality of life assessment and costs
of care evaluation.
In conclusion, although they present shortcomings, the use of outcome prediction models
should be promoted since they could help to improve the quality of intensive care. Some
countries have launched projects providing foundation for ICU performance assessment and
benchmarking at a national level (ICNARC ; de Keizer, Bonsel et al. 2000; Villers, Fulgencio et
al. 2006). A national project that would generate a database allowing ICUs benchmarking
aiming to care improvement would certainly be an asset. Such program should be endorsed
the by the national intensive care society. ICU performance assessment should indeed be
carried out by healthcare professionals in order to provide the Health Federal Public Service
reliable information on ICUs efficiency that would justify intensive care costs.

97
References
Anderson, R. J., M. O'Brien, et al. (1999). "Renal failure predisposes patients to adverse outcome after coronary artery bypass surgery. VA Cooperative Study #5." Kidney Int 55(3): 1057-62.
Aneja, R. (2008). "Myocardial dysfunction in sepsis: check a BNP!" Pediatr Crit Care Med 9(5): 545-6. Angus, D. C., W. T. Linde-Zwirble, et al. (1996). "The effect of managed care on ICU length of stay:
implications for medicare." Jama 276(13): 1075-82. Apolone, G., G. Bertolini, et al. (1996). "The performance of SAPS II in a cohort of patients admitted
to 99 Italian ICUs: results from GiViTI. Gruppo Italiano per la Valutazione degli interventi in Terapia Intensiva." Intensive Care Med 22(12): 1368-78.
Barnato, A. E. and D. C. Angus (2004). "Value and role of intensive care unit outcome prediction models in end-of-life decision making." Critical Care Clinics 20(3): 345-362.
Bastos, P. G., X. Sun, et al. (1996). "Application of the APACHE III prognostic system in Brazilian intensive care units: a prospective multicenter study." Intensive Care Med 22(6): 564-70.
Beck, D. H., G. B. Smith, et al. (2003). "External validation of the SAPS II, APACHE II and APACHE III prognostic models in South England: a multicentre study." Intensive Care Med 29(2): 249-56.
Beck, D. H., B. L. Taylor, et al. (1997). "Prediction of outcome from intensive care: a prospective cohort study comparing Acute Physiology and Chronic Health Evaluation II and III prognostic systems in a United Kingdom intensive care unit." Crit Care Med 25(1): 9-15.
Becker, R. B., J. E. Zimmerman, et al. (1995). "The use of APACHE III to evaluate ICU length of stay, resource use, and mortality after coronary artery by-pass surgery." J Cardiovasc Surg (Torino) 36(1): 1-11.
Bernard, G. R., J.-L. Vincent, et al. (2001). "Efficacy and Safety of Recombinant Human Activated Protein C for Severe Sepsis." N Engl J Med 344(10): 699-709.
Born, J. D., P. Hans, et al. (1982). "[Practical assessment of brain dysfunction in severe head trauma (author's transl)]." Neurochirurgie 28(1): 1-7.
Bosman, R. J., H. M. Oudemans van Straaten, et al. (1998). "The use of intensive care information systems alters outcome prediction." Intensive Care Medicine 24(9): 953-958.
Boyd, O. and M. Grounds (1994). "Can standardized mortality ratio be used to compare quality of intensive care unit performance?" Crit Care Med 22(10): 1706-9.
Brannen, A. L., II, L. J. Godfrey, et al. (1989). "Prediction of Outcome From Critical Illness: A Comparison of Clinical Judgment With a Prediction Rule." Arch Intern Med 149(5): 1083-1086.
Capuzzo, M., V. Valpondi, et al. (2000). "Validation of severity scoring systems SAPS II and APACHE II in a single-center population." Intensive Care Med 26(12): 1779-85.
Castella, X., A. Artigas, et al. (1995). "A comparison of severity of illness scoring systems for intensive care unit patients: results of a multicenter, multinational study. The European/North American Severity Study Group." Crit Care Med 23(8): 1327-35.
Chang, R. W., B. Lee, et al. (1989). "Accuracy of decisions to withdraw therapy in critically ill patients: clinical judgment versus a computer model." Crit Care Med 17(11): 1091-7.
Chen, L. M., C. M. Martin, et al. (1999). "Interobserver variability in data collection of the APACHE II score in teaching and community hospitals." Crit Care Med 27(9): 1999-2004.
Coll, E., A. Botey, et al. (2000). "Serum cystatin C as a new marker for noninvasive estimation of glomerular filtration rate and as a marker for early renal impairment." Am J Kidney Dis 36(1): 29-34.
Cressman, M. D., R. J. Heyka, et al. (1992). "Lipoprotein(a) is an independent risk factor for cardiovascular disease in hemodialysis patients." Circulation 86(2): 475-82.
Cullen, D. J., J. M. Civetta, et al. (1974). "Therapeutic intervention scoring system: a method for quantitative comparison of patient care." Crit Care Med 2(2): 57-60.

98
Damiano, A. M., M. Bergner, et al. (1992). "Reliability of a measure of severity of illness: acute physiology of chronic health evaluation--II." J Clin Epidemiol 45(2): 93-101.
de Keizer, N. F., G. J. Bonsel, et al. (2000). "The added value that increasing levels of diagnostic information provide in prognostic models to estimate hospital mortality for adult intensive care patients." Intensive Care Med 26(5): 577-84.
Dick, W., S. Pehl, et al. (1992). "Physician and nursing (personnel) requirements for ICUs. Therapeutic Intervention Scoring System (TISS) versus time requirements for patient care--a comparative study in an interdisciplinary surgical intensive care unit." Clin Intensive Care 3(3): 116-21.
Donabedian, A. (1989). "The End Results of Health Care: Ernest Codman's Contribution to Quality Assessment and Beyond." The Milbank Quarterly 67(2): 233-256.
Durmaz, I., S. Buket, et al. (1999). "Cardiac surgery with cardiopulmonary bypass in patients with chronic renal failure." J Thorac Cardiovasc Surg 118(2): 306-15.
ESC/ACC (2000). "Myocardial infarction redefined--A consensus document of The Joint European Society of Cardiology/American College of Cardiology Committee for the Redefinition of Myocardial Infarction." Eur Heart J 21(18): 1502-1513.
Finfer, S., D. R. Chittock, et al. (2009). "Intensive versus conventional glucose control in critically ill patients." N Engl J Med 360(13): 1283-97.
Finfer, S., R. Norton, et al. (2004). "The SAFE study: saline vs. albumin for fluid resuscitation in the critically ill." Vox Sang 87 Suppl 2: 123-31.
Fliser, D., F. Kronenberg, et al. (2005). "Asymmetric dimethylarginine and progression of chronic kidney disease: the mild to moderate kidney disease study." J Am Soc Nephrol 16(8): 2456-61.
Food and Drug Administration. (2001, 30-09-2003). " Xigris. Drotrecogin alfa (activated)." Retrieved 28-10-2004, 2004, from http://www.fda.gov/cder/foi/label/2001/droteli112101LB.pdf.
Franga, D. L., J. M. Kratz, et al. (2000). "Early and long-term results of coronary artery bypass grafting in dialysis patients." Ann Thorac Surg 70(3): 813-8; discussion 819.
Fried, T. R., E. H. Bradley, et al. (2002). "Understanding the treatment preferences of seriously ill patients." N Engl J Med 346(14): 1061-6.
Garland, A. (2005). "Improving the ICU: part 1." Chest 127(6): 2151-64. Gill, M. R., D. G. Reiley, et al. (2004). "Interrater reliability of Glasgow Coma Scale scores in the
emergency department." Annals of Emergency Medicine 43(2): 215-223. Glance, L. G., T. Osler, et al. (2000). "Effect of varying the case mix on the standardized mortality ratio
and W statistic: A simulation study." Chest 117(4): 1112-7. Goldhill, D. R. and A. Sumner (1998). "APACHE II, data accuracy and outcome prediction."
Anaesthesia 53(10): 937-43. Goldhill, D. R. and A. Sumner (1998). "Outcome of intensive care patients in a group of British
intensive care units." Crit Care Med 26(8): 1337-45. Goldhill, D. R. and P. S. Withington (1996). "The effect of casemix adjustment on mortality as
predicted by APACHE II." Intensive Care Med 22(5): 415-9. Gummert, J. F., A. Funkat, et al. (2009). "EuroSCORE overestimates the risk of cardiac surgery: results
from the national registry of the German Society of Thoracic and Cardiovascular Surgery." Clin Res Cardiol.
Gunning, K. and K. Rowan (1999). "ABC of intensive care: outcome data and scoring systems." Bmj 319(7204): 241-4.
Gupta, R. and V. K. Arora (2004). "Performance evaluation of APACHE II score for an Indian patient with respiratory problems." Indian J Med Res 119(6): 273-82.
Hariharan, V. and J. Paddle (2009). "Demographic changes over a 12-year period in intensive care." Critical Care 13(Suppl 1): P500.
Healey, C., T. M. Osler, et al. (2003). "Improving the Glasgow Coma Scale score: motor score alone is a better predictor." J Trauma 54(4): 671-8; discussion 678-80.

99
Hekmat, K., A. Kroener, et al. (2005). "Daily assessment of organ dysfunction and survival in intensive care unit cardiac surgical patients." Ann Thorac Surg 79(5): 1555-62.
Herget-Rosenthal, S., G. Marggraf, et al. (2004). "Early detection of acute renal failure by serum cystatin C." Kidney Int 66(3): 1115-22.
Higgins, T. L., D. Teres, et al. (2007). "Assessing contemporary intensive care unit outcome: an updated Mortality Probability Admission Model (MPM0-III)." Crit Care Med 35(3): 827-35.
Ho, K. M., K. Y. Lee, et al. (2007). "Comparison of Acute Physiology and Chronic Health Evaluation (APACHE) II score with organ failure scores to predict hospital mortality." Anaesthesia 62(5): 466-73.
Holt, A. W., L. K. Bury, et al. (1992). "Prospective evaluation of residents and nurses as severity score data collectors." Crit Care Med 20(12): 1688-91.
Hosmer, D. w. and S. Lemeshow (2000). Applied Logistic Regression. New York, Wiley-Interscience Publication.
Hsu, C. Y., G. M. Chertow, et al. (2002). "Methodological issues in studying the epidemiology of mild to moderate chronic renal insufficiency." Kidney Int 61(5): 1567-76.
ICNARC. "Intensive Care National Audit & Research Centre." Retrieved 22/04/2009, 2009, from http://www.icnarc.org/.
Jenkinson, C., A. Coulter, et al. (1993). "Short form 36 (SF36) health survey questionnaire: normative data for adults of working age." BMJ 306(6890): 1437-40.
Jernberg, T., B. Lindahl, et al. (2004). "Cystatin C: a novel predictor of outcome in suspected or confirmed non-ST-elevation acute coronary syndrome." Circulation 110(16): 2342-8.
Katsaragakis, S., K. Papadimitropoulos, et al. (2000). "Comparison of Acute Physiology and Chronic Health Evaluation II (APACHE II) and Simplified Acute Physiology Score II (SAPS II) scoring systems in a single Greek intensive care unit." Crit Care Med 28(2): 426-32.
Keene, A. R. and D. J. Cullen (1983). "Therapeutic Intervention Scoring System: update 1983." Crit Care Med 11(1): 1-3.
Kern, H. and W. J. Kox (1999). "Impact of standard procedures and clinical standards on cost-effectiveness and intensive care unit performance in adult patients after cardiac surgery." Intensive Care Med 25(12): 1367-73.
Khaitan, L., F. P. Sutter, et al. (2000). "Coronary artery bypass grafting in patients who require long-term dialysis." Ann Thorac Surg 69(4): 1135-9.
Knaus, W. (2005). "APACHE II." Retrieved 12/12/2007, 2007, from http://www.cerner.com/public/FileDownload.asp?LibraryID=24648&iphl=apachede:apaches:apache:apach:iye:II:ii:iy:.
Knaus, W. A., E. A. Draper, et al. (1985). "APACHE II: a severity of disease classification system." Crit Care Med 13(10): 818-29.
Knaus, W. A., E. A. Draper, et al. (1986). "An evaluation of outcome from intensive care in major medical centers." Ann Intern Med 104(3): 410-8.
Knaus, W. A., F. E. Harrell, Jr., et al. (1995). "The SUPPORT prognostic model. Objective estimates of survival for seriously ill hospitalized adults. Study to understand prognoses and preferences for outcomes and risks of treatments." Ann Intern Med 122(3): 191-203.
Knaus, W. A., A. Rauss, et al. (1990). "Do objective estimates of chances for survival influence decisions to withhold or withdraw treatment? The French Multicentric Group of ICU Research." Med Decis Making 10(3): 163-71.
Knaus, W. A., D. P. Wagner, et al. (1991). "The APACHE III prognostic system. Risk prediction of hospital mortality for critically ill hospitalized adults." Chest 100(6): 1619-36.
Knaus, W. A., D. P. Wagner, et al. (1991). "Short-term mortality predictions for critically ill hospitalized adults: science and ethics." Science 254(5030): 389-94.
Knaus, W. A., J. E. Zimmerman, et al. (1981). "APACHE-acute physiology and chronic health evaluation: a physiologically based classification system." Crit Care Med 9(8): 591-7.

100
Kruse, J. A., M. C. Thill-Baharozian, et al. (1988). "Comparison of clinical assessment with APACHE II for predicting mortality risk in patients admitted to a medical intensive care unit." Jama 260(12): 1739-42.
Kuhn, C., U. Muller-Werdan, et al. (2000). "Improved outcome of APACHE II score-defined escalating systemic inflammatory response syndrome in patients post cardiac surgery in 1996 compared to 1988-1990: the ESSICS-study pilot project." Eur J Cardiothorac Surg 17(1): 30-7.
Laureys, S., S. Majerus, et al. (2002). Assessing consciousness in critically ill patients. Yearbook of intensive care and emergency medicine. J. L. Vincent. Berlin ; New York, Springer-Verlag: 715-27.
. Laureys, S., F. Pellas, et al. (2005). "The locked-in syndrome : what is it like to be conscious but
paralyzed and voiceless?" Prog Brain Res 150: 495-511. Le Gall, J.-R. (2005). "The use of severity scores in the intensive care unit." Intensive Care Medicine
31(12): 1618-1623. Le Gall, J., S. Lemeshow, et al. (1995). "Customized probability models for early severe sepsis in adult
intensive care patients. Intensive Care Unit Scoring Group." Jama 273: 644 - 650. Le Gall, J., A. Neumann, et al. (2005). "Mortality prediction using SAPS II: an update for French
intensive care units." Critical Care 9(6): R645 - R652. Le Gall, J. R. (2000). "[The performance of intensive care services]." Bull Acad Natl Med 184(8): 1653-
63; discussion 1664. Le Gall, J. R., S. Lemeshow, et al. (1993). "A new Simplified Acute Physiology Score (SAPS II) based on
a European/North American multicenter study." Jama 270(24): 2957-63. Le Gall, J. R., P. Loirat, et al. (1983). "Simplified acute physiological score for intensive care patients."
Lancet 2(8352): 741. Le Gall, J. R., P. Loirat, et al. (1984). "A simplified acute physiology score for ICU patients." Crit Care
Med 12(11): 975-7. Le Gall, J. R., A. Neumann, et al. (2005). "Mortality prediction using SAPS II: an update for French
intensive care units." Crit Care 9(6): R645-52. Ledoux, D. (2008). Development of a prediction model for 1-year mortality after open heart surgery.
Institut de Statistique. Louvain-La-Neuve, Université catholique de Louvain Masters in statistics: 76.
Ledoux, D., J. L. Canivet, et al. (2008). "SAPS 3 admission score: an external validation in a general intensive care population." Intensive Care Med.
Ledoux, D., S. Finfer, et al. (2005). "Impact of operator expertise on collection of the APACHE II score and on the derived risk of death and standardized mortality ratio." Anaesth Intensive Care 33(5): 585-90.
Ledoux, D., M. Monchi, et al. (2007). "Cystatin C blood level as a risk factor for death after heart surgery." Eur Heart J 28(15): 1848-53.
Lemeshow, S., J. Klar, et al. (1994). "Mortality probability models for patients in the intensive care unit for 48 or 72 hours: a prospective, multicenter study." Crit Care Med 22(9): 1351-8.
Lemeshow, S., D. Teres, et al. (1988). "Refining intensive care unit outcome prediction by using changing probabilities of mortality." Crit Care Med 16(5): 470-7.
Lemeshow, S., D. Teres, et al. (1987). "A comparison of methods to predict mortality of intensive care unit patients." Crit Care Med 15(8): 715-22.
Lemeshow, S., D. Teres, et al. (1993). "Mortality Probability Models (MPM II) based on an international cohort of intensive care unit patients." Jama 270(20): 2478-86.
Lemeshow, S., D. Teres, et al. (1985). "A method for predicting survival and mortality of ICU patients using objectively derived weights." Crit Care Med 13(7): 519-25.
Levey, A. S. (1990). "Measurement of renal function in chronic renal disease." Kidney Int 38(1): 167-84.

101
Levey, A. S., J. P. Bosch, et al. (1999). "A more accurate method to estimate glomerular filtration rate from serum creatinine: a new prediction equation. Modification of Diet in Renal Disease Study Group." Ann Intern Med 130(6): 461-70.
Livingston, B. M., F. N. MacKirdy, et al. (2000). "Assessment of the performance of five intensive care scoring models within a large Scottish database." Crit Care Med 28(6): 1820-7.
Lu, T. M., Y. A. Ding, et al. (2003). "Plasma levels of asymmetrical dimethylarginine and adverse cardiovascular events after percutaneous coronary intervention." Eur Heart J 24(21): 1912-9.
Majerus, S., H. Gill-Thwaites, et al. (2005). "Behavioral evaluation of consciousness in severe brain damage." Prog Brain Res 150: 397-413.
Mallamaci, F., C. Zoccali, et al. (2002). "Hyperhomocysteinemia predicts cardiovascular outcomes in hemodialysis patients." Kidney Int 61(2): 609-14.
Malstam, J. and L. Lind (1992). "Therapeutic intervention scoring system (TISS)--a method for measuring workload and calculating costs in the ICU." Acta Anaesthesiol Scand 36(8): 758-63.
Markgraf, R., G. Deutschinoff, et al. (2000). "Comparison of acute physiology and chronic health evaluations II and III and simplified acute physiology score II: a prospective cohort study evaluating these methods to predict outcome in a German interdisciplinary intensive care unit." Crit Care Med 28(1): 26-33.
Martinez-Alario, J., I. D. Tuesta, et al. (1999). "Mortality prediction in cardiac surgery patients: comparative performance of Parsonnet and general severity systems." Circulation 99(18): 2378-82.
Metnitz, P. G., T. Lang, et al. (2000). "Ratios of observed to expected mortality are affected by differences in case mix and quality of care." Intensive Care Med 26(10): 1466-72.
Metnitz, P. G., R. P. Moreno, et al. (2005). "SAPS 3-From evaluation of the patient to evaluation of the intensive care unit. Part 1: Objectives, methods and cohort description." Intensive Care Med 31(10): 1336-44.
Metnitz, P. G., A. Valentin, et al. (1999). "Prognostic performance and customization of the SAPS II: results of a multicenter Austrian study. Simplified Acute Physiology Score." Intensive Care Med 25(2): 192-7.
Miranda, D. R. (1999). "Outcome assessment--TISS as a tool to evaluate cost-effectiveness of immunological treatment." Eur J Surg Suppl(584): 51-5.
Miranda, D. R., A. de Rijk, et al. (1996). "Simplified Therapeutic Intervention Scoring System: the TISS-28 items--results from a multicenter study." Crit Care Med 24(1): 64-73.
Moran, J. L., P. Bristow, et al. (2008). "Mortality and length-of-stay outcomes, 1993-2003, in the binational Australian and New Zealand intensive care adult patient database." Crit Care Med 36(1): 46-61.
Moreno, R., D. R. Miranda, et al. (1998). "Evaluation of two outcome prediction models on an independent database." Crit Care Med 26(1): 50-61.
Moreno, R. and P. Morais (1997). "Outcome prediction in intensive care: results of a prospective, multicentre, Portuguese study." Intensive Care Med 23(2): 177-86.
Moreno, R. and P. Morais (1997). "Validation of the simplified therapeutic intervention scoring system on an independent database." Intensive Care Med 23(6): 640-4.
Moreno, R. and D. Reis Miranda (1998). "Nursing staff in intensive care in Europe: the mismatch between planning and practice." Chest 113(3): 752-8.
Moreno, R. P., P. G. Metnitz, et al. (2005). "SAPS 3-From evaluation of the patient to evaluation of the intensive care unit. Part 2: Development of a prognostic model for hospital mortality at ICU admission." Intensive Care Med 31(10): 1345-1355.
Moreno, R. P., P. G. Metnitz, et al. (2005). "SAPS 3. Electronic Supplementary Material." Retrieved 8-11-2007, 2007, from http://www.springerlink.com/content/k101329015377474/134_2005_Article_2763_ESM.html.

102
Murray, L. S., G. M. Teasdale, et al. (1993). "Does prediction of outcome alter patient management?" Lancet 341(8859): 1487-91.
Nashef, S. A., F. Roques, et al. (1999). "European system for cardiac operative risk evaluation (EuroSCORE)." Eur J Cardiothorac Surg 16(1): 9-13.
Newman, D. J., H. Thakkar, et al. (1995). "Serum cystatin C measured by automated immunoassay: a more sensitive marker of changes in GFR than serum creatinine." Kidney Int 47(1): 312-8.
Nightingale, F. (1863). Notes on Hospitals. G. Longman, Longman Roberts, and Green. Nilsson, J., L. Algotsson, et al. (2006). "Comparison of 19 pre-operative risk stratification models in
open-heart surgery." Eur Heart J: ehi720. Nouira, S., M. Belghith, et al. (1998). "Predictive value of severity scoring systems: comparison of four
models in Tunisian adult intensive care units." Crit Care Med 26(5): 852-9. O'Riordan, S. E., M. C. Webb, et al. (2003). "Cystatin C improves the detection of mild renal
dysfunction in older patients." Ann Clin Biochem 40(Pt 6): 648-55. Osswald, B. R., V. Gegouskov, et al. (2009). "Overestimation of aortic valve replacement risk by
EuroSCORE: implications for percutaneous valve replacement." Eur Heart J 30(1): 74-80. Parolari, A., L. L. Pesce, et al. (2009). "Performance of EuroSCORE in CABG and off-pump coronary
artery bypass grafting: single institution experience and meta-analysis." Eur Heart J 30(3): 297-304.
Parsonnet, V., D. Dean, et al. (1989). "A method of uniform stratification of risk for evaluating the results of surgery in acquired adult heart disease." Circulation 79(6 Pt 2): I3-12.
Penta de Peppo, A., P. Nardi, et al. (2002). "Cardiac surgery in moderate to end-stage renal failure: analysis of risk factors." Ann Thorac Surg 74(2): 378-83.
Perna, A. F., F. Acanfora, et al. (2004). "Hyperhomocysteinemia and cardiovascular disease in uremia: the newest evidence in epidemiology and mechanisms of action." Semin Nephrol 24(5): 426-30.
Perrone, R. D., N. E. Madias, et al. (1992). "Serum creatinine as an index of renal function: new insights into old concepts." Clin Chem 38(10): 1933-53.
Polderman, K. H., A. R. Girbes, et al. (2001). "Accuracy and reliability of APACHE II scoring in two intensive care units Problems and pitfalls in the use of APACHE II and suggestions for improvement." Anaesthesia 56(1): 47-50.
Polderman, K. H., E. M. Jorna, et al. (2001). "Inter-observer variability in APACHE II scoring: effect of strict guidelines and training." Intensive Care Med 27(8): 1365-9.
Polderman, K. H., L. G. Thijs, et al. (1999). "Interobserver variability in the use of APACHE II scores." Lancet 353(9150): 380.
Randers, E., J. H. Kristensen, et al. (1998). "Serum cystatin C as a marker of the renal function." Scand J Clin Lab Invest 58(7): 585-92.
Rapoport, J., D. Teres, et al. (1994). "A method for assessing the clinical performance and cost-effectiveness of intensive care units: a multicenter inception cohort study." Crit Care Med 22(9): 1385-91.
Rapoport, J., D. Teres, et al. (2003). "Length of stay data as a guide to hospital economic performance for ICU patients." Med Care 41(3): 386-97.
Ridley, S. (1998). "Severity of illness scoring systems and performance appraisal." Anaesthesia 53: 1185 - 1194.
Rivera-Fernandez, R., G. Vazquez-Mata, et al. (1998). "The Apache III prognostic system: customized mortality predictions for Spanish ICU patients." Intensive Care Med 24(6): 574-81.
Rivers, E., B. Nguyen, et al. (2001). "Early Goal-Directed Therapy in the Treatment of Severe Sepsis and Septic Shock." N Engl J Med 345(19): 1368-1377.
Roques, F., S. A. Nashef, et al. (1999). "Risk factors and outcome in European cardiac surgery: analysis of the EuroSCORE multinational database of 19030 patients." Eur J Cardiothorac Surg 15(6): 816-22; discussion 822-3.

103
Rothen, H. U., K. Stricker, et al. (2007). "Variability in outcome and resource use in intensive care units." Intensive Care Med 33(8): 1329-36.
Rothen, H. U. and J. Takala (2008). "Can outcome prediction data change patient outcomes and organizational outcomes?" Curr Opin Crit Care 14(5): 513-9.
Rowan, K. M., J. H. Kerr, et al. (1993). "Intensive Care Society's APACHE II study in Britain and Ireland--I: Variations in case mix of adult admissions to general intensive care units and impact on outcome." Bmj 307(6910): 972-7.
Rowan, K. M., J. H. Kerr, et al. (1993). "Intensive Care Society's APACHE II study in Britain and Ireland--II: Outcome comparisons of intensive care units after adjustment for case mix by the American APACHE II method." Bmj 307(6910): 977-81.
Sarnak, M. J., A. S. Levey, et al. (2003). "Kidney disease as a risk factor for development of cardiovascular disease: a statement from the American Heart Association Councils on Kidney in Cardiovascular Disease, High Blood Pressure Research, Clinical Cardiology, and Epidemiology and Prevention." Hypertension 42(5): 1050-65.
Sechi, L. A., L. Zingaro, et al. (1998). "Increased serum lipoprotein(a) levels in patients with early renal failure." Ann Intern Med 129(6): 457-61.
Sela, S., R. Shurtz-Swirski, et al. (2005). "Primed Peripheral Polymorphonuclear Leukocyte: A Culprit Underlying Chronic Low-Grade Inflammation and Systemic Oxidative Stress in Chronic Kidney Disease." J Am Soc Nephrol.
Sharma, B. R. (2004). "Withholding and withdrawing of life support: a medicolegal dilemma." Am J Forensic Med Pathol 25(2): 150-5.
Sherck, J. P. and C. H. Shatney (1996). "ICU scoring systems do not allow prediction of patient outcomes or comparison of ICU performance." Crit Care Clin 12(3): 515-23.
Shlipak, M. G., M. J. Sarnak, et al. (2005). "Cystatin C and the risk of death and cardiovascular events among elderly persons." N Engl J Med 352(20): 2049-60.
Sprung, C. L., S. L. Cohen, et al. (2003). "End-of-life practices in European intensive care units: the Ethicus Study." Jama 290(6): 790-7.
Sprung, C. L., D. Ledoux, et al. (2007). "Relieving suffering or intentionally hastening death: Where do you draw the line?*." Crit Care Med.
Sprung, C. L., T. Woodcock, et al. (2007). "Reasons, considerations, difficulties and documentation of end-of-life decisions in European intensive care units: the ETHICUS Study." Intensive Care Med.
Stubbs, P., M. Seed, et al. (1998). "Lipoprotein(a) as a risk predictor for cardiac mortality in patients with acute coronary syndromes." Eur Heart J 19(9): 1355-64.
Suistomaa, M., A. Kari, et al. (2000). "Sampling rate causes bias in APACHE II and SAPS II scores." Intensive Care Med 26(12): 1773-8.
Sun, L., Y. Sun, et al. (2008). "Predictive role of BNP and NT-proBNP in hemodialysis patients." Nephron Clin Pract 110(3): c178-84.
Surgenor, S. D., G. T. O'Connor, et al. (2001). "Predicting the risk of death from heart failure after coronary artery bypass graft surgery." Anesth Analg 92(3): 596-601.
Svensson, M., A. Gorst-Rasmussen, et al. (2009). "NT-pro-BNP is an independent predictor of mortality in patients with end-stage renal disease." Clin Nephrol Volume 71(April): 380-386.
Sznajder, M., P. Aegerter, et al. (2001). "A cost-effectiveness analysis of stays in intensive care units." Intensive Care Med 27(1): 146-53.
Teasdale, G. and B. Jennett (1974). "Assessment of coma and impaired consciousness. A practical scale." Lancet 2(7872): 81-4.
Teres, D., R. B. Brown, et al. (1982). "Predicting mortality of intensive care unit patients. The importance of coma." Crit Care Med 10(2): 86-95.
The EuroQOL Group (1990). "EuroQol--a new facility for the measurement of health-related quality of life. The EuroQol Group." Health Policy 16(3): 199-208.

104
van de Wal, R. M., B. L. van Brussel, et al. (2005). "Mild preoperative renal dysfunction as a predictor of long-term clinical outcome after coronary bypass surgery." J Thorac Cardiovasc Surg 129(2): 330-5.
van den Berghe, G., P. Wouters, et al. (2001). "Intensive insulin therapy in the critically ill patients." N Engl J Med 345(19): 1359-67.
Villers, D., J. P. Fulgencio, et al. (2006). "Performance en réanimation : résultats du PHRC Sfar-SRLF." Annales Françaises d'Anesthésie et de Réanimation 25(11-12): 1111-1118.
Wagner, D. P., E. A. Draper, et al. (1984). "Initial international use of APACHE. An acute severity of disease measure." Med Decis Making 4(3): 297-313.
Wagner, D. P., W. A. Knaus, et al. (1983). "Statistical validation of a severity of illness measure." Am J Public Health 73(8): 878-84.
Wallace, T. W., S. M. Abdullah, et al. (2006). "Prevalence and Determinants of Troponin T Elevation in the General Population." Circulation 113(16): 1958-1965.
Ward, N. S., J. E. Snyder, et al. (2004). "Comparison of a commercially available clinical information system with other methods of measuring critical care outcomes data." Journal of Critical Care 19(1): 10-15.
Weerasinghe, A., P. Hornick, et al. (2001). "Coronary artery bypass grafting in non-dialysis-dependent mild-to-moderate renal dysfunction." J Thorac Cardiovasc Surg 121(6): 1083-9.
Wijdicks, E. F. (2006). "Clinical scales for comatose patients: the Glasgow Coma Scale in historical context and the new FOUR Score." Rev Neurol Dis 3(3): 109-17.
Wijdicks, E. F., W. R. Bamlet, et al. (2005). "Validation of a new coma scale: The FOUR score." Ann Neurol 58(4): 585-93.
Wolf, C. A., E. F. M. Wijdicks, et al. (2007). "Further Validation of the FOUR Score Coma Scale by Intensive Care Nurses." Mayo Clinic Proceedings 82(4): 435-438.
World Health Organisation. (2009, 2009). "The World Health Report 2003." Retrieved 22/04/2009, from http://www.who.int/whr/2003/en/Annex2-en.pdf.
Zimmerman, J. E., A. A. Kramer, et al. (2006). "Acute Physiology and Chronic Health Evaluation (APACHE) IV: hospital mortality assessment for today's critically ill patients." Crit Care Med 34(5): 1297-310.
Zimmerman, J. E., A. A. Kramer, et al. (2006). "Intensive care unit length of stay: Benchmarking based on Acute Physiology and Chronic Health Evaluation (APACHE) IV." Crit Care Med 34(10): 2517-29.
Zimmerman, J. E., D. P. Wagner, et al. (1998). "Evaluation of acute physiology and chronic health evaluation III predictions of hospital mortality in an independent database." Crit Care Med 26(8): 1317-26.

105
7 Appendix I – scientific papers
1. Impact of operator expertise on collection of the APACHE II score and on the derived risk of death and standardized mortality ratio. Ledoux D, Finfer S, McKinley S. Anaesthesia and Intensive Care (2005) 33(5): 585-90.
2. SAPS 3 admission score: an external validation in a general intensive care population. Ledoux D, Canivet J-L, Preiser J-C, Lefrancq J, Damas P. Intensive Care Medicine (2008) 34(10): 1873-7.
3. Quantifying consciousness. Laureys S, Piret S, Ledoux D. Lancet Neurology (2005)4(12): 789-90.
4. Cystatin C blood level as a risk factor for death after heart surgery. Ledoux D, Monchi M, Chapelle J-P, Damas P. European Heart Journal (2007)28(15): 1848-53.
5. End-of-life practices in European intensive care units: the Ethicus Study. Sprung C, Cohen S, Sjokvist P, Baras M, Bulow H, Hovilehto S, Ledoux D, Lippert A, Maia P, Phelan D, Schobersberger W, Wennberg E, Woodcock T. Journal of the American Medical Association (2003). 290(6): 790-7
6. Relieving suffering or intentionally hastening death: where do you draw the line? Sprung C, Ledoux D, Bulow H, Lippert A, Wennberg E, Baras M, Ricou B, Sjokvist P, Wallis C, Maia P, Thijs L, Solsona Duran J. Critical Care Medicine (2008). 36(1): 8-13.
7. Reasons, considerations, difficulties and documentation of end-of-life decisions in European intensive care units: the ETHICUS Study. Sprung C, Woodcock T, Sjokvist P, Ricou B, Bulow H, Lippert A, Maia P, Cohen S, Baras M, Hovilehto S, Ledoux D, Phelan D, Wennberg E, Schobersberger W. Intensive Care Medicine (2008) 34(2): 271-7.

169
8 Appendix II – Contribution to other scientific articles.
1. The Dying Human: Perspectives from Biomedicine, Bruno M-A, Ledoux D, and Laureys S (2009) In: The study of dying: Western scientific and social thought. Cambridge University Press: Cambridge. p. (in press).
2. Functional connectivity in the default network during resting state is preserved in a vegetative but not in a brain dead patient. Boly M, Tshibanda L, Vanhaudenhuyse A, Noirhomme Q, Schnakers C, Ledoux D, Boveroux P, Garweg C, Lambermont B, Phillips C, Luxen A, Moonen G, Bassetti C, Maquet P, Laureys S Human Brain Mapping, in press
3. Dualism Persists in the Science of Mind Demertzi A, Liew C, Ledoux D, Bruno M-A, Laureys S, Zeman A Annals of the New York Academy of Sciences, 2009. 1157: p. 1-9
4. The Dying Human: Perspectives from Biomedicine. The study of dying: Western scientific and social thought. Bruno, M.-A., Ledoux D., Laureys S. (2009). Cambridge, Cambridge University Press: (in press).
5. Voluntary brain processing in disorders of consciousness. Schnakers, C., F. Perrin, et al. (2008). Neurology 71(20): 1614-20.
6. Diagnostic and prognostic use of bispectral index in coma, vegetative state and related disorders. Schnakers C, Ledoux D, Majerus S, Damas P, Damas F, Lambermont B, Lamy M, Boly M, Vanhaudenhuyse A, Moonen G, Laureys S. (2008). Brain Inj 22(12): 926-31.
7. Les échelles d'évaluation des états de conscience altérée. Ledoux D, Piret S, Boveroux P, Bruno M-A, Vanhaudenhuyse A, Damas P, Moonen G, Laureys S (2008). Réanimation 17(7): 695-701.
8. Predicting prognosis in post-anoxic coma. Kirsch M, Boveroux P, Massion P, Sadzot B, Boly M, Lambermont B, Lamy M, Damas P, Damas F, Moonen G, Laureys S, Ledoux D. (2008). Rev Med Liege 63(5-6): 263-8.
9. Cerebral subarachnoid blood migration consecutive to a lumbar haematoma after spinal anaesthesia. Hans G. A., Senard M, Ledoux D, Grayet B, Scholtes F, Creemers E, Lamy M. L. (2008). Acta Anaesthesiol Scand.
10. Neuroimaging activation studies in the vegetative state: predictors of recovery? Di H, Boly M, Weng X, Ledoux D, Laureys S (2008). Clin Med 8(5): 502-7.

170
11. Intensive care unit acquired infection and organ failure. Damas P, Ledoux D, Nys M, Monchi M, Wiesen P, Beauve B, Preiser J-C. (2008). Intensive Care Med.
12. Pain assessment in non-communicative patients. Chatelle C, Vanhaudenhuyse A, Mergam A. N., De Val M., Majerus S, Boly M, Bruno M. A., Boveroux P, Demertzi A, Gosseries O, Ledoux D, Peigneux P, Salmon E, Moonen G, Faymonville M. E., Laureys S. (2008). Rev Med Liege 63(5-6): 429-37.
13. Life with Locked-In syndrome. Bruno M-A, Pellas F, Bernheim J. L., Ledoux D, Goldman S, Demertzi A, Majerus S, Vanhaudenhuyse A, Blandin V, Boly M, Boveroux P, Moonen G, Laureys S, Schnakers C. (2008). Rev Med Liege 63(5-6): 445-51.
14. Évaluation du pronostic neurologique dans les encéphalopathies postanoxiques. Boveroux P, Kirsch M, Boly M, Massion P, Sadzot B, Lambermont B, Lancellotti P, Piret S, Damas P, Damas F, Moonen G, Laureys S, Ledoux D. (2008). Réanimation 17(7): 613-617.
15. Behavioural assessment and functional neuro-imaing in vegetative state patients. Vanhaudenhuyse A, Schnakers C, Boly M, Bruno M-A, Gosseries O, Cologan V, Boveroux P, Ledoux D, Piret S, Phillips C, Moonen G, Luxen A, Maquet P, Bredart S, Laureys S. (2007). Rev Med Liege 62 Spec No: 15-20.
16. Combination therapy versus monotherapy: a randomised pilot study on the evolution of inflammatory parameters after ventilator associated pneumonia. Damas P, Garweg C, Monchi M, Nys M, Canivet J-L, Ledoux D, Preiser J-C. (2006). Crit Care 10(2): R52.
17. Selection of resistance during sequential use of preferential antibiotic classes. Damas P, Canivet J-L, Ledoux D, Monchi M, Melin P, Nys M, De Mol P. (2006). Intensive Care Med 32(1): 67-74.
18. “Fulminant" endocarditis due to Staphyloccocus aureus. Wiesen P, Piret S, Ledoux D, Radermecker M, Canivet J-L. (2005) Rev Med Liege 60(12): 915-7.
19. Effect of hydroxyethylstarch on renal function in cardiac surgery: a large scale retrospective study. Wiesen P, Canivet J-L, Ledoux D, Roediger L, Damas P. (2005). Acta Anaesthesiol Belg 56(3): 257-63.
20. End-of-life practices in European intensive care units. Bulow H. H., Lippert A, Sprung C, Cohen M. B., Sjokvist P, Baras M, Hovilehto S, Ledoux D, Maia P, Phelan D, Schobersberger W, Wennberg E, Woodcock T. (2005). Ugeskr Laeger 167(14): 1522-5.
21. The use of protocols for nutritional support is definitely needed in the intensive care unit.

171
Preiser, J. C. and D. Ledoux (2004). Crit Care Med 32(11): 2354-5.
22. Citrate vs. heparin for anticoagulation in continuous venovenous hemofiltration: a prospective randomized study. Monchi M, Berghmans D, Ledoux D, Canivet J-L, Dubois B, Damas P. (2004). Intensive Care Med 30(2): 260-5.
23. Bronchoalveolar lavage fluids of ventilated patients with acute lung injury activate NF-kappaB in alveolar epithelial cell line: role of reactive oxygen/nitrogen species and cytokines. Nys M, Deby-Dupont G, Habraken Y, Legrand-Poels S, Kohnen S, Ledoux D, Canivet J-L, Damas P, Lamy M. (2003). Nitric Oxide 9(1): 33-43.
24. Occurrence of MRSA endocarditis during linezolid treatment. Ben Mansour E. H., Jacob E, Monchi M, Ledoux D, Canivet J-L, De Mol P, Damas P. (2003). Eur J Clin Microbiol Infect Dis 22(6): 372-3.
25. A comparison of 0.1% and 0.2% ropivacaine and bupivacaine combined with morphine for postoperative patient-controlled epidural analgesia after major abdominal surgery. Senard M, Joris J. L., Ledoux D, Toussaint P. J., Lahaye-Goffart B, Lamy M. L., Senard M., Joris J. L. (2002). Anesth Analg 95(2): 444-9, table of contents.
26. Bronchoalveolar lavage fluids of patients with lung injury activate the transcription factor nuclear factor-kappaB in an alveolar cell line. Nys M, Deby-Dupont G, Habraken Y, Legrand-Poels S, Ledoux D, Canivet J-L, Damas P, Lamy M. (2002). Clin Sci (Lond) 103(6): 577-85.
27. Image of the month. Compensatory liver growth following right liver lobe transplantation in a liver donor and adult recipient. Detry O, De Roover A, Coimbra C, Delwaide J, Joris J, Ledoux D, Meurisse M, Honore P. (2002). Rev Med Liege 57(9): 565-6.
28. Severity scoring systems in the the ICU. Description, utilization, and potential. Ledoux, D., J. L. Canivet, Damas P. (2001). Rev Med Liege 56(6): 427-30.
29. Correlation between endotoxin level and bacterial count in bronchoalveolar lavage fluid of ventilated patients. Nys M, Ledoux D, Canivet J-L, De Mol P, Lamy M, Damas P. (2000). Crit Care Med 28(8): 2825-30.
30. Nitrated proteins in bronchoalveolar lavage fluid of patients at risk of ventilator-associated bronchopneumonia. Mathy-Hartert M, Damas P, Nys M, Deby-Dupont G, Canivet J-L, Ledoux D, Lamy M. (2000).

172
Eur Respir J 16(2): 296-301.
31. Hemodynamic effects of epinephrine associated to an epidural clonidine-bupivacaine mixture during combined lumbar epidural and general anesthesia. Senard M, Ledoux D, Darmon P. L., Hans P, Brichant J-F, Bonnet F. (1998). Acta Anaesthesiol Belg 49(3): 167-73.
32. Effect of plasma anticonvulsant level on pipecuronium-induced neuromuscular blockade: preliminary results. Hans P, Ledoux D, Bonhomme V, Brichant J-F. (1995). J Neurosurg Anesthesiol 7(4): 254-8.
33. Cytokine serum level during severe sepsis in human IL-6 as a marker of severity. Damas P, Ledoux D, Nys M, Vrindts Y, De Groote D, Franchimont P, Lamy M. (1992). Ann Surg 215(4): 356-62.
