control data to estimate resource estimation · ‐ compositing errors ... •fundamental sampling...
TRANSCRIPT
1
Using Quality Control Data to Estimate Uncertainties in Resource Estimation
Dennis ArnePrincipal Consultant – Geochemistry (Vancouver)
Matthew CobbPrincipal Consultant – Resources (Perth)
CIM Conference, Montreal, Canada, May 2, 2017
www.csaglobal.com
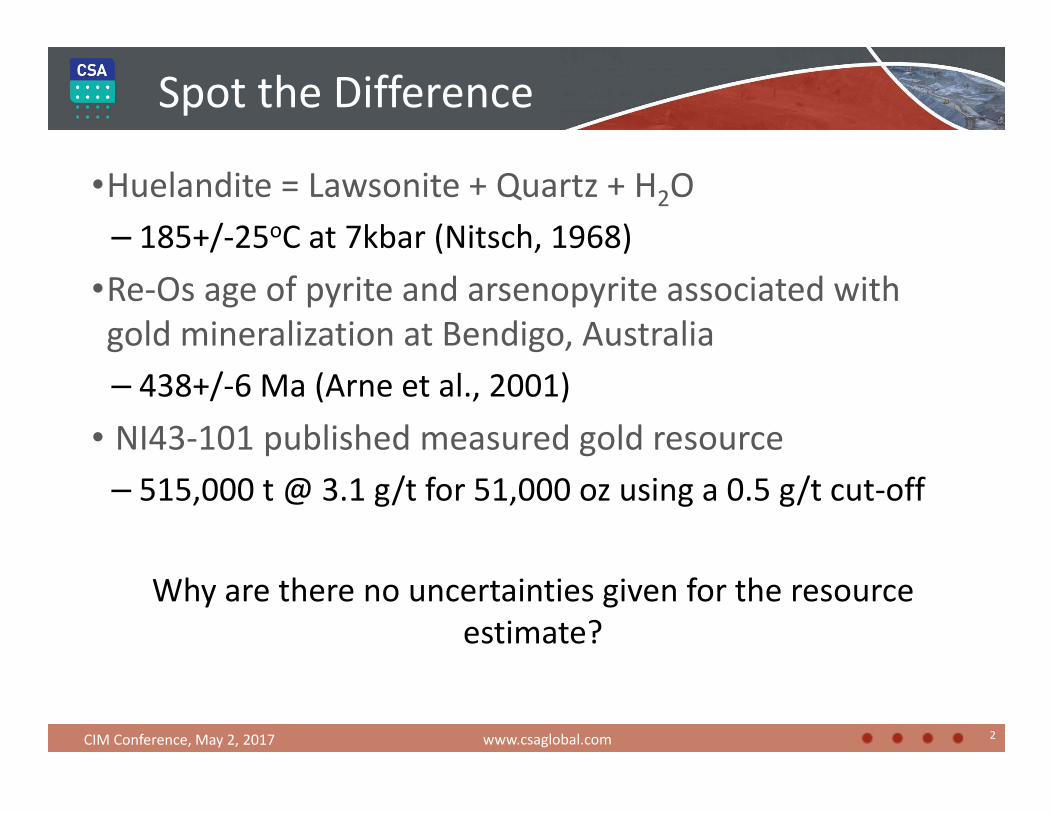
Spot the Difference
•Huelandite = Lawsonite + Quartz + H2O
– 185+/‐25oC at 7kbar (Nitsch, 1968)•Re‐Os age of pyrite and arsenopyrite associated with gold mineralization at Bendigo, Australia – 438+/‐6 Ma (Arne et al., 2001)
• NI43‐101 published measured gold resource– 515,000 t @ 3.1 g/t for 51,000 oz using a 0.5 g/t cut‐off
Why are there no uncertainties given for the resource estimate?
2www.csaglobal.comCIM Conference, May 2, 2017
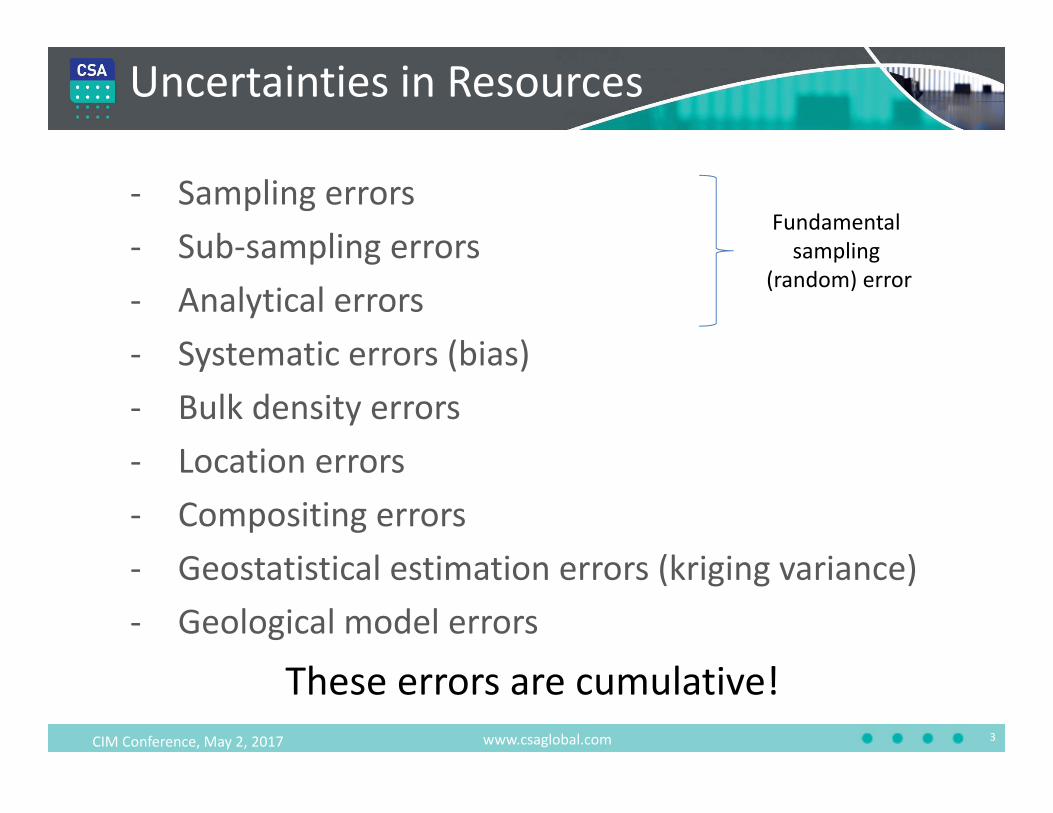
‐ Sampling errors‐ Sub‐sampling errors‐ Analytical errors‐ Systematic errors (bias)‐ Bulk density errors‐ Location errors‐ Compositing errors‐ Geostatistical estimation errors (kriging variance)‐ Geological model errors
3
Uncertainties in Resources
Fundamental sampling
(random) error
www.csaglobal.comCIM Conference, May 2, 2017
These errors are cumulative!
www.csaglobal.comCIM Conference, May 2, 2017 4
Outline
•Why do we do QAQC?• How do we do QAQC?• How to quantify accuracy and precision of assay data.•What are acceptable results?• Fundamental sampling errors and resource estimation.
• Conclusions
Why do we do QAQC?
5
Short answer – because we have to
Official answer – to provide confidence in assay data
www.csaglobal.comCIM Conference, May 2, 2017
Best answer – to help minimise uncertainties in resource estimates
6
How do we do QAQC?
• Certified or standard reference materials for accuracy• Duplicates for precision (repeatability)• Coarse blanks for cross contamination
• Check samples for systematic bias• Note two levels of QA review – batch and project
• Apply to both assays and bulk densities
www.csaglobal.comCIM Conference, May 2, 2017
www.csaglobal.comCIM Conference, May 2, 2017
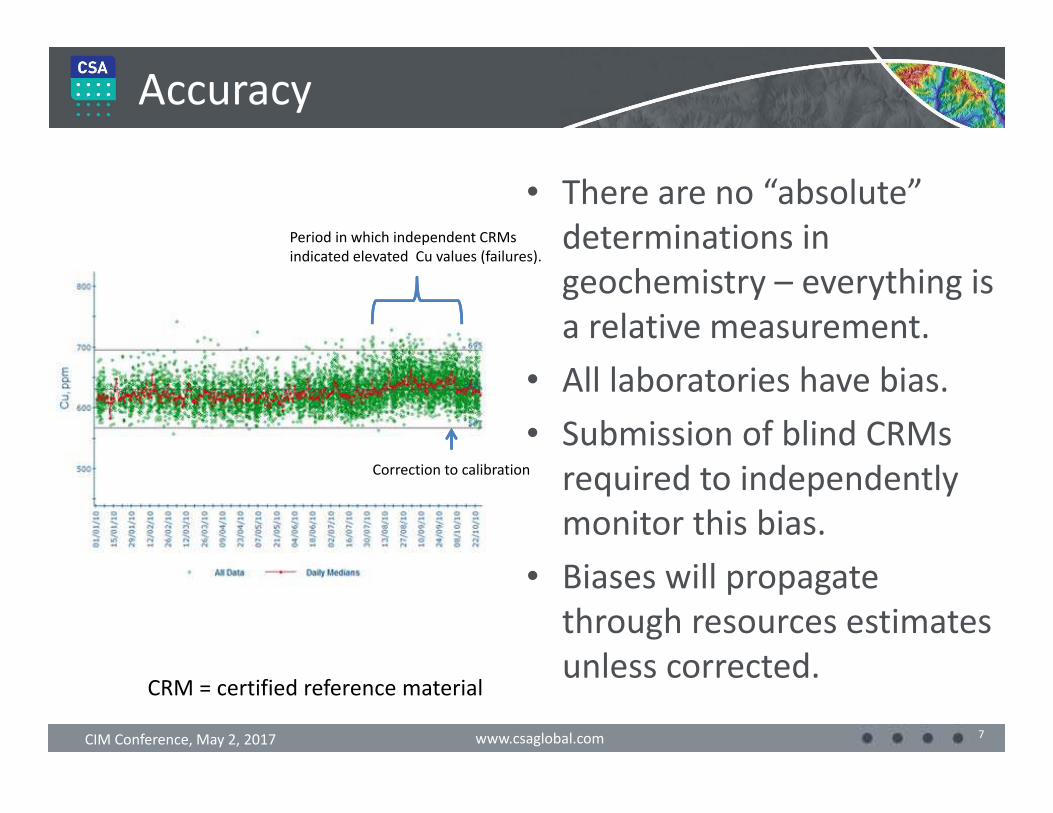
• There are no “absolute” determinations in geochemistry – everything is a relative measurement.
• All laboratories have bias.• Submission of blind CRMs required to independently monitor this bias.
• Biases will propagate through resources estimates unless corrected.
7
Accuracy
Period in which independent CRMs
indicated elevated Cu values (failures).
Correction to calibration
CRM = certified reference material
Bias Shift
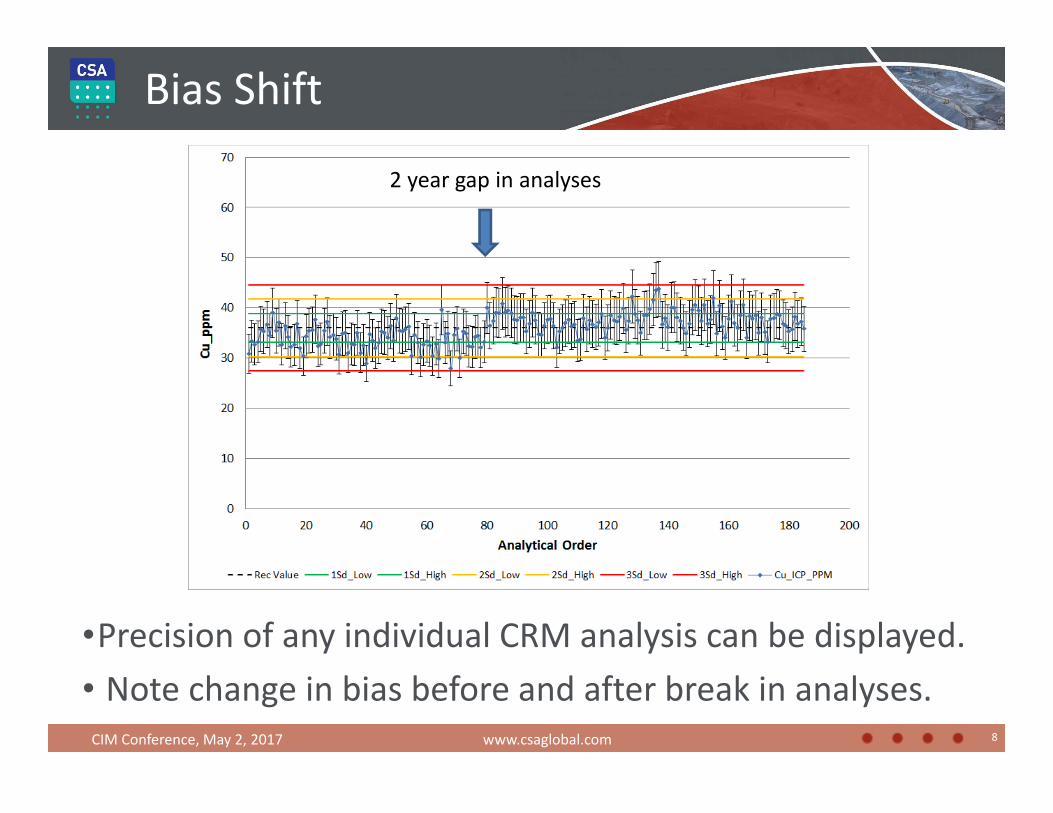
•Precision of any individual CRM analysis can be displayed.• Note change in bias before and after break in analyses.
8
2 year gap in analyses
www.csaglobal.comCIM Conference, May 2, 2017
9
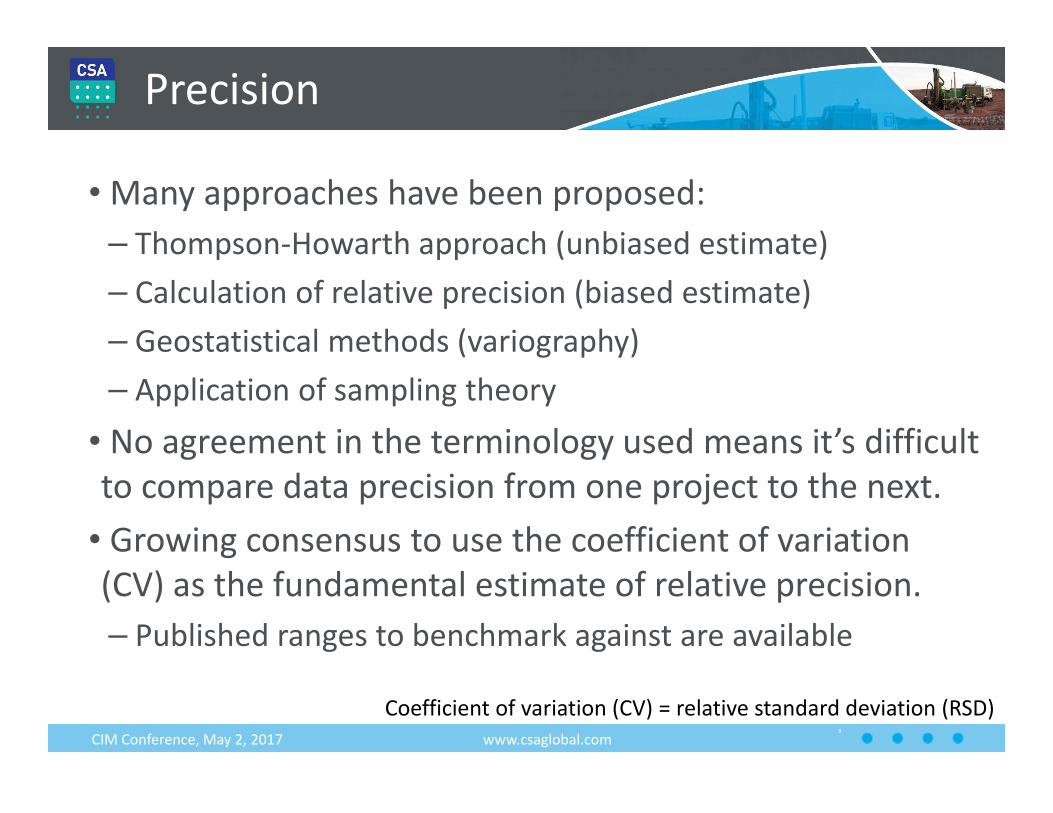
• Many approaches have been proposed:– Thompson‐Howarth approach (unbiased estimate)
– Calculation of relative precision (biased estimate)
– Geostatistical methods (variography)– Application of sampling theory
• No agreement in the terminology used means it’s difficult to compare data precision from one project to the next.
• Growing consensus to use the coefficient of variation (CV) as the fundamental estimate of relative precision.– Published ranges to benchmark against are available
Precision
www.csaglobal.comCIM Conference, May 2, 2017
Coefficient of variation (CV) = relative standard deviation (RSD)
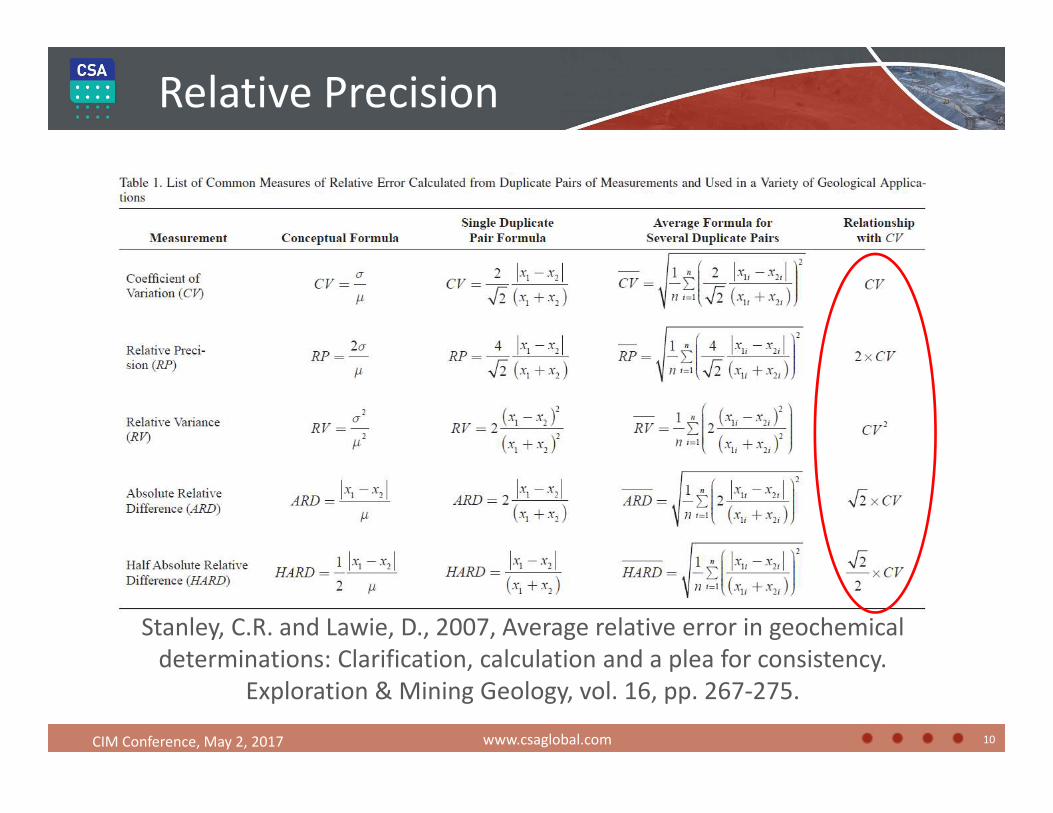
Relative Precision
10
Stanley, C.R. and Lawie, D., 2007, Average relative error in geochemical determinations: Clarification, calculation and a plea for consistency.
Exploration & Mining Geology, vol. 16, pp. 267‐275.
www.csaglobal.comCIM Conference, May 2, 2017
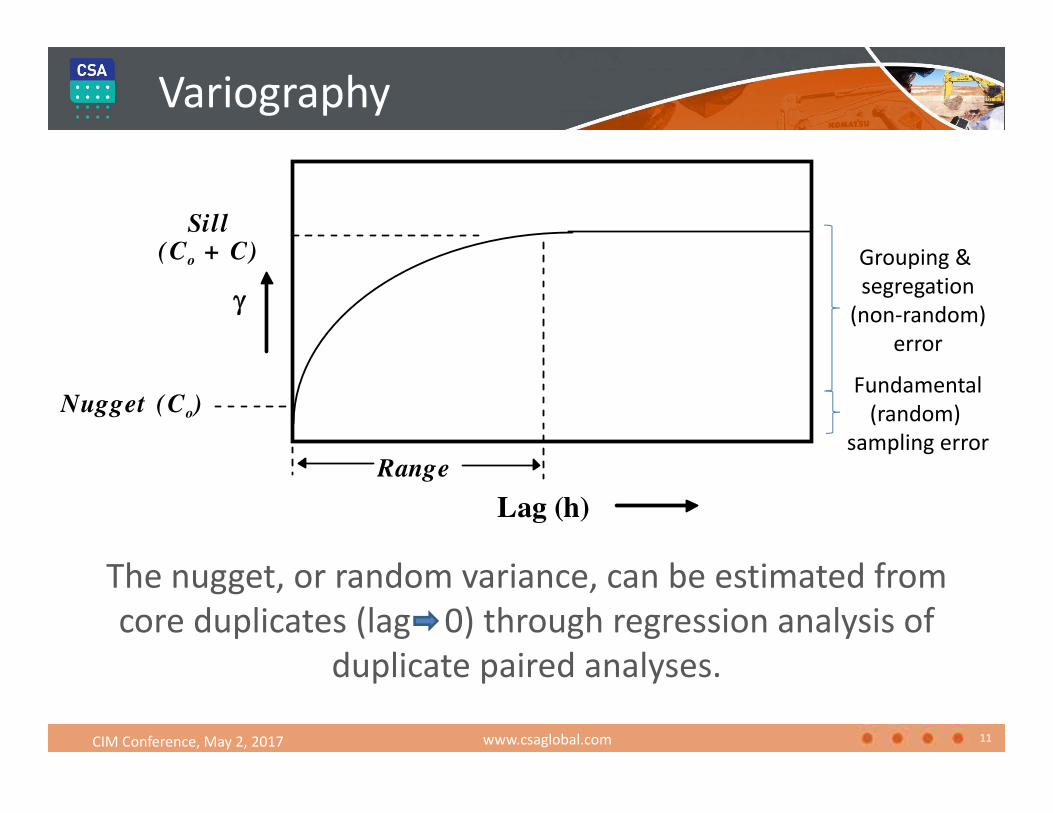
The nugget, or random variance, can be estimated from core duplicates (lag 0) through regression analysis of
duplicate paired analyses.
Variography
11
Lag (h)
Sill(Co + C)
Nugget (Co)
Range
Fundamental
(random) sampling error
Grouping & segregation
(non‐random)
error
www.csaglobal.comCIM Conference, May 2, 2017
www.csaglobal.comCIM Conference, May 2, 2017
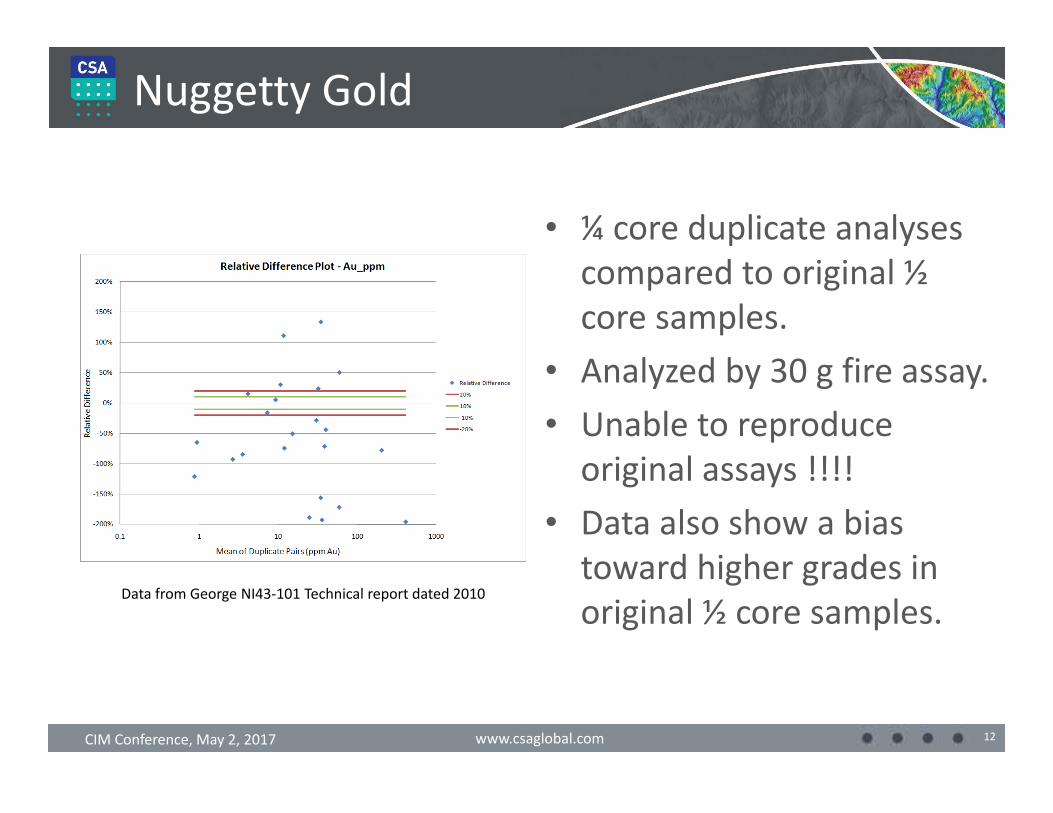
• ¼ core duplicate analyses compared to original ½ core samples.
• Analyzed by 30 g fire assay.• Unable to reproduce original assays !!!!
• Data also show a bias toward higher grades in original ½ core samples.
12
Nuggetty Gold
Data from George NI43‐101 Technical report dated 2010
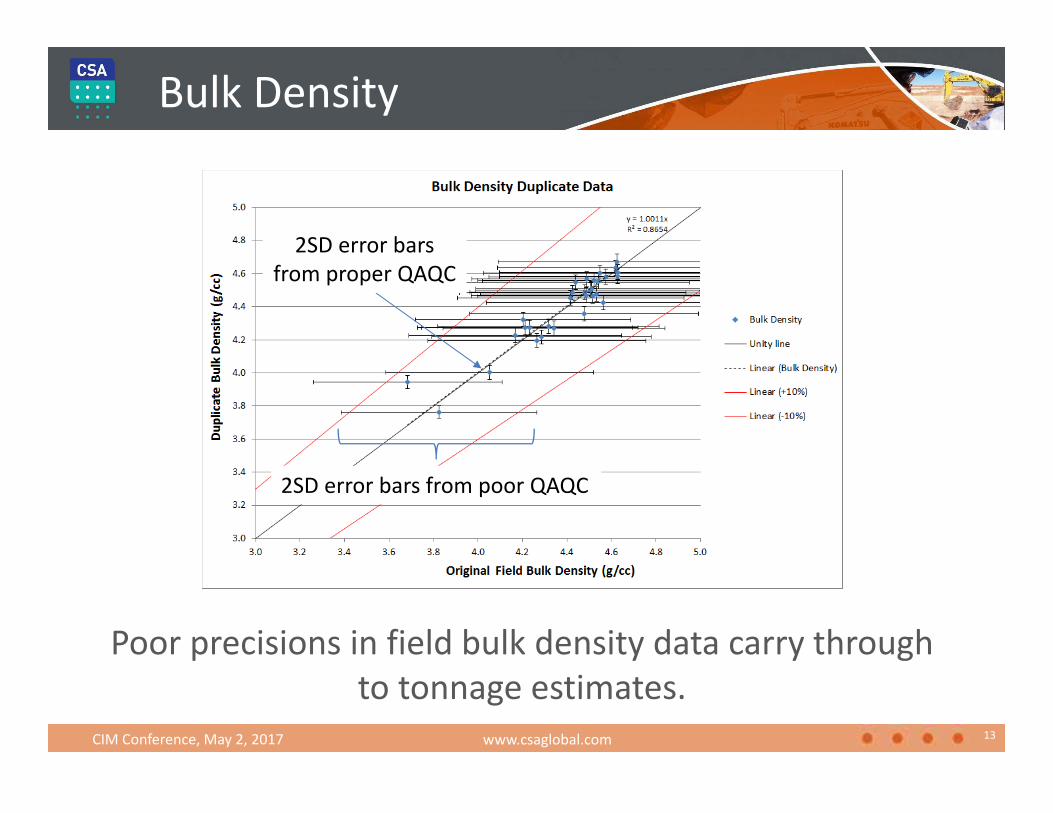
Bulk Density
13
Poor precisions in field bulk density data carry through to tonnage estimates.
2SD error bars from poor QAQC
2SD error barsfrom proper QAQC
www.csaglobal.comCIM Conference, May 2, 2017
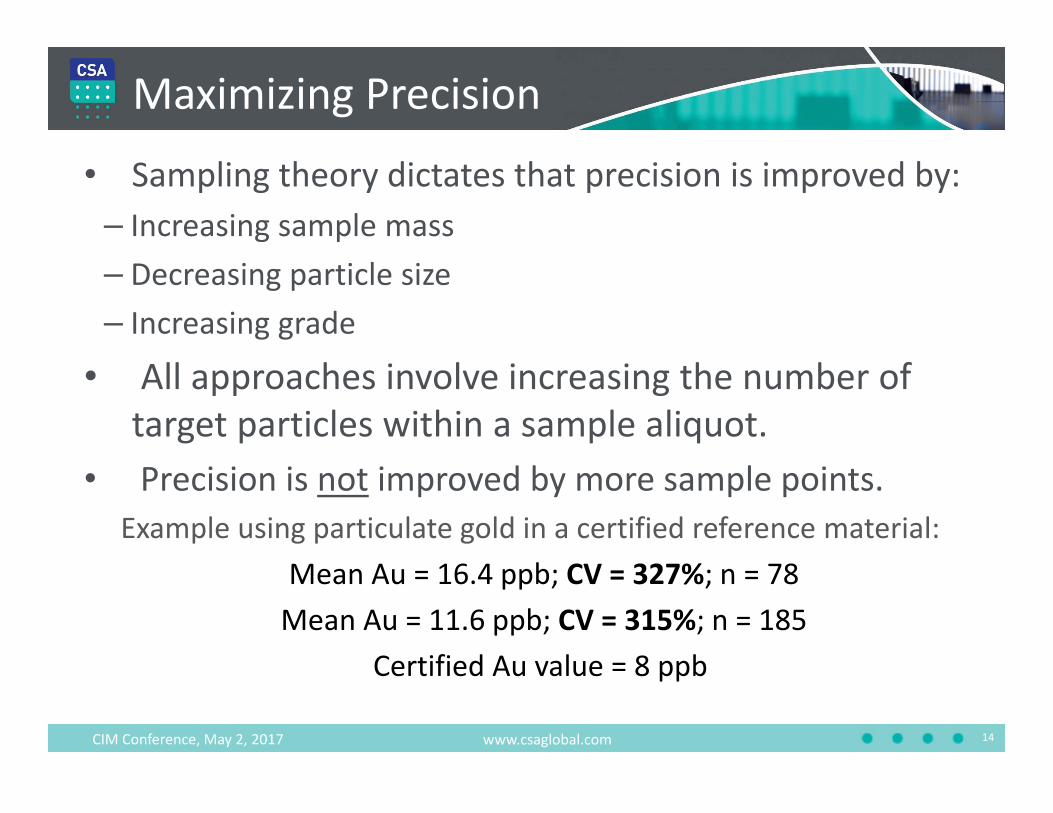
Maximizing Precision
14
• Sampling theory dictates that precision is improved by:– Increasing sample mass
– Decreasing particle size– Increasing grade
• All approaches involve increasing the number of target particles within a sample aliquot.
• Precision is not improved by more sample points.Example using particulate gold in a certified reference material:
Mean Au = 16.4 ppb; CV = 327%; n = 78Mean Au = 11.6 ppb; CV = 315%; n = 185
Certified Au value = 8 ppb
www.csaglobal.comCIM Conference, May 2, 2017
www.csaglobal.comCIM Conference, May 2, 2017
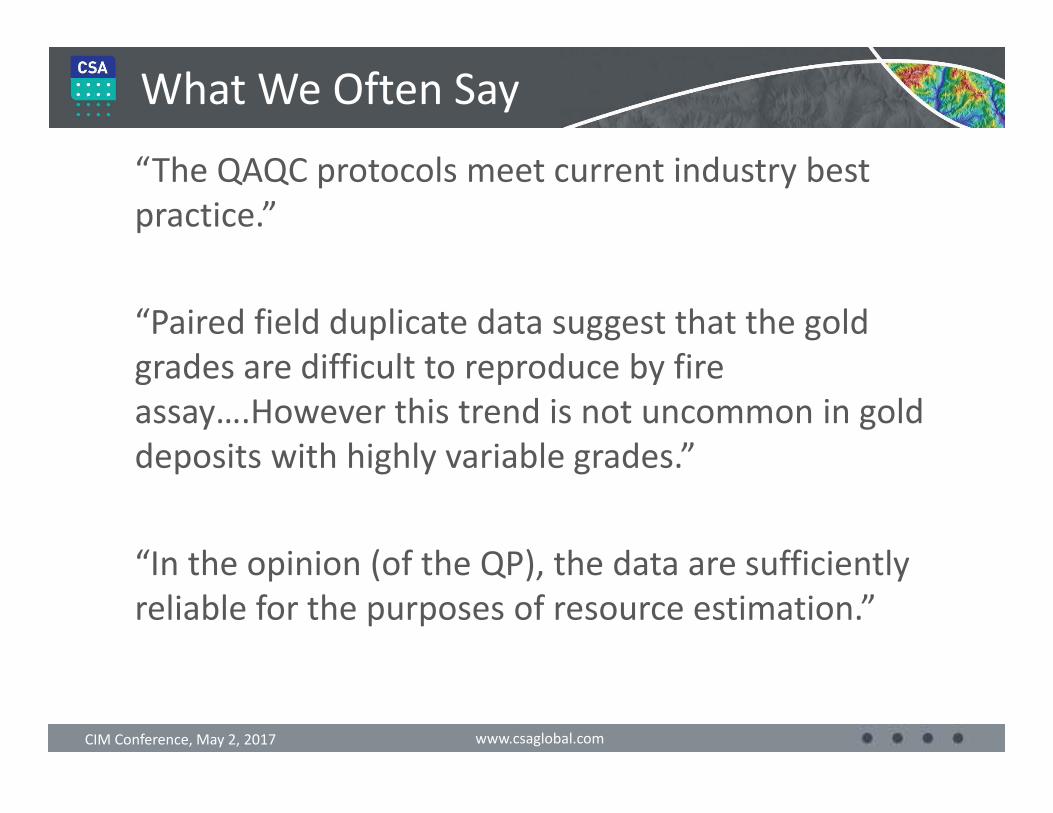
“The QAQC protocols meet current industry best practice.”
“Paired field duplicate data suggest that the gold grades are difficult to reproduce by fire assay….However this trend is not uncommon in gold deposits with highly variable grades.”
“In the opinion (of the QP), the data are sufficiently reliable for the purposes of resource estimation.”
15
What We Often Say

16
What are acceptable levels of accuracy and precision?
www.csaglobal.comCIM Conference, May 2, 2017
Increasing assay data accuracy, precision
and relevance
Figure 1 from JORC 2012
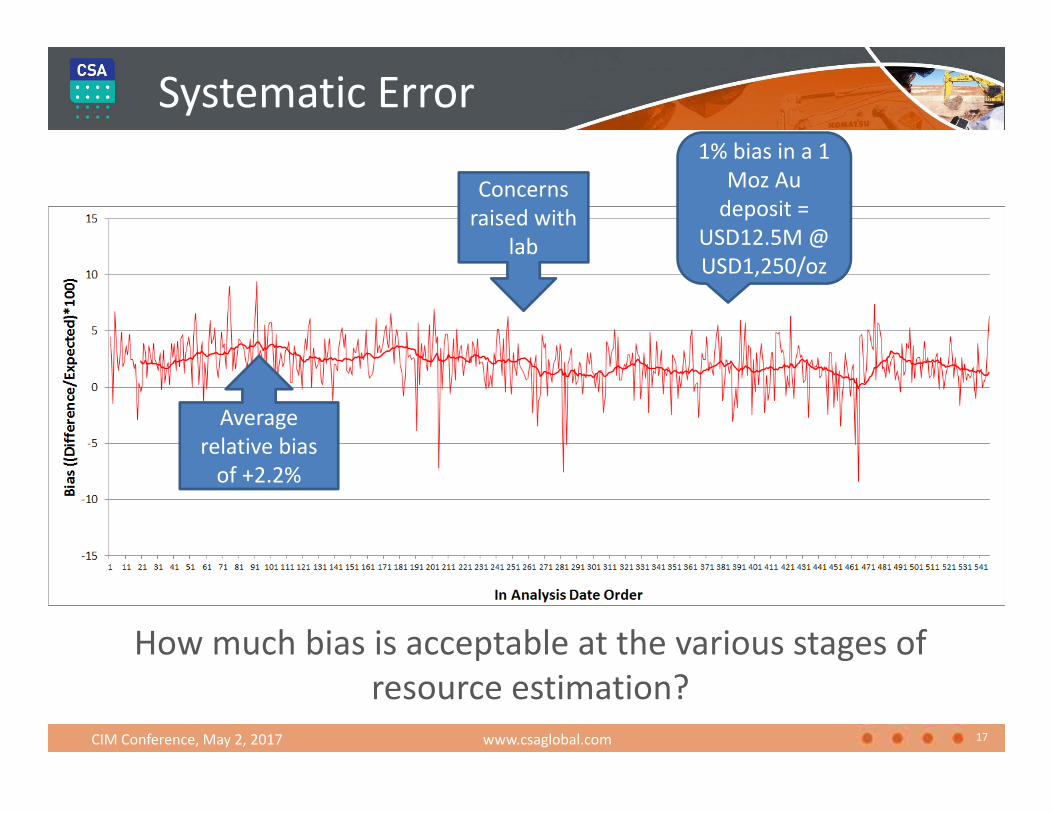
Systematic Error
17www.csaglobal.comCIM Conference, May 2, 2017
How much bias is acceptable at the various stages of resource estimation?
1% bias in a 1 Moz Au deposit =
USD12.5M @ USD1,250/oz
Average relative bias of +2.2%
Concerns raised with
lab
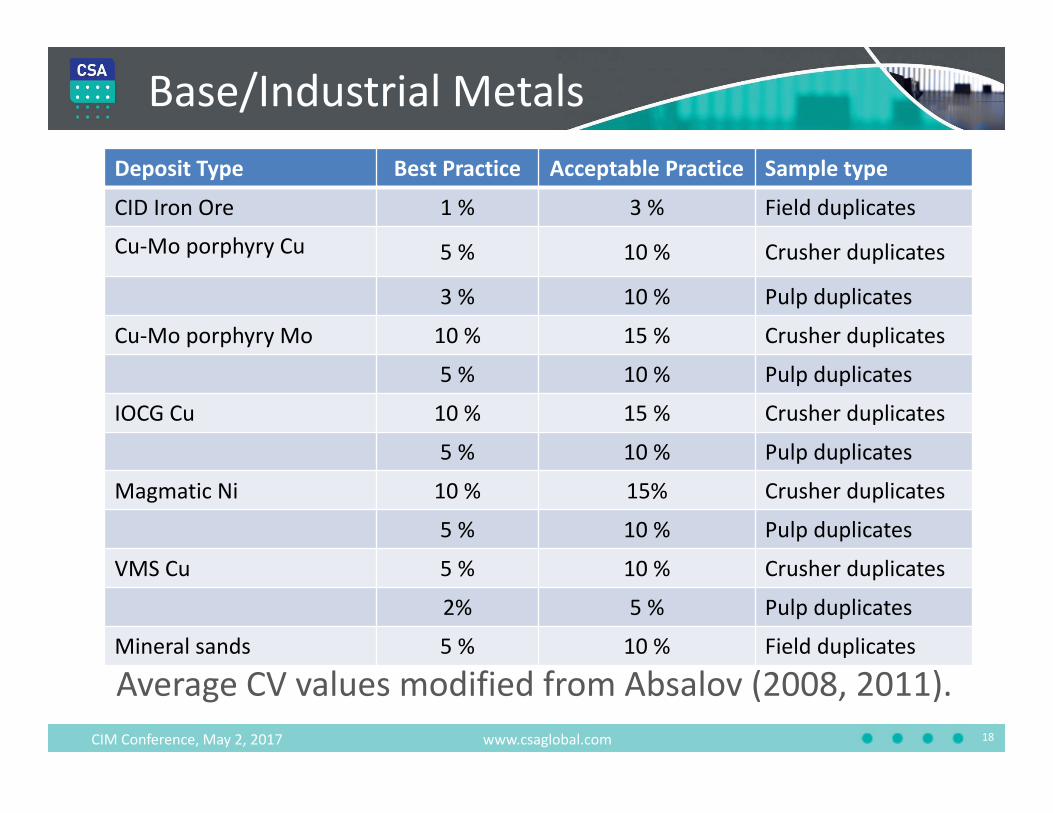
Average CV values modified from Absalov (2008, 2011).
Deposit Type Best Practice Acceptable Practice Sample type
CID Iron Ore 1 % 3 % Field duplicates
Cu‐Mo porphyry Cu 5 % 10 % Crusher duplicates
3 % 10 % Pulp duplicates
Cu‐Mo porphyry Mo 10 % 15 % Crusher duplicates
5 % 10 % Pulp duplicates
IOCG Cu 10 % 15 % Crusher duplicates
5 % 10 % Pulp duplicates
Magmatic Ni 10 % 15% Crusher duplicates
5 % 10 % Pulp duplicates
VMS Cu 5 % 10 % Crusher duplicates
2% 5 % Pulp duplicates
Mineral sands 5 % 10 % Field duplicates
Base/Industrial Metals
18www.csaglobal.comCIM Conference, May 2, 2017
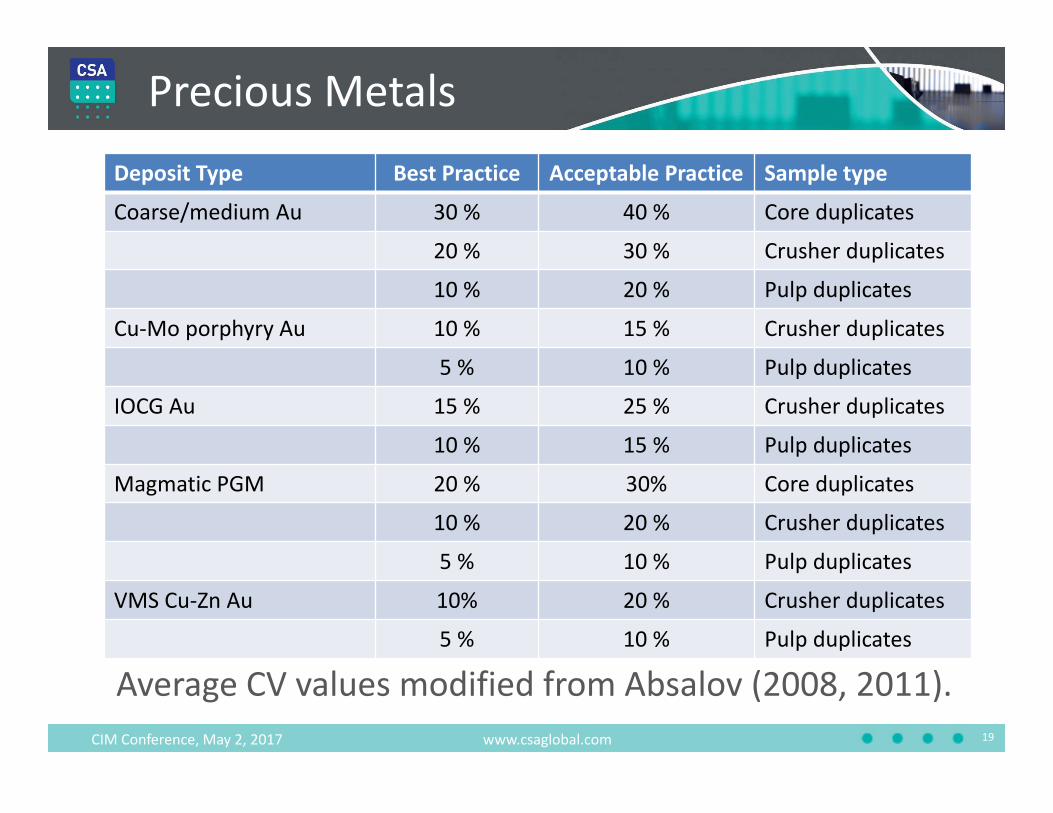
Average CV values modified from Absalov (2008, 2011).
Deposit Type Best Practice Acceptable Practice Sample type
Coarse/medium Au 30 % 40 % Core duplicates
20 % 30 % Crusher duplicates
10 % 20 % Pulp duplicates
Cu‐Mo porphyry Au 10 % 15 % Crusher duplicates
5 % 10 % Pulp duplicates
IOCG Au 15 % 25 % Crusher duplicates
10 % 15 % Pulp duplicates
Magmatic PGM 20 % 30% Core duplicates
10 % 20 % Crusher duplicates
5 % 10 % Pulp duplicates
VMS Cu‐Zn Au 10% 20 % Crusher duplicates
5 % 10 % Pulp duplicates
Precious Metals
19www.csaglobal.comCIM Conference, May 2, 2017
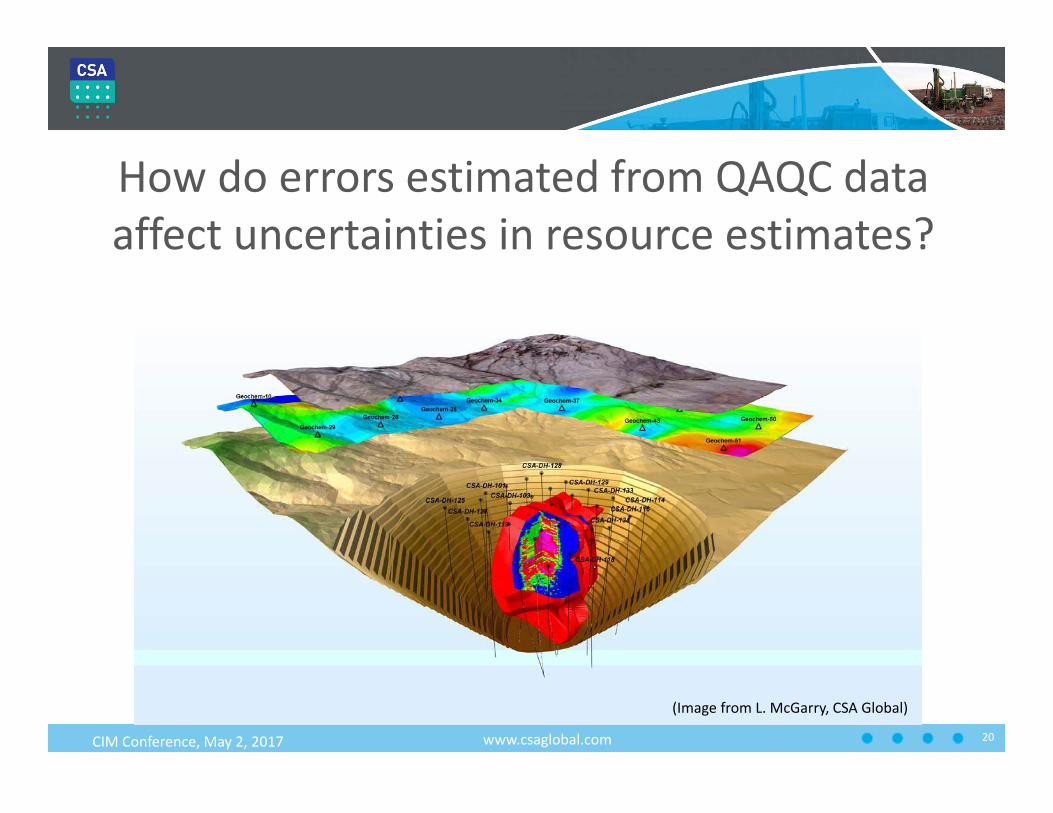
20
How do errors estimated from QAQC data affect uncertainties in resource estimates?
www.csaglobal.comCIM Conference, May 2, 2017
(Image from L. McGarry, CSA Global)
www.csaglobal.comCIM Conference, May 2, 2017 21
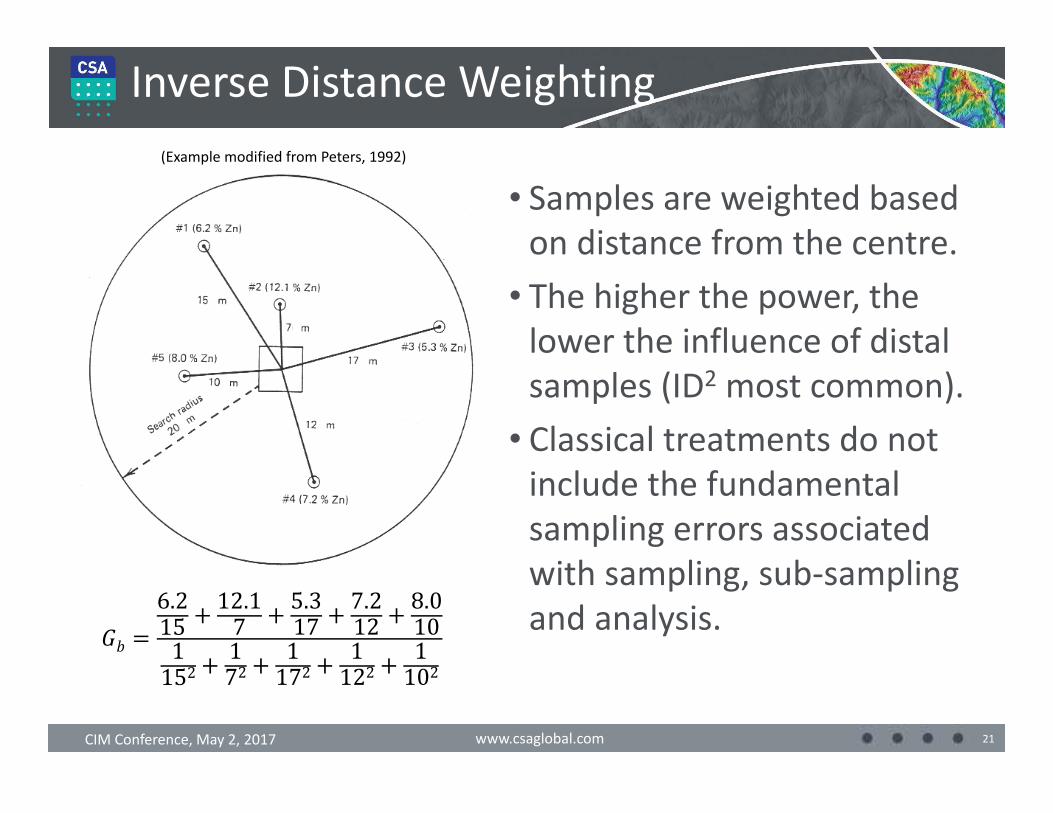
Inverse Distance Weighting
(Example modified from Peters, 1992)
6.215 12.17 5.317 7.212 8.0101152 172 1172 1122 1102
• Samples are weighted based on distance from the centre.
• The higher the power, the lower the influence of distal samples (ID2 most common).
• Classical treatments do not include the fundamental sampling errors associated with sampling, sub‐sampling and analysis.
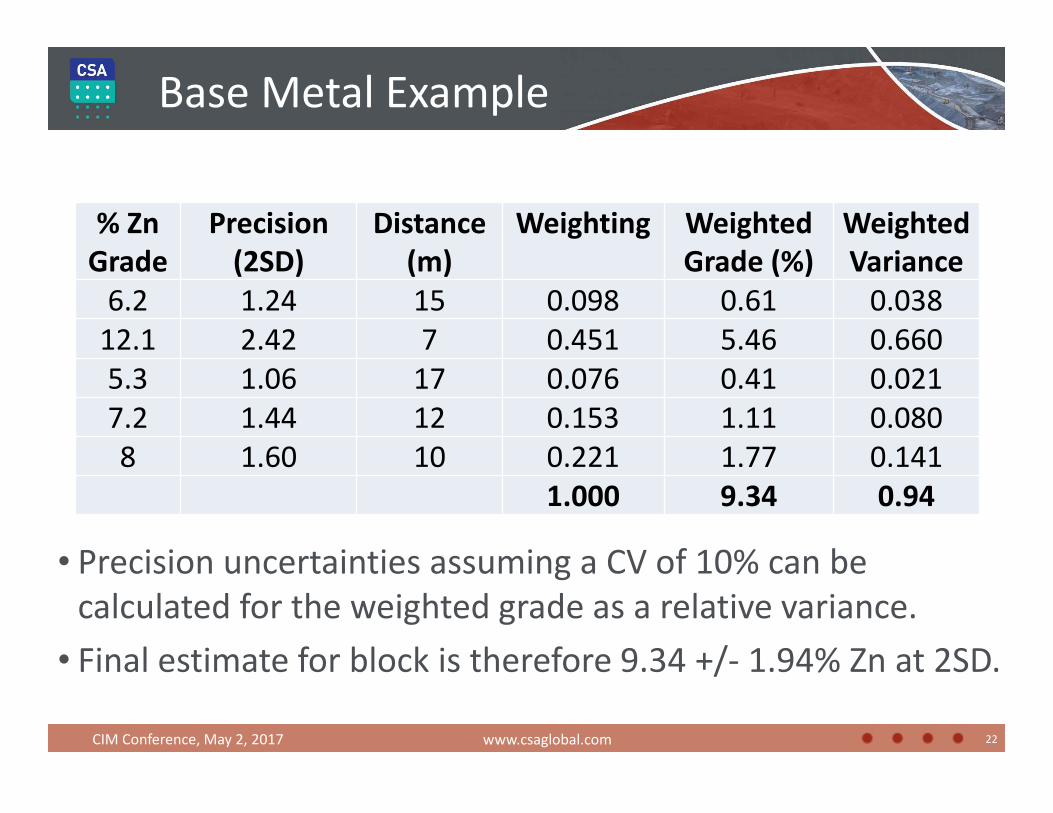
Base Metal Example
22
% ZnGrade
Precision (2SD)
Distance
(m)
Weighting Weighted Grade (%)
Weighted Variance
6.2 1.24 15 0.098 0.61 0.038
12.1 2.42 7 0.451 5.46 0.660
5.3 1.06 17 0.076 0.41 0.021
7.2 1.44 12 0.153 1.11 0.080
8 1.60 10 0.221 1.77 0.141
1.000 9.34 0.94
• Precision uncertainties assuming a CV of 10% can be calculated for the weighted grade as a relative variance.
• Final estimate for block is therefore 9.34 +/‐ 1.94% Zn at 2SD.
www.csaglobal.comCIM Conference, May 2, 2017
23
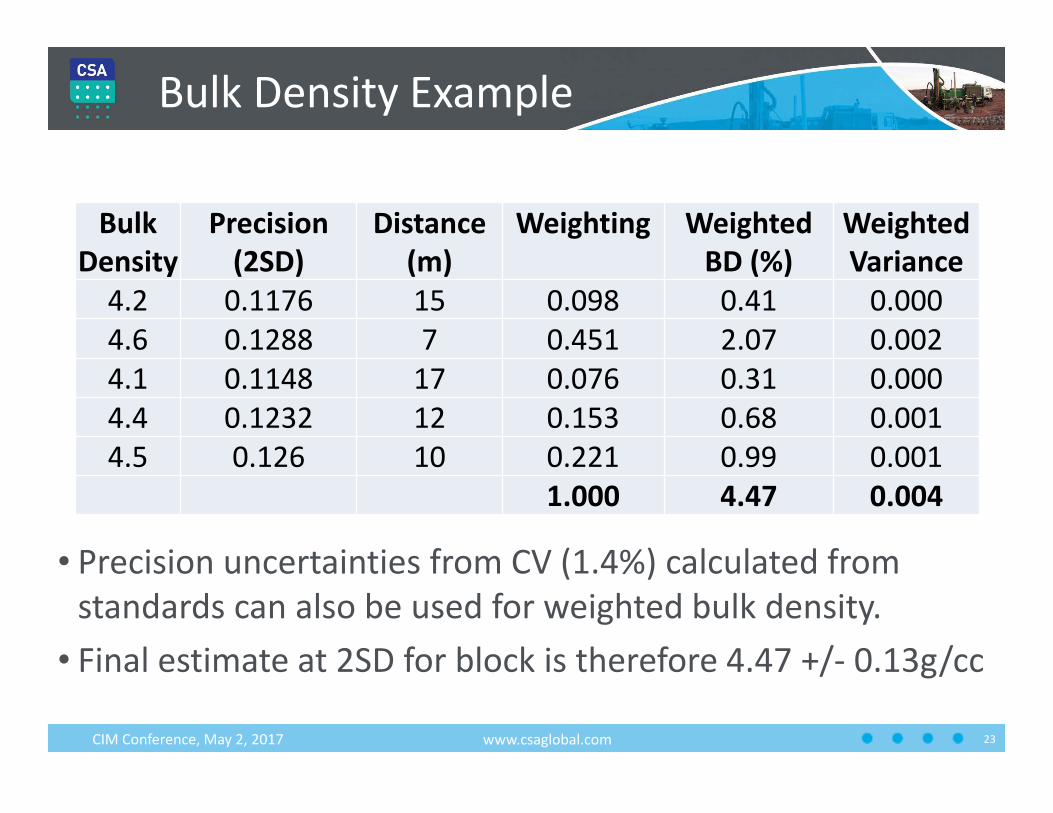
Bulk Density Example
Bulk Density
Precision (2SD)
Distance
(m)
Weighting Weighted BD (%)
Weighted Variance
4.2 0.1176 15 0.098 0.41 0.000
4.6 0.1288 7 0.451 2.07 0.002
4.1 0.1148 17 0.076 0.31 0.000
4.4 0.1232 12 0.153 0.68 0.001
4.5 0.126 10 0.221 0.99 0.001
1.000 4.47 0.004
• Precision uncertainties from CV (1.4%) calculated from standards can also be used for weighted bulk density.
• Final estimate at 2SD for block is therefore 4.47 +/‐ 0.13g/cc
www.csaglobal.comCIM Conference, May 2, 2017

www.csaglobal.comCIM Conference, May 2, 2017 24
Conclusions
• A well thought out QAQC program will provide the basis for benchmarking data quality, allow correction of bias and reduces uncertainties in resource estimates.
• Set corporate quality objectives that evolve with the project; sampling & analytical protocols should be designed to meet these objectives.
• Errors are additive – they will accumulate through the work flow, beginning with sampling.
• Adding more imprecise data to a grade estimate does not reduce the fundamental sampling error.
• Quantifying uncertainties on grade and tonnage estimates will help de‐risk projects.