control of sludge bulking in an sbr-plant treating ...159206/fulltext01.pdf · control of sludge...
TRANSCRIPT

UPTEC W05 031
Examensarbete 20 pMaj 2005
Control of sludge bulking in an SBR-plant treating slaughterhouse wastewater Åtgärder mot slamsvällning i SBR-anläggning
för rening av slakteriavloppsvatten
Linda Jonsson

i
ABSTRACT Control of sludge bulking in an SBR-plant treating slaughterhouse wastewater Linda Jonsson In December 2003 the new plant treating slaughterhouse wastewater from KLS was taken into operation. Läckeby Water Group was entrepreneur and responsible for the maintenance during the following two years. The treatment plant is of SBR-type and has biological nitrate removal and chemical precipitation of phosphate with iron chloride. The wastewater from the slaughterhouse passes a 2 km long pipeline before entering the treatment plant. During 2004, the plant had problems with high levels of phosphorous in the effluent, several mechanical problems and two occasions of sludge bulking caused by filamentous bacteria. The first incident was caused by Thiothrix spp. and the second by Type 021N. The aim with the thesis was to find causes for the latest period of sludge bulking as well as investigate preparatory actions against Type 021N. The thesis included literature studies, laboratory and full-scale tests, evaluation of prior process data and continuous microscopic analysis of the activated sludge at the plant. The literature study showed that filamentous bacteria are favoured by low oxygen and low nutrient concentrations due to their possibly higher growth rate during low substrate concentrations. Type 021N, specifically, can use reduced sulphides as energy source and benefits from an excess of low molecular substrates. Laboratory experiments did not verify that the filamentous bacteria were favoured by low oxygen concentration or low phosphate levels. The effect of FeCl3, Ecofloc, PAX-XL60, NaOCl and H2O2 added to a bulking sludge was evaluated by microscopic analysis. No chemical was found to suppress the filamentous bacteria without also affecting the floc-forming bacteria negatively. PAX-XL60 showed the largest negative effects on filamentous bacteria and only a minor impact on other microorganisms. Full-scale tests with PAX were thereafter performed in order to suppress filamentous bacteria as well as flocculate particulate solids. The effect of earlier additions of NaOCl and H2O2 into the process gave varied results. NaOCl was efficient against filamentous bacteria when addition was made during correct circumstances. Process data from two separate periods during 2004 was compared. One period was followed by good effluent values and another period by a sludge bulking period. Large differences between the two periods were seen in oxygen conditions, temperature, FeCl3 dosage and organic load. Measurements on influent wastewater showed high levels of hydrogen sulphide, which can be produced during anaerobe conditions i.e. in stagnant sewage pipes. Likely causes for the sludge bulking in September-October 2004 were high levels of hydrogen sulphide in the influent, periods of insufficient oxygen concentrations, high water temperatures and access to easy degradable substrate. The hydrogen sulphide can be eliminated through time-controlled dosage of CaNO3 in influent pipeline. Sufficient oxygen levels must be guaranteed in the process. The microbiological fauna in influent can be changed by installation of an aerobe selector to benefit floc-forming bacteria. To lower the phosphorous levels in effluent water and not risk phosphorous deficiency in the process a post-precipitation have been installed. The post-precipitation include extra dosage of FeCl3 and polymer and a drum screen to minimize suspended solids. Key words – SBR, abattoir wastewater, Type 021N, sludge bulking, filamentous bacteria
ii
REFERAT Åtgärder mot slamsvällning i SBR-anläggning för rening av slakteriavloppsvatten Linda Jonsson Sedan december 2003 har Kalmar läns slakteris (KLS) nya reningsverk varit i drift. Entreprenör för det nya reningsverket samt driftansvariga under det två första åren är Läckeby Water Group. Verket är av SBR-typ (Sekventiell Biologisk Rening) med biologisk kväverening och kemisk fällning av fosfor med hjälp av järnklorid. Från slakteriet leds avloppsvattnet genom en 2 km lång ledning ner till reningsanläggningen. Verket hade under 2004 problem med höga halter fosfor i utgående vatten, flertalet mekaniska haverier samt två perioder av slamsvällning. Slamsvällningen orsakades av filamentösa (trådformiga) bakterier, första gången av Thiothrix spp. och andra gången av Typ 021N. Syftet med examensarbetet var att finna orsaken till den senare slamsvällningen samt att söka förebyggande åtgärder mot Typ 021N. Examensarbetet utfördes genom litteraturstudier, laboratorieförsök, fullskaleförsök, genomgång av driftsdata samt mikroskopering av aktivt slam vid verket. Utifrån litteraturstudier konstaterades att filamentösa bakterier kan gynnas under perioder av låga syrehalter samt av låg näringstillförsel eftersom dessa bakterier har en högre tillväxthastighet vid låga substratkoncentrationer än flockbildande bakterier. Specifikt för Typ 021N är att dessa har möjlighet att utnyttja reducerat svavel som energikälla samt gynnas vid tillgång på korta lättnedbrytbara kolföreningar. Laboratorieförsök visade inte entydigt att låga fosfor eller syrehalter gynnade de filamentösa bakterierna. Inverkan av FeCl3, Ecofloc, PAX-XL60, NaOCl och H2O2 studerades under korttids laboratorieförsök och effekten utvärderades i mikroskop. I några fall hämmades filamenten men aldrig utan att även påverka övriga mikroorganismer negativt. PAX-XL60 hämmade filamentförkomsten mest och påverkade andra organismer förhållandevis lite. Tillsats av PAX i filamenthämmande och flockbildande syfte utfördes därefter i fullskala. Effekten av tidigare tillsatser av NaOCl och H2O2 i filamenthämmande syfte studerades och visade sig ha givit varierande resultat. NaOCl visade sig effektivt bekämpa filamentösa bakterier i processen då inblandning skedde under rätt förutsättningar. Processdata för våren 2004 jämfördes med data från en period under hösten, vilken följdes av en slamsvällning. Perioderna visade stora skillnader m.a.p. syrehalt, temperatur, dosering av järnklorid och organisk belastning. En on-line mätning i inkommande vatten visade på mycket höga halter av svavelväte. Svavelväte bildas under anaeroba förhållanden t.ex. i stillastående avloppsvatten. Orsaker till slamsvällningen i september-oktober 2004 tros vara höga halter av svavelväte, perioder med låga syrehalter, höga vattentemperaturer samt tillgång på lättnedbrytbart organiskt material. Svavelvätet kan förslagsvis elimineras genom en tidsstyrd dosering av CaNO3 i inkommande ledning. Noggrann övervakning av syre samt tillgång på syre måste garanteras i processen. Det inkommande vattnets mikroflora kan förändras genom installation av en aerob selektor för att gynna de flockformande bakterierna. För att sänka fosforhalterna i utgående vatten samt att inte riskera fosforbrist i processen har en tillfällig efterfällning med extra tillsats av FeCl3 och polymer installerats. Nyckelord – SBR, slakteriavloppsvatten, Typ 021N, slamsvällning, filamentösa bakterier, filament, PAX-XL60 Sveriges Lantbruksuniversitet, Institutionen för mikrobiologi. Box 7025, SE-750 07 Uppsala ISSN 1401-5765

iii
PREFACE This final thesis is a part of Master of Science degree in Environmental and Aquatic Engineering at Uppsala University and comprises 20 Swedish academic points. Assigner of the project was Läckeby Water Group, division Purac. Many people have been engaged in this study and I would like to thank some of them especially. First of all I would like to thank Regine Haker (Purac, Läckeby) who has been my devoted supervisor and assisted me throughout the study with enthusiasm and joy. Sören Gotthardsson (Purac, Lund) has been the associate supervisor, shearing his experience and given me feedback on my study. Sara Hallin at Department of Microbiology, SLU was the academic supervisor and has given me great feedback and structural advise for the report. Henrik Juel has also contributed to my project with innovative solutions during my laboratory tests and has been enjoyable company at the treatment plant. Anna Ramberg and Stephen Hope have both contributed to the linguistic part of the report. Finally, last but not least, thanks to my colleagues at Läckeby office for ensuring I had such a great time in Kalmar. Kalmar, May 2005 Linda Jonsson Copyright Linda Jonsson and Department of Microbiology, Swedish University of Agricultural Sciences. UPTEC W 05 031, ISSN 1401-5765 Printed at Department of Earth Sciences, Geotryckeriet, Uppsala University, Uppsala, 2005.

iv
DEFINITIONS AND ABBREVIATIONS
Definition Clarified water = Effluent
Supernatant after passing drum screen.
Excess sludge Sludge taken out from the process, pumped to the centrifuge (TS � 0.5-1 %)
F/M Food to Microorganisms ratio. High F/M equalize high organic loading. Primary treated
wastewater = Influent
Incoming water to the treatment plant (raw wastewater treated with a drum screen).
PHB Poly-�-hydroxybutyric acid; organic storage product inside microbial cells that can be used as energy source.
Reject water Water returning to the process after the centrifuge. SBR Sequencing Batch Reactor Substrate Compunds in raw wastewater or primary effluent that can be used by
microorganisms for energy conservation and growth Supernatant Clarified effluent from the SBR. Thickened sludge Sludge from the centrifuge (TS � 10-12 %). Untreated wastewater
Raw wastewater, coming from the production at KLS, lead to the primary mechanical treatment.
WWTP Waste water treatment plant
Parameter Unit Abbreviation Definition BOD7 mg/L Biochemical Oxygen Demand Amount of oxygen needed for biological
oxidation within 7 days. COD mg/L Chemical Oxygen Demand Amount of oxygen needed for chemical
oxidation. DO mg/L Dissolved Oxygen MLSS kg Mixed Liquor Suspended
Solids The total amount of sludge in the tank.
NH4-N mg/L Ammonia N concentration in the form of ammonia. NOx-N mg/L Nitrate and Nitrite
NO3-N + NO2-N N concentration in the form of nitrate and nitrite.
N-tot
mg/L Total Nitrogen N-tot = organically bound N + NOx-N + NH4-N
PO4-P mg/L Phosphate P concentration in the form of phophate. P-tot mg/L Total Phosphorous P-tot = organically bound P +
polyphosphate + orthophosphate ( = PO4-P) SS or TSS
mg/L
Suspended Solids or Total Suspended Solids
The mass of non-filterable residue of a liquid sample dried at 103-105oC per volume.
SV mL/L Sludge Volume Settled sludge volume after 30 min in a cylinder.
SVI mL/g Sludge Volume Index Measure the volume of the sludge. TS % Total Solids
The residue remaining after a wastewater sample has been dried at 103-105oC.

v
ACTORS Läckeby Water Group - LWG Läckeby Water Group offers contracting, products and servicing for treatment of wastewater, process water and drinking water as well as biogas production. The Group consists of three divisions; Läckeby Products for custom-made products, Läckeby for local service and Purac for contracting business. The thesis work was initiated by the Purac division in Läckeby. Läckeby Water AB was established in 1935 and has since then expanded in new markets and acquisitions to comprise 160 employees and a turnover of 500 MSEK. The Group has an in-house production of key-products in Läckeby and offices in several parts of Sweden along with subsidiaries in Europe, USA and Asia. Kalmar Läns Slakteri - KLS The slaughterhouse, KLS, owns the treatment plant of interest. The treatment plant is situated at Tegelviken in Kalmar and treats wastewater produced at KLS. In Kalmar, 232 775 pigs, 43 708 cattle and 12 719 muttons were slaughtered in 2004, in total 33 800 tons of meat. Approximately one third of this meat was processed in Kalmar and the remaining was sold for further processing elsewhere. Water consumption at KLS was in the same year 215 000 m3 and of this, 191 000 m3 was treated by the treatment plant (Boman, KLS Kalmar, Pers. Comm. 2004-02-17). Kalmar Vatten och Renhållning AB - KVRAB KVRAB is a division of Kalmar municipality, processing local garbage and wastewater at Tegelviken. Treated water as well as thickened sludge from KLS´s new treatment plant is processed further by KVRAB. Kalmar municipality, Community Planning Office The Community Planning Office in Kalmar is the inspection authority for KLS´s new treatment plant at Tegelviken. HS Miljölab AB HS Miljölab is the local laboratory performing analyses of influent, supernatant and thickened sludge. AnoxKaldnes AB AnoxKaldnes shall be referred to as Anox in the reminder of this study. Occasionally sludge samples were sent here for microscopic analysis for evaluation by Anders Tärnström.

vi
TABLE OF CONTENTS 1 INTRODUCTION .......................................................................................................1
1.1 OBJECTIVES .............................................................................................................1
2 BIOLOGICAL WASTEWATER TREATMENT IN SBR SYSTEMS .....................2
2.1 BIOLOGICAL WASTEWATER TREATMENT ...................................................................2 2.1.1 Bacteria in activated sludge process................................................................2 2.1.2 Protozoa, Metazoa and fungi ...........................................................................3 2.1.3 The floc ...........................................................................................................3 2.1.4 Microorganisms diversity as an indicator tool .................................................3
2.2 GENERAL ABOUT SBR TECHNIQUE ...........................................................................4 2.2.1 The reaction step .............................................................................................4
3 FILAMENTOUS BACTERIA AND SLUDGE BULKING .......................................6
3.1 GROWTH KINETICS FOR FILAMENTOUS BACTERIA ......................................................6 3.2 TYPE 021N ..............................................................................................................7
3.2.1 Reduced sulphides ...........................................................................................8 3.3 REMEDIATION ACTIONS FOR SLUDGE BULKING ..........................................................9
3.3.1 Non-species specific remediation action ..........................................................9 3.3.2 Remediation actions for Type 021N ...............................................................10
4 MATERIALS AND METHODS...............................................................................12
4.1 KLS’S NEW TREATMENT PLANT AT TEGELVIKEN, KALMAR .....................................12 4.1.1 Dimensions and equipment............................................................................12 4.1.2 Pre-treatment of wastewater..........................................................................12 4.1.3 The process with cycle programming.............................................................13 4.1.4 Post-treatment of supernatant and sludge......................................................13 4.1.5 The automation system and on-line measurements.........................................13
4.2 EVALUATION OF PROCESS DATA FOR 2004-2005.....................................................14 4.3 MICROSCOPIC ANALYSIS OF SLUDGE NOVEMBER 2004 – MARCH 2005 ....................15 4.4 LABORATORY TESTS ..............................................................................................15
4.4.1 Short term chemical test ................................................................................15 4.4.2 Laboratory test with PAX XL-60....................................................................16 4.4.3 Effects of phosphorous and oxygen limitations on growth of Type 021N ........16
4.5 FULL-SCALE TESTS.................................................................................................19 4.5.1 Addition of PAX XL-60..................................................................................19 4.5.2 Addition of oxidation chemicals.....................................................................19 4.5.3 Redox potential in influent.............................................................................19 4.5.4 Hydrogen sulphide in primarily treated wastewater.......................................19 4.5.5 Phosphorous variations in one treatment cycle..............................................20 4.5.6 Post-precipitation of phosphate .....................................................................20
4.6 ANALYTICAL METHODS ..........................................................................................21 4.6.1 Microscopic analyses ....................................................................................21 4.6.2 Sludge Volume (SV) and Sludge Volume Index (SVI) .....................................21 4.6.3 Chemical analyses.........................................................................................21
5 RESULTS AND DISCUSSION.................................................................................22
5.1 EVALUATION OF PROCESS DATA FOR 2004-2005 .....................................................22 5.1.1 Nutrient content in influent ............................................................................22 5.1.2 Operational problems with the SBR process ..................................................22

vii
5.1.3 Comparison of two periods (six weeks each)..................................................23 5.2 MICROSCOPIC ANALYSIS OF SLUDGE NOVEMBER 2004 TO MARCH 2005 ..................26
5.2.1 SBR 1 ............................................................................................................26 5.2.2 SBR 2 ............................................................................................................28 5.2.3 Identification of different filamentous bacteria ..............................................30 5.2.4 The value of microscopic analysis .................................................................31
5.3 CHEMICAL REMEDIATION ACTIONS .........................................................................32 5.3.1 Short-term laboratory chemical test...............................................................32 5.3.2 Laboratory and full-scale test with addition of PAX.......................................33 5.3.3 Full-scale effects of oxidation chemicals on bulking sludge ...........................34 5.3.4 Can chemicals prevent bulking? ....................................................................35
5.4 HYDROGEN SULPHIDE IN INFLUENT WATER .............................................................36 5.4.1 Redox potential in primary treated wastewater..............................................36 5.4.2 Hydrogen sulphide formation in primary treated wastewater.........................36 5.4.3 Suitable options for defeating hydrogen sulphide...........................................39
5.5 THE PHOSPHATE PARADOX .....................................................................................40 5.5.1 Effects of phosphorous and oxygen limitations on Type 021N........................40 5.5.2 Phosphorous variations in process ................................................................45 5.5.3 Post precipitation of phosphate .....................................................................46 5.5.4 Phosphate deficiency or phosphate overload? ...............................................47
5.6 FUTURE POSSIBILITIES AT KLS NEW TREATMENT PLANT ...........................................47
6 CONCLUSIONS........................................................................................................50
7 REFERENCES ..........................................................................................................51

1
1 INTRODUCTION The slaughterhouse industry produces large quantities of wastewater, which often contains high concentration of biodegradable organic matter. The wastewater is rich in fats, proteins and cellulose and often has a low C/N ratio. In order to meet effluent quality standards set by environmental authorities, current legislation demands the treatment of wastewater. This forces industries to treat their wastewater to a level obtainable by the best available technology for wastewater treatment. From the industry point of view, this technique must require as low investment and operational cost as possible. The wastewater can either be pre-treated by the industry and then released into the municipality WWTP or completely treated by the industry and then released in the recipient provided that the effluent fulfil the effluent requirements. In December 2003, a new wastewater treatment plant for the abattoir KLS in Kalmar was brought into operation. Läckeby Water Group was entrepreneur and responsible for the maintenance the two first years. The plant is an SBR-process type with biological nitrogen reduction and precipitation of phosphorous. In October 2004, sludge bulking due to excessive appearance of the filamentous bacteria Type 021N lead to sludge withdrawal during decanting. Under such circumstances, supernatant can neither be led to the recipient (Baltic Sea) due to high organic loads nor to the municipal wastewater treatment plant (KVRAB) due of risk for contamination with filamentous organisms. The addition of oxidizing chemicals or strong flocculating agents can rapidly inhibit further growth of the filamentous bacteria. Although, in the long term, a control strategy for prevention of sludge bulking is required to avoid problems on long-term basis. Bulking sludge is a worldwide problem and appears in municipality treatment plant as well as in the industrial wastewater processes. Despite the extensive amount of research that has been done on sludge bulking no generic solution is to be found at the problem. It seems like the problem must be approached and dealt with at site.
1.1 OBJECTIVES The objective of this study was to find suitable remediation actions to control sludge bulking in the SBR-plant treating slaughterhouse wastewater at KLS as well as to reveal the causes behind the sludge bulking. A literature study and tests performed in laboratory and in the full-scale plant to prevent filamentous growth was combined with evaluation of prior process data and continuous microscopic analysis of the activated sludge. During the experimental period of the thesis work some full-scale experiments were conducted at the treatment plant. These experiments could only be conducted when the plant was in full operation. The results from these experiments were included in the report.
2
2 BIOLOGICAL WASTEWATER TREATMENT IN SBR SYSTEMS
2.1 BIOLOGICAL WASTEWATER TREATMENT The main purpose of biological wastewater treatment is to reduce the biological oxygen demand in the wastewater through oxidization of organic matter to carbon dioxide and water. Protozoa, fungi, algae and a large number of bacteria and viruses oxidize the organic matter and can remove nitrogen, and to some extent also phosphorous, from the wastewater. If the biodegradable substrates in the water are not oxidized in the treatment plant, they will be oxidized in the recipient water and result in oxygen deficiency. This will affect many organisms in the recipient negatively. Microorganisms are either bound to a floc structure or are free-swimming in water. The flocs, which have higher density than water, are separated from the clarified water during sedimentation due to gravity.
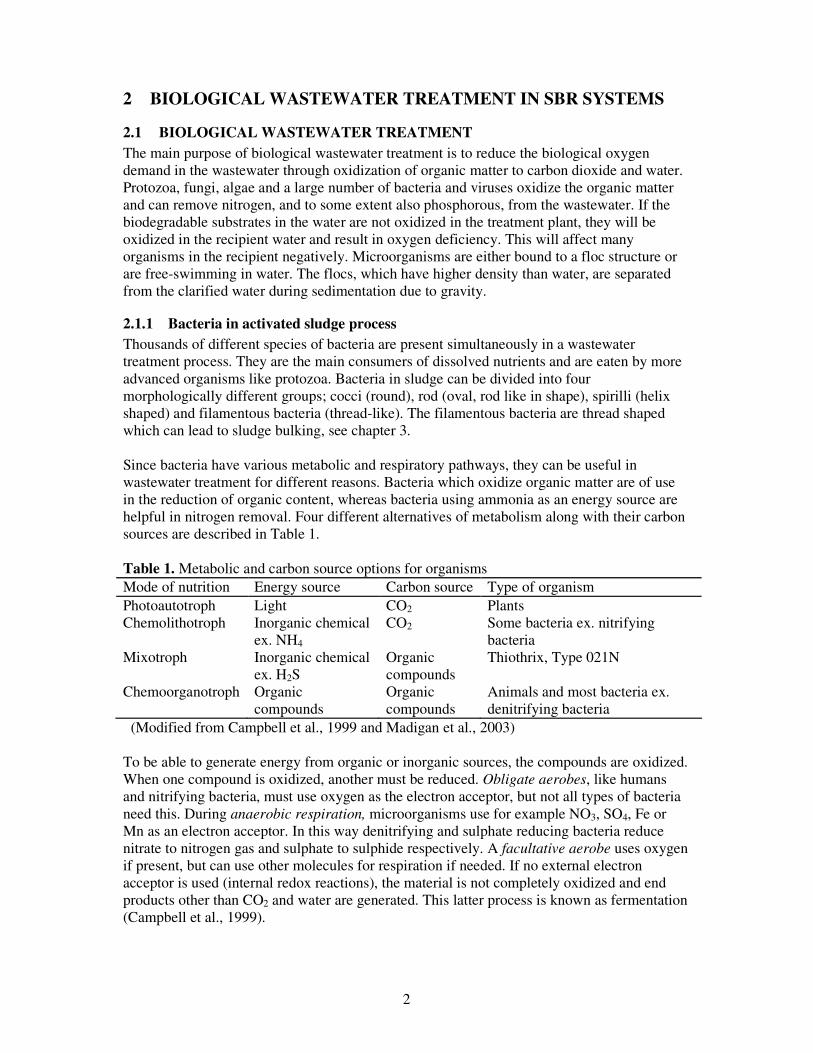
2.1.1 Bacteria in activated sludge process Thousands of different species of bacteria are present simultaneously in a wastewater treatment process. They are the main consumers of dissolved nutrients and are eaten by more advanced organisms like protozoa. Bacteria in sludge can be divided into four morphologically different groups; cocci (round), rod (oval, rod like in shape), spirilli (helix shaped) and filamentous bacteria (thread-like). The filamentous bacteria are thread shaped which can lead to sludge bulking, see chapter 3. Since bacteria have various metabolic and respiratory pathways, they can be useful in wastewater treatment for different reasons. Bacteria which oxidize organic matter are of use in the reduction of organic content, whereas bacteria using ammonia as an energy source are helpful in nitrogen removal. Four different alternatives of metabolism along with their carbon sources are described in Table 1. Table 1. Metabolic and carbon source options for organisms Mode of nutrition Energy source Carbon source Type of organism Photoautotroph Light CO2 Plants Chemolithotroph Inorganic chemical
ex. NH4 CO2 Some bacteria ex. nitrifying
bacteria Mixotroph Inorganic chemical
ex. H2S Organic compounds
Thiothrix, Type 021N
Chemoorganotroph Organic compounds
Organic compounds
Animals and most bacteria ex. denitrifying bacteria
(Modified from Campbell et al., 1999 and Madigan et al., 2003) To be able to generate energy from organic or inorganic sources, the compounds are oxidized. When one compound is oxidized, another must be reduced. Obligate aerobes, like humans and nitrifying bacteria, must use oxygen as the electron acceptor, but not all types of bacteria need this. During anaerobic respiration, microorganisms use for example NO3, SO4, Fe or Mn as an electron acceptor. In this way denitrifying and sulphate reducing bacteria reduce nitrate to nitrogen gas and sulphate to sulphide respectively. A facultative aerobe uses oxygen if present, but can use other molecules for respiration if needed. If no external electron acceptor is used (internal redox reactions), the material is not completely oxidized and end products other than CO2 and water are generated. This latter process is known as fermentation (Campbell et al., 1999).

3
2.1.2 Protozoa, Metazoa and fungi Protozoa are single celled eukaryotes. The protozoa are larger than bacteria, they are mobile and lack a cell wall. There are three different types of protozoa active in the sludge; amoebae, flagellates and ciliates. Ciliates can be divided into; free-swimming, crawling and stalked ciliates. Amoebas are about 10-200 µm in size and tolerate low oxygen concentrations. Testate amoebas are a special type of amoebas, which have a hard and round ornate shell. Flagellates (5-20 µm) are mobile due to their waving flagellum. They feed on dissolved nutrients just like bacteria. There are three different types of ciliates in size range of 20 to 400 µm. They all have cilia used for locomotion and are bacteriovores. The crawling ciliates graze on flocs and compete with the stalked ciliates over food. The stalked ciliates are formed like a bell and appear generally at low organic loadings. The stalked ciliates can either be single or colonially stalked (Jenkins et al., 2004). Pictures of ciliates and amoebas can be seen in Appendix 1.7-1.9, 1.15. Metazoa include rotifers, nematodes and worms and are multicellular eukaryotes. Rotifers have a contractile “foot” with which they hold on to the floc surface. They feed on bacteria and help in forming flocs due to their slimy excretions (Appendix 1.10-1.11). Nematodes are thin wormlike, multicellular organisms. Most of them feed on bacteria, but some consume other nematodes or rotifers. A bristle worm appears like an earthworm under the microscope. They can be red or orange coloured due to their “eyespots” see Appendix 1.12. These organisms only appear in nitrifying sludge because of their sensitivity to ammonia (Jenkins et al., 2004). Fungi appear at low pH, low temperature or high BOD loadings. The fungal mycelium is thread-formed and resemble filamentous bacteria, but are thicker in appearance. Sporangia (spore bags) can be seen under magnification and are an aid to identification. Micrographs are shown in Appendix 1.13-1.14.
2.1.3 The floc The floc comprises of suspended and particulate solids (organic and inorganic) and floc-forming bacteria (Appendix 1.1-1.4). The floc size ranges from 5-1000 µm. Typical floc-forming bacteria are the zoogloeas. They excrete extra cellular polymers which glue the different inorganic and organic components together with the bacteria to form a floc and to some extent, filamentous bacteria help to form and stabilize the floc (Jenkins et al., 2004; Martins et al., 2004). If the floc structure grows too compact, the inner core of the floc can become anaerobic though the surrounding environment is aerobic.
2.1.4 Microorganisms diversity as an indicator tool Different microorganisms appear at different organic loadings. The organic load can be described as the food to microorganisms ratio (F/M). At a low loading rotifers are abundant and stalked and free-swimming ciliates at low to moderate loadings. At high F/M ratios, amoebas and flagellates are prolific. Numerous flagellates, free-swimming and stalked ciliates in combination with moderate numbers of rotifers and a small quantity of amoebas indicate sludge with good settling properties (Metcalf and Eddy, 2003). To define the organic load from the occurrence of different kinds of microorganisms is not a very sophisticated method, since many factors contribute to the mixture of organism fauna. However, the absence of microorgansims may indicate presence of toxic compounds or other unfavourable conditions for microorganisms. Temperature, pH, dissolved oxygen and nutrient conditions are all important parameters that must be at certain levels in order to favour the microorganisms in an activated sludge process. Table 2 shows these parameters with corresponding optimum.

4
Table 2. General optima for different conditions for microorganisms Parameter Optima Temperature 4-30°C Oxygen 2-4 mg/L / <1mg/L pH 6.5-8.5 COD:N:P (Nutrient conditions)
100:4:0.5
2.2 GENERAL ABOUT SBR TECHNIQUE The biological step in wastewater treatment can be designed in numerous ways. One way is to use plug-flow and combine the aeration- and clarifying step and into one basin, a so called Sequencing Batch Reactor (SBR). Instead of continuous flow with separate chambers, the different processes are time related in cycles and have a plug-flow. For continuous treatment, at least two SBRs are necessary; while one receives substrate the other one completes its cycle. Often more then one cycle is run during 24 hours. Usually five steps are applied to complete a full cycle; fill, react, settle, draw and idle. The last step is not necessary but can be useful to synchronize two or more SBRs. The steps are illustrated in Figure 1 below.
Figure 1. Schematic diagram of steps in a sequencing batch reactor during one cycle. Despite the compact design of an SBR, it can function as an equalization basin when the vessel is filled with wastewater, making it possible for the system to tolerate peak flows or peak loads in the influent (EPA, 1999). Additionally, the SBR system is thought to be one of the best WWTP-constructions for preventing sludge bulking (Martins et al., 2004).
2.2.1 The reaction step The reaction step can be built up of aerobic, anoxic (no oxygen, but nitrate available) and/or anaerobic phases. The degradation of organic material is most effective during aerobic zones, but anoxic zones are needed for denitrification. During the reaction step organic matter, nitrogen and phosphorous are removed, either biologically or by addition of chemicals.!
2.2.1.1 BOD removal Microorganisms oxidize dissolved and particular organic material in the wastewater process to simple end products and additional biomass. Ammonia and phosphate are examples of nutrients necessary for the process. The additional biomass is removed as excess sludge. The aerobic biological oxidation of organic matter can be described with the following equation;

5
Organic matter + O2 + NH4 + PO4
3- � biomass + CO2 + H2O (eq.1) MO
2.2.1.2 Nitrogen removal Nitrogen which is not removed with the excess sludge must be removed biologically with the help of bacteria. Most of the incoming fraction of nitrogen is in form of organic nitrogen or ammonia. In the reaction step, the organic nitrogen can be decomposed to ammonia by bacteria through hydrolysis. Nitrification The first step of biological nitrogen removal is transforming ammonia to nitrate. Ammonia is oxidized to nitrite by one type of chemolithotroph bacteria (eq.2) which is then further oxidized to nitrate by another type of bacteria (eq.3). There are several kinds of bacteria performing each step, but they all have in common a sensitivity to low pH and toxic compounds. 2NH4
+ + 3O2 � 2NO2 + 2H+ + 2H2O (eq.2) 2NO-
2 + O2 � 2NO3- (eq.3)
Denitrification During the denitrification process, nitrate is reduced to nitrogen gas, which is emitted into the air. Bacteria performing this step are facultative aerobes and therefore anoxic zones must be created to achieve full biological nitrogen removal. These bacteria cannot use CO2 as carbon source (unlike nitrifying bacteria) but must have access to organic compounds. It is therefore of importance to pump in fresh substrate during periods of anoxic conditions also. The reaction steps are as follows; nitrate NO3
- is reduced to nitrite NO2- which is reduced to nitric
oxide NO, then to nitrous oxide N2O and later to nitrogen gas N2. Nitrogen gas is emitted to the air during the mixing step.
2.2.1.3 Phosphorous removal Phosphorous can be removed biologically but usually phosphate is precipitated chemically by aluminium or iron salts addition. The total amount of phosphorous present includes the organically bound phosphorous, polyphosphate and ortho-phosphate. Ortho-phosphate, HnPO4
3-n (n = 0-3), is available directly for microorganisms. Polyphosphates are complexes with two or more P atoms including oxygen and hydrogen atoms. The precipitation agents precipitate the soluble ortho-phosphate. Organic phosphorous and poly-phosphates are removed through adsorption onto floc surfaces and other more complex reactions. Organic forms of phosphate are usually of minor importance in wastewater. The basic reaction for precipitating ortho-P with iron is as follows: Fe3+ + HnPO4
3-n � FePO4 + nH+ (eq.4) The alkalinity of the wastewater needs to be increased to avoid a low pH.

6
3 FILAMENTOUS BACTERIA AND SLUDGE BULKING The term filamentous bacteria refers to a morphological form of bacteria. The bacteria are connected one after another forming thread-like structures (Appendix 1.5). A number of types of filamentous bacteria are branched and a few have on-growth by other bacteria. Some filamentous bacteria are always present in the sludge. The filamentous types in moderate numbers are even good for the sludge quality, because they form the “backbone” of the floc and help it to grow and stabilize (Jenkins et al., 2004; Martins et al., 2004). Sludge with good settling properties is characterized by a balance between bacteria producing extra cellular polymers and filamentous bacteria (Séka et al., 2003). Sludge bulking is here defined as excessive growth of filamentous bacteria, but can also have other causes (Seviour and Blackall, 1998). Filamentous bacteria create bridges between the flocs, resulting in a bulky sludge with bad settling properties which can, in severe cases, lead to the sludge being lost with the effluent wastewater. Sludge bulking is characterized by high Sludge Volume Index (SVI) but often with a very clear supernatant, since smaller suspended particles are caught within the net of filamentous organisms and larger flocs. Bulking should therefore not only be identified by high suspended solids concentrations in supernatant or by SV checks. If the SVI > 150 mL/g, filamentous bulking is most probably occurring (Metcalf and Eddy, 2003).
3.1 GROWTH KINETICS FOR FILAMENTOUS BACTERIA One way of explaining the causality of sludge bulking is through the differences in growth kinetics between filamentous bacteria and floc-forming bacteria (Seviour and Blackall, 1998). The rate with which the bacteria grow can be written as
( )X
dttdX µ= (eq.5)
where X is the amount of bacteria and µ is the microbial growth rate. The basics of growth kinetics, in a batch reactor, could be calculated using the Monod function;
SKS
s += maxµµ (eq.6)
where S is the amount of growth limiting substrate, Ks the half saturation constant (equals the substrate concentration at one half of the maximum growth rate) given for a certain bacteria as well as µmax is given for a bacteria. The theory states that floc-forming bacteria in general have higher µmax than filamentous bacteria, i.e. they grow faster with high S-levels than filamentous bacteria. Moreover, filamentous bacteria in general have lower Ks than floc-forming bacteria, i.e. they grow faster with low S-levels than floc-forming bacteria.
If S >> Ks � 1→+ SK
S
s
� µ = µmax

7
If S ≈ Ks � 21→
+ SKS
s
� 2/1max
2µµµ ==
Thus, bacteria with high µmax will grow faster than bacteria with low µmax at high S-levels and bacteria with low Ks values will grow faster than bacteria with high Ks at low S-levels. This could explain why filamentous bacteria can survive better than floc-forming bacteria during times of nutrient deficiency. According to Martins et al. (2004) this theory could be questioned. It has not been shown that filamentous bacteria in general have a lower maximum growth rate (µmax) than other bacteria present in the sludge, neither has it been proven that filamentous bacteria have low Ks. In the special case for abattoir wastewater where Ks tend to be higher (Lovett et al., 1984), because of the slowly degradable proteins, this too would favour the filamentous bacteria. If the growth limiting substrate concentration (S) must be higher to obtain half the maximum growth rate, organisms with lower substrate concentration demand will be favoured – i.e. filamentous bacteria.
3.2 TYPE 021N There are many different kinds of filamentous bacteria that can cause sludge bulking. One of them is a bacteria denoted Type 021N. This filamentous bacteria was found to cause the massive sludge bulking during August-October 2004 in the treatment plant at Tegelviken treating wastewater from KLS. Type 021N is one of the most common filaments causing sludge bulking in Europe (Jenkins et al., 2004; Martins et al., 2004). Despite this, information about the filament and its preferred environments is scarce. One reason is that at least five different types of 021N are known (Martins et al., 2004; Nielsen et el., 1998). To distinguish between these, their ribosomal RNA genes must be analysed. The bacteria is one of the longest filamentous types (50-500 µm) and 1.6-2.5 in diameter. It is smoothly curved and extends from the floc surface (Appendix 1.17). Rosettes may occur (many filaments radiate outward from a common floc) but with no branching. The filament is Gram and Neisser negative. Sulphur granules and PHB (storage product) can occasionally exist. Type 021N is a facultative aerobe, belonging to the Proteobacteria. It is a mixotroph, i.e. uses organic compounds as carbon source and gains energy through oxidizing reduced sulphide either as H2S or thio-sulphate (S2O2-), (Martins et al., 2004; Seviour and Blackall, 1998). But the filament can survive without sulphur (William and Unz, 1985). The bacteria use readily biodegradable substrates, especially low molecular weight organic acids. To prevent excessive growth of filamentous bacteria it is of importance to know in what environments they grow so these factors can partly, or fully, be eliminated. In a study by Gaval and Pernelle (2003) done on Type 021N amongst others, it was shown that Type 021N proliferate after repeated oxygen deficient periods, which eventually led to bulking. Similar filamentous bacteria were even more positively affected by oxygen deficiency in the experiments. Except oxygen deficiency, the three most recurrent factors which affect Type 021N positively were access to low-molecular weight organic substrate, reduced sulphides and unbalanced N/P rate. The bacteria have also been shown to be present at moderate to high SRT (Martins et al., 2004). In Table 3, some of the characteristic selection factors according to literature are presented. These factors are therefore of special interest when trying to limit Type 021N growth. Some of the factors are contradictory (increased org. loadings and low F/M rate), which imply the scarce knowledge about the organism.

8
Table 3. Selection factors that profile for Type 021N according to different literature sources Selection factor Reference Low-molecular weight organic substrate
Lemmer and Lind, 2000 Jenkins et al., 2004 Martins et al., 2004 Tärnström, (Pers. Comm., 2004-12-04)
Hydrogen sulphide, H2S Lemmer and Lind, 2000 Jenkins et al., 2004 Martins et al., 2004 Williams and Unz, 1985 Seviour and Blackall, 1998
Low oxygen concentration Lemmer and Lind, 2000 Tärnström, (Pers. Comm., 2004-12-04) Gaval and Pernelle, 2003 Williams and Unz, 1985
Increased organic loading Williams and Unz, 1985 Lemmer and Lind, 2000
Low F/M Seviour and Blackall, 1998 Nutrient deficiency or Unbalanced N/P rate
Lemmer and Lind, 2000 Jenkins et al., 2004 Martins et al., 2004 Seviour and Blackall, 1998
3.2.1 Reduced sulphides Abattoir wastewater contains sulphur which is one of the central components in proteins. During anaerobic conditions, the degradation product sulphate is reduced to sulphide by bacteria, which use the sulphate as electron acceptor. In water, the sulphide can then form the toxic gas hydrogen sulphide, H2S. Organic matter + SO4
2- � S2- + H2O + CO2 (eq.7) bacteria
S2- + 2 H+ � H2S (eq.8) Hydrogen sulphide is characterized by an odour of “rotten eggs” at low concentrations. In higher concentrations, the gas can inhibit aerobic bacteria in the activated sludge process and in the same time favour sulphide oxidizing bacteria that use the sulphide as energy source - for example bacteria of Type 021N. When the gas is oxidized, sulphuric acid is produced (eq. 9). This acid is very corrosive to both metal and concrete, which harms pipelines and other exposed equipment (Metcalf and Eddy, 2003). There are therefore several reasons for eliminating the formation of hydrogen sulphide. H2S + 2 O2 → H2SO4 ↔ HSO4
- + H+ ↔ SO42- + 2 H+ (eq.9)
Type 021N
9
3.3 REMEDIATION ACTIONS FOR SLUDGE BULKING The bulking problem can be approached from two directions; non-species specific and species specific. A species specific remediation action is preferable since this often targets the source of the problem, not only the effect of it. Typically, strong oxidants can be used as a non-species remediation action.
3.3.1 Non-species specific remediation action
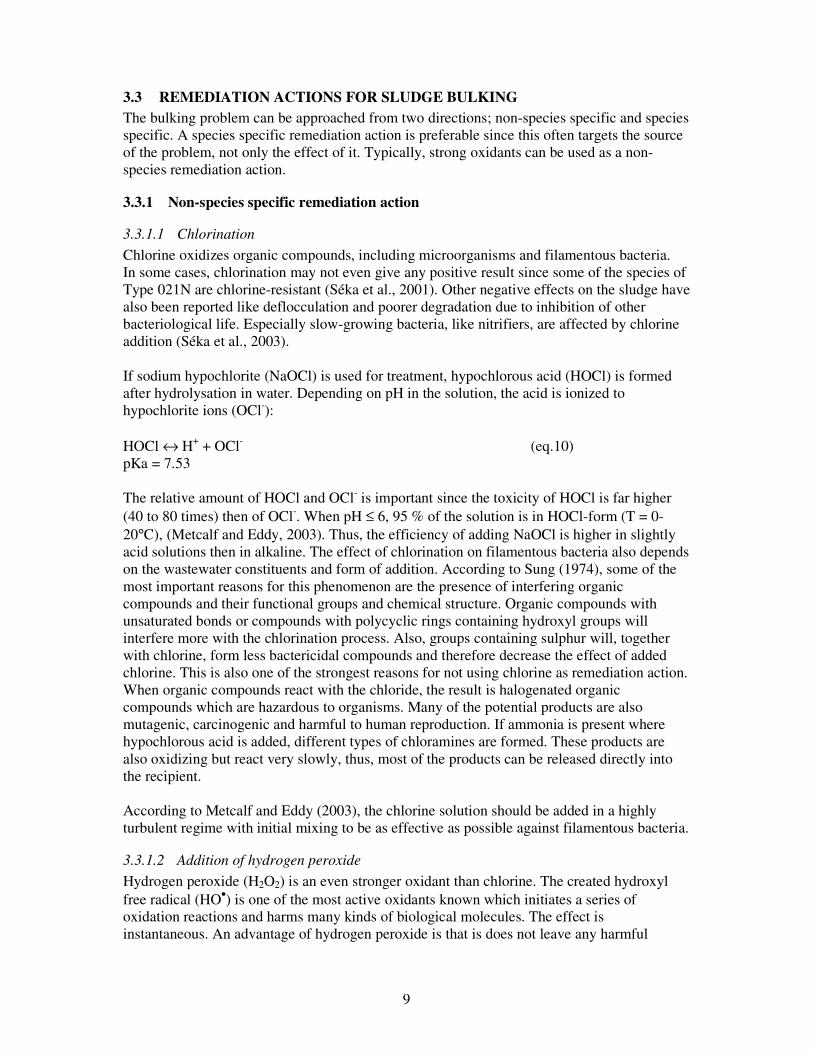
3.3.1.1 Chlorination Chlorine oxidizes organic compounds, including microorganisms and filamentous bacteria. In some cases, chlorination may not even give any positive result since some of the species of Type 021N are chlorine-resistant (Séka et al., 2001). Other negative effects on the sludge have also been reported like deflocculation and poorer degradation due to inhibition of other bacteriological life. Especially slow-growing bacteria, like nitrifiers, are affected by chlorine addition (Séka et al., 2003). If sodium hypochlorite (NaOCl) is used for treatment, hypochlorous acid (HOCl) is formed after hydrolysation in water. Depending on pH in the solution, the acid is ionized to hypochlorite ions (OCl-): HOCl ↔ H+ + OCl- (eq.10) pKa = 7.53 The relative amount of HOCl and OCl- is important since the toxicity of HOCl is far higher (40 to 80 times) then of OCl-. When pH ≤ 6, 95 % of the solution is in HOCl-form (T = 0-20°C), (Metcalf and Eddy, 2003). Thus, the efficiency of adding NaOCl is higher in slightly acid solutions then in alkaline. The effect of chlorination on filamentous bacteria also depends on the wastewater constituents and form of addition. According to Sung (1974), some of the most important reasons for this phenomenon are the presence of interfering organic compounds and their functional groups and chemical structure. Organic compounds with unsaturated bonds or compounds with polycyclic rings containing hydroxyl groups will interfere more with the chlorination process. Also, groups containing sulphur will, together with chlorine, form less bactericidal compounds and therefore decrease the effect of added chlorine. This is also one of the strongest reasons for not using chlorine as remediation action. When organic compounds react with the chloride, the result is halogenated organic compounds which are hazardous to organisms. Many of the potential products are also mutagenic, carcinogenic and harmful to human reproduction. If ammonia is present where hypochlorous acid is added, different types of chloramines are formed. These products are also oxidizing but react very slowly, thus, most of the products can be released directly into the recipient. According to Metcalf and Eddy (2003), the chlorine solution should be added in a highly turbulent regime with initial mixing to be as effective as possible against filamentous bacteria.
3.3.1.2 Addition of hydrogen peroxide Hydrogen peroxide (H2O2) is an even stronger oxidant than chlorine. The created hydroxyl free radical (HO•) is one of the most active oxidants known which initiates a series of oxidation reactions and harms many kinds of biological molecules. The effect is instantaneous. An advantage of hydrogen peroxide is that is does not leave any harmful

10
products after decomposition, but is on the other hand more expensive than chlorine based products.
3.3.1.3 Addition of synthetic polymer Another method used in an attempt to solve the problem of bulking sludge is the addition of synthetic polymer. This compacts the sludge, increases the settling rate and inhibits the growth of filamentous bacteria. However, Juang (2005) showed that this might only be a temporary solution as growth inside flocs was still observed. When the addition of polymer was stopped, sludge bulking reappeared and was more severe than before. It was concluded as an unsuitable alternative for controlling filamentous bulking.
3.3.2 Remediation actions for Type 021N Probably all non-species specific actions are short-term solutions since they do not target the actual problem. A specific method is preferable where the goal is to create a non-favourable environment for the filament bacteria but at the same time a favourable environment for the floc-forming bacteria. In the case of Type 021N three factors should be eliminated, as stated earlier in the text, are; low-molecular weight organic substrate, hydrogen sulphide and unbalanced N/P rate. However, to be able to take measures specie-specifically the bacteria must be identified. This can be done in different ways, either morphologically or taxonomically by molecular methods. The morphology can be determined by microscopic analysis with complementary staining tests and using a dichotomous key (Jenkins et al., 2004). To separate different kinds of bacteria within the same species or taxonomically determine the type of bacteria, the ribosomal RNA genes are analysed. From this knowledge, a suitable action can be taken to inhibit their growth. So far, not enough research has been done in this field.
3.3.2.1 Selector effect - for changing the substrate components A selector is a tank or period with short contact time and high F/M ratios. Return sludge is added to the tank and can be mixed at aerobic, anoxic or anaerobic conditions. The aim with a selector is to favour floc-forming bacteria. In an aerobic selector, the easily degradable substrate should be consumed primarily be the floc-forming bacteria with high growth rate. During the following famine period, these bacteria can, survive better on their nutrient storage products than filamentous bacteria that have a lower growth rate. The SBR technique is a selector-like system where the microorganisms are subjected to periods of high and low substrate concentrations. However, to achieve both high loadings (6-8 kg COD/(kg MLSSday)) and a simultaneous satisfactory nitrification can be difficult.
3.3.2.2 Eliminating hydrogen sulphide Remediation actions against hydrogen sulphide can consist either of precipitation or increased redox potential in the wastewater. Alternatively, addition of hydrogen peroxide (H2O2) or sodium hypochlorite (NaOCl) can be carried out, but are not taken into account in this study. Iron precipitation Addition of Fe2+ results in precipitation of hydrogen sulphide as FeS. Fe3+ (e.g. FeCl3) can also be used. Nevertheless, Fe3+ does not react as selectively as the reduced iron. Iron precipitation does not eliminate the formation of hydrogen sulphide only the effect of it (www, schwefelwasserstoff). The method results in production of chemical sludge and elementary sulphide (S), which can be a disadvantage in a long pipeline. An advantage is that excess iron can later be used in precipitation of phosphate. The addition of an iron component will decrease pH.

11
Nitrate addition - increase the redox potential One reason for formation of hydrogen sulphide is the low redox-potential in the pipeline, due to anaerobic conditions. Addition of e.g. Ca(NO3)2 increases the redox potential and gives bacteria access to nitrate when the oxygen is consumed, instead of using sulphate as the electron acceptor. This will delay or totally suppress the production of hydrogen sulphide. Additional aeration Another way of increasing the redox potential is to put more effort into aeration where anaerobic conditions may occur. By oxygen addition, the dominating bacteria will be aerobes and facultative aerobes bacteria will use oxygen as electron acceptor instead of sulphate. Due to design problems, this remediation method is not the most suitable if anaerobic conditions occur within a pipeline
3.3.2.3 Action against phosphorous deficiency When nutrient deficiency occurs, nutrients like nitrate and phosphorous can be added to favour floc-forming bacteria. This is often done at WWTP’s at paper mill industries. In the case of KLS, phosphorous deficiency is the most probable due to nitrogen excess in influent. If the deficiency occurs within the process, the phosphorous can be precipitated after the process in a separate step. The phosphorous concentration should be related to the organic content in the water to characterize phosphorus deficiency.

12
4 MATERIALS AND METHODS
4.1 KLS’S NEW TREATMENT PLANT AT TEGELVIKEN, KALMAR
4.1.1 Dimensions and equipment The treatment plant is located 2 km from the abattoir KLS at Tegelviken, neighbouring KVRAB municipal treatment plant and biogas plant. The new treatment plant is of SBR type with biological nitrogen removal. The removal of phosphate is achieved chemically with iron chloride (FeCl3). A schematic flow chart of the plant is seen in Appendix 2. The treatment plant was designed for a flow of 1340 m3/day and an organic load (BOD7) of 2680 kg/day. This equals 38286 population equivalents. The effluent requirements for the plant, set by the environmental authorities, are seen in Table 4. Table 4. Effluent requirements for KLS new treatment plant Parameter Limit1
BOD7 ≤ 10 mg/L P-tot ≤ 0.3 mg/L N-tot ≤ 15 mg/L 1 The values are to be calculated as rolling monthly average values.
The main components are the two SBRs, which are 8.5 m high, with a circular surface area of 263 m2, each containing approximately 2000 m3 (Figure 2). The aeration and mixing system in the SBRs are combined in two O.K.I. aeration mixers. The air is supplied by a pair of blowers. The floating decanter is a product of Läckeby Products.
Figure 2. a) Schematic illustration of one SBR from above, showing the two O.K.I. used for
aeration and mixing and the decanter for withdrawal of supernatant b) Photograph of an empty SBR 1 showing the decanter and one O.K.I.
4.1.2 Pre-treatment of wastewater The wastewater from KLS is mostly of biological character with high organic loadings. The wastewater consists of water from; scalding of pigs, processing meat products and washing of floors, equipment and stables. It also consists of blood, fat, pieces of meat and bone, undigested food, urine, dung, straw and sawdust. First, the untreated wastewater passes a drum screen of brand Huber with 2 mm width located at KLS. This is a primary treatment,
O.K.I. for aeration and mixing
Decanter

13
which cleans the water from larger particles although a large amount of sawdust and straw smaller then 2 mm pass through the screen. This water is then pumped through a 2000 m long pipe to the SBR plant at Tegelviken. The plastic pipe has an inner diameter of 220 mm. Most wastewater is produced at KLS between working hours 7.00 to 16.00 and is intermittently pumped to the plant with an average flow of 70m3/h. The primary treated wastewater then reaches the equalization basin (effective volume = 150 m3) at the treatment plant, which has a coarse aeration. This wastewater is then pumped into the SBR process during the filling phases. In Appendix 2 a schematic picture of the treatment plant can be seen.
4.1.3 The process with cycle programming Three cycles (each with a reaction, sedimentation and decanting step) can be programmed everyday. The cycles do not have to be of equal length. Most of the sewage is produced during KLS working hours and a longer cycle with longer filling periods is needed. Influent wastewater is added to the reactor during the first step in the cycle, the filling step. During the reaction step, the influent reacts with the remaining sludge with alternating aeration and non-aeration phases to obtain aerobic and anoxic environments to achieve nitrification and denitrification. The reaction step also consists of several filling periods to support denitrification. For precipitation of phosphate, iron-chloride is added at the end of this step. Both nitrification and the addition of iron-chloride decrease pH and therefore calcium carbonate (CaCO3) is added to increase alkalinity. This is done by constant flow and is time controlled. Calcium ions also precipitate phosphate to some extent, but this is only of significance when pH increases above 10 (Metcalf and Eddy, 2003). In the third step, the sludge is allowed to settle leaving the purified supernatant on top. The supernatant is then withdrawn with a decanter leaving the sludge to react with the influent in the next cycle. Excess sludge is taken out continuously during the reaction step passing a centrifuge to separate sludge and water. The remaining water, the reject, is led back to the process during filling through the equalizing basin.
4.1.4 Post-treatment of supernatant and sludge The supernatant, led through the decanter, passes a drum screen with rotating filter cloth to mechanically clear the last suspended solids from the water before it leaves the plant. If the supernatant fulfills the effluent requirements, the water should be released into Kalmar Sund. So far, the supernatant is released to KVRAB because the requirements have not yet been reliably fulfilled. Polymer is added to the excess sludge taken out from the process through the centrifuge and pumped to KVRAB for further treatment in a biogas plant.
4.1.5 The automation system and on-line measurements A PLC (programmable logical controller) is the main central processing unit for sending and receiving information to and from all electrical units. The process variables in the PLC can be programmed through an interface in the form of the software ‘iFix’ in a PC. The program makes it easy to supervise and control the plant and the software logs all online measurements in the form of diagrams. The system is designed for automatic control but can also be run manually. Some instruments are placed within the SBRs and some measuring devices are placed in separate sample-cyclones, where influent, process water and effluent pass for the collection of samples (Table 5). The following parameters are measured and used for evaluation in this project.

14
Table 5. Equipment for online measurements at the WWTP in Tegelviken Parameter Sample spot Equipment pH cyclone, influent Cerlic; pHX NH4-N and T
cyclone, SBR 1/SBR 2 Christian Berner; WTW S 184 with Ammolyt 700IQ
NOx-N cyclone, SBR 1/SBR 2 Lange; Nitratax plus SS in SBR 1 and SBR 2 Cerlic; ITX O2 in SBR 1 and SBR 2 Cerlic; O2X PO4-P cyclone, effluent Lange; Phosphax, inter2 SS cyclone, effluent Cerlic; ITX Redox temporary, influent/process Cerlic; ReX
4.2 EVALUATION OF PROCESS DATA FOR 2004-2005 The process performance at the treatment plant during 2004-2005 was evaluated by using data from laboratory analysis, on-line measurements, treatment plant diaries and from monthly reports in order to possibly find causes for the reoccurring sludge bulking.
4.2.1.1 Evaluation of influent A characterization of influent water was done by summarizing former results of laboratory analyses. Five composite day-samples of influent water to KLS new treatment plant had been taken in May 2004 (6th, 12th, 20th, 26th and 28th) and one 6th June 2004. On 21st of December 2004, six 2-h samples were collected during 6.00 and 18.00 o’clock. These values were summarized to an average day value, which together with the six other measurements generated an average value of seven different parameters. The ratio between COD, N-tot and P-tot was calculated as well as the ratios of NH4-N/ N-tot; PO4-P/P-tot and COD/BOD7.
4.2.1.2 Comparison of two 6 weeks periods In an attempt to find some causes for the severe sludge bulking in September-October 2004, process data compiled six weeks prior to this incident were evaluated. Only data from SBR 2 was evaluated, since SBR 1 during this time, was out of order. The period 2004-08-09 to 2004-09-19 was chosen and denoted period 2. To follow the cycle of the processes, the day was assumed to start at 7.00 in the morning and end 24 h later. This period was compared to another that was considered normal (2004-02-09 to 2004-03-21) and denoted as period 1. Parameters that were thought to generate different values and were accessible were; oxygen, temperature, iron chloride dosage, organic loading, sludge content (SS) and sludge age. Oxygen content and FeCl3 dosage were read from online plots generated in iFix. However, the data was not possible to process further in any other computer program and the evaluation was therefore done by hand with help of a ruler and calculator on printed plots. Periods lacking data, for example when the SS and O2 probes hung in the air due to low water levels (< 5.9 m), were excluded from the calculations. To evaluate the oxygen values, the following parameters were considered; number of peaks reaching above 3 mg DO/L during one day, approximate percentage of time with levels below 0.5 mg/L, 1 mg/L and 3 mg/L respectively during one day. The iron chloride dosage shown in iFix includes dosage in both SBRs. In the earlier period, when both SBRs were in use, the iron chloride dosage periods must be correlated with the aeration periods for SBR 2 to obtain an approximate amount for iron chloride dosage, since iron chloride was added only during these periods. Average P-tot values based from six weekly laboratory samples were calculated together with average SS-values based on regularly, laboratory, day samples. Temperature was measured by the

15
ammonia meter and was noted sporadically during the daily inspections. To calculate the organic load of the plant, the following formula was used;
��
���
�⋅=kgMLSSkgBOD
MLSSBODV
loadorganictot
inin 7 (eq.11)
where Vin is the volume of influent [m3], BODin is the average content of BOD in the influent [kgBOD7/ m3] and MLSStot is the total amount of sludge in SBR 2 [kg] at the same time. The average BOD concentration of the influent was determined by samples collected in May, June and December 2004, see chapter 4.2.1.1.
4.3 MICROSCOPIC ANALYSIS OF SLUDGE NOVEMBER 2004 – MARCH 2005 The sludge in SBR 1 and 2 was continuously monitored by microscopic analysis and measurements of SV during November 2004 to March 2005. The microscopic analyses were performed to look at the abundance of filamentous bacteria and other microorganisms. To evaluate the filamentous abundance, two parameters were used: one for the amount of filament protruding from the floc and one for the total filamentous abundance. The filamentous abundance was classified on a level 0-6 and other parameters were rated from 0 to 4 according to Jenkins et al. (2004). Detailed information about the microscopic analyses and sludge volume tests is found in chapter 4.6. The interval of sludge analysis varied according to need (Appendix 5).
4.4 LABORATORY TESTS Two different laboratory tests were performed with the purpose to prevent sludge bulking. One chemical test with addition of oxidizing agents or different kinds of precipitation/flocculation agents in bulking sludge was performed and one cultivation test with Type 021N in different environments.
4.4.1 Short term chemical test The aim was to find a chemical that suppressed the filamentous bacteria without harming the activated sludge. Five different chemicals were tested in lab scale tests. Two chemicals were oxidizing agents; sodium hypochlorite (NaOCl) and hydrogen peroxide (H2O2) and three were precipitation-flocculation agents PAX-XL60, Ecofloc (2 different polyaluminum chlorides) and iron chloride (FeCl3). One hour test One litre of active bulking sludge from SBR 2, with a sludge content of 2.2 gSS/L, was used for the lab-tests. Table 6 shows the chemicals and their dosing rates that were tested. Table 6. List of chemicals used for one-hour test and their dosing rates Chemical Unit Sample 1 Sample 2 Sample 3 Sample 4 NaOCl gCl/kgSS 2.4 6 12 24 H2O2 g active H2O2/kgSS 11 43 86 129 FeCl3 gFe/kgSS 2 6 11 17 PAX-XL60 gAl/kgSS 2 6 11 17 Ecofloc gAl/kgSS 2 6 11 17

16
Each chemical solution was added to the biological sludge samples in 4 different dosing rates. A standard sample of biological sludge was also taken for each series, in order to be able to evaluate the effect of the chemical in comparison to the untreated biological sludge. After addition of the chemical solutions, pH was adjusted with NaOH where necessary, in order to keep the pH value above 5.5. Then, the samples were aerated with pressurized air during a one hour period. Each sample was analysed and photographed with the phase-microscope according to the procedure outlined in chapter 3.6.1. These five one hour test-series were carried out on two consecutive days. 14 hour test The same biological sludge was used for the 14-h test as for the 1-h test. The chemical was added to 1L of sludge, which was supplemented with approximately 4g of refined sugar at the beginning of the test. The choices of dosing rates of the five chemicals for this test were based on the results from the 1-h test series and are shown in Table 7. Table 7. List of used chemicals for 14 hour test and their dosing rates Chemical Unit Dosing rate Motivation NaOCl gCl/kgSS 2.4 Lowest rate; had already shown a negative effect
on microorganisms during the 1-h test. H2O2 g active
H2O2/kgSS 129 Highest rate; because it had not shown
sufficiently negative effect during the 1-h test. FeCl3 gFe/kgSS 17 Was the only rate during the 1-h test that showed
a significant effect on floc structure. PAX-XL60 gAl/kgSS 17 Because a correlation to Fe should be made. Ecofloc gAl/kgSS 17 Because a correlation to Fe should be made. All samples were aerated during 14 hours before microscopic analysis was performed according to 3.6.1. Pictures were taken of all samples with microscopic camera for further evaluation.
4.4.2 Laboratory test with PAX XL-60 In order to evaluate whether PAX can be used as an effective flocculating agent during high SS-values a laboratory test was performed. A glass cylinder was filled with 1L activated sludge from SBR 2 (2004-11-15). The sludge rate was assumed to be 2.2 g/L. 0, 1, 5, 10, 20 and 50 µL PAX was added. These doses equalize aluminium dosing rate of 0-2.2 g Al/kg SS, i.e. in the lower range of aluminium dosage in previous test, 3.4.1. The wastewater was stirred and then allowed to settle for 30 min. The test was then replicated with two cylinders with 10 respectively 30 µL PAX addition with a reaction time of 1 h and the pH, SV and SS in supernatant was measured.
4.4.3 Effects of phosphorous and oxygen limitations on growth of Type 021N The aim with of the experiment was to identify at which conditions the filamentous bacteria Type 021N had its best growing conditions. The hypothesis was that the amount of Type 021N would increase in waters with low phosphorous content and in waters with low oxygen concentrations (Gaval and Pernelle, 2003). The first experiment was performed in laboratory scale with 21 days incubation. After this period, the mode of operation was changed and the incubation test was run for another 24 days.

17
4.4.3.1 Part 1 Four tanks (each 30L) were set up with activated sludge from SBR 2 (Table 8). Two tanks had sufficient oxygen concentration and two had limited amount of oxygen. The precipitation agent FeCl3 was added to two tanks to limit the amount of phosphorous. Table 8. Conditions in the four experimental tanks with numbers 1 to 4 Sufficient oxygen Insufficient oxygen Excessive phosphorous T3 T4 Limited phosphorous T1 T2 To simulate the conditions in SBR 2, a sludge content of 5 g/L, a sludge load of 0.06 kg BOD7/(kg SS day) and a sludge age of approximately 15 days were maintained. To increase the original sludge rate from 3 g/L to 5 g/L, 18 L of supernatant was withdrawn after sedimentation and replaced with activated sludge from SBR 2. The influent was assumed to contain 1.5 g BOD7/L and to acquire a sludge load of 0.06 kg BOD7/(kg SS day), 6 L of influent had to be added every day. With an MLSS equal to 150 g in each tank, 10 g sludge should be taken out every day to maintain a sludge age of 15 days. Therefore less then 6 L of wastewater was removed. During the experiment the supernatant was first removed and then the wastewater was mixed containing a higher sludge rate (c2). The volume of supernatant (assuming SS = 0 mg/L) together with the volume of wastewater (SS = c2) should equalize 6 L. To calculate the volume of supernatant (VD) taken out every day, the following equations were used;
��
���
�=−
=Lg
VVc
SD
1030
1502 (eq.12)
[ ]LVV DS 6=+ (eq.13)
where c2 is the sludge rate in the tank after supernatant has been removed , VS [L] the volume of mixed wastewater taken out as excess sludge and VD [L] the volume of supernatant taken out every day. The result is VD = 4.35 L and VS = 1.65 L. The four tanks were fed two times per day with 3 L of primary treated water from KLS. After feeding, 0.9-2 mL FeCl3 were added to T1 and T2, depending on phosphorous content in the tank. These volumes are based on stoichiometrical calculation with a ratio of 1.5 mol Fe/mol P. The aim was to keep a minimum of pH 6. Since FeCl3 is a weak acid, pH was occasionally adjusted with NaOH. The aeration was carried out with pressurized air and penetrated tubings with some T-intersections. A solenoid valve and a timer made it possible to stop the aeration for 15 min four times a day in addition to the 2.5 h stop during sedimentation in the mornings. Tank number 2 and 4 had a hose clamp on their aeration branch to limit the airflow and tank number 1 and 3 had a grid stone to further increase the oxygen supply. The aim was to obtain 0.5-1.0 mg DO /L in the tanks with insufficient oxygen and >2.0 mg DO/L in the ones with sufficient oxygen, measured after feeding in the afternoon. A mixing device was installed 11 days after start of the experiment in the tanks with less aeration due to insufficient mixing with the air. The mixing system consisted of two fan motors together with two colour paint mixers. A timer allowed mixing 15 minutes every hour except during the sedimentation stop at morning.

18
Figure 3. The four experimental tanks without the mixing device installed. During sedimentation in the morning, the water temperature (T), pH and DO were measured with a Fluke 16 Multimeter, Macherey-Nagel Tritest pH-paper and WTW Oximeter Oxi 323 with CellOx 325 electrode. After mixing, 1.65 L of sludge liquid was taken out. The supernatant was analysed for phosphorous with Dr Lange Cadas 50S, Spectrophotometer together with Lange Phosphate cuvette LCK 349 and/or the installed on-line measurement device for phosphate Dr Lange Phosfax inter 2. The cuvette has a measuring range of 0.05-1.5 mg PO4-P /L and the on-line measurement device has a range of 0.05-15 mg PO4-P/L. The excess sludge, was used for SV analysis and microscopic analyses. Thereafter, 0.5 L influent per tank was added and the sludge was mixed for 30 min for a denitrification period. After this, 2.5 L was added in batches of 0.5 L during the 30 min. In the afternoon, the tanks were once more fed with 3 L wastewater (0.5 L influent every 5th minute). FeCl3 was again added to tank number 1 and 2. Day 15 and 16, no measurements were done and the tanks only were fed one time with 1.5 L per tank. Tank number one and two were then dosed with 0.5 mL FeCl3.
4.4.3.2 Part 2 The mode of operation was shifted after 21 days and during the following 24 days the oxygen and FeCl3 conditions in the tanks were altered around (Table 9). During this period the tanks were fed with 1 L of influent once a day, four days a week, for three weeks. No measurements, except sporadic pH checks, were done during the period. 24 days after part one finished, part two was evaluated through microscopic analysis, SVI calculation and ocular determination of the colour of the supernatant. Table 9. Conditions in the four experimental tanks during 24 days Sufficient oxygen Insufficient oxygen Excessive phosphorous T2 T1 Limited phosphorous T4 T3 During this period the tanks were fed with 1 L of influent once a day, four days a week, for three weeks. No measurements, except sporadic pH checks, were done during the period. 24 days after part one finished, part two was evaluated through microscopic analysis, SVI calculation and ocular determination of the colour of the supernatant.

19
4.5 FULL-SCALE TESTS The full-scale tests were based on results from literature study and laboratory experiments.
4.5.1 Addition of PAX XL-60 To be able to decant supernatant to KVRAB despite high SS-values and a high abundance of filamentous bacteria in November (2004-11-16), addition of PAX XL-60 was tested. Excess sludge had been taken from SBR 2 during some time, in order to dispose of the filaments, so the sludge content was only 2.2 g/L. Firstly, 60 L of PAX was added directly in SBR 2 during aeration. Ten respectively 50 min later an SV test was taken from the sample cyclone, see 3.1.5. The SBR was aerated for 1h and then mixed for another 10 min before sedimentation started. Decanting was started after 2 h and 50 min of sedimentation. An SS sample was taken of the supernatant and analysed at HS Miljölab.
4.5.2 Addition of oxidation chemicals With the aim to harm the filamentous bacteria NaOCl was added into the process at several times (Table 10). The evaluation of the full-scale experiment was done by microscopic analysis. Table 10. Dates, methods and volumes of NaOCl addition at KLS new treatment plant. Date Total amount of NaOCl Way of addition 2004-06-18, 21-24, 29-30 and 2004-07-01, 2, 5-6, 12
Unknown amount (SBR 1 and 2)
Into equalizing basin and direct into SBRs
2004-08-16 - 18 60+60+120 L Into eq. basin for SBR 2 2004-09-20-23, 25, 26 60+60+60+60+120+90 L Into eq. basin for SBR 2 2005-01-03, 5 60+60 L Direct into SBR 2 In October 2004, H2O2 was added in an attempt to inhibit further growth of filamentous bacteria. Four additions of 500 kg 19 % H2O2 were made (2004-10-13, 15, 18, 20) directly in the SBR tanks.
4.5.3 Redox potential in influent Since the formation of hydrogen sulphide was to be investigated, the redox potential in primary treated wastewater was of interest. The measurement was done with a redox meter from Cerlic, see Table 5.
4.5.4 Hydrogen sulphide in primarily treated wastewater.
4.5.4.1 Calculation of hydrogen sulphide production It is possible to calculate the formation of hydrogen sulphide with the knowledge of pipeline dimensions, sulphur concentrations, organic content in the WW and oxygen conditions in the pipeline according to an empirical formula applied by Purac in 2000 for such calculations in Falkenberg WWTP (Purac, 2000).
4.5.4.2 Measurements of gas production An H2S gas detector was borrowed from the company Yara. In the morning of the 9th of February 2005, a cleaning plug was sent through the pipe from KLS to the treatment plant in Tegelviken to eliminate bio-film from the pipe mantle. The gas detector was then placed at the pipe mouth at Tegelviken in a sealed box connected to the pipe (Figure 4). The gas meter was in this way close to the influent without being soaked with it. The meter was programmed

20
to log gas contents every five minutes. On 17th of February, the detector was removed and read off by a Yara employee.
Figure 4. Illustration of location for the gas meter placed at the pipe mouth at Tegelviken
(side-view).
4.5.5 Phosphorous variations in one treatment cycle During one day in February (2005-02-08), the phosphate concentration in the two SBRs was measured during the whole treatment period with help of the online phosphate instrument (Lange; Phosphax inter2). The samples were taken once every half hour, starting at 7.00. The last samples were taken at 21.00 in SBR 2 and 20.15 in SBR 1. Once a sample was taken the outlet valves were alternated so the sample cyclone was rinsed 15 min before next sample was taken. The sample was left for sedimentation for about 40 min before the PO4-P concentration was measured on the supernatant.
4.5.6 Post-precipitation of phosphate The installation was made of an iron chloride pump, a polymer pump and a small flocculation tank of 2 m3 (Figure 5). The flow of the supernatant is 100 m3/h and the drum screen of bran Hydrotech. The thought was to precipitate excess phosphate with iron chloride and to stabilize and enlarge these chemical flocs with an anionic polymer within a flocculation tank. These flocs were then to be separated from the effluent in the screen.
Figure 5. Pilot plant for post precipitation of phosphate.
Qin H2S meter
Eq. basin
FeCl3
Polymer
Drum screen
Fl. tank 2m3
Supernatant Effluent

21
4.6 ANALYTICAL METHODS The following analytical methods were used at a number of times during the project time.
4.6.1 Microscopic analyses The microscopic analysis were either performed at Tegelviken using an Olympus phase microscope of type 234555BH or at University of Kalmar (Kalmar Högskola, HIK), Institute for marine microbiology using a microscope of type Olympus BX 50 and a camera, Olympus DP 50. All microscopic pictures were taken at HIK with approximately 100, 200 and 400 times enlargement. At all times, double samples were analysed of 20 µL each and microscopic slides of 76 x 26 mm and cover glasses of 18 x 18 mm size were used. No staining procedures were carried out. The microscopic protocol used can be seen in Appendix 3.
4.6.2 Sludge Volume (SV) and Sludge Volume Index (SVI) To obtain the sludge volume, 1L of sludge was poured into a graded glass cylinder with the dimensions; h = 190 mm and d = 80 mm. The sludge was allowed to settle for 30 min to determine the sludge volume [mL/L]. The sludge volume index was calculated using the following formula (Jenkins et al., 2004)
[ ]gmLSS
SVSVI /
1000⋅= (eq.14)
where SV is the sludge volume and SS is suspended solids [g/L], measured either by the online meter placed within the SBR or as an analysis result from HS Miljölab AB, Kalmar.
4.6.3 Chemical analyses Some of the chemical analyses were carried out by the authorized laboratory HS Miljölab AB. In Table 11, the methods for these analyses are presented. Table 11. Methods for common wastewater analyses Parameter Method N-tot Tec. ASN 110-03/92 P-tot SS-EN 1189-2 COD Hach 0-1500 BOD7 SS 028143-2 SS SS-EN 872-1 NH4-N SS 928134-1 PO4-P SS 028103-1 mod S ICP-AES

22
5 RESULTS AND DISCUSSION
5.1 EVALUATION OF PROCESS DATA FOR 2004-2005
5.1.1 Nutrient content in influent The compiled data from the chemical analyses resulted in seven average parameters, although not all were measured in every sample (Table 12). For interpretation of the parameters some ratios were also calculated (Table 13). Table 12. Average nutrient content in influent water to KLS new treatment plant Parameter Concentration
[mg/L] n
COD 1900 7 BOD7 1000 6 N-tot 160 7 NH4-N 33 7 P-tot 20 7 PO4-P 19 3 SS 1100 7 S-tot 15 1 Table 13. Relation between different nutrient parameters in primary treated water Ratio BOD7/COD 0.53 NH4-N/N-tot 0.21 PO4-P/P-tot 0.85 COD:N:P 100:9:1 Primary treated wastewater could be considered easily degradable because the BOD/COD ratio was higher than 0.5 (Metcalf and Eddy, 2003). The influent water probably consisted of easily degradable substrate, like organic fatty acids and monomers, and in part of more slowly degradable substrates like proteins, straw and wooden particles. Only one fifth of the total amount of nitrogen was in form of ammonia and the majority was assumed to be in organic form. Therefore, it is of importance to support the mineralization of organic nitrogen to ammonia in the first part of the reaction step, by aeration. The fraction of phosphate was large in comparison to the total amount of phosphorous. This means that the major part of the phosphorous can be used directly by the microorganisms. The rest may be found in other less easily accessible formations, since phosphate easily form complexes with cations.
5.1.2 Operational problems with the SBR process The first year of maintenance, 2004, contained two periods of sludge bulking and the first one was caused by Thiothrix and the second was due to Type 021N. Thiothrix is a sulphide oxidizing bacteria which indicates that it lives in the same type of environments as Type 021N. Problems with the aeration systems, both with O.K.I. and blowers, had occurred and the iron dosage had failed. The decanter and the decanter pipeline also had leakage problems resulting in supernatant with a high content of suspended solids. This has resulted in emptying the SBRs four times in total since the plant was taken into operation. SBR 2 three times SBR 1 once. All kinds of mechanical failure have complicated or occasionally prevented a correct maintenance of the plant. The biological step is designed to sustain certain conditions for the activated sludge and if these are not maintained, the biological treatment cannot be ensured.

23
Low aeration capacity or high loadings due to one SBR out of order are typical examples of adverse conditions that weaken the preferred bacterial fauna and in some cases create favourable conditions for filamentous bacteria, like Type 021N. Major mechanical and biological incidents and actions are summarized in Appendix 4.
5.1.3 Comparison of two periods (six weeks each) Two six weeks periods during 2004 were evaluated where one was followed by severe sludge bulking and the other followed by a period of good supernatant. The two different periods were compared with help of online-plots generated from the program iFix (Figure 6).
Figure 6. a) Example of process data from one day in period 1 in SBR 2 (2005-08-25) and
b) Example of process data from one day in period 1 in SBR 2 (2005-02-25). The diagrams show the total FeCl3 dosage [L] (SBR 1 and 2), SS-content [mg/L], oxygen content [mg/L] and water level in the SBR 2. SS- and O2- instrument are placed at 5.9 m.
a
b

24
5.1.3.1 Oxygen In the first period maximum oxygen levels were reached rapidly and a steep decreasing oxygen curve was observed (Figure 6). In the beginning of period 2 the oxygen supply in SBR 2 was also quite good, but later the oxygen concentrations did not reach 3 mg DO/L during aeration (Figure 7). The average number of DO peaks above 3 mg/L each day and percentage of day with oxygen levels below 0.5, 1 and 3 mg/L are summarized in Table 14. On the 12th of August, SBR 1 was out of order and all wastewater was pumped to SBR2, which resulted in a higher organic loading in SBR 2. On the 3rd of September the blower BM2 was out of order and the aeration supply was shifted to BM1. However, the BM1 did not supply SBR 2 with sufficient air and the treatment plant suffered from oxygen deficiency during following days. Microscopic analyses were done but no direct effects were seen on the sludge. A few days later, the oxygen supply decreased just below 1 mg/L. . After this period, sufficient oxygen values were reached. At the end of September, the sludge volume had swelled to 690 mL/L and increased to 920 mL/L later in the same week,. Sludge bulking had occurred. Table 14. Oxygen conditions in SBR 2 during two different periods in 2004 Oxygen Period 1 (Feb-March) Period 2 (Aug-Sep) Number of peaks > 3 mg/L 8 per day 3 per day % of day with O2 < 3 mg/L 56 86 % of day with O2 < 1 mg/L 45 53 % of day with O2 < 0.5 mg/L 43 48 It should be noted that the evaluations have been done by hand (ruler and calculator) and the percentage differ approximately ± 5 units. Nevertheless, data indicates that anoxic periods (DO�0 mg/L) seems to be programmed circa 50 % of the day during both periods, since a minor difference in oxygen supply up to 1 mg DO/L between the periods was seen. How high oxygen levels there should be during the aeration phase could be discussed, but 2 mg DO/L are sufficient in most cases (Särner and Thulin, 1990). The choice of 3 mg/L as threshold value was arbitrary, but indicates a big difference between the two different periods. In period 1, the oxygen concentration was above 3 mg/L during most of the aeration time, whereas, the oxygen levels in the later period reached the same heights approximately one third of the aeration periods. This cannot be seen as sufficient oxygen supply and therefore the oxygen parameter is thought to partly contribute to the sludge bulking starting in September 2004.
5.1.3.2 Iron-chloride dosage There was a large difference in the amounts of iron-chloride added between the two periods chosen for comparison (Table 15). Due to problems with the iron-chloride pump, no iron-chloride at all was added during the last 12 days of period 1. Therefore, period 1 only comprised 4 weeks for comparison. Despite the low iron-chloride dosage in period 1, the weekly average concentration of phosphate in this period was one third of the phosphate concentration in period 2.

25
Table 15. Information regarding iron-chloride dosage and phosphate concentrations during two comparative periods during 2004
Period 1 Period 2 Minimum FeCl3 [L/day] 0 0 Maximum FeCl3 [L/day] 27 428 Median FeCl3 [L/day] 10 90 Average FeCl3 [L/day] 11 106 Average P-tot [mg/L] 0.55 (n = 6 ) 1.65 (n = 6) SS in supernatant [mg/L] 14 (n = 11) 115 (n = 13) It can be concluded that the addition of extra iron-chloride in period 2 did not affect the total concentration of phosphorous in the supernatant. This can probably be explained by the differences in SS-content in the supernatant. In most cases, high levels of SS also contribute to high levels of phosphorous. If the drum screen overflowed, the SS levels as well as the P-tot levels rapidly increased. Since P-tot levels were moderate during period 2, most probably no P-deficiency has occurred in spite of the large amount of FeCl3 added. Period 2 did not show significantly low PO4-P values in supernatant either. The inefficiency of precipitation by iron-chloride can be due to pH or temperature variations or addition of CaCO3. Biological phosphorus removal can also have contributed to the high P-tot in supernatant. These bacteria store phosphorous in poly-phosphate granules and when uses this energy phosphorous is released during anaerobic conditions.
5.1.3.3 Temperature The differences in temperature between the two six week periods were very large. The average temperature in SBR 2 in August-September was 10˚C higher then in the previous period. 30±1˚C (n=13) compared to 20±1˚C (n=15). Temperature is one of the parameters which can greatly affect the biological processes and can benefit the growth of Type 021N. According to a literature compilation by Lemmer and Lind (2000) the temperature optimum for 021N is 25˚C and Williams and Unz (1985) showed that Type 021N was favoured by temperatures between 10 to 33˚C. This indicates that neither period 1 nor 2 is specifically beneficial for growth of Type 021N. Large differences in temperature also affects the DO levels since solubility decreases with increasing temperature.
5.1.3.4 Organic loading and sludge age The amount of incoming water to SBR 2 varied considerably between the two periods and therefore the organic loading (Table 16). The reason for this was the breakdown of SBR 1 in the beginning of August, which resulted in the operational strategy to clean all wastewater in SBR 2. The organic loading in period 2 was almost twice the amount as the loading in period 1. The SS-content in SBR 2 was around 5 g/L for both periods. The amount of influent was calculated as an average value for each day. This value was higher during working days and lower over weekends. To describe the organic load more accurately the values can be multiplied by 7/5 to obtain the approximate value during processing days.

26
Table 16. The organic loading during two different periods in 2004. The organic content in the influent was assumed to be 1005 mgBOD7/L (see chapter 5.1.1) and this value was used to calculate the organic loading
Process data SBR 2 Feb-March Aug-Sept wastewater/day 270 m3 501 m3 BOD load 271 kg 504 kg MLSS-tot 7790 kg 8322 kg = 0.03 kg BOD7/kg SS = 0.06 kg BOD7/kg SS The average sludge age was 23±12 days (n = 21) for the first period and 10±3 days (n = 18) during the second. These seems like reasonable figures since the loading of SBR 2 was almost double in the later period which would result in a low sludge age to keep same the SS-values. Since both the organic loading (MLSS-tot) and the sludge age are based on the SS-values measured within the SBRs the uncertain values from the SS-meter in SBR 2 can make these estimates somewhat uncertain. From two laboratory analyses, a factor of 1.2-1.4 was calculated between the on-line instrument and the laboratory results. Whether the bias in the SS-meter was present in February-March and whether the bias was linear or not cannot be investigated by only two measurements. Despite the large bias factor, a large difference both in organic load and sludge age was observed between the two periods.
5.1.3.5 Did period 2 have more favourable conditions for Type 021N than period 1? Since the aeration supply, the iron-chloride dosage, temperature, organic loading and sludge age, differed between the two periods it is hard to identify single factors causing the sludge bulking. The SS-values in the SBRs were similar (� 5g/L), assuming correct values from the on-line meter. Low levels of oxygen were thought to be a large contributing factor to the latest sludge bulking, not because of low capacity of the blower but because of blower breakdown. Despite differences in temperature, no period seems to benefit the bacteria to a greater or lesser extent than the other. Still, higher temperatures increase hydrogen sulphide production, which in this way can favour the filamentous bacteria. A higher loading would increase the selector effect in the SBR and suppress the filaments (see chapter 3.3.2.1). However, comparable to a selector these loadings are very small and can maybe not be defined as a selector effect. The doubling in load is therefore not a clear disadvantage for Type 021N. Since phosphate levels were moderate in the supernatant, the filamentous bacteria were probably not positively affected.
5.2 MICROSCOPIC ANALYSIS OF SLUDGE NOVEMBER 2004 TO MARCH 2005 The filamentous abundance did not change rapidly and seldom more then one unit within a week, if no special actions had been taken. No nematodes were present during any of the analyses and are therefore not mentioned in the summary. The quantity of bacteria, zoogloeas, floc density and floc size were occasionally hard to determine and data was therefore excluded. In January 2005, it was decided to once a week send samples to Anox for analysis of the activated sludge, to be able to forewarn on the quality of wastewater and sludge to KVRAB where they were processed further.
5.2.1 SBR 1 SBR 1 was refilled on the 16th of November 2004 with primary treated wastewater, after decanter reparation. No inoculation from SBR 2 was done because of high levels of filamentous bacteria in SBR 2. Small and compact flocs were initially formed and after one week the sludge volume reached 60 mL/L. Thereafter the floc size did not increase much and

27
the microbiological activity remained low. Possible reasons can have been oxygen deficiency (only one O.K.I.) or low temperatures. The high levels of ammonia and nitrate could have inhibited certain bacteria. When the O.K.I. was in function again (2005-01-14), SBR 1 was inoculated with sludge from SBR 2. The floc size still did not increase markedly. The main flocs were small (50–100 µm) but compact and absent of filamentous bacteria. This made the sludge compact and it settled rapidly. The supernatant in the cylinder was turbid due to pinpoint flocs (� 20 µm; Tärnström, microscopic protocol). This could indicate an insufficient amount of floc forming bacteria. A high filamentous rate appeared from the beginning in SBR 1 (Figure 7). One reason for this could be that reject water from SBR 2 containing filamentous bacteria was pumped to SBR 1 during refilling. The filaments were according to the protocols very long which makes it even more probable that they had their origin in SBR 2. It was previously confirmed that filamentous bacteria were already present in the influent.
0
0,5
1
1,5
2
2,5
3
3,5
4
2004
-11-1
8
2004
-11-2
5
2004
-12-0
2
2004
-12-0
9
2004
-12-1
6
2004
-12-2
3
2004
-12-3
0
2005
-01-0
6
2005
-01-1
3
2005
-01-2
0
2005
-01-2
7
2005
-02-0
3
2005
-02-1
0
2005
-02-1
7
2005
-02-2
4
2005
-03-0
3
2005
-03-1
0
2005
-03-1
7
2005
-03-2
4
2005
-03-3
1
Abu
ndan
ce o
f fil
amen
tous
bac
teri
a
Total
Protruding
Figure 7. Abundance of filamentous bacteria in SBR 1. When the presence was estimated to
0 the value was set to 0.1 in the plot to be observed as a measurement. Flagellates and small ciliates could be detected quite soon after refilling (Figure 8). It took some time for the stalked ciliates to appear in the sludge, but it is known that they are more common in mature sludge (Metcalf and Eddy, 2003). An absence of both flagellates and stalked ciliates was noted after addition of sludge from SBR 2. The recovery came first among the flagellates, later the crawling ciliates and lastly the stalked ciliates reappeared. This seems to be a natural phenomenon since the flagellates and ciliates feed on free-swimming bacteria. The presence of stalked ciliates decreased in the middle of February and did not increase further. The addition of NaOCl (SBR 2) seems also to have affected the composition of microorganisms. Testate amoebas and a new kind of rotifers (Appendix 1.11 and 1.15) appeared in the sludge after the action (Figure 9). It is possible that the chlorine may have killed some species I was not aware of and instead testate amoebas and the rotifer took over their place in the community. It is also possible that this is pure coincidence, which would require further investigation to resolve.

28
00,5
11,5
22,5
33,5
4
04-11
-18
04-11
-25
04-12
-02
04-12
-09
04-12
-16
04-12
-23
04-12
-30
05-01
-06
05-01
-13
05-01
-20
05-01
-27
05-02
-03
05-02
-10
05-02
-17
05-02
-24
05-03
-03
05-03
-10
05-03
-17
05-03
-24
05-03
-31
Abu
ndan
ce o
f org
anis
ms
Crawling and Free-swimming ciliates Stalked ciliates Flagellates
Figure 8. Abundance of ciliates and flagellates in SBR 1.
00,5
11,5
22,5
33,5
4
04-11
-18
04-11
-25
04-12
-02
04-12
-09
04-12
-16
04-12
-23
04-12
-30
05-01
-06
05-01
-13
05-01
-20
05-01
-27
05-02
-03
05-02
-10
05-02
-17
05-02
-24
05-03
-03
05-03
-10
05-03
-17
05-03
-24
05-03
-31
Abu
ndan
ce o
f org
anis
ms
Rotifers Testate amoebas
Figure 9. Abundance of rotifers and testate amoebas in SBR 1.
5.2.2 SBR 2 SBR 2 suffered from severe sludge bulking in September-October 2004 with filamentous abundance up to 5-6 according to Jenkins et al. (2004). The filaments were determined to be of Type 021N. The flocs in SBR 2 were still full of protruding filaments (3.5) in the beginning of November 2004. The new smaller flocs did not contain as much filamentous bacteria as the larger ones. The supernatant contained very high levels of suspended solids. In an attempt to impede the growth of filamentous bacteria and be able to decant supernatant of SS < 50 mg/L, 60 L of PAX-XL 60 (flocculation agent with aluminium chloride) was added into SBR 2 (2004-11-16). This resulted in a very clear supernatant and the water could be decanted (chapter 0). This action also led to one and a half unit reduction in filamentous rate according to the microscopic protocols. Whether PAX reduced the amount of filamentous bacteria, or the amount of filamentous bacteria appeared to decrease due to the compactness of filamentous bacteria around the flocs, is hard to determine by microscopic analysis alone. After this action, a large amount of filamentous bacteria was left in the water phase. The filaments were very long, up to 500 µm and were probably a relic of the severe sludge bulking.

29
The addition of NaOCl in the beginning of January resulted in a decrease of filamentous bacteria from 3 to 1 in 10 days and a week later the total filamentous abundance was judged to be 0. No other action has been so effective on bulking sludge at this plant. It can be seen in Figure 10 that when the filamentous abundance were about to increase the protruding filamentous abundance was higher than the total rate i.e. new filamentous bacteria were protruding as in the end of January 2005. It can also be seen that when the filamentous abundance was about to decrease, the amount of total filamentous bacteria was higher than the protruding bacteria, like in the beginning of same month. A hypothesis is that the filamentous bacteria break loose from the floc, after an inhibiting action, but stay in the water phase were high levels of filaments can be detected. These filaments later die off and the amounts of both total and protruding filamentous bacteria have decreased. This pattern could be seen in SBR 1, in the end of November (decreasing) and in end of January (increasing) too. Although, for the period at the end of February 2005, in SBR 1, the hypothesis does not fit.
0,0
0,5
1,0
1,5
2,0
2,5
3,0
3,5
4,0
2004
-11-0
8
2004
-11-1
5
2004
-11-2
2
2004
-11-2
9
2004
-12-0
6
2004
-12-1
3
2004
-12-2
0
2004
-12-2
7
2005
-01-0
3
2005
-01-1
0
2005
-01-1
7
2005
-01-2
4
2005
-01-3
1
2005
-02-0
7
2005
-02-1
4
2005
-02-2
1
2005
-02-2
8
Abu
ndan
ce o
ffil
amen
tous
bac
teri
a Total Protruding
Figure 10. Abundance of filamentous bacteria in SBR 2. Other types of microorganisms were also affected by the addition of aluminium chloride and NaOCl (Figure 11 and Figure 12). The number of crawling and free-swimming ciliates and flagellates decreased after the addition of PAX, but recovered eight to ten days later. The peak in stalked ciliates came one week later. The addition of chlorine resulted in absence of flagellates and crawling and free-swimming ciliates for some time. The stalked ciliates and rotifers did not seem to be so strongly affected. The sudden appearance of a new kind of rotifer and testate amoebas in the beginning of January 2005, could also be due to the earlier mentioned chemical addition

30
0,00,51,01,52,02,53,03,54,0
2004
-11-1
6
2004
-11-2
3
2004
-11-3
0
2004
-12-0
7
2004
-12-1
4
2004
-12-2
1
2004
-12-2
8
2005
-01-0
4
2005
-01-1
1
2005
-01-1
8
2005
-01-2
5
2005
-02-0
1
2005
-02-0
8
2005
-02-1
5
2005
-02-2
2
2005
-03-0
1
Abu
ndan
ce o
f org
anis
m
Crawling and Free-swimming ciliates Stalked ciliates Flagellates
Figure 11. Abundance of ciliates and flagellates in SBR 2.
0,00,51,01,52,02,53,03,54,0
2004
-11-0
9
2004
-11-1
6
2004
-11-2
3
2004
-11-3
0
2004
-12-0
7
2004
-12-1
4
2004
-12-2
1
2004
-12-2
8
2005
-01-0
4
2005
-01-1
1
2005
-01-1
8
2005
-01-2
5
2005
-02-0
1
2005
-02-0
8
2005
-02-1
5
2005
-02-2
2
2005
-03-0
1
Abu
ndan
ce o
f org
anis
m
Rotifers Testate amoebas
Figure 12. Abundance of rotifers and testate amoebas in SBR 2.
5.2.3 Identification of different filamentous bacteria During microscopic analyses several kinds of filamentous bacteria were identified. Most of the filaments were, however, of Type 021N (Jenkins et al., 2004), which was also confirmed by Tärnström at Anox in the beginning of the microscopic analyses. Type 021N is characterized as a long filamentous strain with clearly separate cells as seen in Appendix 1.17. Also, filamentous bacteria with plenty of granules were found, see Appendix 1.18. Whether these granules are sulphur granules or poly-P granules was not possible to determine, as no sulphur test or staining was carried out. When Type 021N was found with granules (sulphur or poly-P), problems differentiating Type 021N from other sulphur oxidizing bacteria occurred. Thus, there is a possibility that the discovered filamentous bacteria were not mainly Type 021N as assumed, but some of the other sulphur oxidizing bacteria like Beggiatoa spp. or Thiothrix spp. If this is the case, most of the conclusions drawn, can still be used, since several similarities in morphology and metabolism exists. To be able to differ between these types of filamentous bacteria properly electron microscopy must be used (Williams and Unz, 1985; Williams et al., 1987). A recurring type of filament, associated with fat and compact flocs, differs from the previously mentioned filamentous types. These filamentous bacteria (seen in Appendix 1.21) were never the predominance type and could even be seen in sludge with no other types of

31
filamentous bacteria. The filament was sturdier than other discovered filamentous bacteria and no distinctive cells or granules were seen. The flocs associated with the filamentous bacteria were often blackish, not brownish as other flocs were. According to Travers and Lovett (1984), slaughterhouse treatment plants fed with high contents of fat resulted more often in bulking than processes with lower fat content. Additionally, a third filamentous type was identified where the different cells were not possible to differentiate due to the very thin filaments (phase-microscope x1000). A fourth type of filamentous organism was identified in February 2005. This filament is denoted Type 1863 (Appendix 1.22) and was only found to a limited extent.
5.2.4 The value of microscopic analysis Microscopic analyses are an arbitrary instrument with large uncertainty of absolute values, especially if a limited number of samples are taken. This method assumes homogeneity in the sludge. Despite these aspects, microscopic analysis is the best way to supervise the development and existence of filamentous organisms. It is important that analyses are carried out continuously, preferable by the same person. However, occasionally Regine Haker at LWG carried out microscopic analyses for this study and the results are included. The protocols from A. Tärnström, Anox were not included in the summarized diagrams because he did not use the same scale regarding some of the parameters. However, his microscopic protocols were used for interpretation of the total sludge development. To improve the reliability of microscopic analysis, replicate samples should be examined each time. The samples should be taken at the same time in the process, preferable during aeration, and examined immediately. Oil immersion is a necessity if 1000x enlargement is to be used. Access to a microscopic camera is an advantage, which makes it easier to compare results from different dates. To apply staining in order to analyse the sludge in more detail, and to highlight differences between certain filamentous bacteria, would also be an improvement. It is possible, to a limited extent, to distinguish between different types of filamentous bacteria by microscopic analysis. To truly identify a population the ribosomal RNA genes must be targeted or sequenced. Knowledge of the taxonomy of the filamentous bacteria causing the problem could be helpful if information on this specific type is available. For now, microscopic analysis is the only feasible way to obtain information on the filamentous bacteria to aid investigation at the plants. To determine the presence of filamentous bacteria is useful and easy, especially with the help of the Jenkins scale (1-6). To distinguish the difference between protruding filamentous bacteria from flocs and the total amount has shown to be of use. When the amount of protruding filamentous bacteria rises, this can indicate a growth of the total amount as well and is therefore a negative indication. The obtained results, showed a difficulty of interpreting the abundance of other microorganisms, except presence of toxic chemicals. Ciliates and rotifers are although easier to identify than flagellates and bacteria, with a phase microscope without oil immersion. Other ways of detecting growth of filamentous bacteria is to measure SVI, which is the physical result of excessive growth. The correlation between filamentous abundance and SVI has showed to be good, although not always (Seviour and Blackall, 1998). To obtain SVI, both SS and SV must be known, since SV alone cannot indicate filaments. If the online-SS meter placed in the SBRs can be trusted, these values can be used, but this is not always the case and therefore continuously suspended solid analysis should be performed in case SVI is used as filamentous indicator. A disadvantage using SVI is the delay in response. The filamentous bacteria can grow to certain quantities before a response in SVI is seen (Sezgin, 1982). Therefore, continuous microscopic analysis is the best way to supervise filamentous

32
growth, preferably together with SVI analysis. Other characteristics of bulking sludge, which can be examined are low settling velocity and total filament length concentration [m/kgSS], but these are more complicated analyses than SVI.
5.3 CHEMICAL REMEDIATION ACTIONS
5.3.1 Short-term laboratory chemical test
5.3.1.1 One hour test NaOCl With 2.4g Cl/kgSS, the rotators had hidden themselves in the interior of flocs. Less microorganisms were found alive than in the standard sample. No living microorganisms could be found, and some floc destruction could be observed when 6g Cl/kgSS was added. With 12g Cl/kgSS a significant destruction of the flocs was observed: many small particles could be found that did not exist in the standard sample. With these NaOCl concentrations no negative effect on filamentous bacteria could be observed. However, 24g Cl/kgSS showed a negative effect on the filamentous bacterial cell structure. In the microscope it was showed that the filaments were bend or partly been cut off. It can be concluded that the short-term effect of NaOCl was noticeable already at low dosage levels. Before any significant effect on the filamentous organisms could be observed, all other microorganisms were considered dead. That means that treatment of the biological sludge with NaOCl can result in harming filamentous organisms but not without severe negative effects on microorganisms. H2O2 Addition of 11-86g H2O2/kgSS showed similar effect, in comparison to each other, regarding the state of microorganisms, length of strings of filamentous bacteria and floc structure, but the microorganisms were less active than in the control. Only with 129g H2O2, a significant effect on microorganisms could be observed, but no effect was found regarding filamentous bacteria or floc structure in any of the four samples. It can therefore be concluded that with a dosing rate of up to 129g H2O2/kgSS, no significant effect on the length of filamentous bacteria could be observed while other organisms were negatively affected. FeCl3 It could be observed, that microorganisms became less and less active when the FeCl3
concentration increased. At the highest concentration small particles were flocculated to larger flocs. That resulted in a clear water phase with less filamentous bacteria, which instead were attached to the flocs. It can be concluded that dosing of FeCl3 can result in flocculation of organic material without affecting filamentous organisms or other microorganisms. pH was sinking in all samples and needed therefore pH-adjustment with NaOH. PAX-XL60 Addition of 2g Al/kgSS showed a tendency of flocculation of small flocs. By addition of 6-11g Al/kgSS the sludge showed distinct flocculation and larger floc-aggregates could be observed while the sample with 17g Al/kgSS had a clear water phase. All small particles had been flocculated to larger floc-aggregates. No significant effect on microorganisms could be observed in any of the samples. The effect on Type 021N was not definite, but some strings appeared to be bent in the last three samples. Micrographs from sample 2 (6g Al/kgSS) confirm bent filament strings, however, micrographs of samples 3-4 (11-17g Al/kgSS) do not confirm bent filament strings. It can be concluded that PAX was a very effective flocculating

33
agent for this water. No distinct effect on filamentous organisms could be observed and no negative effect on microorganisms could be found. Ecofloc Dosage up to 11g Al/kgSS showed no effect on filamentous organisms, microorganisms or flocs. With 17g Al/kgSS the sludge started to flocculate together with filamentous bacteria.
5.3.1.2 14 hour test NaOCl (2.4g Cl/kgSS) showed destruction of flocs, a slight negative effect on filamentous organisms and negative effects on microorganisms. Addition of 129g H2O2/kgSS, resulted in little negative effect on microorganisms and floc structure, but no negative effect on filamentous organisms could be detected. Flocculation effects could be observed with 17g Fe/kgSS, but no effect on microorganisms or filamentous organisms could be detected. PAX-XL60 (17g Al/kgSS) showed that significant flocculation had taken place. A clear water phase was visible. Microorganisms had been affected negatively and the cell structure of filamentous organisms had changed. Further PAX-tests should be carried out. Negative effects on filamentous organisms should then be verified by sludge volume index analyses. Ecofloc (17g Al/kgSS) showed negative effects on microorganisms and a few cut filamentous organisms could be found. The results from the 14-h test are summarized in Table 16.
Table 17. Results from the chemical remediations in 14-h test (- Negative effect, + Positive
effect and 0 No effect) Chemical Floc structure Microorganisms Type 021N NaOCl --- --- -- H2O2 - - 0 FeCl3 + 0 0 PAX-XL60 +++ -- - Ecofloc ++ -- -
5.3.2 Laboratory and full-scale test with addition of PAX The results from the additional laboratory test of different concentrations of PAX on bulking sludge are showed in Table 18. From these results, the decision was made to add 30 �L PAX/L active sludge in a full-scale experiment. This resulted in 60 L PAX added to SBR 2, in an attempt to decant a supernatant with an SS concentration below 50 mg/L. In both samples, taken from the sample cyclone, the SV had increased from 60 to 70 mL/L, after addition of PAX. The supernatant was very clear, almost as good as the previously laboratory test, with corresponding dosage. The suspended solids, concentration was 5 mg/L, which was a very satisfying result, since the goal was a value below 50 mg/L.

34
Table 18. Effects of PAX XL-60 on bulking sludge in laboratory tests. The SS-samples were analysed at HS Miljölab
Nr. �L PAX
gAl/ kg SS
Settle time
pH Sludge blanket
SV [mL/L]
SS [mg/L]
Comments of supernatant
0 0 0 30 min 6 Some 60 - Turbid 1 1 0.04 30 min 6 Some 80 - Turbid 2 5 0.2 30 min 6 No 90 - Big flocks still present 3 10 0.4 30 min 5-6 No 90 23 Clearer than number 2 4 20 0.9 30 min 6 No 100 - White/yellow 5 50 2.2 30 min 6 No 100 23 Clear, but with flocs still
present 6 10 0.4 1 hour - No 90 - Clear, bottom of cylinder
cannot be distinguished 7 30 1.3 1 hour - No 90 - Clear, all the way to
bottom of cylinder
5.3.3 Full-scale effects of oxidation chemicals on bulking sludge The effects of H2O2 and NaOCl have been ambiguous. The increase of filamentous bacteria during the latest sludge bulking was not affected by the addition of the large amounts of NaOCl added in June-September 2004. Table 19 shows the results from microscopic analyses during the latest sludge bulking. If both the total amount and the protruding amount of filamentous bacteria were noted in the protocol, an average of these two parameters are shown. Table 19. Average index of filamentous bacteria during autumn 2004. In cases when
abundance of both the total and the protruding filamentous bacteria were determined, an average of these two parameters are shown. SBR 1 was out of order from 12th of August
Date SBR 1*
SBR 2
Practician
2004-07-06 3.5 4 A. Tärnström, Anox 2004-09-06 3 J. Holmgren, KVRAB 2004-09-16 4 “ 2004-09-21 5 “ 2004-09-24 5 “ 2004-09-28 5 “ 2004-10-13 6 “ NaOCl was also used in January 2005, in a new attempt to lower the abundance of filamentous bacteria. This time the addition of NaOCl, suddenly gave an evident effect, the total amount of filamentous bacteria sank from 3 to 1, see Figure 10. One difference between the two periods is the way of addition. The method of adding the chemical directly in the SBRs was practised occasionally in June-July but not during the other two periods. The addition of H2O2 in October, 2004, resulted in a decrease of SV. The SV decreased from 975 mL/L (2004-10-11) to 180mL/L (2004-11-27), but microscopic analyses still showed still a presence of filamentous bacteria of a level 3-4 of 6 (Jenkins et al., 2004) in the beginning of November 2004. Additionally, the chemical addition resulted in very bad supernatant (SS = 93 mg/L in 2004-10-21), probably due to floc resolving caused by decease of floc-forming bacteria.

35
5.3.4 Can chemicals prevent bulking? In a discussion about chemicals and their ability to prevent sludge bulking the aim of the chemical must be defined. There are at least three different situations associated with bulking sludge when an extra chemical might be used; to defeat existing bulking and inhibit further growth, to prevent sludge bulking or to be able to decant good supernatant during high suspended solids values. In all situations the floc-forming bacteria must not be harmed. For the first occasion, the laboratory tests showed no suitable chemical. NaOCl was a too strong an oxidizing agent with the tested dosing levels. H2O2 was too weak an oxidizing agent to result in the wanted effect with the tested dosing levels. FeCl3 and Ecofloc did not show any or very little negative effects on filamentous organisms. The filamentous bacteria were only bound to flocs due to flocculation. PAX-XL60 showed negative effect on filamentous organisms as well as on microorganisms but still good flocculating characteristics after the 14-h treatment. However, experience from the chlorination in January showed that NaOCl could be useful for to defeat existing bulking and inhibit further growth, if added during optimal circumstances. Nevertheless, a negative effect is to be expected on other microorganisms. Chock-adding the chemical directly into the process probably affect the filamentous bacteria more negatively than continuous pumping of chlorine into the equalization basin. According to literature, pH differences in the process affect the quantity of HOCl and OCl- respectively and thus the effect of it. The process was in June-September run with a set-point value of pH 7 and in January 2005 with approximately pH 6. Temperature differences can also affect the reaction with chlorine. The chlorine should be added at a point where chlorine demand from wastewater is at a minimum. If the wastewater contains an excess of ammonia (Cl2/N ratio � 5) the formation of monochloramine (NH2Cl) is rapid. Another rapid reaction of importance, which can disturb the effectiveness of NaOCl, is the presence of NO2
-, since chlorine rapidly reacts with it and forms nitrate and HCl (Jenkins et al., 2004). H2O2 also showed to be rather effective but resulted in high levels of SS. In combination with PAX or other effective flocculating agent this could be a possible remediation technique. An advantage of using H2O2 as remediation action is that no negative environmental by-products are produced. No attempts have been made to find a chemical to prevent sludge bulking, since this is the aim with a preventable control strategy of the plant. In occasions with sludge bulking, simultaneously with high suspended solids, a strong flocculation agent must be used. For this occasion PAX XL-60 has shown positive effects. The aluminium chloride product showed a slightly negative effect on the filamentous bacteria and good flocculation characteristics both on the floc structure as well as the filamentous bacteria. A disadvantage with this product is the aluminium content for the digestion treatment and since the sludge is later is spread onto arable land. Adding an extra chemical results in additional costs and can give unknown negative effects in the recipient as well as in the process. But if this action holds back a sludge bulking or hinder filamentous bacteria to spread into down-streams processes the addition can save money for the maintainers and organic load into the recipient. To make these decisions, knowledge about the process and the effect of the chemical must be known. This can only be obtained by further experimental and full-scale analyses. Experiments in laboratory scale can give an idea about the effects of the chemical but to achieve the same result in the full-scale plant is not to be expected.

36
5.4 HYDROGEN SULPHIDE IN INFLUENT WATER
5.4.1 Redox potential in primary treated wastewater The redox potential was, during repetitive occasions, measured in the cyclone of primary treated wastewater (Figure 13). In general the redox potential was below -200 mV. In some cases, the redox potential decreased unexpectedly below -300 mV during the end of a measurement. The reduction could be due to that the meter was covered with straw and other larger particles and in this way obtained lower values. According to Boon (1992) sulphate reduction has its optimum between -200 and -300 mV and at pH 6.5-8, which was the case for the primary treated wastewater at KLS.
Figure 13. Example of one of the on-line measurements of the redox potential (pink) and the
influent flow rate (green) in primary treated wastewater.
5.4.2 Hydrogen sulphide formation in primary treated wastewater A calculation and a gas measurement of hydrogen sulphide were both performed at the pipeline leading wastewater from KLS abattoir to the new treatment plant at Tegelviken. One way of approximating the amount of sulphide (S2-), that in dissolved form act as hydrogen sulphide (H2S), can be calculated from the amount of sulphate with the empirical formula Ra = k⋅10-3(SCOD-50)0.5⋅1.07(T-20) (eq.15) where Ra is the sulphide production velocity [g/m2⋅h], k is the degradation factor (k is set to 6 for easy degradable substrate from food processing), SCOD equalizes the dissolved COD concentration [mg/L] and T stands for the water temperature [°C] (Purac, 2000). This formula assumes a DO concentration below 0.2 mg/L and that the sulphate concentration is high and non-limiting (>4-5 mg SO4-S/L). Since most of the hydrogen sulphide is produced within the bio-film covering the pipe mantle, Ra is multiplied with the mantle area (πdL) [m2] and then divided with the flow [m3/h] to obtain the total amount of produced hydrogen sulphide within a certain pipe. Table 20 shows values used for the calculation of hydrogen sulphide in the KLS pipeline.

37
Table 20. Parameters with corresponding values for calculation of hydrogen sulphide Parameter T = 23°C Approximated value from several random sample
at the end of the pipe in Feb 2005 SCOD = 1900 mg/L Average from chapter 5.1.1 L = 2000 m Approximate length of pipe line d = 220 mm Inner-diameter for the pipe Q = 70 m3/h Average flow of influent water Since the pipe is a pressure pipe and the dwell time is at least 1 h, the oxygen levels are assumed to be nearly zero. Also the sulphate concentration is thought to be non-limiting for this formula, since S-tot was 15 mg/L (chapter 5.1.1). Applying the values in Table 20 on eq. 15 gives Ra = 0.316 g/m2⋅h, which results in 6.2 mg H2S /L. If the amount of sulphur would be the only limiting factor, the maximum H2S gas production would be 16 mg H2S/L. The calculated result indicates that almost 40% of the sulphate content exists as sulphide. The equation used, includes wastewater temperature and the amount of oxygen consuming substrate. Both parameters can change. The minimum temperature of the wastewater from KLS is thought to be 17°C and maximum 30°C. The biological content will also change. Theoretically, the variation in temperature of the wastewater caused the largest changes in sulphide production, within the intervals chosen Figure 14. This relation has an increasing derivative with increasing values, whereas the relationship COD-H2S has a decreasing derivative with increasing values. The conclusion is that the sulphide production will increase during summer time with higher temperatures in influent.
0
2
4
6
8
10
12
14
16
18
0 5 10 15 20 25 30 35T [C]
mg
H2S
/L
COD = 2000 mg/L COD = 1000 mg/L
COD = 3000 mg/L
0
2
4
6
8
10
12
14
16
18
0 1000 2000 3000 4000
COD [mg/L]
mg
H2S
/L
T = 17 C T = 20 C
T = 23 C T = 30 C
Figure 14. The theoretical sulphide production in the pipeline from KLS to the new treatment plant. The figure shows the variation of sulphide production depending on COD and temperature.
From the measurements of the actual gas production, high levels were occasionally detected (Figure 15). The first period (9-11th February) indicated continuous levels of gas with moderate high peaks twice a day. The latter period showed intermittent gas periods and each period started with a high peak. The time for the gas peaks correlated well with the time water

38
was pumped trough the pipe (Figure 16). On the 11th of February, a mechanical problem with the decanter in SBR 2 was found and therefore water was only pumped down to the new treatment plant during the mornings the following week to supply SBR 1. The 12-13th was a weekend.
Figure 15. Amount of hydrogen sulphide in the pipeline for incoming water during 9th to 17th
of February 2005.
Figure 16. Amount of incoming water to KLS new treatment plant during the period of 9th to
17th of February 2005.
Hyd
roge
n su
lphi
de e
xpos
ure
[ppm
]

39
The gas appeared as soon as the water started to flow through the pipeline and disappeared around 10 to 20 minutes after the water stopped. The maximum amount of gas appeared approximately one hour after the water started flowing into the treatment plant. This indicates that water located “one hour away” from the mouth of the pipe contains most gas. This seems reasonable since the pipe contains about 76 m3 of water when filled, and the average flow in the pipe is 70 m3/h. This means that the first peak of gas is generated within the pipe during night time and the maximum peaks would correlate with hydrogen production within stagnant water at KLS sump. The enormous peak on Monday morning indicates gas production in the sump as well as within the pipe during the weekend. To compare the amount of estimated dissolved hydrogen sulphide that was theoretically calculated [mg/L] and the amount of gas measured [ppm] a comparison at T = 20°C can be done according to Pomeroy (1992). Water containing 3.85 H2S mg/L can produce a concentration of 1000 ppm, in air brought into contact with it. However, the stripping of hydrogen sulphide from the water phase to the gas phase is probably not complete, therefore the water could contain more than detected by the meter. Both the calculations and the measurements showed that the levels of hydrogen sulphide in the pipe were high, especially in the mornings and after the weekend. With these high levels of the gas, it is most likely that the gas inhibits good bacterial life and favour sulphur oxidizing bacteria like Type 021N. Moreover, the gas concentrations within the pipeline are health hazardous, and working areas should be controlled. Levels between 10-100 ppm can give eye irritations and even serious eye damage, the sense of smell is lost by 150 to 250 ppm and 300-500 ppm can cause serious lung damages and potential risk of death (Yara, 2005).
5.4.3 Suitable options for defeating hydrogen sulphide Additional aeration is a possible remediation action to prevent high concentrations of hydrogen sulphide. However, this can be both a technical and a design problem. Even though increased aeration before the pipeline would yield higher redox potential in the beginning of the pipe, this would be an inefficient action. The oxygen will be consumed in the stagnant water during nights or during weekends. Antisiphonage pipes would decrease the amount of gas coming into the treatment plant and spare human and microorganism the toxic gas, but would not inhibit formation of the gas and yield odour. More aeration in the equalization tank would be a kind of post-action when the gas has already appeared but this would rather increase the corrosion of pipes and equipment in the building, rather than lessen it. Increased aeration would also serve as a selector. To reduce the formation of reducing sulphide components the best solution seems to be dosage of a redox-increasing chemical like CaNO3, since this inhibits the formation by the source (Yara, 2005). Such solutions are expensive and will need continuous sampling and dosage experiment to achieve a suitable dosage, but will eventually spare the WWTP equipment and process from hydrogen sulphide. The dosage of CaNO3 can be time and/or flow controlled. An appropriate and simple way (control wise) of adding the chemical is time controlled with three different levels, schematically illustrated in Figure 17. This control strategy assumes a more or less constant flow of wastewater through the pipeline during daytime and no flow (or little) during night time and weekends. The basic dosage (A) should be added during the day when water flow through the pipe. One to two hours before flow stop the dosage should be increased to level B, which would generate sufficiently high concentrations in the pipeline to keep anoxic conditions in the stagnant water during night. A similar increase should be done before a weekend stop but the dosage levels should then be increased further to a level (C), which is proportional to the NO3 demand during the weekend.

40
During night, with no flow through the pipeline, no additional dosage should be needed. However, hydrogen sulphide is most probably produced also in the sump at KLS. If large quantities of wastewater are stagnant there, extra dosage of CaNO3 should be added, after pump-stop from the sump. This can be done by prolonging the dosage time.
Figure 17. A suggested strategy for CaNO3 dosage in KLS pipeline to limit hydrogen
sulphide formation. By adding nitrate to the process the nitrogen load will increase but the BOD-load will decrease, since degradation will occur within the pipe. By starting the dosage the bio-film within the pipeline will come loose and be exchanged to anoxic bio-film. By experience, the dewatering of the sludge can as well be disturbed since other ions are added into the process and the polymer used today might be replaced (B. Steding, Yara, Pers. Comm., 2005-03-17). The municipal treatment plant in Falkenberg (FAVRAB) has had similar problems with bulking sludge caused by Type 021N and presence of hydrogen sulphide. Since dosage of CaNO3 started, no bulking with Type 021N have occurred, although bulking caused by other types of filamentous organisms has been a problem. The dosage in Falkenberg is time controlled, but no dosage is used when pH > 9, since no hydrogen sulphide is produced then. The goal is to maintain levels below 10-15 ppm in influent water (L-G Johansson, Pers. Comm., FAVRAB, 2005-04-08). The municipal treatment plant in Falun also uses CaNO3 dosage, but mainly to eliminate odour problems in a 6 km long sewage pipe with household wastewater. They have used a constant dosage for ten years and have not observed any problems within their process (B Montan, Pers. Comm., Falun kommun, 2005-04-08).
5.5 THE PHOSPHATE PARADOX Type 021N-like filaments were enriched in a lab experiment in order to investigate how oxygen and phosphorous deficiency affect the growth of these filaments. In addition, the phosphorous concentration in the process was determined in order to understand the precipitation of phosphorous better. Finally, some tests were run with the post precipitation equipment.
5.5.1 Effects of phosphorous and oxygen limitations on Type 021N It can be noted that the calculation of organic loading of the experiment, the assumption was made that the influent contained 1.5 gBOD/L, which later was shown to be too high. Chapter 4.2.3 shows an average content of 1 gBOD/L.
Wed Thu Fri
CaN
O3 d
osag
e
C B
A

41
5.5.1.1 Part 1 The first part of the experiment was conducted for 21 days, which was less than two sludge ages. The average temperature in the tanks were 11.7 ± 1.5 (n=20 ). The temperature difference in between the four tanks was caused by the tank location in the building with a fresh air inflow in one corner, making this direction a bit cooler. There was a slight temperature difference in between the four tanks caused by the tank location in the building. The pH in the four tanks was 6.7 ± 0.45 (n=20). In all tanks pH increased slowly during the experimental time. Tank number four increased most, from approximately 6 to 7.5 after 21 days. Since the addition of FeCl3 makes the liquid more acid, a decrease of pH was expected, especially in tank number 2 and 4. The reason for the increase can be due to denitrification, which is a process were OH- are produced. Phosphorous concentrations were measured in two ways. At the beginning of the experiment, PO4-P was measured with Dr Lange cuvettes. This method was later replaced by an online-method, due to bias in the cuvette method. This was probably a result of the increasing amount of suspended solids. The aim was to enrich for Type 021N-like filaments during phosphorous deficiency, but the actual concentrations in the tanks were higher than what was aimed for (<0.05-0.1 mg PO4-P/L). Tank number one had an average phosphate concentration of 0.3 mg/L calculated for all 15 measurements and an average of 0.14 mg/L calculated for the last 9 of these 15 (Fig. 19). When phosphate levels increased, the FeCl3 dosage was recalculated and adjusted, but apparently it was not increased enough. The phosphate concentration in tank 2 was most likely similar to that in tank number one. It increased along with escalating colour index, so the PO4-P average cannot really be compared with that in the other tanks. The phosphate concentration in tank number 3 and 4 were very high.
0
2
4
6
8
10
12
14
16
24-nov 29-nov 04-dec 09-dec 14-dec 19-dec
PO
4-P
T1-c
T2-c
T3-c
T4-c
T1-o
T2-o
T3-o
T4-o
Figure 18. Phosphate concentrations in tank number 1-4 during the first part of the
experiment determined with two different methods, (o= on-line measurement and c= measurement by Lange cuvette).
No oxygen measurement device was available at the start of the experiment, but it was assumed that tank 2 and 4 hade less oxygen supply than the other two due to ocular determination. After ten days, oxygen was measured and it was shown that the DO concentration was above 2 mg/L even after addition of 3 L of KLS wastewater in the morning.. To decrease the DO concentration a hose clamp was used to minimize the airflow to these tanks. Moreover, a mixing device was installed to prevent the sludge from settling, and the feeding pattern in the morning was changed, to enable denitrification (Figure 19).

42
0
2
4
6
8
10
12
24-nov 29-nov 04-dec 09-dec 14-dec 19-dec
O2
[mg/
L]
T1
T2
T3
T4
Figure 19. The DO concentration in tank 1 to 4 measured after 1.5 h of sedimentation in the
morning. The sludge volume increased in all four different tanks at the end of the experiment (Figure 20). Initially the sludge volume was approximately 250 mL in each tank. The following ten days the volume remained but then it increased in tanks 3 and 4. The increase in SV arises when differences in oxygen concentration occur. At the end of the experiment, the difference in sludge volume between tank number 2 and 4 was over 300 mL. Why tank 3 and 4 had the largest increase in SV is difficult to explain since filamentous bacteria are favoured by low oxygen levels. When filamentous abundance is low (approximately below SVI < 100 mL/g), the sludge volume is positively correlated with the floc size (Seviour and Blackall, 1998; Sezgin,1982) and does not vary with the filamentous abundance. The increase in SV can therefore indicate an increase in floc size but no difference regarding floc size, shape or density could be seen by microscopic analyses during the period. The increase in SV is most likely a response of filamentous growth. SVI was only determined the final day of the experiment. The SVI was then calculated to be 39, 56, 111 and 167 mL/g respectively in the four tanks. The highest SVI value indicated sludge bulking.
0
100
200
300
400
500
600
24-nov 29-nov 04-dec 09-dec 14-dec 19-dec
Slu
dge
volu
me
[mL/
L]
T1
T2
T3
T4
Figure 20. Sludge volume in the four tanks during the experimental time.

43
The microbiological activity was determined according to 3.6.1. and performed three times a week during the period. At the beginning of the period the amount of stalked and crawling ciliates was very high (3-4) in all the tanks but ceased in the middle of the experiment (10-12 days after start) but increased again at the end of the experiment. The amount of rotifers was never above 1 during the experiment time. No nematodes or amoebas were identified during the test period. The abundance of bacteria was sometimes hard to determine and is therefore not included in the analysis, neither is the amount of zoogloeas. By the start of the experiment, the amount of filaments projecting from the floc was determined to 2 and the total amount of filaments to 3. During the experiment no true trend for filamentous abundance was noticed (Figure 21 and Figure 22). Applying a trend line to the four different tanks gives a clearer interpretation of the result, even though such lines should be interpreted with care since the R2 sometimes are very low.
Filaments projecting from floc
0
1
2
3
4
5
6
24-nov 29-nov 04-dec 09-dec 14-dec 19-dec
T1 T2 T3 T4
Linjär (T1) Linjär (T2) Linjär (T3) Linjär (T4)
Figure 21. Abundance of filaments projecting from floc. R2(T1 and T2)<0.1, R2(T3 and T4)=0.7.
Total filaments
0
1
2
3
4
5
6
24-nov 29-nov 04-dec 09-dec 14-dec 19-dec
T1 T2 T3 T4
Linjär (T1) Linjär (T2) Linjär (T3) Linjär (T4)
Figure 22. Total abundance of filamentous bacteria. R2(T1 and T2)<0.1, R2(T3)=0.4, R2(T4)=0.6.
The increase in filamentous abundance was correlated with the SV. Tank 4 showed the largest increase in SV at the end of the experiment and had the largest increase in filamentous

44
abundance. In this tank sludge bulking was observed. In tank 3, the increase in SV was smaller and the same accounts for the abundance of filaments. Tank 1 and 2 had the lowest increase in SV and they were similar to each other in the amounts of filaments. The colour of the supernatant changed drastically in some of the tanks during the experimental period (Figure 23). Until day 10, all tanks had a similar yellowish tone of the supernatant. Tank number 2 had the clearest supernatant and tank number 3 and 4 were slightly darker than the other two. Throughout the rest of the experiment the supernatant in tank 1 was the most clear and the others increased in colouring. The final day of the experiment, tank 2 was completely black, like tank 4, while tank 3 was still brownish in colour. The supernatant in tank 2 finally smelled strongly of iron and the PO4-P values were difficult to measure. Because of the very low oxygen levels together with the addition of FeCl3 probably resulted in a reduced iron-sulphide, FeS, which has a characteristic black colour. The reddish colour most likely came from hydrated iron oxide that precipitated on the suspended solids. The experiment did not show that Type 021N was favoured by low phosphorous concentrations and low oxygen supply since tank 4 with excess phosphate and low oxygen levels and tank 3 with excess phosphate and high levels of oxygen both had the worst sludge in the end.
Day 10
Day 13
Day 21 Figure 23. The supernatant of tank 1-4 day 10, 13 and 21. It can be concluded after experiment one that T4 after three weeks, increased the abundance of projecting filamentous rate from a level 2 to 5 and appears to have reached sludge bulking. T3 also increased the filamentous level, but the sludge was not as bulky as T4. Since tank 4 with excess phosphate and low oxygen levels and T3 with excess phosphate and high levels of oxygen was the ones with worst sludge in the end, the experiment did not show that Type 021N was favoured by low phosphorous concentrations and low oxygen supply.
5.5.1.2 Part 2 Part two of the experiment, when the conditions for the four tanks were changed, was started directly after the evaluation of part one and lasted for 24 days. The aim of this test was to i) examine whether a bulking sludge with a filamentous level up to 5 (tank 4) could be defeated simply by more aeration, ii) if the supernatant in tank 2 would become clearer with more aeration and no addition of FeCl3 and iii) and how the sludge in tank 1 and 3 would be affected by less aeration.
T1 T2 T3 T4

45
The colour of the supernatant in the four tanks shifted again. Increased aeration in tank 2 and 4 resulted in a lighter supernatant (Figure 24). The most pronounced difference was seen in tank 2, which previously had an almost black supernatant and now showed a quite clear decant. The reason for this is probably the oxidation of the former sulphides. Tank number 1 and 3 showed, after limited aeration, sign of a darker supernatant. If this is due to formation of sulphides, is difficult to determine without further measurements. More likely is the reason a less efficient degradation of organic material and lower biological activity.
Figure 24. The supernatant of the four tanks after ending part two of the experiment. Measurements of SVI was only done in samples from on tank 3 and 4. The suspended solids concentrations in tank 3 and 4 were 3.2 and 3.0 g/L, respectively. The corresponding SV was 240 and 430 mL/L, which resulted in an SVI of 75 mL/g in tank 3 and 143 mL/g in tank 4. The bulking seemed to have ceased in tank T3 and T4 during experiment 2. In tank number 4 SVI increased during higher oxygen levels. Even tank number 3 experienced lower SVI values despite lower oxygen levels. All tanks showed a decrease in filamentous abundance except tank number one (Table 21). Neither this experiment supports the theory that low levels of oxygen benefit filamentous bacteria. Table 21. Filament projecting from the floc and total filamentous rate on a scale of total 6
before and after part II of the experiment Filament projecting from the floc / total filamentous rate
Start part II End part II
T1 2/2 2/2 T2 2/2 1/1 T3 4/4 3/3 T4 5/4 4/3
5.5.2 Phosphorous variations in process The results from the PO4-P measurements, taken every half an hour, in SBR 1 and 2 are shown in Figure 25. To understand and interpret these curves some process data are necessary. Therefore, the amount of incoming water and dosage of FeCl3 are also shown in the diagram together with the cycles of aeration and non-aeration with mixing. Periods with aeration are showed as dotted lines in the diagram at level PO4-P=1. The oxygen levels responded very quickly on the aeration phases, i.e. aeration phases equals DO > 4 mg/L.
T1 T2 T3 T4

46
SBR 1
0,000,250,500,751,001,251,501,752,002,252,50
07:15 09:15 11:15 13:15 15:15 17:15 19:15
PO
4-P
[mg/
L]
020406080100120140160180200
Qin
[m3/
h]Fe
Cl3
[L/h
]
SBR 2
0,000,250,500,751,001,251,501,752,002,252,50
07:00 09:00 11:00 13:00 15:00 17:00 19:00 21:00
PO
4-P
[mg/
L]
020406080100120140160180200
Qin
[m3/
h]Fe
Cl3
[L/h
]
PO4-P O2 Qin FeCl3
Figure 25. Phosphate concentrations in SBR 1 and 2 and amount of incoming water together with FeCl3 dosage, 2005-02-08.
After each pulse of incoming water, the phosphate levels rises. According to former measurements (chapter 4.2.3), approximately 85 % of the total amount of incoming phosphorous is in the form of phosphate. The aeration phases seem to contribute to lower phosphate concentrations due to the increased microbiological activity by higher oxygen concentrations. Either is the peak on phosphate concentrations only a direct response of the phosphate amount in incoming water or it could also partly be a response of degradation of poly-phosphates or organic phosphorous. The effect of the addition of iron chloride seems not affect the phosphate concentration (Figure 25). SBR 1 had low phosphate concentrations already before any addition of chemical precipitation (0.24 mg/L at 13:45) and SBR 2 also showed a sufficient removal of phosphate before addition of iron chloride (0.12 at 16:00). Both SBR had low phosphate concentrations at the end of the day. The effluent requirement of 0.3 mg/L for P-tot probably necessitates a phosphate concentration below 0.2 mg/L. There was a large difference between phosphate concentrations within the two different SBRs. If this depends on inhomogeneous phosphate loadings in the incoming wastewater or if this is due to different efficiency in the different sludges, is unknown.
5.5.3 Post precipitation of phosphate Because of technical problems, the post precipitation installation was only tried at a few decant occasions within the period of this thesis work. During prior laboratory tests, the polymer showed bad solubility in cold water. Since the addition is done directly within the pipe it is possible that FeCl3 mixes poorly. The post precipitation was tried out with a FeCl3-dosage of 12 mL/m3 supernatant and polymer dosage of 0.5 g/m3 supernatant. Wastewater was collected before the installation and after. Both values measured <0.05 mg/L this day. Further tests for efficient post-precipitation must be done to evaluate if the polymer of choice

47
is the most suitable, if the FeCl3-dosage correct, how the chemical flocs are affected by the short dwell time and how much polymer the drum screen can cope without clogging.
5.5.4 Phosphate deficiency or phosphate overload? The theory was that Type 021N are promoted by phosphorous deficiency. Nevertheless, by levels of 0.3 PO4-P mg/L it was not shown that Type 021N was favoured. Whether 0.3 mg/L really is a deficiency, depends on the organic content in the wastewater. Since no such analysis was done on the wastewater, no conclusions can be drawn. To lower the phosphate concentration during the laboratory experiment, an over-dosage would have been required, since soluble phosphate verces Fe equalizes an exponential decreasing curve (Metcalf and Eddy, 2003). This can also be required for the dosage in the post-precipitation. Assuming filamentous bulking at the treatment plant can be favoured by phosphorous deficiency, it seems reasonable to install post-precipitation. In this case the phosphorous levels will not be suppressed within the process but can instead be kept at a moderate level and then the excess phosphorus is precipitated outside the process in a post-precipitation. But measurements performed on influent water do not show phosphorus deficiency and the batch process will compensate the variations in phosphorous content in influent. It is showed in the full-scale analysis that the phosphate concentration in the process varies a lot but whether phosphate deficiency occurs within the process or not can not be concluded from these experiments.
5.6 FUTURE POSSIBILITIES AT KLS NEW TREATMENT PLANT Hydrogen production and oxygen supply The hydrogen sulphide production in the pipeline and in KLS sump should be eliminated since it affects the activated sludge negatively. A suitable remediation action would be to add CaNO3, since an increase in redox potential inhibits bacteriological transformation of sulphate to sulphide. The addition should preferably be time controlled since the time of stagnant water is a critical parameter for hydrogen sulphide production. Further, the oxygen supply within the process should always be sufficient during aerobic conditions and anaerobic conditions avoided. One precautionary action is to keep an extra O.K.I. or an extra O.K.I. engine to be able to maintain high oxygen levels even during O.K.I. failure. To be able to always supervise the DO condition within the process, the oxygen meter should be placed lower in the SBR, since the water levels from time to time are below today’s level of the O2-meter (5.9 m). The same accounts for the SS-meter but this meter is not as important as the oxygen meter since SS variations are not very fast. Phosphate considerations The best way to effluent requirements regarding to P-tot, is to optimise the precipitation within the process first and then fine-tune the post-precipitation. This can be done by mapping the parameters; aeration time, influent volume and scaling factor since these are the parameters controlling iron chloride dosage. The post-precipitation needs to be optimised regarding choice of polymer and dosing rates of both FeCl3 and polymer. The phosphate on-line meter, which measures the supernatant, should be equipped with a filter at the sample point to avoid clogging when SS-levels are high. SS-levels are often high at the beginning of each decant period, which occur during nighttime.

48
PAX-XL60 can be an alternative as precipitation and flocculation agent at the WWTP, although, other kinds of aluminium chlorides should be tested in laboratory tests to establish the most efficient product. Also, the economy in changing flocculation agent from FeCl3 should be evaluated. The aluminium in the sludge could be a possible disadvantage for the digestion process. Microscopoical analysis and filamentous concerns Microscopic analysis should be performed on a regular basis since this is the best way to supervise the changes in filamentous abundance. To improve the microscopic analysis, immersence oil, staining and a measurement device can be used. Access to a microscopic camera is an advantage for documentation. A disadvantage of performing microscopic analyses by the treatment plant is the vibration disturbance of the centrifuge. Depending on the skills of the microscopic analyst, not all parameters at the microscopic protocol must be analysed. Easiest to analyse, apart from filamentous bacteria, is the abundance of ciliates, rotifers and amoebas. These microorganisms can be an aid, for determination of the sludge status. The microscopic analyses should be complemented by SVI measurements, which must be calculated from reliable SS measurements. In occasion of future sludge bulking, the type of filamentous bacteria should be determined first, in order to take suitable remediation actions. If the bacteria is a sulphur oxidizing bacteria, like Type 021N, similar remediation actions like those proposed for this type can be used. In acute situations, NaOCl can be used, but then the time and way of addition should be carefully chosen. To gain floc-forming bacteria, a selector could be installed. From the organic loading of today, 0.06 kg BOD7/kgMLSSday, it is not possible to increase the loading to a selector dosage of 3-4 kg BOD7/kgMLSSday. Therefore, another option is to let the equalizing basin act as a selector. This would involve a circulation of sludge from the SBR to the equalizing basin. With a low content of sludge in the equalization basin, it could possibly serve as a selector. Technical improvements The pre-treatment of the wastewater, which consists of a drum screen with 2 mm width, could be replaced with a 1 mm screen in order to decrease the amount of sawdust entering the process with the influent water. There is a risk that the sawdust creates anaerobic zones when it settles in unmixed areas within the process. The supernatant drum screen plays an important role in to keeping the SS and following BOD and P-tot levels low. It is therefore of importance to keep the drum screen in good condition with regularly cleaning of the cloth. To install an automatic acid cleaner in this sieve, would save hours of cleaning with acid by hand, and result in a more reliable performance of the drum screen. The programming in iFix can be improved. For example the recipe composing can be simplified by adding a window showing calculated real time after each programming action. The calcium carbonate should be regulated by pH instead of being added at a constant rate. A pH-regulated dosage would optimise the dosage and be more economical.

49
The blowers are regulated by oxygen concentrations in the SBR today. When oxygen levels are high or the oxygen measure device is hanging in the air, the blowers regulate down to a set minimum level. Even by this level the oxygen levels have been unnecessary high, up to 10 mg DO/L. A decrease in this level, would save money in energy costs. Although, this can involve a greater risk for oxygen deficiency if the O2 meter for some reason would show higher values than in reality and the blowers regulate to minimum values. However, with regular supervision and lower placement of the oxygen meters the economical benefit can compensate for this risk.

50
6 CONCLUSIONS • The high levels of H2S in influent affect the bacteria in the sludge negatively. The gas
inhibits aerobic bacteria and selects for the filamentous bacteria of Type 021N. • Oxygen deficiencies are favourable conditions for Type 021N according to literature
studies and by evaluation of old process data. • All types of mechanical failures are in the long-run negative for microbiological activity
since the process is designed to fulfil the microorganisms requirements. • PAX XL-60 seems to be the most effective flocculation agent at the KLS wastewater
treatment plant. However, since the biogas digestate is spread on arable land the aluminium content in the sludge can be a disadvantage.
• NaOCl can be an effective remediation action against Type 021N for acute situations, if
added at pH � 6, with initial mixing and at low ammonia and nitrite concentrations. • Former addition of H2O2 into the process lowered the filamentous abundance but severely
damaged the floc structure and other kinds of microbiological life. • Microscopic analyses should be done to monitor the filamentous occurrence and changes
within the activated sludge. • Post-precipitation is a good idea to lower the effluent levels of phosphate without risking
phosphorous deficiency in the process. • On-line measurements, which constitute a base for further calculations must be reliable. • High temperatures affect Type 021N positively, since higher levels of hydrogen sulphide
is generated.

51
7 REFERENCES Boon, A.G., 1992. Septicity in sewers: Causes, Consequences and Containment. Bøgh, A-M., 2002. Trådformiga bakterier av slamflockens uppbyggnad. Vattenspegeln, nr 3, 2002. Kemira Kemi AB, Kemvater, Helsingborg. Campbell, N.A., Reece, J.B and Mitchell, L.G., 1999. Biology, 5th ed. p.509. Addison-Wesley. ISBN 0-8053-6573-7 EPA, Office of Water, 1999. Wastewater Technology Fact Sheet: Sequencing Batch Rectors. Washington, D.C. Gaval, G. and Pernelle, J-J., 2003. Impact of the repetition of oxygen deficiencies on the filamentous bacteria proliferation in activated sludge. Water Research, 37 pp. 1991-2000. Holmquist, J. and Jernström, S. Utvärdering av de kemiska vattenreningsstegen på Kalmars avloppsreningsverk, besöksdatum 2004-02-24 – 2004-02-26. Kemira Kemi AB, Kemwater. Jenkins, D., Richard, M.G. and Daigger, G.T., 2004. Manual on the causes and control of activated sludge bulking foaming, and other solids separation problems, 3rd ed, Lewis publishers. CRC Press LLC, London. Juang, D-F., 2005. Effects of synthetic polymer on the filamentous bacteria in activated sludge. Bioresource Technology 96 (2005) pp. 31-40. Lemmer, H. and Lind, G., 2000. Blähschlamm, Schaum, Schwimmschlamm. F. Hirthammer Verlag, München Lovett, D.A., Travers, S.M. and Davey, K.R., 1984. Activated sludge treatment of abattoir wastewater-I, influence of sludge age and feeding pattern. Water research Vol. 18. No. 4. pp. 429-434. Madigan, M.T., Martinko, J.M. and Parker, J., 2003. Brock biology of microorganisms, 10th ed., Prentice Hall. Pearson Education, Inc. Upper Saddle River, NJ 07458 Martins, A.M.P., Pagilla, K., Heijnen, J.J. and van Loosdrecht, M.C.M., 2004. Filamentous bulking sludge – a critical review. Water Research 38 (2004) 793-817. Metcalf and Eddy, 2003. Wastewater Engineering: treatment and reuse, 4th ed. Rev. by Tchobanoglous G, Burton F.L. and Stensel H.D. ISBN 0-07-041878-0 Nielsen, P.H., Andreasen, K., Wagner, M., Blackall, L.L., Lemmer, H. and Seviour, R.J., 1998. Variability of Type 021N in activated sludge as determined by in situ substrate uptake pattern and in situ hybridization with flourescent rRNA targeted probes. Water science technology. Vol. 37, No. 4-5, pp.423-430. Pomeroy, R.D., 1992. The problem of hydrogen sulphide in sewers. Ed. by A.G. Boon. Technical publication by the Clay Pipe Development Association, USA. PURAC, 2000. FAVRAB Beräkning/Utredning Falcon. 2000-02-28. Lund.

52
Schwefelwasserstoff, 2004. www.schwefelwasserstoff.de/eisen.html (2004-10-19). Séka, M.A., Hammes, F. and Verstraete, W., 2003. Predicting the effects of chlorine on the micro-organisms of filamentous bulking activated sludges. Applied Microbial Biotechnology (2003) 61:562-568. Séka, M.A., Kalago, Y., Hammes, F., Kielemoes, J. and Verstraete, W., 2001. Chorine-susceptible and Chlorine-resistant Type 021N Bacteria occurring in Bulking Activated Sludges. Applied and Environmental Microbiology Vol. 67, No11, 2001. p. 5303-5307 Sezgin, M., 1982. Variation of sludge volume index with activated sludge characteristics. Water Research. Volume 16, pp. 83-88, Great Britain. Seviour, R.J. and Blackall, L.L., 1998. The Microbiology of Activated Sludge. Chapman and Hall, London. ISBN 0 412 79380 6. Sung, R. D., 1974. Effects of Organic constituents in Wastewater on the Chlorination Process, Ph.D. Thesis, Department of Civil Engineering, University of California, Davis, CA. Särner, E. and Thulin, P., 1990. Biologisk kvävereduktion för kommunala och industriella avloppsvatten. Vatten 46: 151-164, Lund Travers, S.M. and Lovett, D.A., 1984. Activated sludge treatment of abattoir wastewater – II, influence of dissolved oxygen concentrations. Water research Vol 18, No 4, pp 435-439. Tärnström A. Anox. Microscopic protocol. Williams, T.M. and Unz, R.F., 1985. Filamentous Sulfur Bacteria of Activated Sludge: Characterization of Thiothrix, Beggiatoa and Eikelboom Type 021N Strains. Applied and Environmental Microbiology, April 1985, p.887-898. American Society for Microbiology. Yara. 2005. Information leaflet. Yara Industrial AB.

APPENDIX 1
1.1 Zoogloeas (200x) 1.2 Very compact floc/greasy floc (100x)
1.3 Regularly shaped and moderately compact floc (100x)
1.4 Pin flocs (100x)
1.5 Long filamentous bacteria (100x) 1.6 Grease (100x)

APPENDIX 1
1.7 Large free-swimming ciliate (100x) 1.8 Crawling ciliate (100x)
1.9 Stalked ciliates (100x) 1.10 Rotifer (100x)
1.11 Rotifer of “different” type (200x) 1.12 Bristle worm (100x)

APPENDIX 1
1.13 Fungi (400x) 1.14 Fungi (400x)
1.15 Testate amoeba (400x) 1.16 Plant duct from sawdust or straw (100x)
1.17 Type 021N (1000x) 1.18 Filamentous bacteria with granules (1000x)

APPENDIX 1
1.19 Type 021N with granules (1000x) 1.20 Type 021N with granules (1000x)
1.21 Typical filamentous bacteria protruding from grease floc (100x)
1.22 Type 1863 (1000x) foto:KVRAB

APPENDIX 2

APPENDIX 3
Date of sample SignatureComment
SS (mg/L)SV (mL/L)
Floc size (microm)
<50 50-150 150-300 300-500 >500
Floc form
Net Unregular Regular
Description 0 1 2 3 4 5 6 Comment
Protruding filament
Total filament
Floc density
Zoogloeas
Bacteria - cocci
Bacteria - rod
Spirilli bacteria
Protozoan - flagellates
Protozoan - ciliates
Protozoan - amoebae
Protozoan - stalked ciliates
Rotifers
Nematodes
Comment
MICROSCOPIC ANALYSIS
Date of analysis time Sample

APPENDIX 4
IMPORTANT ACTIONS TAKEN AT THE TREATMENT PLANT Date SBR Other Action 1 2 2003-11 x x Start-up 2004-03-10 x Iron chloride pump brake down 2004-03-29 x O.K.I (M3) out of order 2004-04-07 x Decanter broken 2004-04-09 x x All WW to SBR 1, start emptying SBR 2 2004-05-17 x Refilling 2004-06-10 x x Sludge bulking due to Thiothrix 2004-06-18,21-24, 29,30 2004-07-01, 2, 5-6, 12
x x Chlorination, NaOCl Chlorination, NaOCl
2004-08-12 x Decanter out of order, all WW to SBR 2 2004-08-16 - 18 x Chlorination, NaOCl 2004-09-03 x Blower (BM 2) brake down replaced by BM 1 2004-09-20 x Sludge bulking of Type 021N 2004-09-20-23, 25, 26 x Chlorination, NaOCl 2004-10-13, 15, 18, 20 x Sludge bulking crisis: adding 500 kg H2O2(19%) 2004-10-14 x The Huber sieve at KLS brake down, no water to
process 2004-10-18 x Start emptying for decanter reparation 2004-10-20 x x Water to process again 2004-11-16 x Addition of 60 L PAX-XL60 2004-11-16 x Start refilling, no inoculation 2004-11-16 x O.K.I. (M3) out of order 2004-11-29 x Decanter broken 2004-12-06 x x Replacing O.K.I. (M3) in SBR 2 with O.K.I.
(M2) from SBR1 2005-01-03, 5 x Addition of 20 L PAX-XL60 2005-01-03, 5 x Chlorination into SBR, NaOCl 2005-01-10 x Filamentous rate 0 2005-01-14(?) x O.K.I. (M3) back from reparation 2005-01-15-16 x x Refilling of SBR 1 from SBR 2 2005-02-18 x Decanter hose broken, start emptying SBR 2 2005-03-01 x Refilling SBR 2 from SBR 1 2005-03-09 x Decanter hose broken, start emptying SBR 2 2005-03-15 x The Huber sieve at KLS brake down, no water to
process 2005-04-04 x x Water to process 2005-04-14 x x Emptying SBR 1 to 2 for service of decanter
pipe (precaution action) 2005-04-? Full action

APPENDIX 5
DATES FOR MICROSCOPIC ANALYSES At the following dates the sludge in SBR 1 and SBR 2 were analysed by microscope: Date SBR 1 SBR 2 2004-11-08 - AT 2004-11-09 - LJ 2004-11-16 - LJ 2004-11-18 LJ LJ 2004-11-19 LJ LJ 2004-11-23 LJ LJ 2004-11-24 LJ LJ 2004-11-26 LJ LJ 2004-12-03 - LJ 2004-12-08 - LJ 2004-12-10 LJ LJ 2004-12-13 - LJ 2004-12-15 - LJ 2004-12-16 - AT 2004-12-17 - LJ 2004-12-21 - RH 2004-12-31 - RH 2005-01-05 - RH 2005-01-10 - LJ 2005-01-14 - LJ 2005-01-18 LJ LJ 2005-01-21 LJ LJ 2005-01-24 AT - 2005-01-28 - LJ 2005-01-31 - AT 2005-02-07 2005-02-10 LJ LJ 2005-02-14 LJ LJ 2005-02-14 LJ AT 2005-02-17 LJ - 2005-02-22 AT - 2005-02-23 LJ - 2005-02-25 LJ - 2005-02-28 LJ - 2005-03-03 LJ LJ 2005-03-08 AT - 2005-03-10 LJ - 2005-03-17 LJ - 2005-03-23 LJ - 2005-04-01 LJ - LJ = Linda Jonsson AT = Anders Tärnström, Anox RH = Regine Haker, Läckeby Water Group