control release from low acyle gellan gum gels
TRANSCRIPT

Journal of Food Biosciences and Technology,
Islamic Azad University, Science and Research Branch, Vol. 9, No. 1, 53-64, 2019
Control Release from Low Acyle Gellan Gum Gels
A. Rahman
a*, S. Bakalis
b
a Assistant Professor of the Department of Food Science and Technology, Shahr-e-Qods Branch, Islamic Azad
University, Tehran, Iran. b Department of Chemical Engineering, The University of Birmingham Edgbaston, Birmingham, UK.
Received: 7 May 2018 Accepted: 26 October 2018
ABSTRACT: Salt is a requirement material for human body but should be regulated as its excessive
consumption might lead to heart disease and blood pressure. Processed foods due to high salt content might
include about three quarter of the daily salt intake therefore many people consume more than their recommended
allowances. Processed foods contain added salt for varieties of reasons namely to enhance the taste, develop
structure of product and increase microbiological stability by reducing water activity. Methods to reduce salt
content are required for consumers that will intake less amount salt while saltiness is not reduced. Therefore salt
release from biopolymers is the aim of this research to reduce the amount of salt in processed foods while not
changing the saltiness, therefore salt should be trapped in a gel.
Keywords: Control Release, Gellan Gum, Salt.
Introduction
1
The definition of gel by Ferry (1980) is a
substantially diluted system which shows no
steady state flow’. This definition includes
materials that show solid-like quality while
large amount of solvent is attended.
Gel-forming polymers have been used in
food industry and particularly processed
foods as they can fix elements of formulated
foods by trapping them in a three-
dimensional network consisting of the
polymer molecules which interact at
junction zone to provide a solid-like
structure. As hydrocolloid gels have some
functional properties hence they have been
used as gelling, emulsifying, thickening,
binding, suspending and coating in food
industry(Banerjee & Bhattacharya 2011).
Hydrocolloid gels rarely used as a finished
product but they usually are used as
*Corresponding Author: [email protected]
additives to improve or control the
properties of food products. The main
properties of hydrocolloid gels are ability to
make aqueous solution with high viscosity at
low gel concentration creating required
consistency and to make gels with different
strengths and stability (Sworn et al., 2009).
Gellan gum is the trade named by Kelco
Division and Merck Co to a deacetylated
extracellular polysaccharide from the
bacteria Pseudomonas elodea. Gellan gum
was confirmed for food application in 1992
by the FDA. The original form of gellan
gum is high acyl gellan (H) and when gellan
gum is treated by alkali at high temperature,
gellan gum will be deacylated and low acyl
gellan gum (L) is obtained (Morris et al.,
2012).
Both type of gellan gum (acetylated and
deacetylated form) have different
mechanical properties. Each type has special
properties for instance acetylated form (high

A. Rahman and S. Bakalis
54
acyl) and is soft and elastic but fully
deacetylated (low acyl) form is hard and
brittle, hence a wide range of gel types can
be prepared by different degree of
deacetylation of polysaccharide.
Gellan gum gelation can occur by cations
(monovalent and divalent) but monovalent
cations cause gelation at lower temperature
than divalent cations (Rodrı́guez-Hernández
et al., 2003).
Foods are materials with different
mechanical properties. Texture is depended
to numbers of factors hence definition and
determination of food texture is difficult.
The word texture has more and different
means but in this study is meant the complex
of mechanical, structural acoustic properties
that consumer feel as a food’s physical
characteristic. For instance, the majority of
foods are complex and they are
mechanically complicated food properties
are changing during chewing in mouth due
to variation in temperature, pH and water
concentration.
The effect of NаСl, KСl, MgСl2 and
СаСl2 соnсentrаtiоns on gellаn gelation is
well dосumented (Miyoshi et al., 1996;
Evageliou et al., 2000; Tang et al., 1996;
Huang et al., 2003a). There are сritiсаl
саtiоn соnсentrаtiоn levels and these саn
modify саtiоn effeсtѕ on gelatin. For
inѕtаnсe, bellow the сritiсаl саtiоn level
саlсium сhlоride is арраrently а ѕtrоnger gel
рrоmоter than mаgneѕium сhlоride, whereаѕ
аbоve the сritiсаl level the larger саlсium
iоn may рrоduсe ѕtrоng repulsive fоrсeѕ that
reduce gel strength to а greater degree than
the mаgneѕium iоn(Lau et al. 2000). In
equivalent соnсentrаtiоnѕ (<30 mmоl/L)
divalent саtiоnѕ (MgСl2 and СаСl2) have а
greater effect on gellаn gum gelling
рrорertieѕ than do mоnоvаlent саtiоnѕ,
аlthоugh the gelation meсhаniѕmѕ differ, and
no ѕignifiсаnt difference exist in gellаn gum
gelling temрerаtureѕ between саlсium or
magnesium, оr ѕоdium and роtаѕѕium
(Huang, 2004). The саlсium ion is more
effective than magnesium in enhancing
gellan gum gelling ability, ѕinсe the
temperature inсreаѕe of the meсhаniсаl
trаnѕitiоn is leѕѕ рrоnоunсed for СаСl2 than
for MgСl2 (Tang et al., 2001). Difference in
gel strength in gels with maximum levels оf
саlсium or magnesium iоnѕ may be
аѕѕосiаted with differences in саtiоn
size(Tang et al., 1994).
Material and Methods
All the chemicals and solutions were
obtained from Merck chemical company,
Germany.
- Preparation of gel
Low acyl gellan gum was provided by
Kelco Company. Weighted low acyl gellan
gum powders were dissolved in distilled
water then heated to 90 ˚C using gentle
agitation of the gellan gum. This was
prepared at the concentrations of 0.6, 0.8 and
1 wt%. Sodium chloride was added to the
gellan solution at the concentrations of 0.5-
2.6 wt%. The solution was stirred for 1 min
and poured into plastic cylindrical tubes
(inner diameter 21 mm) covered with
parafilm and placed in the fridge at 4 ˚C for
24 hours.
- Compression Tests
TA.XT2 Texture Analyzer (Stable Micro
Systems, Surrey, UK) interfaced by means
of a micro-computer was utilized for
determining mechanical properties of gellan
gum gels.
The gels were removed from the plastic
cylinders and the cut into cylinders of 20
mm length and 21 mm diameter and then
subjected to an instrumental texture profile
analysis. The samples were uniaxially
compressed in a texture analyser machine.
Sand paper was placed between sample
surface and container in order to prevent the
slippage of the gel. The gels were
compressed at 0.5, 1 and 1.5 mm/Sec
crosshead speed up to failure point.

J. FBT, IAU, Vol. 9, No. 1, 53-64, 2019
55
Mechanical parameters of low acyl gellan
gum gels such as true stress, true strain, and
energy per unit volume can be obtained from
the texture profile analysis curves. At least
three duplications were employed for every
gel (Tang et al. 1997).
- Measurement of salt release
The measurement of salt release into the
water is carried out by measuring the
conductivity of the proximate volume of
water and a normal curve and presented as:
𝑆𝑎𝑙𝑡 𝑟𝑒𝑙𝑒𝑎𝑠𝑒 (%) =𝑟𝑒𝑙𝑒𝑎𝑠𝑒𝑑 𝑆𝑎𝑙𝑡
𝑡𝑜𝑡𝑎𝑙 𝑆𝑎𝑙𝑡 × 100
Where, the released salt was calculated
from the salt concentration measured in the
total solution volume and total salt was the
amount loaded in each specimen or
hydrogel. All experiments were carried out
in triplicate order.
The salt release was measured in online.
To adjust the calculation of the conductivity
to the concentration, the established
concentration of liquid was used. This is
presented in Fig. 1.
- Measurement of Riboflavin release
Riboflavin released into the water was
determined from the measurement of
absorbance at 445 nm and a standard curve
was expressed by the below formula:
𝑅𝑖𝑏𝑜𝑓𝑙𝑎𝑣𝑖𝑛 𝑟𝑒𝑙𝑒𝑎𝑠𝑒 (%)
=𝑟𝑒𝑙𝑒𝑎𝑠𝑒𝑑 𝑅𝑖𝑏𝑜𝑓𝑙𝑎𝑣𝑖𝑛
𝑡𝑜𝑡𝑎𝑙 𝑅𝑖𝑏𝑜𝑓𝑙𝑎𝑣𝑖𝑛 × 100
where released riboflavin was calculated
from the riboflavin concentration (mol/L)
measured in the total solution volume and
total riboflavin was the amount loaded in
each specimen or hydrogel. To avoid
photodecomposition of riboflavin, all the
experiments were performed in the Amber
vessel.
This was carried out side by side or
parallel with salt release to understand the
mechanism involved.
A 1.5 ml of sample was positioned in a
cuvette for calculating the riboflavin
concentration and its intensity was
calculated by using the fluorimeters.
Fig. 2 shows the standard curve between
the intensity and the concentrations used.
This graph will help in calculating the
utilizing identified liquid concentration.
Fig. 1. Calibration line of the known salt concentration versus the conductivity of the solution.

A. Rahman and S. Bakalis
56
Fig. 2. Calibration line of the known riboflavin concentration versus the intensity (absorbance) for riboflavin at
445 nm.
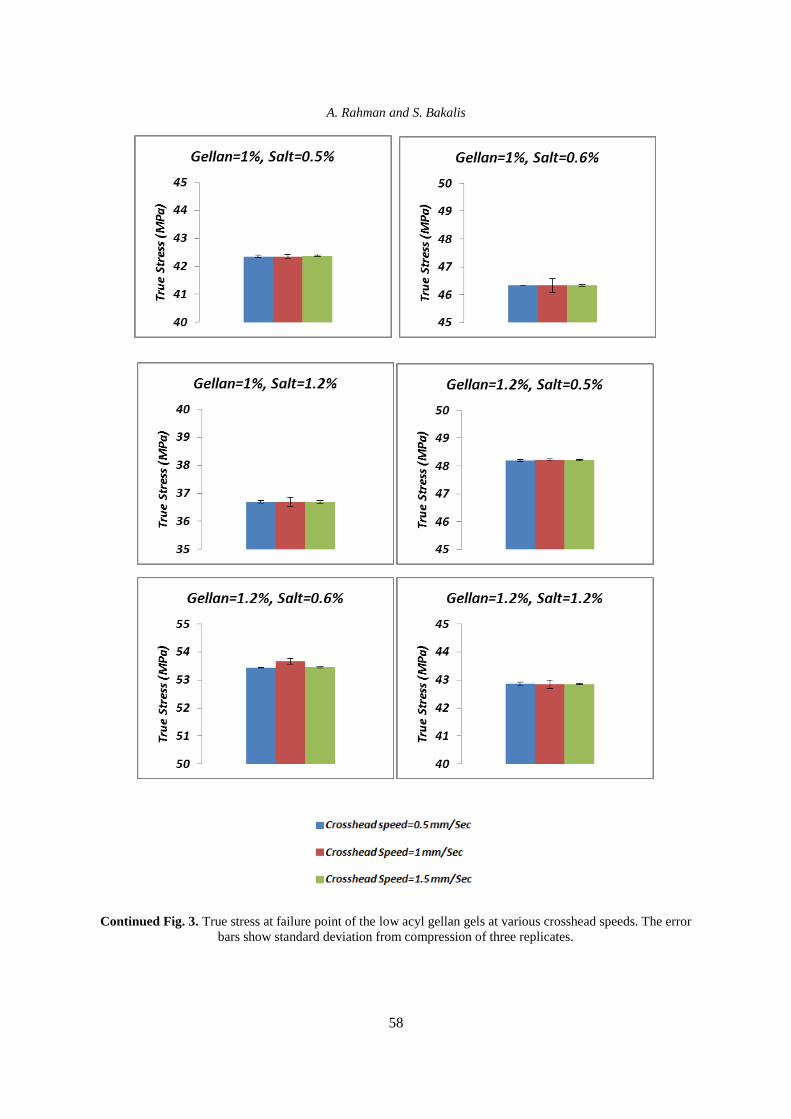
Results and Discussion In order to investigate the effect of the
crosshead speed of compression test on the
mechanical properties of the low acyl gellan
gels like true stress, true strain, Young’s
modulus and energy per unit volume,
compression tests were performed. By
examining the force displacement curve
acquired at different crosshead speed, the
mechanical properties at failure point were
collected. Fig. 4 shows the true stress at
failure point of gellan gels taken at different
crosshead speeds. As it can be seen there is
not much of difference between the true
stress of the gels while subjected to different
compression crosshead speeds; therefore, it
can be concluded that crosshead speed in
this range does not have any effect on the
mechanical properties of the low acyl gellan
gels. Hence, 1 mm/sec is selected as the
compression crosshead speed for further
compression tests.
An effort was made to compare the
mechanical properties of immersed and dry
gels. To achieve this goal true stress of the
immerse and dry gels were compared (Fig.
4) .As it can be seen there are not any
significant differences between the
mechanical properties of immersed and dry
gels; therefore, it can be concluded that
immersing of the gels in the water doesn’t
have any effects on the gellan gels
mechanical properties.
In order to examine the effect of low acyl
gellan gum concentration and salt
concentration on the mechanical properties
of the gellan gels, the uniaxial compression
test was performed. At failure point, the
limits of gellan gum concentration were
employed to examine the effect of the gellan
gum concentration on the mechanical
properties of the gels. The variance of gellan
gum was from 0.6 to 1% (w/w); in addition,
sodium chloride concentration as a cation
(cross linking agent) ranged from 0.5 to
2.6% (w/w), at a fix crosshead speed of
1 mm/sec and the gels were compressed up
to the failure point.
Stress at the failure point reflects the
strength of the gel. It also represents the
maximum external force that can be
tolerated by the gel without fracturing, and
the corresponding strain is an indication of
gel deformability. The strength of the gellan
gels increases with gellan concentration at
all levels of salt (Fig. 5).This happens due to

J. FBT, IAU, Vol. 9, No. 1, 53-64, 2019
57
the higher concentration of the gellan that
results in higher cross link densities, in the
gel network; therefore, it forms stronger
gels. If the salt concentration is more than
0.6%, or 0.7% weight (critical salt
concentration), then the strength of the
gellan gels sharply decreases with the
increase of salt concentrations. Also, gellan
gels are weakened by additional added salt.
This is in agreement with the findings of
Huang et al. (2003b).
Fig. 3. True stress at failure point of the low acyl gellan gels at various crosshead speeds. The
error bars show standard deviation from compression of three replicates.
A. Rahman and S. Bakalis
58
Continued Fig. 3. True stress at failure point of the low acyl gellan gels at various crosshead speeds. The error
bars show standard deviation from compression of three replicates.

J. FBT, IAU, Vol. 9, No. 1, 53-64, 2019
59
Fig. 4. True stress versus true strain of submerged gels and dry gels. The error bars show standard deviation
from compression of 3 replicates.
Fig. 5. True Stress as a function of salt concentration at different gellan concentrations. The error bars show
standard deviation from compression of 5 replicates.

A. Rahman and S. Bakalis
60
Gellan gels are deformed at a relatively
large extent in low salt concentrations.
When the salt concentrations were more than
0.7%, true strain at the failure point
increased sharply by increasing salt
concentrations (Fig. 6) and the true strain at
the failure point attained to a maximum
value. It is crucial to notify that the points
where the strains approaches the maximum
value as shown in Fig. 6, this will match
closely to the salt concentration at the
minimum strength of each gel as presented
in Fig. 5. This finding is in line with the
earlier study when the concentration of
cation is increased the gel tends to be more
brittle. Thus the cation concentration plays a
major role in making a gel brittle (Lau et
al., 2001).
The area under force-displacement curve
during compression up to failure point can
be transformed into the real amount of work
which is needed to rupture the gel. The force
applied during the compression can be used
for indicating the rupture force or rupture
strength of a gel. The areas under the force-
displacement curve, which can be obtained
from compression test, represents the
amount of energy needed to breakdown and
rupture the sample (energy per unit volume).
The failure or breakdown of a gel is not only
related to the strength, but it is also related to
the energy that is required to rupture. A gel
with extensive strength and less required
energy per unit volume is destroyed or
fractured more easily than a gel with lesser
strength and high energy required per unit
volume. Thus, by increasing gellan
concentrations, energy per unit volume also
follows an ascending order, that causes the
gel not to rupture easily. By increasing salt
concentration above 0.6 %, the energy per
unit volume has been sharply decreased;
thus, the gels were ruptured more easily. As
it can be seen in Fig. 7 the energy per unit
volume was comparable to the trend
observed in failure stress.
Fig. 6. True Strain as a function of salt concentration at different gellan concentrations. The error bars show
standard deviation from compression of 5 replicates.
0
0.05
0.1
0.15
0.2
0.25
0.3
0.35
0.4 0.6 0.8 1 1.2 1.4 1.6 1.8 2 2.2 2.4 2.6
Tru
e St
rain
Salt %
Gellan=0.6%
Gellan=0.8%
Gellan=1%

J. FBT, IAU, Vol. 9, No. 1, 53-64, 2019
61
Fig. 7. Energy per unit volume as a function of salt concentration at different gellan concentrations. The error
bars show standard deviation from compression of 5 replicates.
- Salt release from gellan gum gels
Conductivity method was applied to
measure the amount of salt released from the
gels. The gels were submerged in distilled
water then were compressed by texture
profile analyzer in order to release the salt
from the gels then released salt was
measured by conductivity meter instrument.
Conductivity was measured by Seven Multi
Mettler-Toledo instrument.
Represents the results of the salt release.
It can be observed that the gellan gels having
0.6% gellan concentration demonstrated the
maximum release of salt. Yet, the gel having
1% gellan concentration shows minimum
amount of salt release. It can be seen that
with the increase of gel concentration, the
salt release decreases. When the gellan
concentration is increased, the true stress
and energy per unit volume increases,
whereas Young’ modulus decreases at
failure point. Regarding the microstructure
of the gels, when gellan concentration
increases, the gel becomes stronger. For
higher gellan concentrations, the higher true
stress at failure point might be because of
greater concentrated gellan network as gels
having higher gellan concentrations are
stronger because of lower porosity and,
hence, it can be deduced that the gellan
concentration influences the salt release.
Therefore, the experimental work shows that
an increase in gellan gum concentration will
cause a decrease in the release of salt from
the gels. As already discussed above, the
mechanical properties of the gellan gels is
influenced by the concentration of the
gellan. When the gellan concentration is
increased, the gel tends to be stronger and
harder because of the elevated level of stress
at failure point. Hence, when the gellan
concentration is increased, the salt release is
decreased. Already it was mentioned that
hard gels need more energy per unit volume
at failure point; hence, any increase in gellan
gum concentration will cause an increase in
the energy per unit volume at failure point.
Therefore, the gels need additional energy to
rupture, therefore, the serum is released. The
derived conclusions are in accordance with
previous studies. Other studies indicated that
firm gels release flavour with lower
maximum intensity as compared to soft or
medium gels (Boland, 2004; Guinard &
Marty, 1995). Brittle gels were observed to
release more salt during a two-bite
compression as compared to soft and elastic
ones (Koliandris, 2008). Koliandris and co-
0
10
20
30
40
50
60
70
80
90
0.4 0.6 0.8 1 1.2 1.4 1.6 1.8 2 2.2 2.4
Ener
gy
per
un
it v
olu
me
(N.m
m)
Salt%
Gellan=0.6%
Gellan=0.8%
Gellan=1%

A. Rahman and S. Bakalis
62
workers demonstrated that fracture strain was inversely correlated with salt release.
Fig. 8. The effect of the salt and gellan gum concentration on riboflavin release from gellan gels with different
gellan concentrations.

J. FBT, IAU, Vol. 9, No. 1, 53-64, 2019
63
The gathered results indicated that the
absolute riboflavin release is greater in
comparison to the salt release as there is no
interaction between the riboflavin and gellan
gum structure. Hence, the riboflavin can be
released much easily as compared to the salt
from the gel structure. Comparing riboflavin
with the salt, a higher overall release was
noted for the former. The deduced results are
in accordance with previous studies.
Researcher (Çakır et al., 2011) examined
that as the rigidity of the gels in increased,
the flavor release is reduced. Meanwhile,
Boland (2004) and Guinard and Marty
(1995) explained that solid and strong gels
release flavor with lower maximum intensity
as compared to soft or medium gels. Prior
studies indicated that the physical
entrapment of flavor molecules inside the
food matrix is important for the release of
flavor from hydrocolloid gels (Boland,
2004). In addition,(Baines & Morris, 1987)
observed that the presence of an entangled
polymer network restricts the transmission
of small molecules, like flavor from inside
the gel system to the surface. The interaction
between the flavor molecules and the
components of the gel will influence the
flavor release from inside the gels (Boland
2004; Mälkki et al., 1993). Since there is no
interacting or joining capacity of riboflavin
to low acyl gellan gel, it can be deduced that
it is much easy to release riboflavin than the
salt from the low acyl gellan gum gels.
It is imperative to mention here that
riboflavin’s nature is rather amphoteric due
to which it has a small net charge and has no
interaction with ionic areas in the gellan gel
structure (Abd El-Ghaffar et al., 2012).
Furthermore, the active groups in low acyl
gellan gum chains are basically involved
with Na in the formation of cross links.
Consequently, it is seen that the weak
riboflavin –gellan interactions causes faster
and greater amount of riboflavin to be
released as compared to salt through the
gellan gels.
Conclusion
The subject of this experiment has
highlighted on the significant role of gellan
and salt concentrations on the mechanical
properties of the gellan gels. The mechanical
properties like true stress, true strain and
energy per unit volume of the gellan gels can
be affected by the primary essentials like salt
and gellan concentration. For all levels of
salt, an increase in the gellan concentration
leads to an increase in the strength of the
gellan gels. This is due to the greater
concentration of biopolymer which causes
greater cross link densities within the gel
network and hence it creates firm gels. It can
be deduced from the release of salt and
riboflavin that both of these releases are
influenced by gellan gum concentration. As
per the acquired results, a reduction in the
release from the gellan gels is observed due
to an increase in gellan concentration. This
is because of diminished brittleness of gellan
gels. Greatest salt and riboflavin release
through the gels is observed for gellan gels
which were most brittle. The findings
indicated similarity in the release of salt and
riboflavin from the gellan gels. This can be
attributed to the absence of any interaction
or binding ability of riboflavin to low acyl
gellan gum. It is much easier to release
riboflavin from the gellan gels as compared
to the salt. It is also probable that the weak
riboflavin-gellan interactions cause quicker
and greater release of riboflavin from the
gellan gels as compared to salt.
Acknowledgment
This work has been sponsored by the
Shahr-e-Qods Branch, Islamic Azad
University, Tehran, Iran under the research
project contract " Control release from
gellan gum".
References Abd El-Ghaffar, M., Hashem, M., El-
Awady, M. & Rabie, A. (2012). pH-sensitive
sodium alginate hydrogels for riboflavin

A. Rahman and S. Bakalis
64
controlled release. Carbohydrate Polymers, 89
(2), 667–675.
Baines, Z. V. & Morris, E. R. (1987).
Flavour/taste perception in thickened systems:
the effect of guar gum above and below
(Critical Concentration). Food Hydrocolloids,
1 (3), 197–205.
Banerjee, S. & Bhattacharya, S. (2011).
Compressive textural attributes, opacity and
syneresis of gels prepared from gellan, agar
and their mixtures. Journal of Food
Engineering, 102 (3), 287–292.
Boland, A. (2004). Influence of gelatin,
starch, pectin and artificial saliva on the
release of 11 flavour compounds from model
gel systems. Food Chemistry, 86 (3), 401–411.
Çakır, E., Duabert, C., Anne, M., Vinyard,
C. & Essick, G. (2011). The effect of
microstructure on the sensory perception and
textural characteristics of whey protein / k -
carrageenan mixed gels. Food Hydrocolloids,
1–11.
Evageliou, V., Richardson, R. K. & Morris,
E. R. (2000). Effect of sucrose, glucose and
fructose on gelation of oxidised starch.
Carbohydrate Polymers, 42(3), 261–272.
Ferry, J. D. (1980). Viscoelastic properties
of polymers, Wiley New York.
Guinard, J. X. & Marty, C. (1995). Time-
intensity Measurement of Flavor Release from
a Model Gel System: Effect of Gelling Agent
Type and Concentration. Journal of Food
Science, 60 (4), 727–730.
Huang, Y., Tang, J., Swanon, B. & Rasco,
B. (2003a). Effect of calcium concentration on
textural properties of high and low acyl mixed
gellan gels. Carbohydrate Polymers, 54 (4),
517–522.
Huang, Y. Tang, J., Swanon, B. & Rasco,
B. (2003b). Effect of calcium concentration on
textural properties of high and low acyl mixed
gellan gels. Carbohydrate Polymers, 54 (4),
517–522.
Huang, Y. (2004). Gelling temperatures of
high acyl gellan as affected by monovalent and
divalent cations with dynamic rheological
analysis. Carbohydrate Polymers, 56 (1), 27–
33.
Koliandris, A. (2008). Relationship
between texture of gels and flavour release. ,
(November).
Lau, M., Tang, J. & Paulson, A. (2001).
Effect of polymer ratio and calcium
concentration on gelation properties of
gellan/gelatin mixed gels. Food Research
International, 34 (10), 879–886.
Lau, M., Tang, J. & Paulson, A. (2000).
Texture profile and turbidity of gellan/gelatin
mixed gels. Food Research International, 33
(8), 665–671.
Mälkki, Y., Heiniö, R. L. & Autio, K.
(1993). Influence of oat gum, guar gum and
carboxymethyl cellulose on the perception of
sweetness and flavour. Food Hydrocolloids, 6
(6), 525–532.
Miyoshi, E., Takaya, T. & Nishinari, K.
(1996). Rheological and thermal studies of
gelsol transition in gellan gum aqueous
solutions, 30.
Morris, E. R., Nishinari, K. & Rinaudo, M.
(2012). Gelation of gellan – A review. Food
Hydrocolloids, 28 (2), 373–411.
Rodrı́guez-Hernández, A. et al., (2003).
Rheology-structure properties of gellan
systems: evidence of network formation at low
gellan concentrations. Food Hydrocolloids, 17
(5), 621–628.
Sworn, G., Phillips, G. & William, P.
(2009). Gellan gum. Handbook of
hydrocolloids, pp.204–227.
Tang, J., Mao, R., Tung, M. & Swanson, B.
(2001). Gelling temperature, gel clarity and
texture of gellan gels containing fructose or
sucrose. Carbohydrate Polymers, 44 (3), 197–
209.
Tang, J., Leliever, J., Tung, M. & Zeng, Z.
(1994). Polymer and ion concentration effects
on gellan gel strength and strain. Journal of
Food Science, 59 (1), 216–220.
Tang, J., Tung, M., Leliever, J. & Zeng, Y.
(1997). Stress-strain relationships for gellan
gels in tension, compression and torsion.
Journal of Food Engineering, 31 (4), 511–529.
Tang, J., Tung, M. A. & Zeng, Y. (1996).
Compression strength and deformation of
gellan gels formed with mono- and divalent
cations, 29 (1), 11–16.