controlled thermo-mechanical processing of …/67531/metadc...jmak johnson-mehl-avrami-komologrov...
TRANSCRIPT

FINAL REPORT AWARD NUMBER: DE-FC36-99ID13819 Period: September 30, 1999 – August 12, 2005
CONTROLLED THERMO-MECHANICAL PROCESSING OF TUBES AND PIPES
FOR ENHANCED MANUFACTURING AND PERFORMANCE THE TIMKEN COMPANY – Prime Recipient Alloy Steel Business Project Manager: Robert V. Kolarik II (330-471-2378) 1835 Dueber Avenue, S.W. Mail Code: RES-04 P.O. Box 6930 Canton, Ohio 44706-0930 November 11, 2005 Prepared for U.S. DEPARTMENT OF ENERGY Golden Field Office 1617 Cole Boulevard Golden, Colorado 80401-3393
i

Project Team Members (as they existed at the time of the award) Colorado School of Mines CSM Project Leader: Golden, Colorado 80401 Mark T. Lusk (303-273-3675) Ford Motor Company Ford Project Leader: 24500 Glendale Avenue Claude M. Mack (313-592-2665) Redford, Michigan 48239 Friedrich Kocks Gmbh & Co. Kocks Project Leader: P.O. Box 100753 Rötger Teyke (49-2103-790208) 40707 Hilden, Germany Idaho National Engineering & Environmental Laboratory INEEL Project Leader: Lockheed Martin Idaho Technologies Company S. M. Sorensen (208-526-9662) P.O. Box 83415 Idaho Falls, Idaho 83415 NACHI Machining Technology Company NACHI Project Leader: 17500 Twenty-Three Mile Road Frances J. Wisner (810-263-0142) Macomb, Michigan 48044 National Research Council Canada IMI Project Leader: Industrial Materials Institute Guy Lamouche (450-641-5106) 75 de Mortagne Boucherville, Quebec, J4B 6Y4, Canada Oak Ridge National Laboratory ORNL Project Leader: Instruments and Controls Division C. Ray Brittain (423-574-8949) P.O. Box 2008 Oak Ridge, Tennessee 37831 Sandia National Laboratories SNL Project Leader: Materials and Processes Center J. Bruce Kelley (505-845-3105) P. O. Box 5800 Albuquerque, New Mexico 87185 Scientific Forming Technologies Corporation SFTC Project Leader: 5038 Reed Road Wei-Tsu Wu (614-451-8330) Columbus, Ohio 43220 Synaps, Inc. Synaps Project Leader: 2957 Clairmont Rd – Suite 170 Alexander Van der Velden (404-320-7283) Atlanta, Georgia 30329 The University of British Columbia UBC Project Leader: Advanced Materials & Process Engineering Laboratory Mary A. Wells (604-822-1918) Room 111 - 2355 East Mall Vancouver, British Columbia, V6T 1Z4, Canada
ii

Additional Project Team Members (Other contact information available upon request)
The Timken Company Automotive Business Contact: Canton, Ohio Roger Ellis
AGH Krakow – University of Mining & Metallurgy UMM (ELROLL) Contact: Krakow, Poland Maciej Pietrzyk
Case Western Reserve University CWRU Contact: Cleveland, Ohio Gary Michal
Central Iron & Steel Research Institute CISRI Contact: Beijing, China Zhengdong Liu
DaimlerChrysler Corporation DaimlerChrysler Contact: Detroit, Michigan Eric McCarty
EB Scientific Enterprises EB Contact: Golden, Colorado Elliot Brown
Engel Metallurgical, Ltd. Engel Contact: St. Cloud, Minnesota James Brusso
Gas Technology Institute GTI Contact: Des Plaines, Illinois Harry Kurek
Harbin Institute of Technology HIT Contact: Harbin, China Jitai Niu
InductoHeat InductoHeat Contact: Madison Heights, Michigan Valery Rudnev
The Ohio State University OSU Contact: Columbus, Ohio Ragiv Shivpuri
The Osada State Tube Institute DTI-VNITI Contact: Dniepropetrovsk, Ukraine Gennady Gulyayev
QuesTek Innovations, LLC QuesTek Contact: Chicago, Illinois Charles Kuehmann
SHAPE SHAPE Contact: Seoul, Korea Juyoung Lee
U.S. Steel Group/USX Corporation USS Contact: Monroeville, Pennsylvania Matt Merwin
Verein zur Forderung der Umform- und Produktionstechnik Riesa e.V. VFUP Riesa Contact: Riesa, Germany Frank Gerlach
Yanshan University YSU Contact: Quinghuangdao, China Chao Zhou
iii
List of Abbreviations
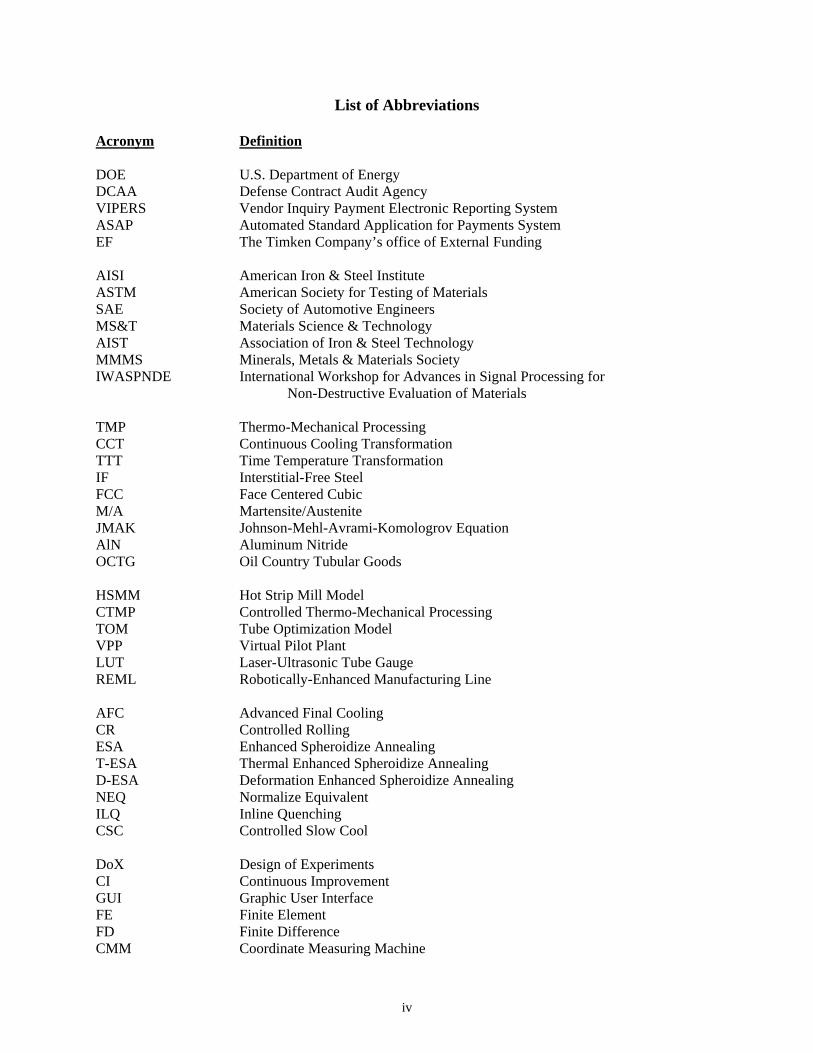
Acronym Definition DOE U.S. Department of Energy DCAA Defense Contract Audit Agency VIPERS Vendor Inquiry Payment Electronic Reporting System ASAP Automated Standard Application for Payments System EF The Timken Company’s office of External Funding AISI American Iron & Steel Institute ASTM American Society for Testing of Materials SAE Society of Automotive Engineers MS&T Materials Science & Technology AIST Association of Iron & Steel Technology MMMS Minerals, Metals & Materials Society IWASPNDE International Workshop for Advances in Signal Processing for Non-Destructive Evaluation of Materials TMP Thermo-Mechanical Processing CCT Continuous Cooling Transformation TTT Time Temperature Transformation IF Interstitial-Free Steel FCC Face Centered Cubic M/A Martensite/Austenite JMAK Johnson-Mehl-Avrami-Komologrov Equation AlN Aluminum Nitride OCTG Oil Country Tubular Goods HSMM Hot Strip Mill Model CTMP Controlled Thermo-Mechanical Processing TOM Tube Optimization Model VPP Virtual Pilot Plant LUT Laser-Ultrasonic Tube Gauge REML Robotically-Enhanced Manufacturing Line AFC Advanced Final Cooling CR Controlled Rolling ESA Enhanced Spheroidize Annealing T-ESA Thermal Enhanced Spheroidize Annealing D-ESA Deformation Enhanced Spheroidize Annealing NEQ Normalize Equivalent ILQ Inline Quenching CSC Controlled Slow Cool DoX Design of Experiments CI Continuous Improvement GUI Graphic User Interface FE Finite Element FD Finite Difference CMM Coordinate Measuring Machine
iv

List of Abbreviations (continued)
Acronym Definition Btu British Thermal Units HTC Heat Transfer Coefficient IHC Inverse Heat Conduction ISV Internal State Variable KRM Kocks Rolling Mill PSM Kocks Precision Sizing Mill OD Outside Diameter ID Inside Diameter 2-D Two-Dimensional 3-D Three-Dimensional SFM Surface Feet per Minute PC Personal Computer
v

PROJECT OVERVIEW
EXECUTIVE SUMMARY The Alloy Steel Business of The Timken Company answered a competitive solicitation and won an award in September 1999 for the Controlled Thermo-Mechanical Processing (CTMP) project having assembled an impressive group of worldwide experts to serve as subcontracting partners, contractors and consultants. As proposed, the ambitious $83 million five-year project included an R&D phase to be followed by a technology demonstration via deployment of equipment and processes in a new tube mill. The premise of the CTMP work was to combine Timken’s product understanding with its process expertise and knowledge of metallurgical and deformation fundamentals developed during the project to build a predictive process design capability. The project, a logical extension of the Hot Strip Mill Model (HSMM) project done by an American Iron & Steel Institute (AISI) consortium of steel companies with co-funding by the DoE, took advantage of advances in computing hardware and modeling science. A strong international public-private partnership was employed to advance the CTMP project toward its ultimate goal of real-time control of the tube making process. Process recipes were developed using this predictive capability to achieve targeted energy savings from improved efficiency and reduced scrap and rework. Recipes, as well as recommendations from other studies, have been successfully implemented. Conditional approval was given for the project’s future phases based on successful development of the models and associated predictive tools. Proposals for each of the three subsequent project years were approved, although the scope was altered in some cases due to business circumstances. As added tubing capacity was not a Timken business priority, the development of the planetary elongator coupled to the stretch reducing mill for demonstration in a new mill was concluded with the completion of the deformation model and the effort with Kocks was ended. The mill demonstration was replaced as a project task by the development of a Virtual Pilot Plant (VPP) feature. That tool would allow process and equipment scenarios to be evaluated in computer simulations, rather than using production facilities. The CTMP effort succeeded in delivering a PC-based capability in the Tube Optimization Model (TOM) with the VPP of representing the desired tube making process to predict the resultant microstructure. Laboratory experiments and instrumented simulations were key tools in confirming the models and developing predictive algorithms. The results were verified by showing a close correlation of predicted to the recorded values in temperature studies and by the agreement of the microstructures with those predicted in selected base grades. The TOM and VPP combination offer great cost and energy savings potential in design of new plants or the optimization of existing or development of new process recipes. A graphical user-friendly interface (GUI) has been developed for TOM to allow the user to setup the tube making process and to design the CTMP process easily on the computer. Features were included in TOM to allow the user to add other SAE-designated grades to the system either by incorporating published characterizing or empirical metallurgical data, or by altering data already in the system’s database. An optimization capability was included to allow the user to investigate processes or alternatives under restrictions on processing parameters, economics, or other factors. The TOM and its capabilities have been fully documented. Modeling enhancements have been created to make the TOM a more versatile product. The TOM uses FE or FD modeling to represent thermal and deformation effects. The microstructure evolution is based on 2-D FE models, which could be executed faster than 3-D models that were reserved for dimensional studies. Other capabilities, including a grain-size predictor, were developed to allow the user efficiently to explore the effects of processing parameter variation along the tube making process line.
vi

Baseline grades were selected for study during the CTMP project, including a low-carbon bearing grade, an automotive gear steel, and a through-hardened bearing grade. The project tasks, including the metallurgical characterization and model development, were done for each of the grades. Additional grades for other applications, including some special Timken grades, were studied to broaden the correlations and the robustness of the models. The TOM product for commercialization will include the models and a library of the base and general grades as well as some literature data, but not the data from the special Timken grades. A commercialization plan is being developed with engineering and software vendors for the various products derived from the project. Timken may release non-competitive pieces before expiration of the three-year exclusive use period. A number of successful recipes have been developed during the CTMP project. One highlight has been the development of a recipe for automotive gear steels referred to as the Advanced Final Cooling (AFC) process. A key element was the development of a verified surrogate test for gear cutting. Data generated from that product response test challenged Timken’s previous understanding and led to the identification of the optimum structure. The TOM was then used to develop a robust recipe that was effective over a range of tube sizes. Efforts are underway to validate the improved performance of that product in the automotive manufacturers plants, and hence, to facilitate capture of the tooling cost savings. Another project highlight was the work done on Enhanced Spheroidize Anneal (ESA) processes for high carbon, so-called through-hardened bearing steels. Two versions of the process have been explored. One process (D-ESA) uses on-line deformation to achieve an industry standard microstructure. The process was conceptualized, but not studied extensively because of equipment limitations. The other version, T-ESA, uses special thermal sequencing to reduce post processing heat treatment normally used to achieve the desired structure. The T-ESA process was implemented in production midway through the project. During the later portion of the CTMP project, Timken’s focus for cost reduction was on continuous improvement (CI) efforts. As the CTMP tools were developed, they were applied to several of these CI studies. One example was FE model of the reduction mill that was used to optimize the roll pass sequence for best dimension control with fewest defects. Several process changes were implemented. Other capabilities were investigated to complete the concept of modeling the response as well as the processing. In particular, a model from first principles for turning was attempted using FE concepts. Although the development succeeded in producing a representation of the process, the correlation was not sufficient to merit further investigation. A task was included in the CTMP project to perform direct, on-line measurement of the austenitic grain size. That task exploited the successful laser-ultrasonic tube wall and eccentricity gauge (LUT) project done by Timken with DoE co-funding under Award #DE-FC07-99ID13651. Development efforts in the CTMP project, using a signal attenuation approach and parallel data processing, succeeded in delivering a grain size measurement capability for each tube that met targeted accuracy specifications without interfering with the wall measurements. Late in the project, a task was added to demonstrate the deployment of CTMP concepts in a Robotically Enhanced Manufacturing Line (REML) for the efficient production of small lots of tapered roller bearings. Two important concepts for investigation were robotics to enable advanced manufacturing concepts and remove repetitive manual labor, and alternate, on-demand heating techniques for greater efficiency. In addition, the robotic development will look for opportunities to reduce cost and save energy by advancing the area of “lightweight robotics”. In the first phase of the project, equipment was acquired and installed in a process line for later capability studies and optimization. The TOM will be used to explore the best tube product condition as an input to the REML.
vii
FOREWORD The U.S. Department of Energy (DoE) co-sponsored the CTMP project, with Timken agreeing to provide a minimum 30% cost share. Mr. Isaac Chan and Mr. Simon Friedrich monitored the project at DoE Headquarters in Washington D.C. Dr. Gideon Varga, the LUT program manager, is acknowledged for supporting the system’s use for CTMP research. The project initially was administered by DoE’s Idaho Operations Office with Mr. Robert G. Trimberger acting as project manager and Ms. Elizabeth E. Dahl serving as award specialist. The administration was transferred in 2003 to the Golden Field Office where Dr. Dibyajyoti (Debo) Aichbhaumik became project manager and Ms. Jean M. Siekerka served as the award specialist. Payments originally were made from the Albuquerque Office and later from the Oak Ridge Office. Timken’s visionary for the marriage of technologies into the CTMP project was Mr. Erich D. Dominik, who initiated the project effort and served as its executive sponsor until his retirement. Dr. Raymond V. Fryan succeeded Mr. Dominik in the sponsor’s role and provided project direction through its conclusion. Dr. Robert V. Kolarik II served as Timken’s project manager during the project. The CTMP project plan was structured into a number of subtasks – each with its own technical lead. The key subtask leaders are listed below:
• Mr. Jeffery E. Ives - Thermal-Deformation Fundamentals • Mr. E. F. (Buddy) Damm - Metallurgical Characterization • Dr. Daqing Jin - Process Modeling • Mr. Michael E. Burnett • Mr. Craig V. Darragh Product Response • Mr. Robert H. Vandervaart • Mr. Gerald V. Jeskey – Direct Measurement
}Mr. Ives also served as assistant project manager. Other Timken technical staff members supporting project subtasks included Mr. Steven E. Agger, Dr. James A. Brusso, Mrs. Guizhen (Jane) Chen, Mr. Michael L. Mester, Mr. Thomas L. Misanik, Mr. Anthony J. Perez, Dr. Krich Sawamiphakdi, Mr. J. Darrel Yingling and Dr. John C. Wei. Ms. Jo Ann Klingaman, Ms. Hua (Barbara) Guo and Mr. Bruce Calvin played significant roles in administration during the project’s early years. At the conclusion of the project, its administration fell under the purview of the newly formed Timken External Funding Office. The CTMP project was supported by a capable group of engineers and technicians from Timken’s Alloy Steel Business and at Timken Research. An advisory committee of managers served as a steering committee and reviewed project progress and addressed issues on a monthly basis. Quarterly reports were provided to the senior management team of the Steel Business. A group of expert consultants and contractors from various research organizations and national laboratories including those listed behind the title page rounded out the CTMP project team. Each of those resources performed its tasks well and is to be commended for its cooperation and hard work. Several of the proposed partners did not participate in the CTMP project. The U.S. Steel Group withdrew because plant support for the model waned as contracts were being negotiated. The Ford Motor Company and DaimlerChrysler Corporation each provided advice on product targets for automotive gear steels, but only limited acceptance tests were conducted during the project. In an extension to those limited tests, DaimlerChrysler has begun to evaluate material outside the project.
viii

TABLE OF CONTENTS 1) Project Overview
a) Project Team Members i b) Additional Project Team Members ii c) List of Abbreviations iv d) Executive Summary v e) Foreword vii f) Table of Contents viii g) List of Figures x h) List of Tables xiii
2) Introduction
a) Capability Building 1 b) Tube Making Process 2 c) Technical Barriers 3 d) Analytical Tools 3 e) Benefits 4
3) Task 1 - Project Management 6 4) Task 2 – R & D Subtasks 8
a) Subtask 2.1 – Deformation and Heat Transfer – Fundamental Study 10
b) Subtask 2.2 - Metallurgical Characterization i) Metallurgical Models Overview 13 ii) Metallurgical Model Development 13
(1) Grain Growth 13 (2) Recrystallization 14
(a) Phenomenological Approach 14 (3) Monte Carlo Potts Model Approach 16 (4) Flow Stress 18
(a) Phenomenological Approach 18 (b) Internal State Variable (ISV) 20
(5) Austenite Decomposition 21 (a) Internal State Variable (ISV) 21 (b) QuesTek MCASIS 22 (c) CCT-TTT Curves 22
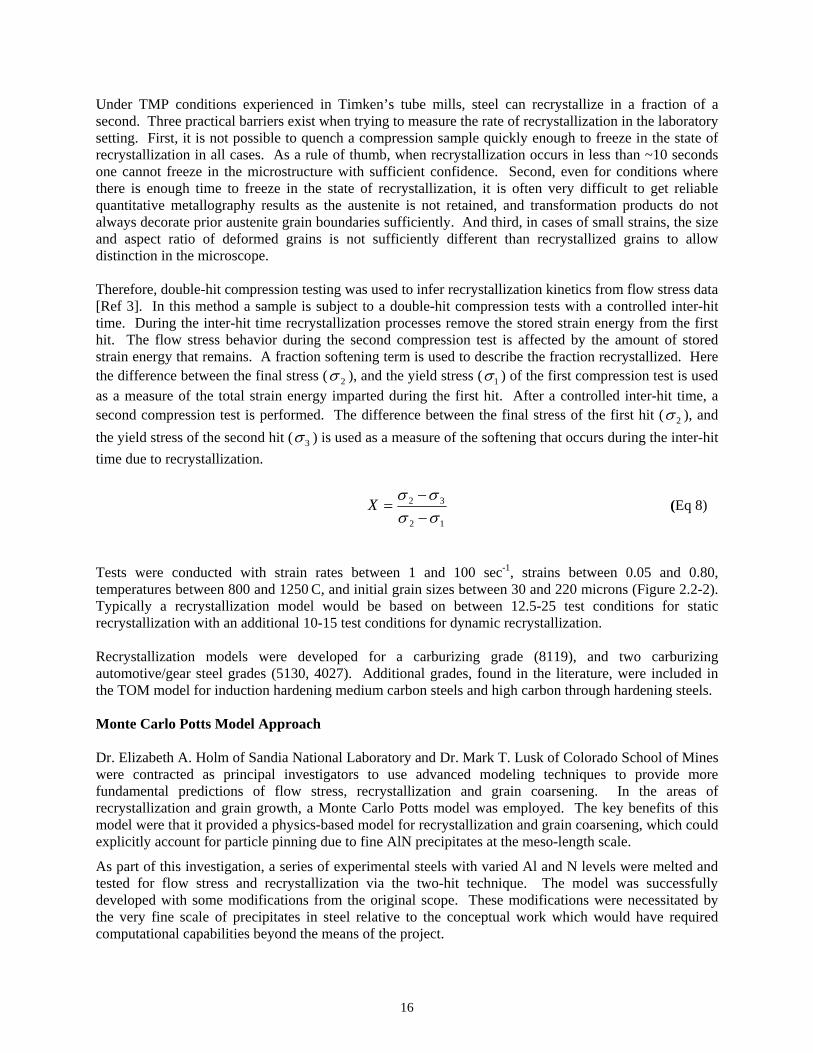
(6) Theoretical Thermal Expansion Coefficients 23
ix

TABLE OF CONTENTS (continued)
Subtask 2.3 - Process Modeling iii) Objectives 26 iv) Development of Process Models 26 v) Tube Optimization Model (TOM) 26
(1) Introduction 27 (2) Piercing Mill Model 27 (3) Assel Elongating Mill Model 29 (4) Reducing Mill Model 29 (5) Stretch Reducing Mill Model 30 (6) Induction Heating Model 31 (7) Quenching/Rapid Cooling Model 32 (8) Controlled Slow Cooling (CSC) Model 32 (9) Material and Metallurgical Models/Database 33
(a) Steel Chemistry 33 (b) Thermal Physical Properties 33 (c) Flow Stress 33 (d) Recrystallization and Grain Growth 34 (e) Transformation Model 34
(10) Tooling and Production Scheduling Module/Database 34 (11) Optimization Module 36 (12) User-Friendly Graphics Interface (GUI) 36 (13) Virtual Pilot Plant (VPP) 37 (14) Verification of TOM 37
vi) 2-D FE Analysis 38 (1) FE Formulations and Algorithms 38 (2) Mannesmann Piercing Mill 39 (3) Assel Elongating Mill 41 (4) Planetary Elongating Mill 43 (5) Radial Forging Process 44 (6) ABAQUS™ - Explicit FE Analysis 46 (7) Straightening Mill 46 (8) SHAPE™ for Simulation of Reducing and Stretch Reducing Processes 50 (9) TubeRoll Program 50 (10) Reducing Mill 50 (11) DEFORM™ for Simulation of Machining Processes 54
vii) Application of Process Modeling Tools 55
c) Subtask 2.4 – Process Simulation 56
x
TABLE OF CONTENTS (continued)
d) Subtask 2.5 - Process Verification i) Process Recipes 57
(1) Advanced Final Cooling (AFC) 57 (2) Controlled Rolling (CR) 60 (3) Thermal Enhanced Spheriodized Annealing (T-ESA) 60 (4) Deformation-Enhanced Spheroids Annealing (D-ESA) 61
ii) Normalize Equivalent (NEQ) 63 (1) Lab Studies 63 (2) Mill Trials 65
iii) Inline Quenching 66
e) Subtask 2.6 - Product Response i) Bearing Business Product Response Tests 70
(1) Screw Machine Test 71 (a) Test Description 71 (b) Test Results 71
(2) Turning Test 71 (a) Test Description 71 (b) Test Results 71
ii) Automotive Customer Product Response Tests 72 (1) Broach Test 73
(a) Test Description 73 (b) Test Results 75 (c) Validation Testing 75
f) Subtask 2.7 - Direct Measurement
i) Application of LUT as Grain Size Sensor 76 ii) Laser-Ultrasonics to Monitor Microstructure 79 iii) LUT Configuration for Gleeble System 80
g) Subtask 2.8 – Controls 82
5) Task 3 – Pilot Plant 84 6) Task 4 – Plant Trials 84 7) Task 5 - Robotically Enhanced Manufacturing Line (REML)
a) Subtask 5.0 – Order and Delivery of Equipment 85 i) Green Cell 85 ii) Thermal Treatment Cell 86 iii) Finish Cell 87
b) Subtask 5.1 – Energy Savings Model Task 88
c) Subtask 5.2 – Tube Optimization Model (TOM) Task 88
8) Reference List 89
xi

List of Figures Number Caption Page 0-1 Timken’s Global Technology Stream vision 1 0-2 Vision of the impact of the CTMP project 2 0-3 Process flow of tube making 2 2.1-1 Comparison of CSC model to measured results 10 2.1-2 a Rig spray test at UBC – Hot tube segment 11 2.1-2 b Rig spray test at UBC – Spray in progress 11 2.2-1 Modeled versus measured grain coarsening kinetics example 14 2.2-2 Modeled versus measured recrystallization kinetics example 17 2.2-3 Monte Carlo time step versus “grain size” in the presence of Zener-pinning particles or ALN 18 2.2-4 Modeled versus measured flow stress examples 20 2.2-5 ISV transformation model predictions for phase fraction as a function of cooling rate and prior austenite grain size for 5130 steel 22 2.2-6 Interface to chemistry based CCT/TTT modeling. 23 2.2-7 Example of measured and modeled dilation data and the resulting phase fractions as determined by the ISV transformation model 25
xii

List of Figures (continued) 2.3-1 TOM GUI 27 2.3-2 Piercing mill model setup 28 2.3-3 Example of results from piercing process simulation 28 2.3-4 Assel elongating model setup 29 2.3-5 Reducing mill model setup 30 2.3-6 Stretch-reducing mill setup 31 2.3-7 Induction heating model application 31 2.3-8 Induction heating model predictability 32 2.3-9 Steel grade database 33 2.3-10 Flow stress database GUI 33 2.3-11 Recrystallization and grain growth GUI 34 2.3-12 Production scheduling GUI 35 2.3-13 Tooling design GUI 35 2.3-14 Optimization GUI 36 2.3-15 a Thermal history and microstructure evolution of seamless tubing during a conventional hot rolling process 38 2.3-15 b Thermal history and microstructure evolution of seamless tube during a cooling process 37 2.3-16 FE models of piecing, Assel elongating and planetary elongating process 39 2.3-17 Typical Mannesmann piercing mill 40 2.3-18 Analysis results of piercing process 40 2.3-19 Typical system of Assel elongating mill 41 2.3-20 FE model of Assel elongating process 42 2.3-21 Deformation of tube along the elongating mill 42 2.3-22 Cross-sections along the forming axis at different locations 42 2.3-23 a Contour of strain rate 43 2.3-23 b Profile of forming load 43 2.3-24 FE model of planetary elongating process 44 2.3-25 Schematic of radial forming process 45 2.3-26 FE model of radial forging process 45 2.3-27 a Strain distribution in the billet 46 2.3-27 b Temperature distribution in the billet 46 2.3-28 FE models of straightening and Assel elongating processes 46 2.3-29 Typical two-roll straightening mill 47 2.3-30 Typical five-roll straightening mill 47 2.3-31 FE model of two-roll straightening process 48 2.3-32 FE model of five-roll straightening process 48 2.3-33 Contact loads from two-roll straightening 49 2.3-34 Contact loads from five-roll straightening 49 2.3-35 Illustration of dual-meshing technique 50 2.3-36 FE model of reducing mill 51 2.3-37 a Analysis results of reduced tube – Contour of temperatures 51 2.3-37 b Analysis results of reduced tube – Contour of residual stresses 51 2.3-38 Comparison of wall variation due to different reduction pass design 52 2.3-39 Typical set up of reducing and stretch reducing mills 53 2.3-40 Analysis results of 18-station stretch reducing mill 53 2.3-41 Comparison of analysis and actual geometries after Station No. 18 53 2.3-42 Representation of machining modeling 54
xiii

List of Figures (continued) 2.4-1 Plant rapid cooling device 56 2.5-1 Comparison of laboratory quench profiles at different tube locations to thermal profiles applied in Gleeble dilatometry investigations for the AFC process 58 2.5-2 Dilation versus temperature curves for two AFC simulations and one full quench (to identify the martensite transformation temperature) 59 2.5-3 Dilation versus time for the AFC simulations shown in Figure 2.5-2 59 2.5-4 a Uniform microstructure produced by 10-hour T-ESA cycle 60 2.5-4 b Uniform microstructure produced by 16-hour T-ESA cycle 60 2.5-5 D-ESA microstructure 62 2.5-6 Tube making physical simulation of the NEQ process using the Gleeble torsion thermo-mechanical process simulator 64 2.5-7 Torque versus torsion (similar to stress versus strain) curves for tube making physical simulation of the NEQ process using the Gleeble torsion thermo mechanical process simulator 64 2.5-8 Grain size versus sink temperature for a series of steels and sink amounts derived from NEQ simulations using the Gleeble torsion thermo- mechanical process simulator 65 2.5-9 Conventionally normalized 1045 66 2.5-10 NEQ processes 1045 (OD) 66 2.5-11 Hardness versus tempering temperature for 4130 subject to a range of processing paths 67 2.5-12 Rotating bending fatigue data for 4130 direct quenching investigation 67 2.5-13 Charpy impact data for 4130 direct quench investigation 68 2.5-14 Strength and ductility variation as a function of tempering temperature and total reduction 69 2.6-1 Broach cutting 72 2.6-2 Structure of a broach bar 72 2.6-3 Typical automotive ring gear 73 2.6-4 a Broach test machine and control stand 74 2.6-4 b Close-up of part manipulation table and coolant lines 74 2.6-5 Broach tool showing three cutting teeth 74 2.6-6 Test ring with a broach tool shown in cutting position 74 2.7-1 a Principle of laser-ultrasonic generation and detection in a tube 76 2.7-1 b Signal acquired on-line for a 16 mm thick tube at 940 C 76 2.7-2 Overview of the laser ultrasonic system 77 2.7-3 Calibration between the fitted attenuation parameter “b” and the austenitic grain size from metallography 78 2.7-4 Grain size measured on-line by the LUT system and measured by metallography after proper quenching 79 2.7-5 Schematic description of the system proposed by IMI 80 5-1 Comparison of energy consumption of REML line versus current process baseline 88
xiv

List of Tables
Number Title Page 2.2-1 Number of substantial atoms per unit cell 24 2.6-1 Broach test validation 75
xv

INTRODUCTION
Capability Building The Timken Company’s technology management team recently developed a model to explain its role in the Company’s global technology stream (Figure 0-1). The model shows the flow of ideas and concepts originating in science, developing via technology, being practiced through engineering, growing to application, expanding by proliferation, leading to commercial value in product sales. The role of the Technology Center is to develop capabilities converting science into technology which can be exploited to manufacture products that are differentiated by such characteristics as better performance and superior properties, or lowest price or reduced energy content.
Figure 0-1. Timken’s Global Technology Stream vision.
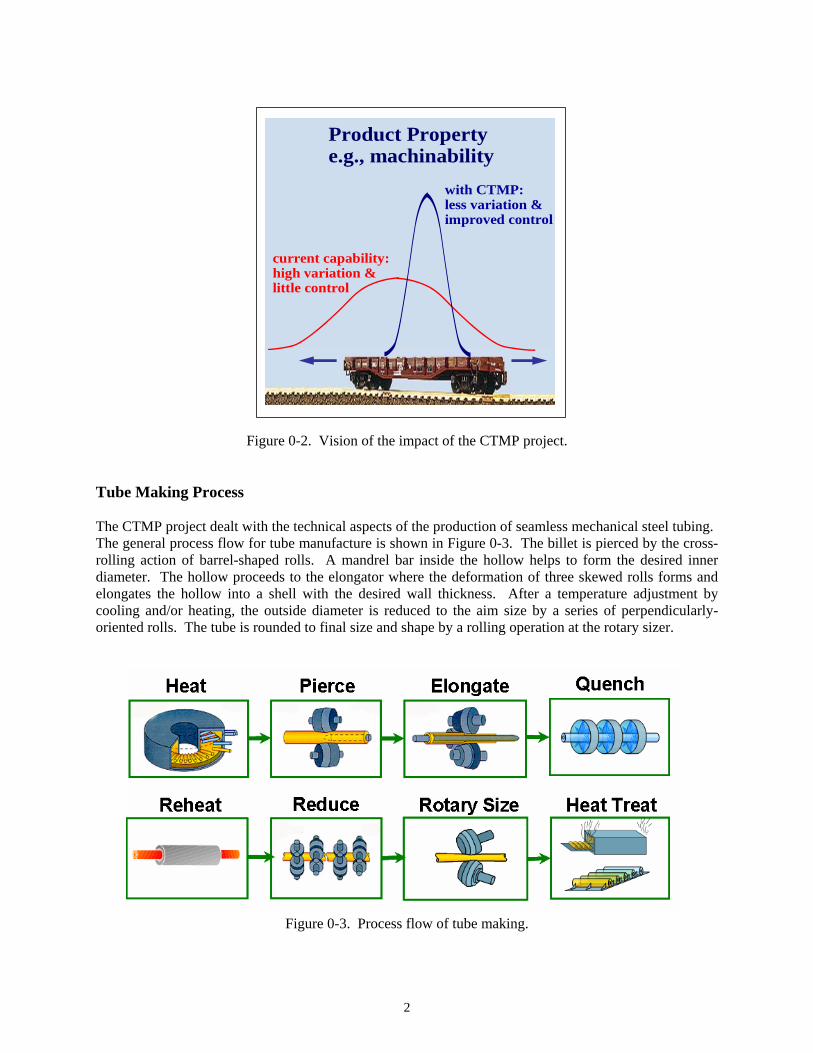
The CTMP project is an excellent example of that capability building. The concept advanced in this project began with the claim that the behavior of steel tube or pipe product can be well enough understood or characterized to suggest a preferred or optimum microstructure and associated concomitant properties for an intended application. Further, with the metallurgy, deformation and thermal sciences sufficiently well understood, modeling and computational technology could be exploited to develop a model of the selected process. That model would then be applied to tailor the process to meet desired specifications. The vision of the CTMP project is illustrated in the railcar analogy shown in Figure 0-2. At the outset of the CTMP project, the tube making resources owned by the domestic producers generally had limited capabilities which typically resulted in product with relatively high variation and provided little capability for control. Application of CTMP was envisioned to enable consistent products to be made with targeted structure and properties. The improved control and less variable properties would result in improved performance in customer applications such as machining. Not only could the response be maximized, the process could be tailored to deliver that same benefit to a specific plant or process conditions as represented by the shifting of the railcar.
1
Product Property e.g., machinability
current capability:
high variation &little control
with CTMP:less variation &improved control
Figure 0-2. Vision of the impact of the CTMP project. Tube Making Process The CTMP project dealt with the technical aspects of the production of seamless mechanical steel tubing. The general process flow for tube manufacture is shown in Figure 0-3. The billet is pierced by the cross-rolling action of barrel-shaped rolls. A mandrel bar inside the hollow helps to form the desired inner diameter. The hollow proceeds to the elongator where the deformation of three skewed rolls forms and elongates the hollow into a shell with the desired wall thickness. After a temperature adjustment by cooling and/or heating, the outside diameter is reduced to the aim size by a series of perpendicularly-oriented rolls. The tube is rounded to final size and shape by a rolling operation at the rotary sizer.
Figure 0-3. Process flow of tube making.
2

Technical Barriers The following were identified as significant barriers to be overcome during the project’s R&D phase:
• Characterization of the effect of retained strain on austenite decomposition, requiring special thermo-mechanical testing,
• Characterization of the effect of low-temperature rolling on the cycle time for ESA, which will require specially designed equipment for low temperature rolling,
• Precise deformation rates, which will require revolutionary equipment and control, • Precise, uniform temperatures during processing, which will require development of
a unique cooling device with sophisticated control, • On-line determination of austenite grain size, which will require development of a
direct measurement sensor, • Integrated system control, which will require sophisticated control of the equipment
and devices with input from the model and sensors. These hurdles, as well as many others encountered during the project, were solved or overcome during the course of the project. As the CTMP project progressed, it became clear that the team was going to be successful in developing verified tools. However, developing the tools was just a means to an end, with one very important end being the creation of process recipes resulting in product with commercial value. During the course of the project, Mr. Roger Kisner of ORNL coined the term “trajectory”. That term appropriately describes the concept that there is a target process path to achieve the desired end, but one that allows some variation and can accommodate correction guided by the appropriate process controls. Analytical Tools Timken’s process team demonstrated command of many analytical tools to assist in the technical development. One such tool is the Design of Experiments (DoX) methodology. Application of DoX facilitates efficient investigation of relationships between controllable factors in a manufacturing process and key customer qualities. In the CTMP program, DoX was used in several of the study areas, including the metallurgical characterization and process recipe development, as well as in verification studies. The issues in these studies were complex and required controlled analytical approaches. The DoX approach accomplishes this efficiently as designs are based on the objective (e.g., factor reduction, ranking, and/or optimization) and allow for balancing the cost of experimentation versus the expected information to be gained. Each of the DoX's involved extensive planning. Most important was determining how to minimize the effect of non-factors so that the most important factors could clearly be determined. This was accomplished by blocking, role assignments, dry runs and contingency planning. The results of the CTMP trials and the efficient development of ultimately effective tools were proof of the power of DoX. In virtually all trials, keys factors were identified and real production practices developed and implemented. This has resulted in better machining (8119 study), quicker heat treat (ESA development), more consistent grain structure (grain size prediction), and quicker product development (broach screening). Application of the DoX greatly improved the efficiency of the project investigations and provided value to Timken and the DoE. The information learned has also been programmed into the optimization feature included in TOM. The optimization approach allows the user to value the cost and properties to seek the most robust solution. The results accomplished on the CTMP project and the capabilities represented in TOM could not have been accomplished without the efficient and robust approach of DoX.
3

Benefits In recent years, there has been some debate between the steel industry, led by progressive companies such as Timken, and the DoE on the subject of benefits. Certainly, the industry recognizes the DoE’s mission to reduce energy consumption, while positively impacting the environment and increasing efficiency leading to increased competitiveness of U.S. industry. However, the steel industry resists the “inside the steel plant fences” limiting view for quantifying savings and maintains that the sphere of influence should be defined much as the companies must do from a business perspective, considering the performance of their product and its life cycle. Benefits to the customer ultimately are benefits to the steel company. While efforts to predict product performance were endorsed by DoE, counting the downstream impact of savings attributable to the producer’s technology development was not permitted. Timken contends that such holistic approaches should be encouraged as they would lead to the most beneficial projects to the country being funded. The following illustrate such broader potential benefits:
• material and manufacturing cost savings when product does not have to be replaced unexpectedly or sooner than anticipated,
• preserved production capacity when improved product performs better in the application - extending its life span,
• avoidance or minimization of engagement time of scarce technical resources to diagnose and solve often recurring customer problems,
• faster development time that preserves the customer’s competitive advantage • preserve tubing as a viable net shape material to lower overall energy content • differentiated products that preserve U.S. steel markets.
The capabilities developed in this project should have many benefits to the tube and pipe segment of the steel industry and beyond, although the direct benefits accumulated within Timken’s fences are somewhat limited to date. The project demonstrated that science developed into applicable technology can differentiate domestic products and further the cause of U.S. competitiveness in the global market. While not represented in the proposal, the ability provided in TOM and the VPP to perform process and equipment design has huge, almost incalculable benefits. Those tools can assist in plant and equipment design with the potential to save initial or follow-on capital cost. With new plant costs in the tens of millions of dollars, one-time benefits from the application of VPP arguably could be in the single-digit millions of dollars. Decisions for added equipment could also be judged using these new tools, resulting in correct specifications for equipment to deliver the required capability with similar financial impact. In the original project proposal, benefits were cited as coming from reductions in the following:
• alloy content required to make properties • scrap and re-work in production • post-processing heat treatments • machining and tooling costs
Prior to the start of the CTMP project, Mr. Michael Burnett, a Timken scientist, proposed that microstructure manipulation and control could be used to deliver the properties needed for enhanced performance previously accomplished through additional alloying. That notion was proven to be correct during the project when a desired response in automotive gear steels was attained. Considerable benefit can be derived in savings from avoiding additional alloying at a time of relatively high alloy prices and from the environmental impact from the reduced demand for alloys. Again, such cost avoidance benefits are difficult to estimate, but they would be significant and would grow over time.
4

Process and product development work can now be done via the computer, and experimentation need only be done in the plant to verify and validate results. While impact of the new tools on product development activity is difficult to assess, an estimate was prepared assuming four production heats were necessary to conduct a test program, but only one was needed by applying TOM. Energy values were compiled using the DoE’s Energy Intensity values [Ref 0]. Assuming three, 100-ton heats would have been melted and 25% of the material processed into tubes, approximately 0.7 billion Btus would be saved. Of course, the associated benefits of material savings and reduced greenhouse gas emissions would be gained as well. The TOM provides tremendous opportunity for process studies without interrupting production. Such avoidance would have significant value in and of itself. A number of studies have been conducted at Timken during the final years of the CTMP project to take advantage of this new tool. Those studies also included dimensional control and defect elimination efforts. The accumulated annual savings are estimated at nearly $1 million, not to mention the opportunity cost that the tools provided by reducing the time that would be required of the technical staff to execute those studies without TOM. The success of those efforts has provided short-term cost reduction, but perhaps more importantly has preserved tubing as a material of choice for those customer applications. It has also enriched the knowledge of Timken’s technical staff that likely will lead to future technical or production benefits as those individuals continue their careers. The primary goal of process improvement activities is process elimination, but process cycle reduction can be an attractive target. An example of this is the ESA work conducted during the project. While the D-ESA version which would eliminate post-process heat treatment has proved initially capable, equipment limitations have prevented implementation of that process. However, the T-ESA version has been perfected and implemented accomplishing a 33-50% process reduction. Savings are dependent on the type of heat treat furnace used and the production level for the through-hardened material, but estimates are $0.5 million on savings of 0.1 billion Btus annually. The successful development of the broach screening test is noteworthy and the hope is that the test becomes a valuable tool in problem solving and product development. Timken experienced such and event when its scientists developed an ultrasonic tool to assess steel cleanness (non-metallic inclusion content) in the late 1970s, the results of which directly correlated to bearing fatigue life performance. That tool was a key to a rapid development of Timken’s clean steel practices that drove the industry and resulted in improved materials with the associated benefits to product performance. The broach screening test could have such an impact if products with improved microstructures for gear cutting are developed. From the initial results accumulated during the CTMP project, a new understanding of product response was gained and a preferred structure revealed. Those new results have only been optimized for a specific set of gear cutting conditions. The potential of the screening test is significant as the cutting tooling is nearly half the cost of a gear and the industry-wide savings offer a potential opportunity exceeding $10 million annually. Armed with this new understanding and the validated test, new products may be forthcoming in rapid order, allowing the broach test to rank with the ultrasonic cleanness test in importance in Timken’s technology history. In summary, as proposed the CTMP project produced the capability to investigate and optimize the tube making process to achieve target metallurgical structures with consideration to process robustness and cost. The resulting tools, such as the TOM and the VPP with the tooling and steel grade databases, enabled the tools to be customized for application by any tube producer. Timken has already demonstrated successes by applying the tools to achieve dramatic savings from specific studies for energy and cost reduction and to probe new and improved products with great potential downstream benefits.
5
TASK 1
Project Management The project management task included the usual work of tracking actual costs and monitoring progress versus the plan, and managing mitigating variances. In addition, it involved coordination between team members, compliance with procedure, and preparation of progress reports in DoE’s format. At the outset of the CTMP project, Timken had not yet established its External Funding (EF) Office and planned to rely on its best practices to manage the project. A strong team structure featuring an enthusiastic executive sponsor, an experienced project leader and technically accomplished subtask leaders was established to execute the project. A steering committee representing marketing, manufacturing and technology management was created and met monthly to direct the project’s efforts. A senior management group from Timken’s Alloy Steel Business and Technology Center received quarterly updates and set project direction based on business needs. Administrative functions largely were accomplished by the project leader and assistant. At the initiation of the project, the labor rates were determined by the Business Economics Group working with Steel’s Organizational Advancement leader and the Defense Contract Audit Agency (DCAA). Tracking of labor hours was seen as a system weakness by the DCAA, so a spreadsheet reporting and costing system was built by a Business Economics associate. Hours were entered either by the associates or by the assistant as reported by the associate, and were verified by the project leader. Timken’s normal purchasing systems were used to track the project costs and used as inputs to an expenditure database and other spreadsheets in preparing invoices. For the last portion of the project, tracking made use of the new tools and methodologies developed by the EF Office. Labor rates had been determined and approved by DCAA and the commercial package, Planview, was used for time keeping. A new invoicing spreadsheet was used to summarize charges. Coincidentally, invoicing changed from a manual system to the on-line DoE’s Vendor Inquiry Payment Electronic Reporting System (VIPERS) to the Automated Standard Application for Payments System (ASAP) with the U.S. Treasury Department. Shortly after the project was initiated, a patent waiver was applied for by Timken and granted by the DoE’s Chicago Office. Several areas of investigation have merited protection, but to date only the following patent applications have been filed or are being pursued:
• “Optimization of Steel Metallurgy to Improve Broach Tool Life” - United States Provisional Application - No. 60/606,816 - filed September 2, 2004.
• “Method and System for Determining Material Properties using Ultrasonic Attenuation”
- Canada and United States Provisional Application - No. 11/174,496 - filed July 6, 2005.
• To be filed – “Thermal Mechanical Process for Spheroidize Annealing of Steels”
• To be filed – “Elongator Controlled Rolling”
6
Acknowledging the negotiated three-year exclusive-use period granted by the DoE for technology developed under the CTMP product, Timken anticipated technology developments and defined ownership and deployment in its subcontracts and has begun the process of developing a commercialization plan. In some cases, the plan may be immediate release for sale, while for the more competitive items, availability may be delayed for the full three years. The major commercial product will be the TOM. Timken has begun talks on that subject with the agent commercializing HSMM software. Other pieces of commercially valuable technology, such as the broach test, and modules such as the ISV transformation model, deformation-flow stress model and meso-scale Potts model, will be identified and appropriate actions taken. In particular, the grain size measurement capability already has been released and added to the LUT commercial package currently being marketed by Tecnar Automation Ltee. A review process was created at Timken to consider publication requests. Because of commercial considerations, publication generally has been restricted throughout the project. The first subject released for publication was the grain size measurement method. That subject has been the topic of several papers as listed below.
• G. Jeskey, R. Kolarik, E. Damm, J.-P. Monchalin, G. Lamouche, S. E. Kruger and M. Choquet
“Laser Ultrasonic Sensor for On-line Seamless Steel Tubing Process Control”, 16th World Conference on Nondestructive Testing, Montreal, August 30 - September 3, 2004.
• G. Jeskey, R. Kolarik, E. Damm, J.-P. Monchalin, G. Lamouche, S. E. Kruger and M. Choquet “Laser Ultrasonic Sensor for On-line Seamless Steel Tubing Process Control,” AIST 2004.
With the approval of the DoE, the capabilities of TOM and selected other technical developments were introduced to the public in presentations made at the Materials Science & Technology (MS&T)’04 Conference in New Orleans. That conference was co-sponsored by Association of Iron & Steel Technology (AIST) and Minerals, Metals & Materials Society (MMMS). Additional papers and presentations will be approved as release is warranted.
• R. V. Kolarik, C. V. Darragh, J. E. Ives, D. Q. Jin, E. Buddy Damm, M. E. Burnett, “Controlled Thermo-Mechanical Processing of Tube and Pipe for Enhanced Manufacturing and Performance,” AIST 2004.
• D.Q. Jin, E.F. Damm, J. E. Ives, A. J. Perez, K. Sawamiphakdi, R. V. Kolarik, “Tube Optimization Model – An Integrated Process Modeling and Optimization Tool for Seamless Tube Making,” AIST 2004.
• D. F. Li and M.A. Wells, “Accurate Temperature Measurement During Water Quench Operations Characterized by Boiling Water Heat Transfer,” AIST 2004.
• K. Sawamiphadki, D. Q. Jin, and A. J. Perez, “Overview of 3-D Finite Element Modeling in Tube Making Processes,” AIST 2004.
• D. Lévesque, S.E. Kruger, G. Lamouche, R. V. Kolarik II, G. V. Jeskey, M. Choquet and J.-P. Monchalin, “Thickness and grain size monitoring in seamless tube making process using laser-ultrasonics,” Fifth International Workshop in Advances in Signal Processing for Non Destructive Evaluation of Materials (IWASPNDE), 2-4 August, 2005, Université Laval, Quebec City, Qc, Canada.
• S.E. Kruger, G. Lamouche, R. V. Kolarik II, G. V. Jeskey, M. Choquet and J.-P. Monchalin, “On-line Monitoring of Wall Thickness and Austenite Grain Size on a Seamless Tubing Production Line at the Timken Company,” AISTech 2005, Iron & Steel Technology.
7

TASK 2
R&D Subtasks The project’s technical efforts were divided into subtasks managed by appropriately qualified Timken technical experts. The purpose of this task, performed mainly in laboratory settings, was to verify the CTMP concept, to build and verify the components needed to represent the tube and pipe making process, and to identify the desired microstructure that produces an improved response for the product user. Fundamental metallurgical studies were done, as was work to simulate the deformation processes under mechanical and instrumented test conditions. Work also was done to model the deformation, cooling and heating processes, to make important in-process measurements, and to calibrate those modules to measured responses. The goals of the respective R&D Subtasks are summarized below:
Subtask 2.1: Deformation and Heat Transfer - Fundamental Study Studies of heat transfer phenomena during the piercing, elongating and reducing processes and during the rapid cooling and heating processes were proposed to gain a better understanding for use in modeling and process control. Thermocouples were to be used during each process to measure the change of temperature and heat transfer. Mathematical models to calculate the heat transfer coefficients under various conditions were to be developed for process modeling. Rolling load and pressure during the piercing, elongating and reducing processes were to be studied for the purpose of deformation control at low temperature.
Subtask 2.2: Metallurgical - Fundamental Study Microstructure evolution, final structure and properties can be defined through the precise control of thermal and mechanical deformation. Studies of recrystallization kinetics, grain growth, austenite decomposition kinetics, flow stress and their interactions under various thermal and deformation conditions were planned for selected steel grades in order to determine the state of metallurgical structure during the tube making process. Mathematical models were to be developed to characterize these behaviors and the thermal and deformation effects in developing the process conditions to produce the desired final microstructure. Subtask 2.3: Process Modeling Computer modeling permits the systematic and reliable examination of the process and further development of the product, while minimizing the expenditure of time and money for plant trials. A hot tube mill model comprised of the following modules was to be developed: piercing mill, elongating mill, cooling, induction heating, stretch reducing mill and heat treatment. A mandrel pipe mill model would also be developed. Development of such models requires thorough understanding of thermal, mechanical and metallurgical phenomena which occur in each step. A graphic user-friendly interface was to be developed. The integrated model was to be linked with materials databases and models established for selected steel grades. Model predictions were to be applied to the on-line and off-line system control.
8
Subtask 2.4: Process Simulation Experiments using a laboratory piercing rig and a thermo-mechanical hot torsion simulator were planned to simulate proposed CTMP processes. Results were to be compared with predictions from process modeling to verify the proposed rolling processes and accuracy of the process models. Subtask 2.5: Process Verification Process recipes were to be studied through process modeling, metallurgical investigation and process simulation to verify the possible applications of products. Subtask 2.6: Product Response Selected mechanical properties and hardness, machinability, annealability, formability, heat treat response and corrosion resistance were investigated for various product applications. The aim was to identify the target microstructures to yield those properties.
Subtask 2.7: Direct Measurement Development efforts were conducted aimed at delivering a system to measure the austenite grain size of hot tubes. A laser-based ultrasonic system was to be used to obtain real time grain size data by analyzing ultrasonic attenuation. The target grain size measurement accuracy was to be ±10 µm for grain sizes ranging from 15 to 70 µm, and ±20 µm for grain sizes as large as 150 µm. A tube’s grain size profile was to be displayed in the time interval between consecutive tubes passing that point on the process line. To save on development costs, the laser-based detection system and packaging developed in Timken's LUT project was to be used if at all possible.
Subtask 2.8: Control A feedback control system was to be developed. The system was to incorporate input from the gauge described in Section 2.7, interface to the equipment and to the integrated model, as well as to the cooling and heating devices. The goal is to have the system provide feedback control to all equipment and devices, resulting in achievement of the desired microstructure with less variability throughout the product.
9

Subtask 2.1: Deformation and Heat Transfer – Fundamental Study To lead the application of CTMP into practice, appropriate heat transfer models were developed and critical components of the tube making process were investigated. The primary effort of the heat transfer model development and deformation studies was to develop a comprehensive set of tools for computing heat transfer and thermal history throughout the tube making process. In this subtask, the necessary computer programs for rapid and controlled slow cooling (CSC) were developed; and, heat transfer relations were developed and selected for every tube making process considered. The heat transfer models were enhanced with recrystallization and austenite decomposition models. These models, incorporated into TOM, were used to develop process recipes for CTMP and were used as the basis of inner-loop control systems. Additionally, laboratory experimentation of rapid-cooling sprays, and in-plant trials of a device using the sprays were conducted. Inverse methods were developed and used to define the necessary heat transfer coefficients (HTCs) to predict accurately the thermal history of tubes subjected to accelerated cooling using high pressure water sprays. This experimental information was critical to understanding and controlling the rapid cooling devices. Including the HTCs in the thermal model allowed the design of future rapid cooling devices that would enable CTMP technology to be practiced in the tube mill. The models developed, with their underlying thermal fundamentals were also used to design control systems for accelerated cooling devices. Finally, literature and best practices were investigated to determine a broad range of concepts related to advanced cooling of tubing. The rapid cooling and CSC models were enhanced over the life of the project. The CSC model initially was developed in a preliminary version. The model required additional features that were evaluated and developed through laboratory and mill experimentation. The enhancement of accelerated cooling included specific software development, model verification, and detailed investigation. There were a number of enhancements made for the continued support of the models. These included enhancements to improve solution methods, to facilitate operational options, and to facilitate program modification and maintenance through large scale restructuring of the computer programs. In addition, there were enhancements to expand the suite of boundary conditions. Final microstructure predictions were coupled with the cooling models to aid in predicting and controlling aim microstructures and properties (Figure 2.1-1).
Figure 2.1-1. Comparison of CSC model to measured results.
10

In the verification of the CSC model, a series of cooling experiments where conducted at Timken Research to acquire temperature data under various cooling conditions. The experimental thermocouple data were used to fine tune the CSC model. Then, after the addition of the austenite decomposition model, the CSC model was verified to reproduce accurately the evolution in temperatures through austenite decomposition under the conditions examined. The capstone enhancement of the slow cool models was the further development of the model to handle stacked cooling. This additional capability enabled the optimization of the slow cooling conditions when cooling tubes in a furnace with tubes arranged in layers. Additionally, the ability of the existing equipment to meet these optimized CTMP process recipe specifications was evaluated and later validated through instrumentation of the furnace. The inverse heat conduction (IHC) model was developed as the main tool to determine HTCs from experimental data. Originally, only a 2-D axi-symmetric version was available, but that was later modified to include microstructure evolution and a 2-D circumferential version. Once the 2-D circumferential model was completed, microstructure transformation routines for SAE 52100 steel were incorporated. The 52100 transformation routines were necessary since the bulk of the experimental water spray testing was conducted on that steel grade. Toward the end of the project, Timken and the University of British Columbia worked together to document more fully the IHC model and adapted the program code to work interactively with a Visual Basic interface to facilitate user-friendly operation of the IHC model. Investigations of accelerated cooling heat transfer at UBC began with literature and patent searches. Those searches laid the basis upon which initial test rig designs were developed. The experimental test rig for water and air mist sprays was constructed at UBC to study the influence of several spray parameters on heat flux. The spray rig construction utilized both, individual vertical and horizontal water sprays (Figure 2.1-2). Once the construction of the water spray test rig at was completed, the evaluation of the water spray HTCs commenced to aid in the development of specifications for the rapid cooling equipment.
(a) Hot tube segment (b) Spray in progress Figure 2.1-2. Rig spray test at UBC.
11

The spray quench rig constructed at UBC was used to conduct a four-factor DoX to determine the significant variables. Using the IHC model enhanced to fit the experimental conditions, HTCs for each test condition were determined and arranged into one algorithm to represent spray water cooling heat transfer in terms of the significant variables. Toward the end of the project, additional collaboration with UBC sought to analyze the effect of water temperature further using a water spray and air mist spray again following a DoX approach. As in the previous thermal experiments, the tubes were instrumented with thermocouples to collect temperature-time data during spray cooling. These data were input into the IHC model to estimate the surface heat flux and related HTCs. The results were then forwarded to Timken for analysis, which was used in advanced control of quenching for CTMP recipes. At Timken with the HTCs from the UBC work, spraying equipment similar to the experimental quench rig was designed for placement after specific hot deformation processing of the tubes to enable the execution of CTMP recipes. Concurrent with the above work, industrial designs for water spray cooling of tubes were researched through a worldwide literature and patent review on CTMP-related cooling technology conducted by Chinese Iron and Steel Research Institute, CISRI. The cooling requirements and techniques for conducting CTMP of tubes and pipes in production were evaluated. Accordingly, CISRI recommended innovative tunnel-type cooling to execute the CTMP recipes at different process stages. The initial designs were then detailed. Toward the end of this project, it was discovered that an important aspect of conducting one of the developed processes, AFC - particularly for crack-sensitive steel grades, required oil quenching of tubes. Thus, a final activity with UBC focused on determining HTCs for oil quenching. Tests were conducted at Timken with instrumented tubes to understand more fully the oil heat transfer characteristics during boiling. The temperature data from oil quenched tubes were used by Timken to determine HTCs using the previously developed IHC model.
12

Subtask 2.2: Metallurgical Characterization Metallurgical Models Overview Metallurgical models were produced in support of computer-aided recipe development for CTMP, and to advance the fundamental understanding of material behavior under current and future mill processing conditions. At conventional thermo-mechanical processing (TMP) temperatures, steel is in the single-phase austenite face-centered cubic (FCC) crystal structure. The high temperature flow stress of austenite depends on the chemistry, temperature and deformation rate. High-temperature deformation provides the stored strain energy that drives recrystallization of the austenite. After recrystallization, the austenite grains exhibit thermally activated grain growth. Upon cooling from TMP temperatures, the austenite transforms to ferrite and carbide phases, or to martensite. The final microstructure controls the mechanical properties of the as hot-rolled steel. Models for recrystallization, grain growth, austenite decomposition and flow stress were developed for core steel grades as outlined in the project scope. These models when incorporated into computational tools aid in designing processing recipes that achieve desirable dimensional and mechanical properties in the as hot-rolled condition. For the core steels, established methods were applied in developing metallurgical models. Beyond the core steel grades, additional testing and model development using established modeling methods were completed for selected alloys and selected processes of commercial relevance to Timken. For example, two steels which vary in composition by 0.2 wt% Mn and 0.1 wt% Ni would behave substantially the same with respect to recrystallization, grain growth, and flow stress, but would exhibit significantly different austenite decomposition behavior. In such a case, only the austenite decomposition model was developed for each steel grade, while the flow stress, recrystallization and grain growth model from the core steel grade was applied to both. The accuracy of these approximations has proved sufficient when comparing model runs to mill trial results. In addition advanced models were pursued in the areas of austenite recrystallization and grain growth, flow stress, and data interpretation. Austenite recrystallization and grain growth was examined using a Monte Carlo Potts model, and an ISV flow stress model was used to link mechanical behavior to microstructural evolution. These models will be described further in the following sections. Metallurgical Model Development Grain Growth Grain growth was modeled using the established temperature dependent parabolic growth law model [Ref 1]. This approach has been used successfully for grain growth predictions by many investigators. Equation 1 shows the parabolic growth law model. Here do is the initial grain size microns, k is a constant, t is time in seconds, m is the grain growth exponent, Q is the apparent activation energy, R is the universal gas constant, and T is the absolute temperature.
⎥⎦⎤
⎢⎣⎡−+=
RTQktdd mm exp0 (Eq 1)
13
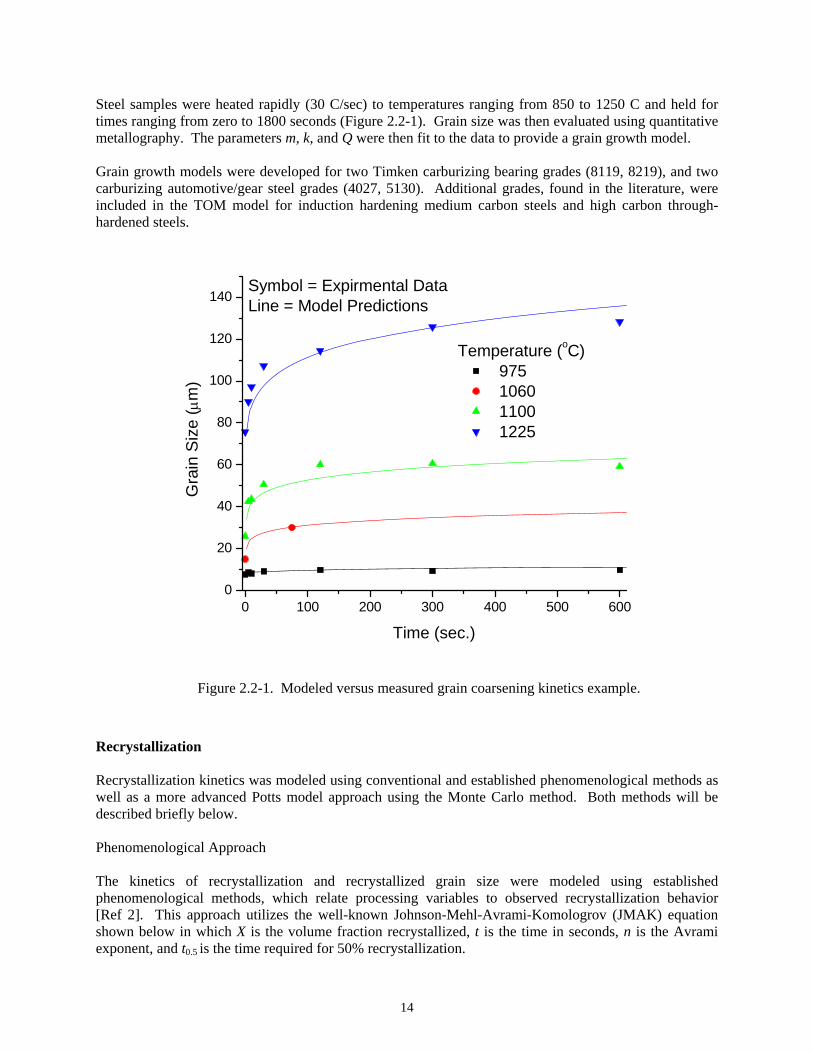
Steel samples were heated rapidly (30 C/sec) to temperatures ranging from 850 to 1250 C and held for times ranging from zero to 1800 seconds (Figure 2.2-1). Grain size was then evaluated using quantitative metallography. The parameters m, k, and Q were then fit to the data to provide a grain growth model. Grain growth models were developed for two Timken carburizing bearing grades (8119, 8219), and two carburizing automotive/gear steel grades (4027, 5130). Additional grades, found in the literature, were included in the TOM model for induction hardening medium carbon steels and high carbon through-hardened steels.
0 100 200 300 400 500 6000
20
40
60
80
100
120
140Symbol = Expirmental DataLine = Model Predictions
Temperature (oC) 975 1060 1100 1225
Gra
in S
ize
(μm
)
Time (sec.)
Figure 2.2-1. Modeled versus measured grain coarsening kinetics example.
Recrystallization Recrystallization kinetics was modeled using conventional and established phenomenological methods as well as a more advanced Potts model approach using the Monte Carlo method. Both methods will be described briefly below. Phenomenological Approach The kinetics of recrystallization and recrystallized grain size were modeled using established phenomenological methods, which relate processing variables to observed recrystallization behavior [Ref 2]. This approach utilizes the well-known Johnson-Mehl-Avrami-Komologrov (JMAK) equation shown below in which X is the volume fraction recrystallized, t is the time in seconds, n is the Avrami exponent, and t0.5 is the time required for 50% recrystallization.
14

⎥⎥⎦
⎤
⎢⎢⎣
⎡⎥⎦⎤
⎢⎣⎡−−=
n
ttX.50
693.0exp1 (Eq 2)
For each core steel grade, a model was developed for the time for 50% recrystallization for both static recrystallization and metadynamic recrystallization as a function of deformation conditions. Static recrystallization occurs after a finite incubation period once deformation is completed. The stress strain curve under static recrystallization will not yet have reached a peak, and the material will not have begun to soften dynamically. Metadynamic recrystallization occurs after deformation that has exceeded the peak stress value, at which point the material has entered the softening, or steady state flow stress regime. Recrystallized nuclei form during the deformation event with rapid recrystallization occurring once the deformation event has been completed. Under static recrystallization conditions, the time for 50% recrystallization is affected in the following ways: increased temperature (T), strain rate (ε& ) and strain (ε ) accelerate recrystallization, while increased initial grain size (do) slows recrystallization. The statically recrystallized grain size is increased with increasing starting grain size, and temperature, while increased strain and strain rates reduce statically recrystallized grain size. Equations 3 and 4 show the equations for the time for 50% static recrystallization and the statically recrystallized grain size, respectively. The terms A, n, m, p, B, q, and r are fitting constants and the Qapp value is the apparent activation energy (also a fitting constant).
⎥⎥⎦
⎤
⎢⎢⎣
⎡⋅= −−
RTQ
dAtstatapppmnstat exp05.0 εε& (Eq 3)
⎟⎟⎠
⎞⎜⎜⎝
⎛ −⋅= −
RTQ
dBdsrxnapprq
srxn exp0ε (Eq 4)
Under metadynamic recrystallization conditions, the time for 50% recrystallization is also accelerated with increased temperature (T), and strain rate (ε& ). However, since recrystallized nuclei are formed during steady state flow, initial grain size and strain do not affect the rate of metadynamic recrystallization. Similarly, the metadynamically recrystallized grain size is increased with increasing temperature, and reduced with increasing strain rate (ε& ), but is not affected by strain or initial grain size. Equations 5 and 6 show the equations for the time for 50% metadynamic recrystallization and the metadynamically recrystallized grain size, respectively. The terms C, s, D, and u are fitting constants and the Qapp value is the apparent activation energy (also a fitting constant),
⎥⎥⎦
⎤
⎢⎢⎣
⎡⋅= −
RTQ
ZCtmetaappsmeta exp5.0 (Eq 5)
(Eq 6) umrxn ZDd −⋅=
and Z is the Zener-Holloman parameter.
⎟⎟⎠
⎞⎜⎜⎝
⎛=
RTQ
Zdefappexpε& (Eq 7)
15
Under TMP conditions experienced in Timken’s tube mills, steel can recrystallize in a fraction of a second. Three practical barriers exist when trying to measure the rate of recrystallization in the laboratory setting. First, it is not possible to quench a compression sample quickly enough to freeze in the state of recrystallization in all cases. As a rule of thumb, when recrystallization occurs in less than ~10 seconds one cannot freeze in the microstructure with sufficient confidence. Second, even for conditions where there is enough time to freeze in the state of recrystallization, it is often very difficult to get reliable quantitative metallography results as the austenite is not retained, and transformation products do not always decorate prior austenite grain boundaries sufficiently. And third, in cases of small strains, the size and aspect ratio of deformed grains is not sufficiently different than recrystallized grains to allow distinction in the microscope.
Therefore, double-hit compression testing was used to infer recrystallization kinetics from flow stress data [Ref 3]. In this method a sample is subject to a double-hit compression tests with a controlled inter-hit time. During the inter-hit time recrystallization processes remove the stored strain energy from the first hit. The flow stress behavior during the second compression test is affected by the amount of stored strain energy that remains. A fraction softening term is used to describe the fraction recrystallized. Here the difference between the final stress ( 2σ ), and the yield stress ( 1σ ) of the first compression test is used as a measure of the total strain energy imparted during the first hit. After a controlled inter-hit time, a second compression test is performed. The difference between the final stress of the first hit ( 2σ ), and the yield stress of the second hit ( 3σ ) is used as a measure of the softening that occurs during the inter-hit time due to recrystallization.
12
32
σσσσ
−−
=X (Eq 8)
Tests were conducted with strain rates between 1 and 100 sec-1, strains between 0.05 and 0.80, temperatures between 800 and 1250 C, and initial grain sizes between 30 and 220 microns (Figure 2.2-2). Typically a recrystallization model would be based on between 12.5-25 test conditions for static recrystallization with an additional 10-15 test conditions for dynamic recrystallization. Recrystallization models were developed for a carburizing grade (8119), and two carburizing automotive/gear steel grades (5130, 4027). Additional grades, found in the literature, were included in the TOM model for induction hardening medium carbon steels and high carbon through hardening steels. Monte Carlo Potts Model Approach Dr. Elizabeth A. Holm of Sandia National Laboratory and Dr. Mark T. Lusk of Colorado School of Mines were contracted as principal investigators to use advanced modeling techniques to provide more fundamental predictions of flow stress, recrystallization and grain coarsening. In the areas of recrystallization and grain growth, a Monte Carlo Potts model was employed. The key benefits of this model were that it provided a physics-based model for recrystallization and grain coarsening, which could explicitly account for particle pinning due to fine AlN precipitates at the meso-length scale.
As part of this investigation, a series of experimental steels with varied Al and N levels were melted and tested for flow stress and recrystallization via the two-hit technique. The model was successfully developed with some modifications from the original scope. These modifications were necessitated by the very fine scale of precipitates in steel relative to the conceptual work which would have required computational capabilities beyond the means of the project.
16

0 1 2 3 4 50.0
0.1
0.2
0.3
0.4
0.5
0.6
0.7
0.8
0.9
1.0
strain rate = 10.0 strain rate = 1.0
staticmetadynamic
Strain = 0.4d0 = 30
Temp. = 975 oC
strain rate = 0.1
Frac
tion
Rec
ryst
alliz
ed
T ime (sec)
Figure 2.2-2. Modeled versus measured recrystallization kinetics example.
Paraphrasing from Miodownik, the Monte Carlo Potts model for grain growth uses a continuum microstructure which is bitmapped onto a three-dimensional (3-D) lattice by assigning each lattice site an index corresponding to the orientation of the grain in which that site is embedded [Ref 4]. Inert particles are incorporated by assigning clusters of sites a unique, non-changeable index. Sites with one or more unlike nearest neighbors are boundary sites; others are interior sites. The total energy of the system is the total boundary energy, and is computed via the Hamiltonian relation. Since the Hamiltonian does not distinguish between grain/grain and particle/matrix contributions to the system energy, the grain boundary and particle/matrix interface energies are equal in magnitude. Grain growth is simulated by a Monte Carlo technique. First, a grain site and a neighbor orientation are chosen at random. The orientation of the chosen site is changed to the neighbor orientation with a probability. Time is incremented after each attempted reorientation by (1/Ng) Monte Carlo steps, where Ng is the number of grain (non-particle) lattice sites. Because sites may change only to a neighbor orientation, this model differs from the classical Potts model formulation. In practice, results are statistically equivalent to those generated by the classical Potts model. For Monte Carlo Potts model, simulations of grain growth in the presence of inert, rigid, equiaxed particles, show
Dp = 0.728d
f=
2.184
ffor d = 3 pixels (Eq 9)
where Dp is the pinned grain diameter, d is the particle diameter, and f is the volume fraction of particles. Grain growth in this case is strain-free and boundary properties are isotropic. The kinetics of evolution are shown in Figure 2.2-3, with f values are shown in the legend, and the particle size d=3 in all cases.
17

Figure 2.2-3. Monte Carlo time step versus “grain size”
in the presence of Zener-pinning particles or AlN.
Flow Stress
Flow stress models predict the stress that results when a material is subject to plastic deformation. This stress, when appropriately implemented in a computer model is used to aid in the prediction of rolling loads, plastic flow, and the evolution of product dimensional characteristics. Flow stress was modeled using an established phenomenological approach and by using an established, but less common ISV approach. The ISV approach was pursued in order to provide a measured of stored strain energy as input in to the Potts recrystallization and grain coarsening model described in the preceding section. This will be discussed further in the section on novel methods for double hit compression data processing.
Phenomenological Approach
An established phenomenological model was implemented to describe the flow stress behavior of core steel grades including a Timken carburizing bearing grade (8119) and two carburizing gear/automotive steels (5130, 4027). In addition models found in the literature were implemented for additional steel grades. Flow stress was modeled in two regimes – dynamic recovery and dynamic recrystallization. In early stages of high temperature deformation dynamic recovery occurs, but much of the strain energy imparted remains causing work hardening. At later stages of deformation, dislocations begin to polygonize resulting in strain softening, and eventually a steady state stress is reached in which strain hardening and strain softening balance one another. This is referred to as dynamic recrystallization [Ref 5].
The flow stress is dependent on the strain, strain rate, temperature, and initial austenite grain size. Criteria are necessary to describe when the material is in the dynamic recovery regime, and when it is in the dynamic recrystallization regime. The model is further described in the following equations.
18

When strain is below a critical value, or when strain exceeds the critical value, but the Zener-Holloman value (as shown in Equation 7) exceeds the limiting Zener-Holloman value, then the materials flows stress is described by the dynamic recovery flow stress model.
Dynamic recovery when cεε < or cεε > but , then limZZ >
( )[ ] 5.02*20
2*⋅
Ω−⋅−+= εσσσσ essssdrec (Eq 10)
Where is the dynamic recovery steady state stress, *
ssσ 0σ is the yield stress, Ω is the work hardening rate term, and ε is the strain. Each of these will be described further in Equations 12-18. When the strain is above the critical value and the Zener-Holloman value is below the limiting Zener-Holloman value, then the materials flow stress is described by the dynamic recrystallization flow stress model. Dynamic recrystallization when cεε > and limZZ < , then
[ ]⎥⎥
⎦
⎤
⎢⎢
⎣
⎡
⎪⎭
⎪⎬⎫
⎪⎩
⎪⎨⎧
⎟⎟⎠
⎞⎜⎜⎝
⎛−−
⋅−−⋅−−=n
c
cdrxnssss
drec
εεεε
σσσσ5.0
* 693.0exp1 (Eq 11)
Where is the dynamic recrystallization steady state stress, drxn
ssσ cε is the critical strain, 5.0ε is the strain for 50% softening and n is an Avrami exponent. Each of these terms will be described further in Equations 12-18. Here the terms A-H and a-m are fitting coefficients and are dependant on each steel grade. The initial grain size is d0, and the Zener-Holloman value (Equation 7) is Z.
)exp( 0lim dbAZ ⋅−⋅= (Eq 12)
(Eq 13) ecc ZdB ⋅⋅=
0ε
(Eq 14) gf ZdC ⋅⋅= −00σ
(Eq 15) ihZdD −⋅=Ω 0
[ kj
normss ZF
ddE ⋅⎟⎟
⎠
⎞⎜⎜⎝
⎛⋅= −
−
10* sinhσ ] (Eq 16)
[ ]ldrxnss ZHG ⋅⋅= −1sinhσ (Eq 17)
(Eq 18) nm ZdH 05.0 ⋅=ε
Tests were conducted to a strain of 1.0 with strain rates between 1 and 100 sec-1, temperatures between 800 and 1250 C, and initial grain sizes between 30 and 220 microns (Figure 2.2-4). Typically a flow stress model would be based on between 22.5-40 test conditions. Flow stress models were developed for a Timken carburizing bearing grade (8119), and two carburizing automotive/gear steel grades (5130, 4027). Additional grades, found in the literature, were included in the TOM model for induction hardening medium carbon steels and high carbon through hardening steels.
19

0.0 -0.2 -0.4 -0.6 -0.8 -1.00
-20
-40
-60
-80
-100
-120
-140
-160Lines = Experimental DataSymbols = Model Fits
Grain Size Temp Strain Rate 33μm 900oC 0.1/sec 230μm 1100oC 0.1/sec 230μm 1100oC 1.0/sec
Stre
ss(M
Pa)
Strain
Figure 2.2-4. Modeled versus measured flow stress examples.
Internal State Variable (ISV) Approach An ISV model was modified and used to simulate rate and temperature dependent deformation [Ref 6]. Because only compression tests were considered, kinematic hardening was not included. This model provided an advantage over the traditional phenomenological models described earlier in that the isotropic hardening term could both be passed to the Monte Carlo Potts model as a stored strain energy driving force, and made to evolve during the inter-hit time after the first hit. Upon the second hit, the overall flow response could then be related to both the stored strain energy and a weighted average grain size associated with partial recrystallization. This is described further below. A novel method is used to fit both macro-scale and meso-scale models of static recrystallization using double-hit compression tests. An ISV model was adopted for the macro-scale and a Potts model was used at the meso-scale. The algorithm is applied to a class of low carbon steels. An ISV plasticity model was fitted to the first hit of double-hit compression data and used to estimate the substructure energy that drives the ensuing static recrystallization. The second-hit flow data are used to determine recrystallized volume fraction and to fit the parameters for an ISV model for static recrystallization. This energy value was input to a Potts model of recrystallization and coarsening. This methodology was applied to a set of tests covering a range of temperatures, strains and strain rates. The ISV and Potts model predictions of volume fraction recrystallized are found to be in reasonable agreement with the phenomenological model. This method then provides a direct fit to all of the flow stress data for two-hit tests, as opposed to applying just the apparent offset yield stresses as described in Equation 8.
20

Austenite Decomposition Austenite decomposition models were pursued along two paths. A method to process and evaluate dilatometry data was developed. This data was then fit to an ISV model. This model requires rigorous investigation and data processing, but provide excellent predictive capabilities. The ISV model was developed for two Timken carburizing bearing steels (8119, 8219), two carburizing gear/automotive steels (5130, 4027), and two induction hardening grades (5046, 5150). In addition, the MCASIS CCT and IT predictive model was re-cast in a format ready for use in FE or FD models. The QuesTek MCASIS model is less accurate than the ISV model, but has the advantage of not being grade specific. The user needs only input the steel chemistry to use the QuesTek MCASIS model in TOM.
Internal State Variable (ISV) Approach The ISV model uses an overall phase fraction mobility function, and a transformation rate function to predict austenite decomposition kinetics. The mobility function is considered over a normalize temperature range, and the transformation rate, which is dependant on the mobility, is normalized by the relative amount of constituent which has already formed. Equations 19 and 20 show the mobility and transformation rate functions for the ISV model. Here i indicates the ith austenite decomposition product (ferrite, pearlite, bainite or martensite), gfi is the grain size factor, d0 is the austenite grain size, Tn is the normalized temperature and i,relΦ is the relative fraction of constituent i. The terms Moi, gfi, ai, bi, ci and di are fitting parameters for each constituent.
[ ]i
iiii
ii
b
a
i
n
i
ndgf
aT
aT
MFM⎥⎥⎥
⎦
⎤
⎢⎢⎢
⎣
⎡
⎟⎟⎠
⎞⎜⎜⎝
⎛−
−⎟⎟⎠
⎞⎜⎜⎝
⎛⋅==
⎥⎦
⎤⎢⎣
⎡−
⋅Φ
11
00 11
2T ,d 0 (Eq 19)
[ ]i
i
d
c
i
i,rel
i
i,reli,reldTi,rel
i
ccMF
dtd
⎥⎥⎥
⎦
⎤
⎢⎢⎢
⎣
⎡
⎟⎟⎠
⎞⎜⎜⎝
⎛−Φ−
⎟⎟⎠
⎞⎜⎜⎝
⎛ ΦΦ⋅=Φ=
Φ ⎥⎦
⎤⎢⎣
⎡−
Φ
11
, 11
,M0i
(Eq 20)
Dilatometry tests were conducted with grain sizes ranging from 20 to 220 microns, cooling rates from -0.05 to -300 C/sec, or isothermal hold temperatures between 350 and 700 C. For each test condition the time-temperature-dilation data was converted to time-temperature-phase or constituent fraction using theoretical lattice parameter values as described further in the section entitled “Theoretical Thermal Expansion Coefficients.” The ISV model was then simultaneously fit to all the data sets (typically between 30 and 50) to provide optimal values for the terms Moi, gfi, ai, bi, ci and di.
Figure 2.2-5 shows ISV transformation model predictions for phase fraction as a function of cooling rate and prior austenite grain size for 5130 steel. This figure is representative of each of the steel grades investigated. Variations in the strength of the grain size effect were noted. Similarly, higher carbon grades (~0.5 %) exhibited significantly less ferrite, as expected, and a lesser grain size effect.
21

0.1 0.3 0.5 1 2 3 4 5 10 15 300.0
0.2
0.4
0.6
0.8
1.0Large Grain
Ferrite
Pearlite
Bainite
Martensite
Frac
tion
Con
stitu
ents
Cooling Rate (oC/Sec.)
0.1 0.3 0.5 1 2 3 4 5 10 15 300.0
0.2
0.4
0.6
0.8
1.0Small Grain
Bainite
Martensite
Pearlite
Ferrite
Frac
tion
Con
stitu
ents
Cooling Rate (oC/Sec.)
Figure 2.2-5. ISV transformation model predictions for phase fraction as a function of cooling rate and prior austenite grain size for 5130 steel.
QuesTek MCASIS The MCASIS program was developed to predict Jominy hardenability, as well as CCT and IT behavior [Ref 7]. Published CCT and IT curves were used to find the best fit for chemistry dependent parameters in the MCASIS transformation model. For the current project, QuesTek was commissioned to re-cast the MCASIS program into a form usable for finite difference calculation. The TOM model has the QuesTek MCASIS capability included in it and is documented in a user’s and theoretical guide.
CCT-TTT Curves The MCASIS transformation kinetics model and implementation has been modified and improved by QuesTek through a project supported by Timken CTMP Project. The purpose of this software is to allow MCASIS model to be used within a FE or FD simulation. The phase transformation kinetics of the decomposition of austenite during quenching are described graphically with TTT/CCT diagrams, which offer a concise illustration of transformation behavior at different temperatures and quench rates. QuesTek’s implementation directly solves MCASIS state variable model. It offers a natural approach for a FE/FD simulation where the volume fraction variation is desired. The GUI front end offers a centralized and simplified operation of TTT/CCT software (Figure 2.2-6). Additionally, post-processing capability is incorporated for visualizing/comparing the TTT and CCT diagrams. With graphical components such as buttons and entry fields, it allows the user to efficiently enter and modify the necessary parameters for TTT/CCT calculation, activate calculation, and then make comparisons with TTT/CCT data from experiments or literatures.
22

Figure 2.2-6. Interface to chemistry based CCT/TTT modeling.
Theoretical Thermal Expansion Coefficients Various investigators have measured the lattice parameters of austenite, ferrite, cementite and martensite as a function of carbon content and temperature. This information has proved to be valuable fundamental information which has found broad use in the CTMP project. Temperature and carbon dependent lattice parameters have been used to do the following:
• Convert dilatometry time-temperature-dilation data into time-temperature-fraction constituent data,
• Calculate theoretical thermal expansion coefficients for tubular products, and • Predict heat treat distortion for carburized products by including theoretical transformation strain
into the ISV austenite decomposition model.
23

The carbon and temperature dependent lattice parameters used are described below, followed by a brief description of their application to each example provided above. In Equations 21-25, T is temperature, Xc is the number of carbon atoms per 100 solute atoms, l refers to the cube lattice parameter of the austenite (γ) or ferrite (α), or in the case of cementite (Fe3C), l refers to the cube root of the volume of the cementite unit cell [Ref 8-10]. The martensite lattice parameters (am and cm) are a function of wt% carbon. All lattice parameters are in nanometers.
( ) ( ) ( ) ( )( )1000 - 273 C)T(61X0.61 - 24.92 1X0.000752 0.363086 cc +°⋅−⋅⋅+⋅⋅+= Elγ (Eq 21)
( ) ( )[ ]800 - 273 + C)T(5-1.755 + 10.288634 °⋅⋅= Elα (Eq 22)
( ) 31
low C)(T0.008023153.9121.03
°⋅+⋅=CFel (Eq 23)
[ ] ( ) ( )[ ]25-C)T(6-11.5+1wt%0.0013-0.28723 carbon °⋅⋅⋅= Eam (Eq 24)
and,
[ ] ( ) ( )[ ]
0.0116;55.0%or 0.002;55.0%25-C)T(6-11.51%w0.28664
=≥=<°⋅+⋅⋅+=
AwtAwtEtAc
carboncarbon
carbonm (Eq 25)
When the number of solute atoms per unit cell is known (Table 2.2-1), then the linear strain per solute atom can be determined as a function of temperature and carbon content for each phase. Using 100 solute atoms as a base allows for simple phase fraction calculations. In this way, the ISV transformation model coefficients can be optimized such that phase fractions predicted from the model result in a predicted dilation curve (based on phase fractions and carbon/phase dependent lattice parameters) match experimental dilation curves. The ISV transformation model parameters were optimized to provide a best fit comparison between the measured dilation curves, and predicted dilation based on the model and theoretical lattice parameters. Quantitative metallography was used to confirm or improve the overall predictions. For a given steel grade, dilation data was collected as a function of grain size (ASTM 2-10), using both continuous cooling (0.05 to 300 C/sec) and isothermal hold (700-400 C) schedules. Typically, the ISV transformation model was fit to between 30 and 45 separate dilation data sets per steel grade. An example dilation fit and concurrent transformations are shown in Figure 2.2-7.
Table 2.2-1. Number of substitutional atoms per unit cell.
Phase Crystal Structure Number of subs. atoms
per cell (B) Austenite (γ) Face Centered Cubic 4 Ferrite (α) Body Centered Cubic 2 Cementite (Fe3C) Orthorhombic 12 Martensite Body Centered Tetragonal 2
24
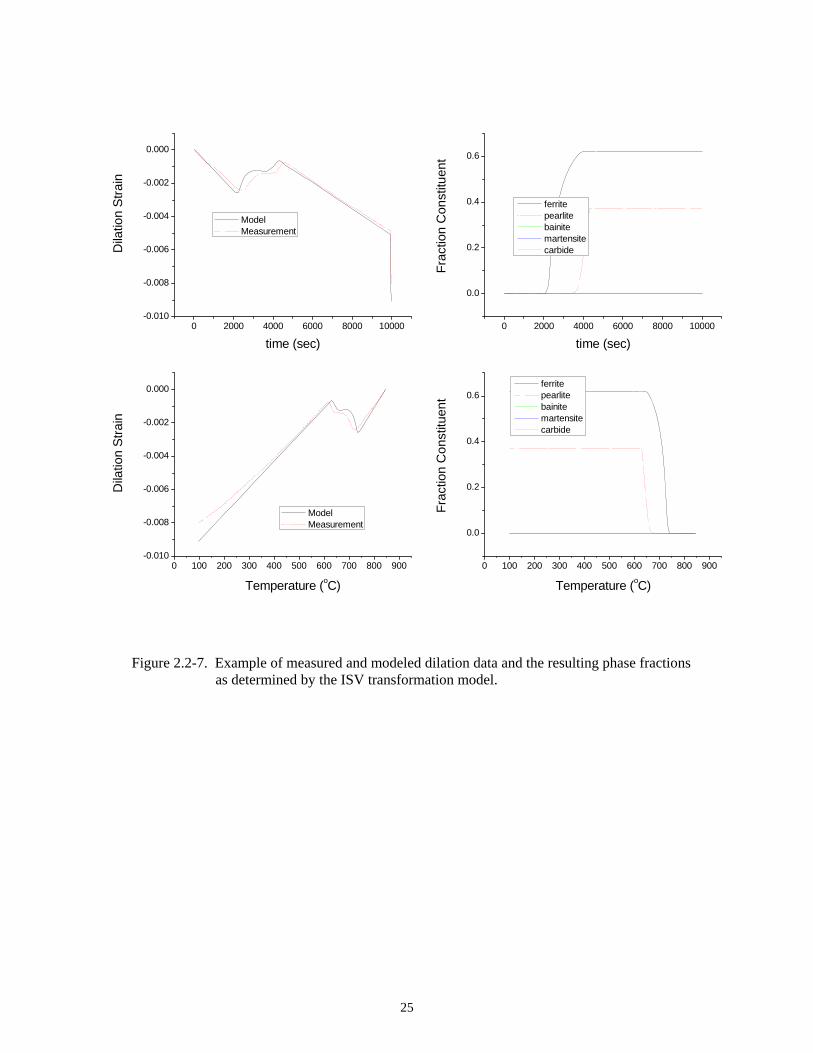
0 2000 4000 6000 8000 10000-0.010
-0.008
-0.006
-0.004
-0.002
0.000
0 2000 4000 6000 8000 10000
0.0
0.2
0.4
0.6
0 100 200 300 400 500 600 700 800 900-0.010
-0.008
-0.006
-0.004
-0.002
0.000
0 100 200 300 400 500 600 700 800 900
0.0
0.2
0.4
0.6
Model Measurement
Dila
tion
Stra
in
time (sec)
Frac
tion
Con
stitu
ent
time (sec)
ferrite pearlite bainite martensite carbide
Dila
tion
Stra
in
Temperature (oC)
Model Measurement
Frac
tion
Con
stitu
ent
Temperature (oC)
ferrite pearlite bainite martensite carbide
Figure 2.2-7. Example of measured and modeled dilation data and the resulting phase fractions as determined by the ISV transformation model.
25

Subtask 2.3: Process Modeling Objectives The objectives of modeling subtask of CTMP project were as follows:
• To develop a PC-based Tube Optimization Model (TOM) for modeling of thermal, deformation and microstructure evolution during tube making processes,
• To develop a 2-D modeling capability for deformation and geometry control,
• To understand the metallurgical state at any process stages during tube making process to
provide a guideline for mill operation to make adjustments within the equipment capabilities to achieve targeted structures and properties,
• To create a Virtual Pilot Plant (VPP),
• To assist with designing CTMP process, defining CTMP equipment, developing control
system, defining equipment capability and proving CTMP concept by using Tube Optimization Model and other process modeling tools developed in the project,
• To apply modeling tools for CTMP development and process improvement.
A number of prominent experts were engaged to assist the subtask team, including:
• QuesTek Innovation LLC, Chicago, IL (QuesTek) • Scientific Forming Technologies, Co. Ltd. Columbus, OH (SFTC) • Yanshan University, Qinghuangdao, China (YSU) • University of Mining & Metallurgy, Krakow, Poland (UMM) • The University of British Columbia (UBC)
Development of Process Models An integrated tube making process model - Tube Optimization Model (TOM) - was developed for the project. The TOM is a group of simplified mathematical and process models using finite-element (FE) or finite-difference (FD) approaches. The predictive capability and accuracy of TOM have been validated using laboratory simulation and mill trials. The TOM is being continuously upgraded and applied to the study of tube making processes and the development of CTMP process recipes. It requires short CPU time for simulation so that the user can link TOM with the production database as a tool to predict and verify the outcome of metallurgical quality and characteristics of the tubular products off the mill. It can be also used effectively for new process and new product development. Tube Optimization Model (TOM) The TOM consists of seven process modules, a metallurgical module, a mill tolling module, a metallurgical database and a mill based production database, an optimization module and a user-friendly graphics user interface (GUI) for modeling tools (Figure 2.3-1).
26

Figure 2.3-1. TOM GUI. Introduction The seven process modules include piercing, elongating, induction heating, reducing, stretch reducing, accelerated cooling and CSC processes. Piercing Mill Model The piercing mill model is a simplified elastic-plastic FE model based on Eulerian approach. Asymmetric geometry of tube deformation with the implementation of torsion deformation applied across the section is assumed. The deformation modeling is coupled with thermal and microstructural evolution in the model. It comes with a piercing roll and plug design feature and a Timken-designed tooling database for Timken standard tooling. The model predicts the tube shell geometry, deformation characters including stress, strain, torsion, load etc., thermal profile and temperature history, the austenite growth during the piercing process and the final austenite grain size. The piercing mill model was completed in 2001 with the assistance of Prof. Maciej Pietrzyk, Prof. Zbigniew Malinowski, and Dr. Miroslaw Glowacki from ELROLL - Consulting and Programming Agency, Ltd. at UMM. A view of the setup screen for the model is shown in Figure 2.3-2, and an example of a simulation of the piercing process in shown in Figure 2.3-3.
27

Figure 2.3-2. Piercing mill model setup.
Figure 2.3-3. Example of results from piercing process simulation.
28

Assel Elongating Mill Model The model of Assel-type elongation is similar to the piercing mill model and it also employs a simplified elastic-plastic FE model based on Eulerian approach. It assumes the asymmetric geometry of the tube deformation with the implementation of torsion deformation applied across the section. The deformation modeling is coupled with thermal and microstructural evolution in the model. It comes with a piercing roll and plug design feature and a Timken-designed tooling database for Timken standard tooling. The model predicts the tube shell geometry, deformation characters including stress, strain, torsion, load etc., thermal profile and temperature history, austenite growth during the Assel elongating process and the final austenite grain size. The elongation model was completed in 2001 with assistance from ELROLL. A view of the setup screen for the model is shown in Figure 2.3-4.
Figure 2.3-4. Assel elongating model setup. Reducing Mill Model The reducing mill model was developed based on a FD approach with the coupling of thermal, deformation and microstructural evolution. It is comprised of a process design model, a thermo-mechanical model and a microstructure evolution model to simulate the reduction/rolling schedule, tube OD, wall thickness, rolling speed, strain, strain-rate, specific pressure, rolling load and torque and to simulate the heat transfer and microstructure evolution in a reducing mill. A tooling design module and a tooling database for Timken’s production line has been also developed and implemented as the integral part of the reducing mill model.
The reducing mill model was developed by Timken and was completed in 1999. A view of the setup screen for the model is shown in Figure 2.3-5.
29

Figure 2.3-5. Reducing mill model setup.
Stretch Reducing Mill Model The stretch reducing mill model was developed based on a finite-difference approach with the coupling of thermal, deformation and microstructural evolution. It is comprised of a process design model including configuration of a complete stretch reducing mill and setup of tension schedule to achieve the desired wall thickness, a thermal-mechanical model and a microstructure evolution model to simulate the reduction/rolling schedule, tube OD, wall thickness, tension distribution among the stands, rolling speed, strain, strain-rate, specific pressure, rolling load and torque and to simulate the heat transfer and microstructure evolution in a reducing mill. The stretch reducing mill model was developed by Timken and was completed in the year of 2000. A view of the setup screen for the model is shown in Figure 2.3-6.
30

Figure 2.3-6. Stretch-reducing mill setup.
Induction Heating Model The induction heating model was developed by InductoHeat Inc. in Michigan for the simulation of tube and bar induction heating process. The microstructural evolution model was integrated into the induction heating model by Timken engineers. It predicts the thermal profile, temperature history, microstructural evolution, austenite grain size and the control parameters for induction heater accurately. It employs an FD-based mathematical model. The development and implementation of induction heating model into TOM was completed in 2002. A concept of the application is shown in Figure 2.3-7, with predictability shown in Figure 2.3-8.
Center Line
Figure 2.3-7. Induction heating model application.
31

Temperature C
Time - seconds
1300
1250
1200
1150
1100
1050
1000 0 3 4 5 6 7 8 91 2
OD
ID
Exp
Figure 2.3-8. Induction heating model predictability. Quenching/Rapid Cooling Model A quenching/rapid cooling model was developed based on a 2-D FD approach. It couples the thermal and microstructural evolution and transformation kinetics during the simulation for the rapid cooling conditions including air cooling, fan cooling and water quenching. The model predicts the thermal profile in the tube wall, temperature history during the quenching, austenite grain size and phases resulted from austenite decomposition. Latent heat resulted from austenite decomposition is modeled with thermal response of the materials using iterative method. An inverse HTC module based on FD approach was also developed in order to obtain the various HTC cooling curves under different water spray/jet cooling conditions which have been collected through the laboratory and mill experimental tests and measurements. The quenching/rapid cooling model and the inverse HTC module were developed with the cooperation with UBC. The principal contributors at UBC included Prof. Mary Wells, Prof. Steve Cockcroft, Dr. Dianfeng Li, Mr. Steve Mwenifumbo and Dr. Daan Maijer.
Controlled Slow Cooling (CSC) Model A CSC model was developed based on a 2-D FD approach on the circumferential section. It couples the thermal and microstructural evolution and transformation kinetics during the simulation for controlled cooling conditions including air cooling, furnace cooling and cooling with shields. The model predicts the thermal profile in the tube wall, temperature history during the controlled cooling, austenite grain size and phases resulted from austenite decomposition. The CSC model was developed with the cooperation with UBC team.
32

Material and Metallurgical Models/Database Material and metallurgical models and databases were developed and integrated into TOM including: Steel Chemistry A steel chemistry database as been created consisting of 34 customized carbon and alloy steel grades (Figure 2.3-9) with an option for user creation of new grades from a user-friendly GUI.
Figure 2.3-9. Steel grade database.
Thermal Physical Properties A thermal physical properties database has been built consisting of four customized carbon and alloy steel grades and an option for user creation of user-defined and an option of selection for auto calculation from steel chemistry from user-friendly GUI. Flow Stress A database has been created consisting of flow stress curves under different deformation conditions for the 34 grades with an option for user creation of user-defined flow stress curves and an option of selection for auto calculation from steel chemistry from user-friendly GUI (Figure 2.3-10).
Figure 2.3-10. Flow stress database GUI.
33

Recrystallization and Grain Growth Recrystallization and grain growth models for 12 customized carbon and alloy steel grades has been built with an option for user creation of user-defined Recrystallization and grain growth model and an option of selection for auto calculation from steel chemistry from user-friendly GUI (Figure 2.3-11).
Figure 2.3-11. Recrystallization and grain growth GUI.
Transformation Model Two types of austenite decomposition models were developed for the purpose of process modeling. One is the chemistry based approach which was developed by QuesTek based on MiniTech’s CCT/TTT modeling – MCASIS. Another is ISV approach which was developed by Timken with the cooperation from Dr. Mark Lusk at Colorado School of Mines. For the ISV approach, austenite decomposition models for four steel grades were developed and integrated into the model. Both austenite decomposition modeling programs were integrated into TOM. Users of TOM can select the user design feature of transformation kinetics by using steel chemistry and laboratory or literature information on CCT and TTT curves. The designed transformation kinetics can be coupled with cooling models or linked with external thermal profile to predict the phases after transformation. Tooling and Production Scheduling Module/Database A production schedule and mill layout (Figure 2.3-12) and tooling library (Figure 2.3-13) were developed for piercing mill, Assel elongator, and reducing mill for Timken tube mills. It also allows the user to design customized tooling and to optimize the tooling design through the simulation.
34

Figure 2.3-12. Production scheduling GUI.
Figure 2.3-13. Tooling design GUI.
35

Optimization Module An EpogyTM process optimization capability has been developed by Synaps and integrated into TOM for the purpose of process optimization and CTMP recipe design (Figure 2.3-14).
Figure 2.3-14. Optimization GUI.
The TOM was adapted with a fast elongation model and verified with LUT grain size test data generated in Subtask 2.7. The fast model was developed using tabulated TOM output and using an algorithm to interpolate the values between the steps in the table. Extensive computer testing was conducted to guarantee that the step size in the table created a smooth and accurate approximation of results when compared to running the full numerical solution for elongation that is resident in the TOM. Additional model development centered on the inclusion of a metallurgical model for austenite decomposition for induction hardening grades. These metallurgical models were adapted and incorporated into TOM. The adapted TOM version of the metallurgical model was validated against the original metallurgical model by comparing output results between the two versions when using the same input parameters. The TOM documentation intended to facilitate future maintenance and development efforts. The TOM program was thoroughly documented by including comments throughout the model to describe the functionality of the Visual Basic interface and to describe the concepts in the source code. Also, the 2-D rolling and sinking models were enhanced by adding more roll pass design grooves to the rolling model and tailoring the interfaces to include detailed calculations to be conducted by the interface, which were previously done outside the model. In addition to those activities, the tube sinking mill 2-D model and the bar 2-D rolling mill model interface were enhanced to be more user friendly. The interface was also improved to accommodate usage by the less experienced user. User-Friendly Graphics Interface (GUI) An integrated user-friendly GUI was developed for TOM and its many modules.
36

Virtual Pilot Plant (VPP) The concept of a tube rolling mill in a computer has been developed based on the TOM. The VPP has all features that TOM has for modeling of thermal, deformation and microstructural evolution in the steel during tube making process, for prediction of final structure and property of products and for CTMP process recipe design and optimization. In addition, a library of various tube making equipment, operation practice and know-how was developed and integrated with TOM to create the VPP tool. The tube making equipment and their respective modules are allowed to be arranged in the arbitrary ways by user for the tube mill design, analysis and examination of process recipes and productivity. Using the VPP, tube making CTMP process recipes can be developed from customer’s specification on machinability or formability of the products, and the process can be optimized from the material behaviors, equipment capability and productivity for minimized process steps and costs. Verification of TOM Considerable effort was made to verify the model predictions (Figure 2.3-15).
Time (s)
0 25 50 75 100 125 150 175
Tem
pera
ture
(o C)
700
800
900
1000
1100
1200
1300
Aus
teni
te g
rain
siz
e (μ
m)
30
40
50
60
70
80
90
Temperature
Grain size
Piercing
Assel Elongation
Induction Heating
Reducing
Cooling
Mill measurement
Figure 2.3-15a. Thermal history and microstructure evolution of seamless tubing
during a conventional hot rolling process.
37

Figure 2.3-15b. Thermal history and microstructure evolution of seamless tube during a cooling process.
Time (s)
0 250 500 750 1000 1250 1500
Tem
pera
ture
(o C)
200
300
400
500
600
700
800
900
1000
1100
Vol
ume
fract
ion
trans
form
ed
0.0
0.1
0.2
0.3
0.4
0.5
0.6
0.7Temperature
Ferrite
Pearlite
Bainite
Martensite
2-D FE Analysis The 2-D FE modeling capabilities have been developed for the CTMP project to simulate 2-D deformation during piercing, Assel elongating, planetary elongating, reducing and stretch reducing, rotary sizing and straightening processes for the purpose of understanding of metal flow, defect formation, dimensional quality and optimization of tooling. The 2-D and 2-D FE model based on DEFORMTM2D was developed to simulate machining process for the optimization of desired microstructure and minimized tooling cost. FE Formulations and Algorithms
A 2-D FE model representing each tube making process was developed using the actual geometrical and processing configurations found in production. In general, the process can be modeled by the FE algorithm based on the pseudo-time increment implicit static FE algorithm or by a true dynamic explicit FE algorithm. The former algorithm is based on the virtual power principle while the latter algorithm is based on Newton’s Second Law. Both algorithms can be applied in the Lagrangian space, meaning that the mesh points are always coincident with the material particles, or the Eulerian space, meaning that the mesh points are not always coincident with the material particles, or the Lagrangian-Eulerian combined space, such as the Arbitrary Lagrangian-Eulerian (ALE) space. Two programs using implicit static FE analysis approach are DEFORMTM3D and SHAPETM. The ABAQUS/Explicit program uses an explicit dynamic FE analysis approach and the TubeRoll program utilizes the ALE space.
38

The DEFORMTM3D developed by SFTC was employed to simulate 2-D deformation process of piercing, Assel elongating and planetary elongating processes as shown in Figure 2.3-16. The DEFORMTM3D program is a general purpose FE analysis program developed for forming process simulation. The algorithm is based on implicit Lagrangian method. The material can be modeled using elastic, elastic-plastic, and rigid-plastic material models. The direct iteration method is employed at the beginning of each time step until the solution is close to the converged solution as well as no changes in contact condition. Then the Newton-Raphson iteration method is utilized to obtain the final solution of that step. The program can handle multiple deformed bodies, complicated body movement, and regularly contacting and separating contact conditions. The program also offers an automatic remeshing option simulation. Much information of field variables can be obtained from the analysis. The changes of field variables can be tracked through the process as well as at the end.
Piercing Assel Elongating Planetary Elongating
Figure 2.3-16. FE models of piercing, Assel elongating and planetary elongating processes. Mannesmann Piercing Mill The Mannesmann piercing mill consists of two double conic rolls, a plug, and two support guides. Each roll is set at a certain feed angle to the billet with the centerline of the shaft lying in parallel plane as shown in Figure 2.3-17. A pusher initiates the billet/roll contact, which drives the billet through the mill over the plug. As the billet travels along the rolls, it meets the plug which is set a certain distance ahead of the gorge. The billet starts to follow along the side of plug to form an elongated, hollow shell. A key advantage of the Mannesmann piercing mill is that it is dimensionally flexible. A wide range of hollow tube sizes can be pierced out of a given billet diameter. This enables the tube producer to minimize billet stock and to optimize the process to achieve the best geometrical tolerances of tubes. However, process optimization is difficult due to some combination effects of billet size and processing parameters such as gorge (h), skew angle (β), and lead (la). A 2-D FE model representing the piercing process was developed based on actual geometrical and processing configurations as in the tube mill as shown in Figure 2.3-17. The model consisted of two rolls, a billet (workpiece), a plug and two support guides. Compared to the workpiece, the deformation of the rolls and plug is negligible. Thus, the rolls and mandrel were assumed to be rigid. The workpiece was assumed to be a deformable body with a rigid-plastic constitutional condition because the elastic deformation was small relative to plastic deformation.
39
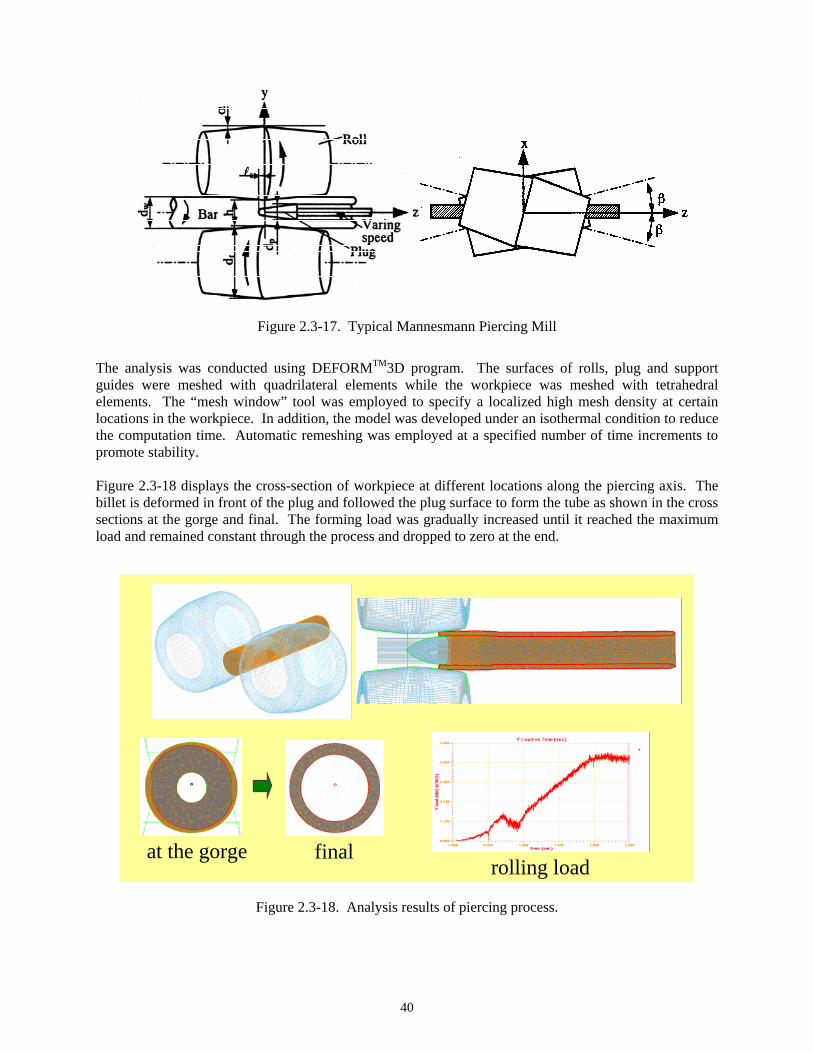
Figure 2.3-17. Typical Mannesmann Piercing Mill
The analysis was conducted using DEFORMTM3D program. The surfaces of rolls, plug and support guides were meshed with quadrilateral elements while the workpiece was meshed with tetrahedral elements. The “mesh window” tool was employed to specify a localized high mesh density at certain locations in the workpiece. In addition, the model was developed under an isothermal condition to reduce the computation time. Automatic remeshing was employed at a specified number of time increments to promote stability. Figure 2.3-18 displays the cross-section of workpiece at different locations along the piercing axis. The billet is deformed in front of the plug and followed the plug surface to form the tube as shown in the cross sections at the gorge and final. The forming load was gradually increased until it reached the maximum load and remained constant through the process and dropped to zero at the end.
rolling load at the gorge final
Figure 2.3-18. Analysis results of piercing process.
40

Assel Elongating Mill The Assel elongating mill is employed to reduce thick-walled tubes to near-finished dimensions. The system consists of three forming rolls spaced 120 degree apart around the main axis and a mandrel as shown in Figure 2.3-19. Each roll is inclined to the main axis about 2.3-5.0 degrees and the feed angle of each roll varies from 9-12 degrees. The tube diameter is reduced in the inlet zone ahead of the roll shoulder where the tube is gripped, rotated, and drawn into the mill. Most of the reduction of tube diameter and wall thickness is accomplished at the roll shoulder where typically triangularization is observed.
Figure 2.3-19. Typical System of Assel Elongating Mill A FE model has been developed to model the Assel elongating mill with reasonable accuracy. The FE analysis was carried out using DEFORMTM3D. A 3-D FE model representing the Assel elongating process was developed based on actual tube mill geometrical and processing configurations as shown in Figure 2.3-20. The model consisted of three rolls, a tube and a mandrel. Compared to the tube, the deformation of the rolls and mandrel was negligible. Thus, the rolls and mandrel were assumed to be rigid. The tube was a deformable body with a rigid-plastic constitutional condition because the elastic deformation was small relative to the order of plastic deformation. The surfaces of rolls and mandrel were meshed with quadrilateral elements while the tube was meshed with hexahedral elements. In addition, the model was developed under a non-isothermal condition to investigate the localized temperature during the process. The tube diameter is reduced gradually as it enters the mill and becomes more triangularized when the tube hits the roll shoulder. The twisting of the tube is observed from the display of mesh on the surface as shown in Figure 2.3-21. Figure 2.3-22 presents cross-sections of tubes at different locations along the mill. The triangularization is more pronounced at the gorge. Another important factor related to the triangularization is the roll speed. More triangularization occurs as the roll speed increases. With the knowledge of this phenomenon, the roll speed can be adjusted to avoid the triangularization at the tube end. The final tube diameter varies with roll speed as well as amount of wall thickness reduction. The strain rate is as high as 45 mm/mm/sec around the roll shoulder was predicted as shown in Figure 2.3-23a. The strain rate reduces from outside diameter to inside diameter. The forming load increases to 350 tons and remains constant to the end of process as shown in Figure 2.3-23b.
41

elongating roll
mandrel
tube
elongating roll
mandrel
tube
Figure 2.3-20. FE model of Assel elongating process.
Figure 2.3-21. Deformation of tube along the elongating mill.
at the gorgeentering the mill final sectionat the gorgeentering the mill final section
Figure 2.3-22. Cross-sections along the forming axis at different locations.
42

a) Contour of strain rate
0
50
100
150
200
250
300
350
400
0.00 0.50 1.00 1.50 2.00 2.50 3.00 3.50
Time, seconds
Form
ing
Load
, kN
b) Profile of forming load
Figure 2.3-23. Contour of strain rate and profile of forming load. Planetary Elongating Mill The planetary elongating mill is a new elongating process developed by Kocks that was investigated for a possible future tube mill. The machine consists of four rolls and mandrel. The rolls are assembled inside the housing and rotated around its axis direction. At the same time the housing is rotated at the speed that is equivalent to the surface speed of the rolls. The tube is fed from the back of the rolls pushing by the mandrel. The pushing speed should not be too fast as to create lap or defect on the surface.
43

The DEFORMTM3D is utilized to investigate the effectiveness and robustness of the elongating process. Rolls and mandrel are modeled by a number of rigid surface elements. The tube is meshed by a number of 2-D solid elements as shown in Figure 2.3-24. The rolls are rotated around its axis and around the mill center. The analysis results show a good round cross-section and high reduction ratio. However, the process requires a great deal of knowledge to set up the mill properly in order to avoid the formation of surface defects.
Figure 4.3.9 Finite element analysis of planetary elongating mill
Figure 2.3-24. FE model of planetary elongating process.
Radial Forging Process A radial forging process is an open-die forging process for converting an ingot into billet. The process is frequently employed to reduce and form the cross-section and to reform the grain structure in superalloy billets. The process is also used for forming different shapes in straight or tapered solid or tubular products. Two, three or four counteracting dies located in the same plane make incremental reductions of the workpiece as it rotates intermittently by chucker at each end as shown in Figure 2.3-25a. Figure 2.3-25b presents a typical tool arrangement in radial forging for the four-die machine. The deformation results from a large number of short-stroke and high speed blows from the dies. After each forging blow, the chucks at each end of the billet feed the workpiece axially. At the same time the chucks can rotate the workpiece to form a uniform round billet. The advantages of radial forging process include high productivity, low energy consumption, high flexibility tooling, near net shape products and improved internal structures.
44

a) b)
Figure 2.3-25. Schematic of radial forming process. The Timken Company installed a 600-ton four-die radial forging machine from GFM in 1990. To ensure acceptable products, the following process parameters must be designed properly: billet temperature, axial feed rate, length of stroke, die geometry, reduction per pass and rotational angle after each blow. The FE analysis can be employed to assist the design of die geometry and process parameters. The DEFORMTM3D program was employed to analyze the forging of 320 mm square billet from 380 mm round billet. The billet was forged at 1000 C with two passes. The first pass reduced the square billet to 350 mm round billet. The billet was rotated 10 degrees between bites. The analysis was employed to determine the distribution of forming work in the billet as well as the final shape. The dies and chucks were modeled as rigid bodies while the billet was considered as a rigid-plastic deformable body as shown in Figure 2.3-26. Figure 2.3-27a presents the distribution of strains in the billet that show only high forming work around the surface. The analysis can be employed to redesign the passes for higher penetration of the forming work to the center of the billet. The distribution of temperature is plotted in Figure 2.3-27b.
Figure 2.3-26. FE model of radial forging process.
45

a) Strain distribution b) Temperature distribution
Figure 2.3-27. Strain and temperature distributions in the billet. ABAQUS – Explicit FE Analysis The ABAQUS FE software was utilized to analyze straightening process to predict the residual stress in the tube obtained from designated CTMP recipe.ABAQUS – Explicit as shown in Figure 2.3-28.
Straightening 7-rolls
Straightening 2-rolls
Assel Elongation
Figure 2.3-28. FE models of straightening and Assel elongating processes.
Straightening Mill A straightening process is a finishing operation for correcting misalignment in tubes after the reducing or rotary sizing mill. The principle of rotary straightening is that the tube is fed forward and deflected beyond its elastic limit by crossed axis rolls that also import the rotary motion. The surface of tube is alternatively subjected to tensile and compressive stresses as it rotates in the straightening mill. The rotary straightening mills are available with two to nine rolls. At Timken, only two-roll and five-roll rotary straightening machines are used.
46

A two-roll straightening mill consists of two motor-driven directly opposed rolls. One of the rolls is concave and the other has a relatively convex as shown in Figure 2.3-29. The angular rotation of the rolls is equal, but in opposite direction. Straightening action is accomplished by flexing the tube into the throat of concave roll by the convex roll. Two key factors in straightening are the angle of the rolls to the tube-axis and the roll gap. In the two-roll straightening mill, the tube is subjected to a continuous straightening action from the entrance point to the exit point of the work rolls. The angle between the roll axis and the tube is generally about 17 degrees. The straightening speeds vary from 10 to 50 meter per minute.
Figure 2.3-29. Typical two-roll straightening mill. A five-roll straightening mill consists of two driven rolls and three idle rolls as shown in Figure 2.3-30. The middle roll is adjusted to apply enough bending in tube to exceed the elastic limit of tube material. As the tube is fed into the straightening mill, the tube is rotated by the first and the last sets of rolls while the tube is bent by the middle roll. This action produces a straight tube with symmetrical stresses. The optimum setting of roll angle and gap is very complicated, requiring a fundamental understanding of straightening process. The straightening mill should be set up in the way that it does not induce work hardening in the tube. The typical angle between the roll axis and the tube is about 35 degrees.
Figure 2.3-30. Typical five-roll straightening mill.
47
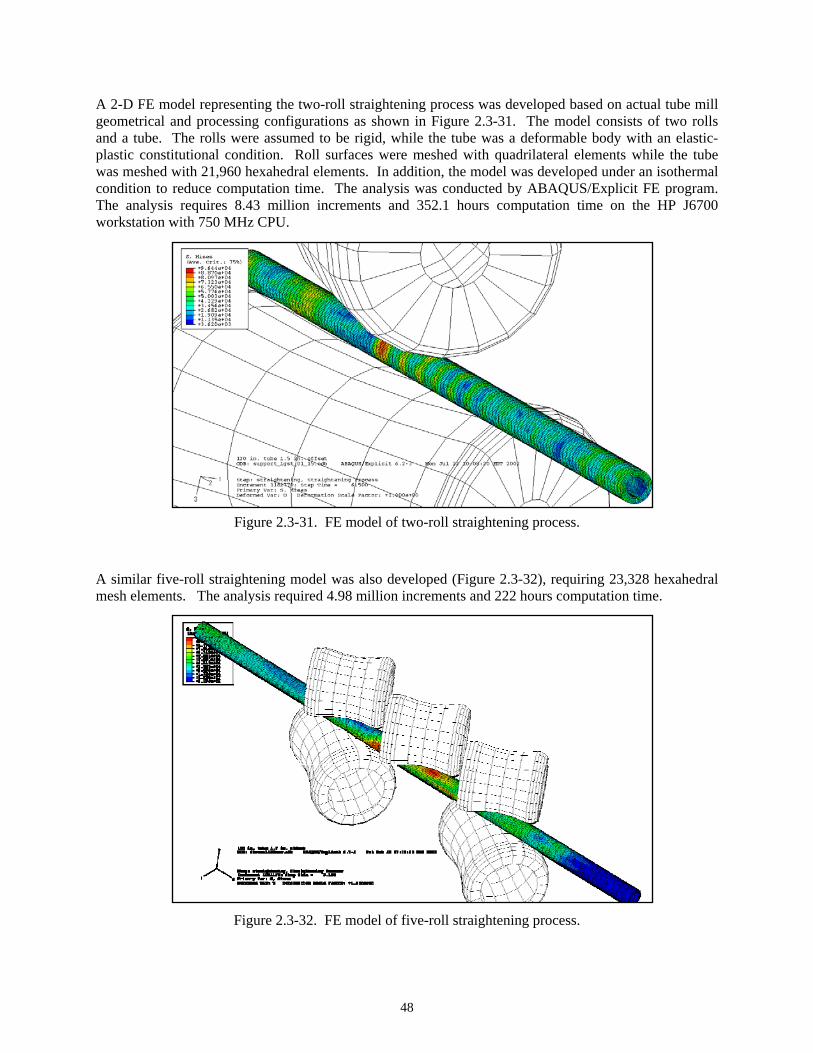
A 2-D FE model representing the two-roll straightening process was developed based on actual tube mill geometrical and processing configurations as shown in Figure 2.3-31. The model consists of two rolls and a tube. The rolls were assumed to be rigid, while the tube was a deformable body with an elastic-plastic constitutional condition. Roll surfaces were meshed with quadrilateral elements while the tube was meshed with 21,960 hexahedral elements. In addition, the model was developed under an isothermal condition to reduce computation time. The analysis was conducted by ABAQUS/Explicit FE program. The analysis requires 8.43 million increments and 352.1 hours computation time on the HP J6700 workstation with 750 MHz CPU.
Figure 2.3-31. FE model of two-roll straightening process.
A similar five-roll straightening model was also developed (Figure 2.3-32), requiring 23,328 hexahedral mesh elements. The analysis required 4.98 million increments and 222 hours computation time.
Figure 2.3-32. FE model of five-roll straightening process.
48

The straightening model predicts stress, strain, strain rate and dimensional characteristics as well as contact load at the rolls. The contact load history of both the convex roll and the concave roll of two-roll straightening process are plotted in Figure 2.3-33. The maximum loads are 210 kN for both convex roll and concave rolls. Similarly, the contact load history of the middle top roll and the bottom roll of five-roll straightening process are plotted in Figure 2.3-34. The maximum loads of 160 kN for the top roll and 180 kN for the bottom roll.
Figure 4.3.18 History of contact load of two roll straightening process 0
50
100
150
200
250
0 1 2 3 4 5 6 7
time, second
cont
act l
oad,
kN
concave rollconvex roll
Figure 2.3-33. Contact loads from two-roll straightening.
Figure 4.3.19 History of contact load of five roll straightening process
020406080
100120140160180200
0 2 4 6 8
time, second
cont
act l
oad,
kN
10
bottom rolltop roll
Figure 2.3-34. Contact loads from five-roll straightening.
49

SHAPETM for Simulation of Reducing and Stretch Reducing Processes The SHAPETM program is an implicit FE program using the new technique of dual-mesh method. The program uses a uniform mesh to keep track of material movement and a special mesh in the solver as shown in Figure 2.3-35. The other will be the same as the generalized implicit static FE analysis program. The advantage of this program is reduced computational time due to the reduction of time in an equation solving part.
Figure 2.3-35. Illustration of dual-meshing technique.
TubeRoll Program The TubeRoll program is a 2-D FE analysis modified from the FE analysis program for a bar rolling mill model. The bar model was previously developed by The Ohio State University (OSU). The implementation of microstructure calculation was carried out by the cooperation between OSU and Timken. The program is based on an ALE method. The modification of bar mill program to tube mill program was accomplished by the cooperation between YSU and Timken. Reducing Mill A reducing mill is a process to reduce the tube OD to a required dimension. The wall thickness depends on the set-up of pass reduction and roll speed. The tube reducing mill is a continuous rolling mill consisting of 10 to 20 stands. The rolls of each stand are set 90 degrees alternately from stand to stand. However, the reduction occurs during the last 5 to 10 stands. A 2-D FE analysis of tube reducing mill was conducted at Timken using an in-house FE analysis program, TubeRoll. The tube is modeled by four elements in the thickness direction, 36 elements in the circumferential direction and 10 elements in the rolling direction as shown in Figure 2.3-36. The rolling temperature is 1000 C. Key input parameters to the reducing model include tube geometry and material properties, roll pass design, roll gap, roll speed, friction coefficients and inter-stand tension forces.
50

Figure 2.3-36. FE model of reducing mill. The reducing model predicts factors that include temperature, stress, strain, strain rate and dimensional characteristics. An example of temperature and stress results of a reducing process is shown in Figure 2.3-37. In general, the surface temperature is minimized where the tube contacts with the rolls. The temperature is maximized at the mid-wall region where the tube contacts with the rolls due to adiabatic heating. Effective stresses shows the maximum stresses at the roll contact region and minimum at the free surface.
a) Contour of temperatures
b) Contour of residual stresses
Figure 2.3-37. Analysis results of reduced tube.
51
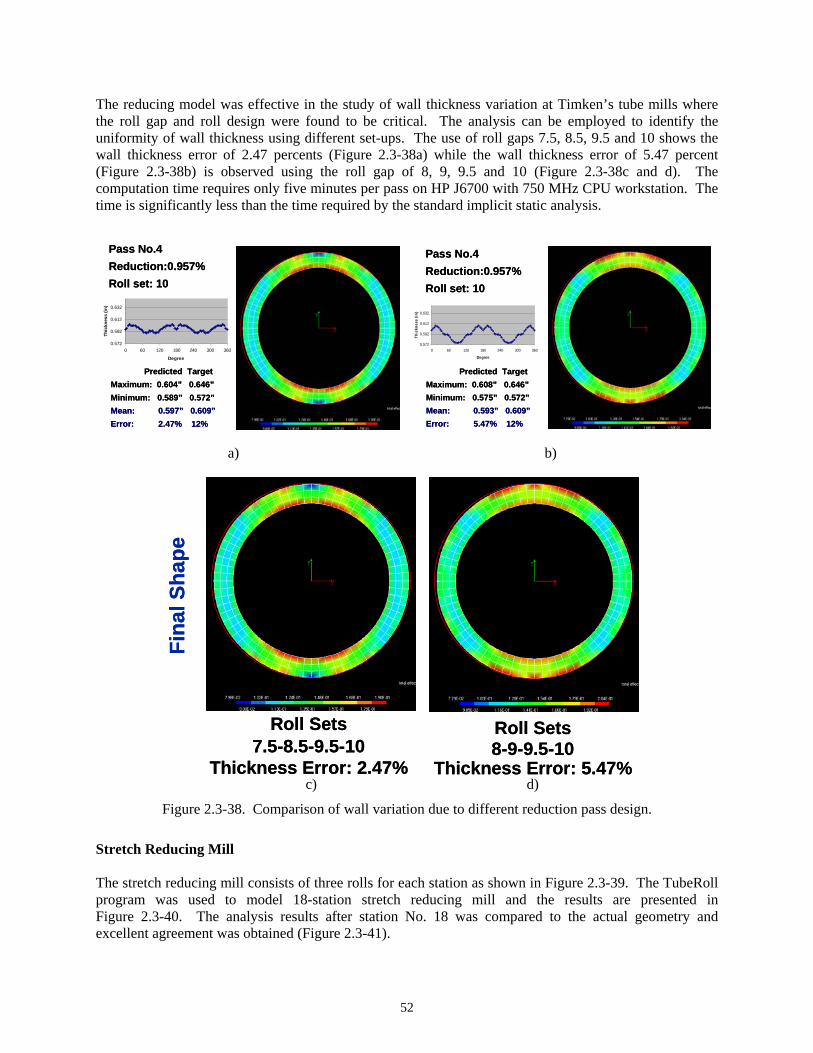
The reducing model was effective in the study of wall thickness variation at Timken’s tube mills where the roll gap and roll design were found to be critical. The analysis can be employed to identify the uniformity of wall thickness using different set-ups. The use of roll gaps 7.5, 8.5, 9.5 and 10 shows the wall thickness error of 2.47 percents (Figure 2.3-38a) while the wall thickness error of 5.47 percent (Figure 2.3-38b) is observed using the roll gap of 8, 9, 9.5 and 10 (Figure 2.3-38c and d). The computation time requires only five minutes per pass on HP J6700 with 750 MHz CPU workstation. The time is significantly less than the time required by the standard implicit static analysis.
Pass No.4Reduction:0.957%Roll set: 10
Predicted TargetMaximum: 0.604” 0.646”Minimum: 0.589” 0.572”Mean: 0.597” 0.609”Error: 2.47% 12%
0.572
0.592
0.612
0.632
0 60 120 180 240 300 360
Degree
Thic
knes
s (in
)
Pass No.4Reduction:0.957%Roll set: 10
Predicted TargetMaximum: 0.604” 0.646”Minimum: 0.589” 0.572”Mean: 0.597” 0.609”Error: 2.47% 12%
0.572
0.592
0.612
0.632
0 60 120 180 240 300 360
Degree
Thic
knes
s (in
)
0.572
0.592
0.612
0.632
0 60 120 180 240 300 360
Degree
Thic
knes
s (in
)
Pass No.4Reduction:0.957%Roll set: 10
Predicted TargetMaximum: 0.608” 0.646”Minimum: 0.575” 0.572”Mean: 0.593” 0.609”Error: 5.47% 12%
0.572
0.592
0.612
0.632
0 60 120 180 240 300 360
Degree
Thic
knes
s (in
)
Pass No.4Reduction:0.957%Roll set: 10
Predicted TargetMaximum: 0.608” 0.646”Minimum: 0.575” 0.572”Mean: 0.593” 0.609”Error: 5.47% 12%
a) b)
c) d)
Roll Sets7.5-8.5-9.5-10
Thickness Error: 2.47%
Roll Sets8-9-9.5-10
Thickness Error: 5.47%
Fina
l Sha
pe
Roll Sets7.5-8.5-9.5-10
Thickness Error: 2.47%
Roll Sets8-9-9.5-10
Thickness Error: 5.47%
Fina
l Sha
pe
Figure 2.3-38. Comparison of wall variation due to different reduction pass design. Stretch Reducing Mill The stretch reducing mill consists of three rolls for each station as shown in Figure 2.3-39. The TubeRoll program was used to model 18-station stretch reducing mill and the results are presented in Figure 2.3-40. The analysis results after station No. 18 was compared to the actual geometry and excellent agreement was obtained (Figure 2.3-41).
52

Reducing Mill Stretch Reducing Mill
Figure 2.3-39. Typical set up of reducing and stretch reducing mills.
Figure 2.3-40. Analysis results of 18-station stretch reducing mill.
Figure 2.3-41. Comparison of analysis and actual geometries after Station No. 18.
53
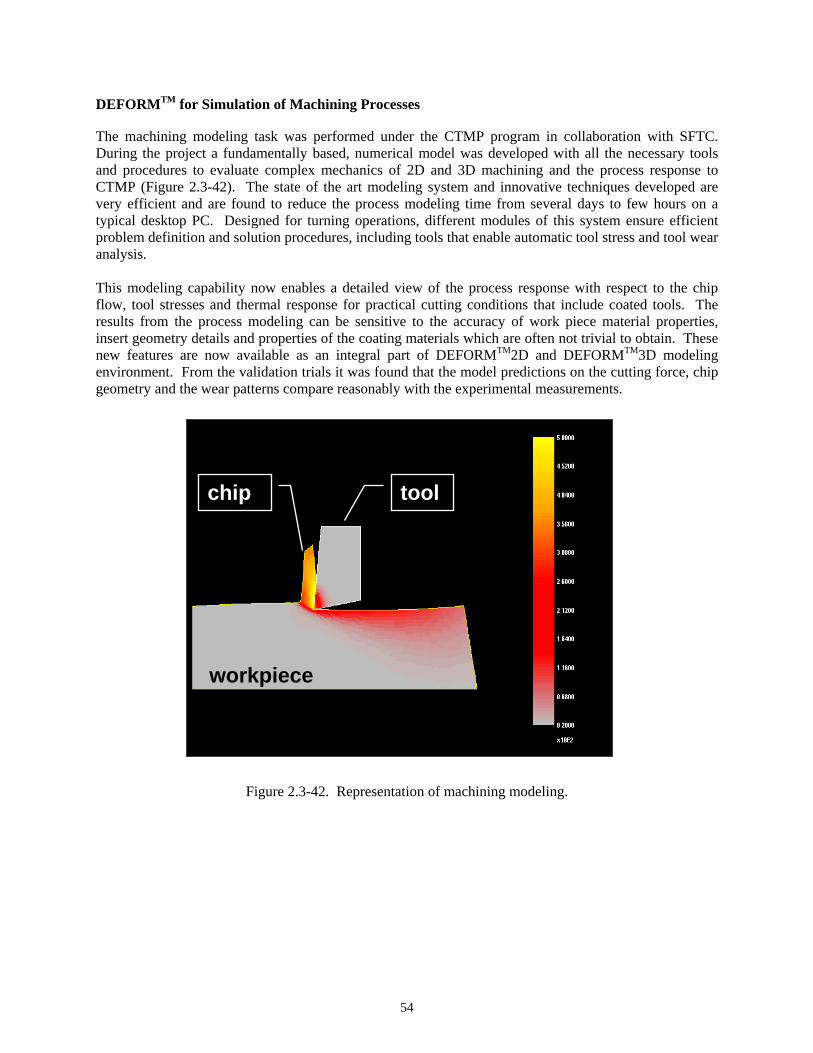
DEFORMTM for Simulation of Machining Processes The machining modeling task was performed under the CTMP program in collaboration with SFTC. During the project a fundamentally based, numerical model was developed with all the necessary tools and procedures to evaluate complex mechanics of 2D and 3D machining and the process response to CTMP (Figure 2.3-42). The state of the art modeling system and innovative techniques developed are very efficient and are found to reduce the process modeling time from several days to few hours on a typical desktop PC. Designed for turning operations, different modules of this system ensure efficient problem definition and solution procedures, including tools that enable automatic tool stress and tool wear analysis. This modeling capability now enables a detailed view of the process response with respect to the chip flow, tool stresses and thermal response for practical cutting conditions that include coated tools. The results from the process modeling can be sensitive to the accuracy of work piece material properties, insert geometry details and properties of the coating materials which are often not trivial to obtain. These new features are now available as an integral part of DEFORMTM2D and DEFORMTM3D modeling environment. From the validation trials it was found that the model predictions on the cutting force, chip geometry and the wear patterns compare reasonably with the experimental measurements.
workpiece
tool chip
Figure 2.3-42. Representation of machining modeling.
54

Application of Process Modeling Tools The process modeling tools have been verified for the accuracy and have been employed and applied for the following purposes:
• To study and understand the process, • To design CTMP process and develop the CTMP recipe, • To define equipment capability, • To optimize the tooling design and process, • To develop neural network and control system, • To develop new product and quality control, • To design of cooling and heating devices and methodologies, • To study the elongator and sinking mill capability, • To study the Induction heater capability for OLN application, • To investigate and reduce the SRM and SM OD and wall variation, • To study the deformation and thermal inhomogeneities for D-ESA, • To improve the dimensional control and surface quality of tubes, • To reduce the process and product development cycle, • To reduce mill time for experimentation, • To investigate technical feasibility of new processes.
55

Subtask 2.4: Process Simulation The intent of the experimental process simulation subtasks was to validate process scenarios, to collect data for process computer model validation, and to evaluate proposed mill processing equipment. Trials were performed off-site for instrumented piercing, and Assel elongating, and planetary elongating using the Kocks Rolling Mill (KRM). Deformation temperatures, amount of deformation and rolling speeds were varied for each type of deformation studied. Interrupted deformation tests (i.e., stopping of piercing operation mid-way through a tube) were also conducted in order to capture the in-situ dimensional and metallurgical state of the work piece. Air-cooling, fan cooling, slow cooling, and quenching variants were also incorporated in the Assel elongation study. The results from the KRM trial have been compiled with respect to mechanical attributes of the tubes, equipment capabilities, and the effects of deformation levels, speeds, and temperatures on process capability. Several areas of additional work to improve the capability of the KRM were identified in order to make the equipment industrially viable. Another, large effort to simulate a new process focused on the Normalize Equivalent (NEQ) process. These process simulations were conducted at Timken’s piercing mills. The NEQ trial was conducted under the constraint of minimizing implementation capital. Toward that end, a trial was conducted with nine steel grades and a range of tube OD and wall dimensions. Results indicated a strong potential for application of a minimum capital NEQ process in tailored applications to achieve the targeted structures and properties found in heat-treated products. Results also showed that in order to achieve NEQ over a much wider application range, the process will need to be developed further. However, this development will likely require new capital equipment. The additional equipment would include higher deformation reducing mills, rapid-cooling devices for additional grain refinement like those prototyped (Figure 2.4-1), and an upgraded slow controlled cooling capability to obtain the desired hardness levels.
Figure 2.4-1. Plant rapid cooling device.
56
Subtask 2.5: Process Verification Process Recipes Process verification concentrated on proving the potential of CTMP recipes to enhance the tube manufacturing and improve product performance. The manufacturing focused on reduction of energy costs primarily through the reduction or elimination of post-tube making heat treatment, while improved product performance focused on obtaining special microstructures at low energy costs to improve machinability. Several CTMP recipes were developed and tested for verification utilizing bench-scale laboratory equipment, laboratory equipment simulating the industrial plant, or through actual in-plant testing. These processes included Advanced Final Cooling (AFC), Controlled Rolling (CR), Thermal-Enhanced Spheroidize Annealing (T-ESA), Deformation-Enhanced Spheroidize Annealing (D-ESA), Normalize Equivalent (NEQ) Cooling and Deformation, and Inline Quenching (ILQ). During tube rolling the deformation to which the tube is subjected increases the internal energy of the crystal structure by introducing a high level of crystal defects - dislocations. These dislocations are necessary to allow deformation with out fracture, but are highly unstable thermodynamically at typical rolling temperatures. Due to their instability, the deformed (dislocated) austenite recrystallizes shortly after deformation. The deformation conditions and subsequent recrystallization process control the final austenite grain size entering the cooling bed. The final austenite grain size, in turn, affects the volume fraction and morphology of austenite decomposition products (Figure 2.2-5, for example). By controlling the rolling practice, it is possible to “dial-in” a desired prior austenite grain size that provides an optimal (or near optimal) as-cooled microstructure. The optimal microstructure is highly dependent on the application of the tube. In many instances, Timken seamless mechanical tubing is machined into discrete annular components, then either carburized and hardened, or induction hardened. In these cases optimal is often measured by machinability, and, to a lesser extent, heat treatment response. Achievement of controlled austenite grain size requires thermal control and significant deformation in order to drive recrystallization. For this investigation, production equipment limitations with respect to rolling loads had to be taken into consideration. These constraints led to further investigation into conventional CR and the novel NEQ process. Those processes are described further below. Advanced Final Cooling (AFC) The AFC recipes were developed and specifically targeted at enhanced machinability of gear steels. The AFC process enhances the steel microstructure to create improved machining performance with the potential to reduce energy consumption. The aim microstructure was determined from broach testing of baseline and tube mill experimental data developed in other CTMP recipe development efforts. The initial AFC development consisted of concept development through execution of pertinent TOM computer runs and metallurgical evaluation. Both precise controlled slow cooling and a combination of controlled rapid and slow cooling were investigated. The latter approach appeared to be more able to achieve the aim microstructure. The more promising recipe was verified with a series of experiments at Timken Research. Refinements to the recipes were developed through use of TOM, experiments, Gleeble studies and detailed microscopy. After developing the first AFC recipe, work began to develop and verify a new recipe for a second steel grade. The second recipe was developed through laboratory experiments, Gleeble studies, and detailed optical microscopy along with scanning electron microscopy. Using the previously described methods, a third CTMP recipe was developed in a laboratory environment for fine grained induction hardening steel.
57

Validation of the AFC process in actual operational facilities was conducted using in-plant trials to test key operational components of the process and to prepare tubing material for metallurgical and broach tests conducted in Subtask 2.6. The TOM model along with recipe variable set points was used to establish the operational set points for the in-plant trials. The initial verification proved to be very successful. Furthermore, alternative processing paths for the AFC recipes were verified in additional in-plant trials designed to determine the viability and robustness of the process. Three cooling process paths were tested in the trials and the broach testing showed each to have excellent broach tool life improvements over standard processing paths. A Gleeble 3500C was used to simulate potential thermal cycles for AFC. Here samples were austenitized at temperatures that would provide prior austenite grain size values typical of hot rolling. Tests were also conducted with finer grain sizes to determine if AFC should be conducted in conjunction with a grain refining thermo-mechanical process such as controlled rolling, or the normalize equivalent process. Thermal cycles that were investigated included both rapid quenches to isothermal hold temperatures, and thermal profiles that simulated measured laboratory interrupted quench investigations at different wall locations in the test tubes.
The goal of these tests was to determine optimal target temperatures. During the initial quench, too low of a temperature would result in the formation of martensite, and during the rebound and hold, too high, or too low of a temperature would result in sluggish transformation kinetics. Figure 2.5-1 shows a series of time temperature profiles measured on interrupted quench tubes, and compares these to quench profiles run in the Gleeble dilatometer. Figures 2.5-2 and 2.5-3 show a few examples of the Gleeble simulations run for the AFC investigation.
400 500 600 700 800 900 1000 1100 1200
200
300
400
500
600
700
ZOOM
420 430 440200
400
600
soak
rebound
Tem
pera
ture
(o C)
Time (sec)
Symbols = lab trial measurements Lines = Gleeble dilatometer runs
initial quench
soak
rebound
Tem
pera
ture
(o C)
Time (sec)
Symbols = lab trial measurements Lines = Gleeble dilatometer runs
initial quench
Figure 2.5-1. Comparison of laboratory quench profiles at different tube locations to thermal profiles applied in Gleeble dilatometry investigations for the AFC process.
58

-100 0 100 200 300 400 500 600 700 800 900 10001100
0.00
0.05
0.10
0.15
0 100 200 300 400 500 600 700 800 900 1000 1100 1200
200
400
600
800
1000
Tem
p (o
C)
Time (sec.)
Quench AFC 1 AFC 2
Quench AFC 1AFC 2
dila
tion
(mm
)
Temperature
time-temp
Figure 2.5-2. Dilation versus temperature curves for two AFC simulations, and one full quench (to identify the martensite transformation temperature). Inset is the time-temperature profile associated with each dilations curve. Figure 2.5-3 below shows the associated dilation versus time.
200 400 600 800 1000 1200 1400
0.00
0.05
0.10
0.15
dila
tion
(mm
)
Time (sec.)
Quench AFC 1 AFC 2
transformation complete
Figure 2.5-3. Dilation versus time for the AFC simulations shown in Figure 2.5-2.
59

Controlled Rolling (CR) The CR process in most instances is performed to refine the prior austenite grain size, but can also be used to achieve a target (not necessarily fine) grain size. For this work, it was determined that a moderately fine prior austenite grain size (ASTM 5-7) would increase the volume fraction of ferrite and pearlite, while reducing or eliminating bainite or martensite/austenite (M/A) constituents. In some instances, bainitic, or mixed microstructures with M/A require an additional tempering heat treatment for machinability. In order to achieve appropriate grain sizes to control the final microstructure, up stream deformation conditions must be controlled within minimum strains and maximum temperatures. The exact values of these minimum and maximum depend somewhat on chemistry, tube size and processing conditions, but are on the order of minimum strains of 10 to 20% and maximum finish temperatures on the order of 850 to 950 C. Thermal-Enhanced Spheriodized Annealing (T-ESA) The objective of this activity was to develop an annealing cycle that reduced the time and energy requirements involved in the spheroidization heat treatments applied to 52100 and other homogeneous high carbon steels. The T-ESA process is carried out in the current offline thermal treating equipment and is therefore a process minimization capability. A sister effort, D-ESA described in later this report, is conducted inline and is a process elimination capability. The two experimental programs were conducted simultaneously. The T-ESA was the more readily implementable capability. The recipe has been in use for more than three years with very significant environmental and economic benefits. Obviously, the economic benefits have trebled in today’s tight natural gas market. An annealing cycle, which consists of alternative heating and cooling between temperatures above and below the critical temperatures, was studied based on literature information. A unique 10-hour T-ESA cycle was proposed for a roller furnace. To study the robustness of the annealing cycle, austenitizing temperature, reheating and cooling temperature variations and four types of prior microstructures were studied in the lab and preferable temperature values and process step-times were established. Mill trials were carried out to study the furnace capability and zone-setting temperatures to execute the annealing cycle. Production trials were performed to verify the microstructures. Optimum furnace zone-set temperatures and times were determined. The metallurgical results produced using the 10-hour annealing cycle were consistent and comparable to those produced using the then current production (16 to 20-hour) cycles (Figure 2.5-4). The hardness and microstructural results readily met the requirements for both domestic and international material standards.
b) 16-hour cycle a) 10-hour cycle
Figure 2.5-4. Uniform microstructure produced by T-ESA cycles.
60
The mill studies incl ces (single layer,
he cycle has specific thermal and temporal set-points, but is so robust that reasonable variations in
eformation-Enhanced Spheriodized Annealing (D-ESA)
s noted, D-ESA is an elegant concept because it is an inline process and, therefore, has a process
he purpose of this effort was to produce a uniform fully spheroidized microstructure with Brinell
uded work using various sizes of tubing and furnace loading practidouble layer, etc.) to assure practicality for all types of tubular products. The initial work was conducted in roller hearth operations. The process design was very robust and was subsequently successfully implemented into car furnaces and then extended into other Timken global heat treatment facilities. Work continues to further its applicability within Timken operations and will be appropriately offered to external entities. Tmaximum and minimum temperature are permissible for the attainment of satisfactory results. This robustness translates into the ability to utilize the technology in different types of furnaces. The technology is also applicable to other types of steel requiring spheroidization or types of annealing cycles, such as medium carbon steels. Work is planned to utilize this technology where possible to gain additional process minimization and the concomitant energy, environmental and economic savings. D Aelimination capability. It was a more difficult activity than T-ESA but the successful capability developed is unique and is not complex as it has fewer steps. Implementation of D-ESA will require slight mill equipment additions, but these will be quite practical in nature. Complete laboratory development and validation studies have been completed. Patenting activity is being pursued. Thardness less than 207HB (95HRB) in homogeneous high-carbon plain and alloy steels via inline application of CTMP. Based on the results of literature study and Timken’s own knowledge base, four separate experimental thrusts were conducted. The first was work done within laboratories and mill facilities at Timken in conjunction with a DTI-VNITI (The Osada State Tube Institute in Dniepropetrovsk, Ukraine). A team from VNITI visited Timken Research in late 1999 shortly after the CTMP program commenced. Significant studies were conducted at Timken Research and at Timken’s No. 4 Piercing Mill. The results of that work were useful, but insufficient as additional verification work is needed.
61

Additional literature study and laboratory work at Timken Research led to the three subsequent thrusts. The first of those comprised thermal mechanical studies on the Gleeble simulator. The results permitted additional experiments to be conducted as follows:
A. Timken-designed thermal mechanical processing scenarios utilizing Canton tube shells with specific prior processing at VFUP, Riesa e.V., Germany. These Assel mill and subsequent cooling process designs were carried out on VFUP’s universal cross-rolling mill. The steel type was 52100, as was used in all D-ESA development work to date. A total of 21 trials were conducted which studied the effects of five independent factors. This study was conceived in 2001 and conducted in February/March 2002. To verify the recipe for D-ESA, tubes were prepared through thermal processing and sent to VFUP Riesa where elongation experiments were conducted following an extensive test matrix encompassing various heating, deformations and final cooling variations. The experiments produced spheroidized carbide microstructures, which easily met industrial standards, and by doing so verified the D-ESA recipes.
B. A DoX conducted on laboratory equipment at Harbin University, Harbin, China. The samples for this study had received prior thermal mechanical processing at Timken, which was not disclosed to Harbin. A total of 32 primary runs and eight refining runs were conducted. A total of six processing factors were studied. This study was conceived and conducted during 2002.
The ultimate output of the foregoing work was the creation of two D-ESA processing designs. The first is a two-step forming, inline thermal mechanical spheroidizing process, while the second is a D-ESA design for warm forming operations. In either case, the resultant hardness and microstructure of the workpiece will readily meet all domestic and international standards. An example of the uniform microstructure, equivalent to that produced by T-ESA and shown in Figure 2.5-4, is shown in Figure 2.5-5.
Figure 2.5-5. D-ESA microstructure.
62

Normalize Equivalent (NEQ) Some seamless mechanical tubing is subjected to a conventional secondary normalization heat treatment. Conventional normalization as defined by The Heat Treaters Guide consists of “heating a ferrous alloy to a suitable temperature above the transformation range and then cooling in air to a temperature substantially below the transformation range” [Ref 11]. At Timken most normalized product is heated to 900 C, allowed to soak, and then air cooled. The metallurgically relevant phenomenon, which occurs in this process, is that upon reheating the prior microstructure (i.e., as rolled, Q&T, etc.) is replaced upon transformation with fresh austenite. The maximum temperature controls the grain size of the austenite, since austenite grain coarsening is a thermally activated process. Since the maximum temperature is relatively low, 900 C, the grain size is fine (typically ASTM 6.5 to 8.5). The fine austenite grain size upon air cooling provides an abundance of nucleation sites for ferrite upon air cooling, which also helps to increases the propensity to form pearlite. The novel NEQ process derived under this project consisted of performing conventional high temperature deformation processes (or slightly reduced temperatures) in the piercing and elongation processes, followed by an immediate interrupted quench after Assel elongation. This process freezes in the fine metadynamically recrystallized austenite grains without requiring high mill-rolling loads associated with conventional controlled rolling processes. Lab Studies The Gleeble 3500C at Timken Research was used to investigate critical temperature, deformation conditions, and cooling conditions required to achieve both controlled rolling and NEQ processes. These tests included conventional uniaxial compression testing at targeted temperatures, strains and strain rates, followed by controlled cooling processes, as well as thermo-mechanical process simulations of the tube making process using the torsion unit on the Gleeble. Figure 2.5-6 and 2.5-7 show some example time vs. temperature and torque vs. torsion profiles for simulations used to define the NEQ processing recipe. In Figure 2.5-8, the black squares represent typical tube making temperatures. Reading from early times on, these black squares represent – soaking furnace, piercing entry, elongator entry, elongator exit, sinking mill entry, sinking mill exit, rotary sizing and cooling bed entry temperature. The colored lines represent a series of Gleeble torsion simulations in which the piercing and elongation temperatures were reduced, and a rapid quench was imposed after elongation to freeze in the fine metadynamically recrystallized grain size. The legend shows a range of quench-to temperatures used to identify optimal NEQ processing conditions. Figure 2.5-7 shows the resultant torque/torsion curves from these simulations. Note that the torque required in the “sinking” simulation steadily increases with reduced temperatures. Metallographic analysis was completed after the tube making simulations to identify appropriate temperature and deformation conditions required to achieve target austenite grain sizes and microstructures (Figure 2.5-8). Similar physical simulations were completed to define appropriate process recipes for controlled rolling practices.
63

4 8 0 5 4 0 6 0 0 6 6 0 7 2 0 7 8 0
7 0 0
8 0 0
9 0 0
1 0 0 0
1 1 0 0
1 2 0 0
0 1 2 3 4 5
1 3 0 0
1 4 0 0
1 5 0 0
1 6 0 0
1 7 0 0
1 8 0 0
1 9 0 0
2 0 0 0
2 1 0 0
2 2 0 0S in k T e m p .
1 0 3 0 oC (1 8 9 0 F ) 9 1 0 oC (1 6 7 0 F ) 8 8 0 oC (1 6 1 5 F ) 8 5 4 oC (1 5 7 0 F ) 8 2 6 oC (1 5 2 0 F ) 8 0 0 oC (1 4 7 2 F )
M ill B a s e lin e 1 0 8 0 oC (1 9 7 5 F )
Tem
pera
ture
(o C)
T im e (s e c )
T im e (M in u te s )
Tem
pera
tuire
(F)
Figure 2.5-6. Tube making physical simulation of the NEQ process using the Gleeble torsion thermo-mechanical process simulator.
0 2 4 6 8 10 12 140
5
10
15
20
25
30
35
13.8 13.9 14.00
5
10
15
20
25
30
35Sink @ Various
Elong. @ 1030oC (1890F)
Pierce @ 1120oC (2050F)
Torq
ue (N
m)
Torsion (Radians)
Torq
ue (N
m)
Torsion (Radians)
Sink Temp. 1030oC(1890F) 910oC(1670F) 880oC(1615F) 854oC(1570F) 826oC(1520F) 800oC(1472F) 800oC(1472F)
Figure 2.5-7. Torque versus torsion (similar to stress versus strain) curves
for tube making physical simulation of the NEQ process using the Gleeble torsion thermo mechanical process simulator.
64

800 850 900 950 1000 10503
4
5
6
7
8
91500 1600 1700 1800 1900
3
4
5
6
7
8
9
No Sink 5046
5% Sink 4027 5130
10% Sink 4027 5130 5046 8119
20% Sink 4027 5130 5046Low Temperature
Pierce "Baselines"
AS
TM G
rain
Siz
e
Sink Temperature (oC)
Sink Temperature (F)
Figure 2.5-8. Grain size versus sink temperature for a series of steels and sink amounts
derived from NEQ simulations using the Gleeble torsion thermo-mechanical process simulator.
Mill Trials Mill trials were carried out to validate controlled rolling and NEQ recipes developed in the laboratory and via process simulation with the TOM. The CR trials were conducted by piercing at conventional temperatures, followed by air cooling on the transfer table between the piercing mill and the elongator. Cooling time was varied in order to achieve a range of temperatures in to the elongator. After elongation the tubes were deformed in the sinking mill, rotary sized, and air cooled. During the elongation process, significant deformation is imparted at relatively high strain rates (~ε >1, ε& >50 s-1). This resulted in significant adiabatic heating, often to temperatures which allowed excessive and rapid austenite grain coarsening. Nonetheless, this trial did show that through appropriate cooling prior to elongation, coupled with adequate sinking mill deformation austenite grain size could be controlled within the range of approximately ASTM 6–2. The NEQ trials were completed by first applying a moderately reduced piercing temperature, followed immediately by elongation. A quenching ring was employed to quench rapidly the elongated shell to below conventional grain coarsening temperatures immediately after elongation. The shell was then further processed through the sinking mill and rotary sizer followed by air cooling. A range of tube sizes and quench settings (flow rates, quench duration, etc.) was investigated to identify optimal NEQ processing recipes. Results from this trial indicated that an as hot-rolled microstructure could be achieved which essentially was equivalent to conventional post-rolling normalization processes on the OD of the tube where the quench was applied (Figures 2.5-9 and 2.5-10). The ID of the tube, which was not quenched directly, exhibited a slightly coarser grain size, typically on the order of one to two ASTM numbers greater than the OD.
65

Figure 2.5-9. Conventionally normalized 1045. Figure 2.5-10. NEQ processed 1045 (OD).
Inline Quenching (ILQ) A laboratory investigation was initiated to evaluate various direct cooling/quenching scenarios for 4130 steel. Here 2” plates were rolled on the lab rolling mill at Timken Research to a final thickness of 0.7”. After rolling, various processing conditions were applied. The variants that were investigated included:
• Baseline – off line quench and temper (PR) • Controlled rolled – fine grain, direct quench, then temper (SQ, or RCR-T) • Controlled rolled – coarse grain, direct quench, then temper (LQ, or Conventional roll - T) • Air cooled and temper (A-T) • Air cooled no temper (A) • Accelerated initial cool (for bainite), and temper (B-T) • Accelerated initial cool (for bainite), no temper (B)
A tempering study was conducted to determine the tempering temperature required for each variant to achieve a hardness of HRC 36 +/- 1 for fatigue testing (Figure 2.5-11). The fatigue test results are shown in Figure 2.5-12. Minimal difference is seen in fatigue for the various conditions. However, Charpy impact testing data (Figure 2.5-13) indicate that impact toughness is significantly affected by processing. The quenched and tempered sample (baseline, and direct quenched from rolling) performed significantly better than the air cooled and accelerated, interrupted cooling sample. Figure 2.5-14 shows strength and ductility data for air cooled samples subject to different final reductions. Here 2” thick plates were rolled to 0.7, 0.6, or 0.5”, followed by air cooling. Mechanical properties versus tempering temperature were then investigated. It is apparent from these data that tempering temperature is a first order effect. Additional reduction increases strength and ductility only slightly.
66

18202224262830323436384042444648
0.57"
0.48"0.73"
Inte
rupt
ed A
ccle
rate
d C
ool (
@ 5
00o C
)Ai
r Coo
led
250 300 350 400 450 500 550 600 650 700 750 800
18202224262830323436384042444648
500 600 700 800 900 1000 1100 1200 1300 1400
18202224262830323436384042444648
Heat Treaters Guide (converted from HBS) G. Waid - Alloy Development Study (infered from UTS) Conventional Hardening - T
γ=870oC, Water Quench
Control Roll and Direct Water Quench @ 870oC Troll,fin.= 1100oC and Direct Water Quench @ 870oC
Interupted Acclerated Fan Cool (@ 500oC) Troll,fin.= 1080oC to 0.73" - Air Cooled (conv. from HBS)
Troll,fin.= 1080oC to 0.57" - Air Cooled (conv. from HBS)
Troll,fin.= 1050oC to 0.48" - Air Cooled (conv. from HBS)
Roc
kwel
l C H
ardn
ess
Tempering Temperature (oC)
Tempering Temperature (F)
Figure 2.5-11. Hardness versus tempering temperature for 4130 subject to a range of processing paths.
104 105 106 10770
80
90
100
110
120
130
140
PR - Baseline Post Roll Q&TBT - Tempered BainiteLQ - Quench from Coarse Grain Rolling practiceSQ - Quench from Controlled Rolling practice
Stre
ss (K
si)
Cycles
LQ_StressKsi LQ_runout BT_StressKsi BT_runout SQ_StressKsi SQ_runout PR_StressKsi PR_runout
Figure 2.5-12. Rotating bending fatigue data for 4130 direct quenched investigation.
67

-100 -50 0 50 100 150 200 250 300 350-10
0
10
20
30
40
50
60
70
80
90
100
110-50 0 50 100 150
-10
0
10
20
30
40
50
60
70
80
90
100
110
Temperature (oC)
Baseline Q&T RCR + Dir. Q - T Conv. Roll + Dir. Q - T Bainite Cool + T Bainte Cool no T Air Cool + T Air Cool no T
% F
ibro
us
Temperature (F)
-100 -50 0 50 100 150 200 250 300 350
0
10
20
30
40
50
60
70
80
90
100
110
120
-50 0 50 100 150
0
10
20
30
40
50
60
70
80
90
100
110
120
Cha
rpy
Impa
ct E
nerg
y (F
tlbs)
Temperature (F)
Temperature (oC)
Figure 2.5-13. Charpy impact data for 4130 direct quench investigation.
68

100
650
700
750
800
850
900
950
1000
1050
1100
1150
1200
As Rolled500 550 600 650 700 750
650
700
750
800
850
900
950
1000
1050
1100
1150
1200
Stre
ngth
(MPa
)
Tempering Temperature (oC)
Yield 0.75" 0.60" 0.50"
UTS 0.75" 0.60" 0.50"
Figure 2.5-14. Strength and ductility variation as a function of tempering temperature and total reduction. Three of the verified CTMP recipe methods were investigated to determine if they are patentable. The patents were pursued by conducting literature searches, patent searches, and initiating disclosure of invention forms. All three of the CTMP process recipes appeared to be verified with one going to the point of having the patent application being submitting to United States Patent Office while at the time of this writing the patents for the other two recipe methods were still being pursued.
10040
45
50
55
60
65
70100
10
15
20
25
30
35
40
As Rolled500 550 600 650 700 75040
45
50
55
60
65
70500 550 600 650 700 750
10
15
20
25
30
35
40
% R
educ
tion
in A
rea
Tempering Temperature (oC)
RA 0.75" 0.60" 0.50"
EL 0.75" 0.60" 0.50"
% E
long
atio
n
69

Subtask 2.6: Product Response “Industrial Ecology is a new paradigm with the aim of developing industrial production processes that will work in harmony with natural systems. Ways are identified to reduce the environmental and economic impact of production, use and disposal of products. The objective is to reduce the waste of materials and energy while minimizing emissions.” [Ref 12] These words had not been written when the CTMP program was initiated, but they certainly represent the basic philosophy of the program and the product response subtask in particular. The objective was not only to minimize energy, material waste, emissions, and costs within our own plants and operations, but to create similar and very significant savings within the customers’ plants where the raw materials would be further processed and refined during the manufacture of highly engineered end products. Prior work had convinced Timken’s Dr. James A. Brusso that despite the on-rush to convert component manufacture to “forgings and chuckers,” high quality tubing was not only competitive, but preferable, for certain components. Automotive ring gears were a prime example. High quality in this instance referred to many factors, including: dimensional quality, surface quality (OD and ID), hardness, microstructure and alloy design. Benefit analyses had centered on several main themes: reduced scrap and re-work, reduction or elimination of post-process heat treatments, reduced alloy content, and reduced machining and tooling costs. These were applied to a variety of market sectors (automotive, bearing, mechanical components, energy/oil country tubular goods (OCTG), industrial, line pipe, pressure tubing, etc.). Not only were these technologies/savings applicable to tubing, many were and are applicable to bar, forgings and other types of steel raw material forms. Savings in both economic and ecological terms were estimated. Armed with initial estimates, Timken approached various market sectors to consider application of the technologies for savings that would accrue in tube processing, as well as savings that would be capturable in their operations/products. Timken received enthusiasm from the entire customer base. Two of the market sectors were selected for the primary studies involving product response – bearing and automotive. Both rely heavily on forming, machining, heat treatment and finishing operations – all of which could be heavily impacted by CTMP technologies. The text below will provide detail on the types of operations selected for study and the testing which was conceived and developed to determine and verify the basic value of CTMP products. Bearing Business Product Response Tests The Timken Bearing Business is a major consumer of tubing manufactured by Timken’s Alloy Steel Business. The operation most influenced by the tubing manufacturing process is the initial green machining operation performed on the as-received tubing (long or short lengths). Long length tubing is fed into a screw machine and short length tubing (slugs) are chucked into machining centers to green machine the cup (inner) and cone (outer race) bearing parts. The acceptability of either green machining operation (from a material standpoint) is based upon the life of the tools used and the complexity of the chips produced during the green machining operation (especially on the screw machine). Therefore, green machining tests on both long and short length tubing sections were developed at Timken Research to gauge the impact of tube mill processing on these factors, and to search ultimately for optimized methods of improving these factors with the goal of achieving a lower cost and energy tube making method. The following sections will describe each test and the results obtained.
70

Screw Machine Test Test Description A 4-5/8” New Britain screw machine was installed at Timken Research to perform machining trials on the various CTMP tubing variants. The machine was runoff with baseline 8119 tubing to establish the testing method and baseline tool life and chip control results. The test consisted of machining a 592 part number cup while monitoring the tool wear and chips generated from the bore, cutoff and OD radius tools. The initial tests were successful in establishing the testing procedure including the measurement and samples taken and the intervals for each, the measuring techniques, and the recording procedures. The baseline tool wear and chip control values were also successfully established during the initial tests. Test Results
The various CTMP processed 8119 tubing conditions were tested utilizing the procedures previously established. The test was found to be sensitive to the various conditions both in terms of the chip control and tool wear measures established. The testing of the various CTMP material conditions resulted in the determination of both optimal and deleterious metallurgical conditions for this grade in regard to these machining response measures. Essentially, an ideal microstructure and hardness level were determined, and a deleterious microstructure and hardness level were also identified. The ideal condition resulted in equivalent to improved chip control and tool wear results compared to the baseline results, while the deleterious condition resulted in vastly inferior chip control and tool wear response. This information was used to identify the tube making processing conditions required to develop the ideal material properties and those to avoid the deleterious conditions. These material conditions were also tested in some companion grades to the 8119 steel, with similar results (similar ideal structure and hardness level). Modified processing plans also are being implemented for these grades. Turning Test Test Description A turning test was developed to test tubing slugs for tool wear rates for the same CTMP processed tubing conditions as was done for the screw machine test. A single, common carbide insert was selected for the test, which involved machining repeated ~15” long OD passes on a tube slug. The tool was removed at regular cutting time intervals to measure the tool wear level. The chip breakers used in this type of chucking machining operation are more effective than those used in screw machining. As such chip control was consistently good throughout the testing, and was not monitored. Baseline data and testing methods were developed on the same 8119 tubing conditions used for the screw machine, and a successful testing technique and tool wear data protocol was established within this trial.
Test Results Each of the steel conditions were tested at two to three turning speeds. Cutting times to 0.015” flank wear were recorded as the measure to rank each steel type and condition. The various conditions showed significant differences in tool life, in a range from 33 to 190 minutes at 1000 surface feet per minute (SFM), and 14 to 63 minutes at 1200 SFM. In general, a trend of increased tool life with decreasing hardness was noted, and so on-line processing conditions that resulted in lower hardness levels tended to improve tool life.
71

The one primary exception to this trend was noted for the normalize condition for 8119 (an off-line, grain refining heat treat process), which resulted in a generally low hardness level, but the lowest overall tool life by a significant margin. Therefore, it was concluded that on-line processing techniques that generally tend to lower hardness level for these grades will result in improved tool life in turning operations, and that off-line normalizing should be avoided as a means of processing these grades. This general rule was input into the material models for developing on-line process techniques designed to lower the final tube hardness as a means of optimizing tool life for turning operations. Automotive Customer Product Response Tests The largest external market segment for seamless tubing is the automotive sector, which primarily uses tubing or tube-based slugs as the input material from which transmission parts such as gears or races are machined. Therefore, material processing changes that affect the steel metallurgy of the tubing and the response to machining operations are important considerations. The critical machining operations have been identified to be gear teeth cutting operations, such as hobbing or broaching. Whereas hobbing had been the traditional method used to cut gear teeth, broaching is now the more common method and is being used for most new gear designs. Broaching, which involves making successive cuts using teeth (Figure 2.6-1) on a broach bar pulled through a tube section (Figure 2.6-2), is a more efficient method to cut gear teeth. Broaching cost is largely a function of the number of gears that can be manufactured on a broach tool, which is very expensive to purchase and recondition Figure 2.6-3).
Figure 2.6-1. Broaching cutting.
Figure 2.6-2. Structure of a broach bar.
72
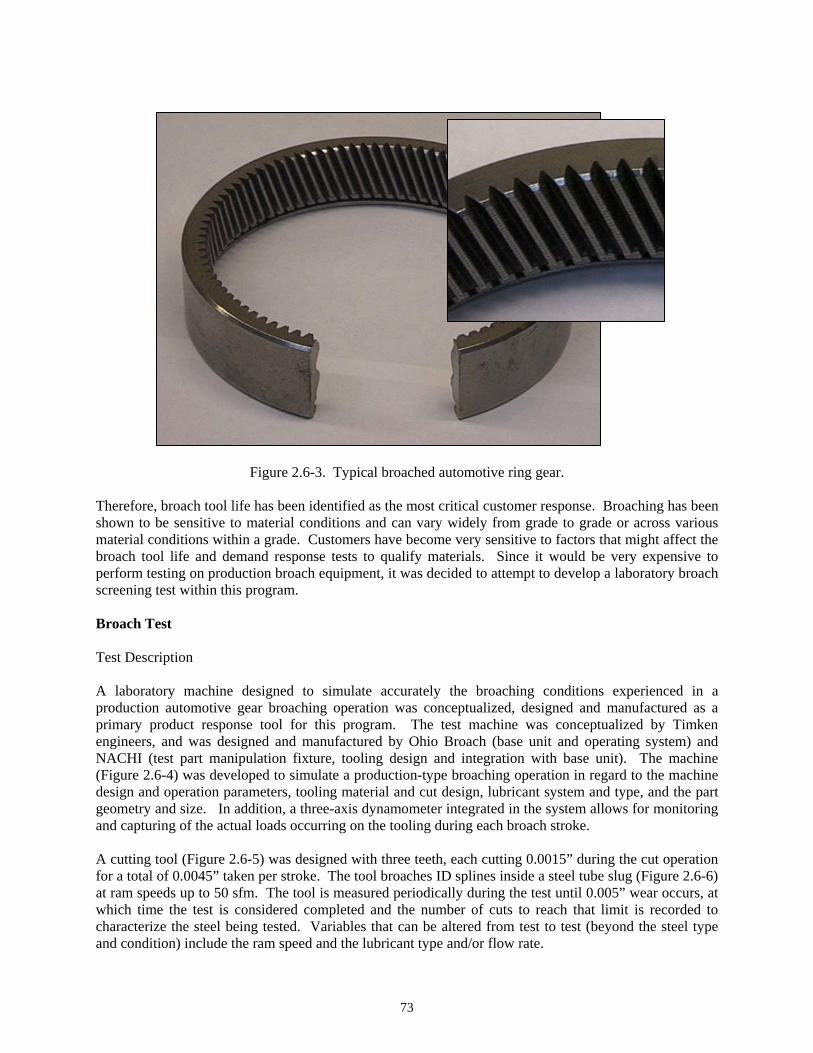
Figure 2.6-3. Typical broached automotive ring gear. Therefore, broach tool life has been identified as the most critical customer response. Broaching has been shown to be sensitive to material conditions and can vary widely from grade to grade or across various material conditions within a grade. Customers have become very sensitive to factors that might affect the broach tool life and demand response tests to qualify materials. Since it would be very expensive to perform testing on production broach equipment, it was decided to attempt to develop a laboratory broach screening test within this program. Broach Test Test Description A laboratory machine designed to simulate accurately the broaching conditions experienced in a production automotive gear broaching operation was conceptualized, designed and manufactured as a primary product response tool for this program. The test machine was conceptualized by Timken engineers, and was designed and manufactured by Ohio Broach (base unit and operating system) and NACHI (test part manipulation fixture, tooling design and integration with base unit). The machine (Figure 2.6-4) was developed to simulate a production-type broaching operation in regard to the machine design and operation parameters, tooling material and cut design, lubricant system and type, and the part geometry and size. In addition, a three-axis dynamometer integrated in the system allows for monitoring and capturing of the actual loads occurring on the tooling during each broach stroke. A cutting tool (Figure 2.6-5) was designed with three teeth, each cutting 0.0015” during the cut operation for a total of 0.0045” taken per stroke. The tool broaches ID splines inside a steel tube slug (Figure 2.6-6) at ram speeds up to 50 sfm. The tool is measured periodically during the test until 0.005” wear occurs, at which time the test is considered completed and the number of cuts to reach that limit is recorded to characterize the steel being tested. Variables that can be altered from test to test (beyond the steel type and condition) include the ram speed and the lubricant type and/or flow rate.
73

a) b)
Figure 2.6-4. Broach test machine and control stand a), and a close-up of the part manipulation table and coolant lines b).
Figure 2.6-5. Broach tool showing three cutting teeth.
Figure 2.6-6. Test ring with a broach tool shown in cutting position.
74

Test Results The broach testing machine was used successfully to characterize each of the automotive grades selected within this program, was validated on one grade through comparison to production broach life results, and was used to identify the optimal material broaching condition for each grade. The broach life to 0.005” tool wear was measured for each steel type and condition, and compared to identify optimal processing methods for each steel type to maximize broach tool life. A production broach life comparison test was performed to validate the broach test results, and is reported below. The overall broach test results have clearly indicated an optimal broaching microstructure for each steel type. Processing methods to obtain the optimal structure have been developed, resulting in a newly discovered patentable concept. A U.S. patent application titled “Optimization of Steel Metallurgy to Improve Broach Tool Life” has been filed to cover the discovery of the optimized broaching microstructure and manufacturing methods (including CTMP) to develop that structure in automotive tubing. These material optimization results have also been used as input to the material models to develop potential on-line or on-line with minimal off-line processing techniques for each of the automotive grades.
Validation Testing
Validation of the broach screening test was performed on 1552M1 normalize and tempered tubing for a helical broached internal transmission gear. The gear is broached in a production automotive plant, where tool life data are collected for each broach tool. The validation involved selecting two differing material conditions created by varying the level of refinement of the base microstructure. Table 2.6-1 shows data from the broach screening test and production results for two steel processing conditions. The screening test mirrored the production test showing more than a two-times difference in tool life in the tool wear rate comparison.
Table 2.6-1. Broach test validation. Material Tempering
Temperature (F) Hardness
HRB Production Broach Life
Screening Test Broach Life
Condition 1 Low High 625 720 Condition 2 High Low 1875 2000
These results indicated that the screening test is capable of both producing similar life results in comparison production testing, and it shows the same level of sensitivity to a change in broach life as compared to a production environment. Though this represents a fairly limited amount of data, the confirmation here between both the wear rate and the change in wear rate between two separate steel conditions demonstrates the accuracy and potential of this test to predict production broach life results.
75

Subtask 2.7: Direct Measurement Application of LUT as Grain Size Sensor The goal of the Direct Measurement subtask was to develop an on-line apparatus to measure grain size in seamless tubes at high temperature using laser ultrasonics. The required measurement accuracy was set to ±0.5 ASTM, which corresponds to about ±10 µm for grain sizes ranging from 15 to 70 µm, and ±20 µm for grain sizes as large as 150 µm. Early in the project, it was decided to take advantage of the laser ultrasonic (LUT) gauge installed at The Timken Company in Canton, Ohio, for measuring on-line the wall thickness of hot (1000 C) fast moving (5 ft/sec) seamless steel tubes. The LUT system was developed in a prior collaboration between Timken and IMI under the co-funding of the DoE support under Award #DE-FC07-99ID13651. In the LUT gauge, generation of ultrasound is performed in the ablation regime by a sufficiently strong laser pulse. The recoil effect following material ejection off the surface oxide layer and plasma pressure produce strong longitudinal wave emission perpendicular to the surface. The ultrasonic waves after reflection by the inner wall of the tube cause a small surface motion typically in the nanometer range (Figure 2.7-1a). Detection uses a second laser with a very stable frequency and intensity and a pulse duration sufficiently long to capture all the ultrasonic echoes of interest, typically 50 μs (Figure 2.7-1b). The ultrasonic surface motion produces a Doppler frequency shift on the scattered light that is demodulated by an interferometer. The capabilities of measuring the tube motion by optical Doppler velocimetry and temperature by infrared emission are also integrated in the system.
-1500
-1000
-500
0
500
1000
1500
0 5 10 15
T ime ( μ s)
Am
plitu
de (a
.u.)
a) b)
Figure 2.7-1. a) Principle of laser-ultrasonic generation and detection in a tube and b) Signal acquired on-line for a 16 mm thick tube at 940 C.
Figure 2.7-2 depicts the laser-ultrasonic system where all delicate equipment (lasers, interferometer, etc.) are housed with other delicate subsystems in the clean, air-conditioned environment of an off-line cabin. The light beams for the three functions (laser-ultrasonics, pyrometry and velocimetry) are transmitted by optical fibers that link them to a front-coupling head located right on the line. For additional mobility of the system, this cabin is mobile and is made from a truck trailer. The inspection head rests upon a mechanical structure designed to hold the inspection head above the tube and to provide laser light shielding.
76

Generation laser
Detection laser Demodulation unit Inspection head
Tube
Umbilical cord
Mobile cabin Calibration box
Figure 2.7-2. Overview of the laser ultrasonic system. The variation of ultrasonic attenuation with grain size is a well-known phenomenon that has been exploited in various cases to measure grain size at room temperature. Prior to the current project, IMI had demonstrated that this concept can be applied successfully for steels in the austenitic phase as a part of the Advanced Process Control research program supported by the AISI and co-funded by the DoE in Award #FC07-93ID13205. Within the current project, this approach was more deeply investigated, resulting in a robust technique for grain size measurement. This was performed by first establishing a calibration curve relating an ultrasonic scattering parameter to grain size measured by metallography for a wide range grain sizes (20 to 300 μm) and temperatures (900 to 1250 C).
Steel samples of different grades were heated in a Gleeble thermo-mechanical simulator to target temperatures, held at the target temperature for about 10 minutes to saturate the grain growth, and cooled to 900 C. During all the thermal cycle, laser ultrasonic measurements were performed and after proper quenching depending on the steel grade. The former austenitic grain boundaries were revealed by etching and the grain size determined by image analysis. Figure 2.7-3 shows an example of a calibration curve, where the ultrasonic scattering parameter “b” is plotted as a function of the grain size obtained by metallography. The scattering parameter “b” is determined from the variation of ultrasonic attenuation with frequency. The effect of the temperature on the calibration due to absorption and scattering mechanisms was also determined experimentally. Prior to using the calibration curve to evaluate grain size from the ultrasonic measurements performed on-line with the LUT gauge, many on-line challenges needed to be addressed. These effects include eccentricity, surface roughness, diffraction, system response, and limited signal-to-noise ratio. The effect of tube eccentricity on the ultrasonic attenuation was determined theoretically and experimentally. It was found negligible for signals averaged over many positions along the circumference of the tube for the small eccentricity values normally found in Timken’s production. A strong effort was devoted to determine the influence of surface roughness. Although some measurements performed at room temperature suggested that surface roughness could affect the grain size evaluation, no such behavior was observed from the analysis of signals collected on-line at high temperature. The conclusion was that if surface roughness has an impact on the grain size value, it is within the measurement accuracy.
77

Diffraction and system response have a major effect on the measured attenuation and a correction which depends on tube thickness and temperature can be made. This correction was determined experimentally from measurements performed off-line in the calibration box of the LUT gauge with tubes of various thickness. In on-line conditions, there are some limitations and one cannot control all the parameters to obtain the optimal signal-to-noise ratio from the measurements. In the current project, the signal-to-noise ratio was dramatically increased by averaging measurements over the length of a tube.
0
0.5
1
1.5
2
2.5
0 100 200 300
Grain size (μm)
Fitte
d pa
ram
eter
: (10
00.b
)1/
2
Figure 2.7-3. Calibration between the fitted attenuation parameter “b”
and the austenitic grain size from metallography. All the development work was integrated in software that runs continuously to acquire and process data, providing grain size values immediately after a tube exits the system. A first version of the software was installed at Timken in March 2003 and minor improvements were brought to it over the last year of the project. Starting in December 2003, a careful monitoring of the software output showed that it is very robust. Various on-line tests were performed, starting with an embryonic version of the software in March 2002 and ending in winter 2004 with a finalized version. Figure 2.7-4 shows the comparison between laser-ultrasonic and metallographic grain sizes for all the on-line tests. Due to the on-line challenges (roughness, diffraction, etc.), the ultrasonic measurements are expected to be less accurate that those performed in the laboratory establishing the calibration. The metallographic values are also less accurate due to the difficulty in applying the proper cooling procedure on tubes in the production environment to allow the decoration of former austenitic grain boundaries. With an estimated metallographic grain size accuracy of between 0.5 and 1 ASTM, a statistical analysis showed that the laser-ultrasonic grain size has at least the same accuracy as that of metallography. Thus, the objective of the project has been met. A system currently installed on #4 Tube Mill at Timken provides on-line estimates of grain size that are reliable and adequately accurate. A decision was made early in the project to use the LUT gauge previously developed for thickness measurements instead of developing a new apparatus. This proved a good decision since not only has the project been successful, but it has also increased the functionality and commercial value of the LUT system previously developed by Timken and IMI developed with DoE financial support. In addition, the single-echo method of attenuation determination is considered novel and provisional patent application No. 11/174,496 entitled “Method and System for Determining Material Properties using Ultrasonic Attenuation” has been filed.
78

0
20
40
60
80
100
120
140
160
180
200
0 20 40 60 80 100 120 140 160 180 200
Metallography Grain Size (um)
Lase
r Ultr
ason
ics
Gra
in S
ize
(um
)
Figure 2.7-4. Grain size measured on-line by the LUT system and
measured by metallography after proper quenching. Laser-Ultrasonics to Monitor Microstructure During the project, Timken and IMI identified many opportunities to use laser-ultrasonics to monitor microstructure evolution at high temperature. Some of these were investigated with the aim of developing laboratory tools and, in some cases, on-line tools. The technique developed to monitor austenitic grain size does not only apply to on-line measurements but it is also a very powerful tool for grain size measurements in the laboratory. Compared to conventional metallographic technique, the main advantages of this technology are as follows:
• Real-time grain growth monitoring (grain size evolution in one sample instead of quenching various samples at different stages of grain growth);
• Use of a technique where metallography cannot reveal prior austenitic grain size (e.g., IF steels). The use of this technology thus saves time and money when characterizing new steel grades or when investigating the influence of a previous thermo-mechanical treatment. In the current project, the technique was successfully applied to characterize grain growth of samples from a laboratory heat of steel grade series 207x under thermal cycles applied in the Gleeble thermo-mechanical simulator.
The decomposition of austenite into more stable carbon-iron compounds (ferrite, pearlite, bainite, etc.) during cooling is of prime technological importance since this phase transformation determines to a large extent the microstructure and, consequently, the properties of steels. Previous work at IMI had shown that ultrasound velocity and attenuation were parameters that can vary considerably during austenite decomposition. Although the change in the velocity was stated to be directly correlated to the transformed fraction, quantitative demonstration had not been accomplished yet.
79

In the current project, this subject was revisited. Ultrasonic velocity measurements of the decomposed austenite fractions for 1074 and 5130 steel grades showed a very good agreement with those of dilatometry. Laser-ultrasonics, as a remote all-optical and non-destructive technique, could thus be applied in harsh industrial environment to allow the on-line monitoring of austenite decomposition. LUT Configuration for Gleeble System Figure 2.7-5 shows schematically the configuration of the proposed system, which consists essentially of two units, a Laser Ultrasonic Head and a Control Rack. The laser Ultrasonic Head houses the generation laser and is attached to the Gleeble. The Control Rack contains the detection laser, the interferometer, power supplies, the data acquisition unit and other accessory devices. An umbilical cord containing fiber optics, cooling water tubing and electrical cables connects the two units. In a fully developed commercial system, the laser Ultrasonic Head will be enclosed in a box and carefully attached to the Gleeble to avoid any laser light leakage. This configuration will provide a Class I laser hazard classification and consequently protective laser glasses should not be necessary for normal operation of the system.
Figure 2.7-5. Schematic description of the system proposed by IMI.
Generation laser
Low cost detection laser
Power supply 1
Power supply 2
Photorefractive interferometer
Computer
Gleeble
Laser-Ultrasonic Head
Control Rack
Water cooling
Interlock control
optical fibers
Umbilical cord
sample
dichroic
quarter wave
80

Details of each component of the system are given below. Laser Ultrasonic Head
• Generation laser: Compact commercial Nd:YAG with harmonic generator to double the optical frequency (green: 532nm). Big Sky CFR400.
• Optical components and layout: Classical setup used at IMI for laser-ultrasonics with generation and detection on the same side (Figure 2.7-1).
Control Rack
• Detection laser: Compact, novel and low cost pulsed Nd:YAG operating at its fundamental frequency (1064nm) with peak power of about 1KW. Such a laser has been tested at IMI in the last months and could be offered independently for licensing.
• Interferometer: GaAs photorefractive interferometer (patented and IMI proprietary) with strong pumping to shorten the response time and probe thinner samples that are more affected by vibrations induced by the generation laser impulse (generation is expected to be in the ablation regime).
• Acquisition unit + computer: Two acquisition cards (one for Gleeble parameters and other for ultrasonic signals) and computer. Basic software to control the system components and display/save raw ultrasonic signals should be included.
• Power supplies and cooling system: Based on the requirements of the generation and detection lasers.
• Interlock control: To assure the security of personnel operating the system, an interlock system should prevent firing the lasers if the Laser Ultrasonic Head or the Gleeble doors are open.
81

Subtask 2.8: Controls The control subtask consisted of effort in four major areas:
• Analyzing and understanding complexities of CTMP in the tube making processes characterized by developing but incomplete first-principles numerical models;
• Developing readily understandable graphical user interfaces for these processes; • Representing such systems with neural networks and other mathematical techniques; • Applying advanced control theory and algorithmic approaches to tube making industrial control
situations. Because of the changing nature of the economic picture most of the work performed was centered on the first two of these areas, with some feasibility studies in the third and the fourth.
The INEEL’s technical background in the control of welding processes, and more particularly in the control of the cupola melting process, led to its inclusion as a partner in the CTMP task. The ORNL had supervisory control systems experience in the area of liquid metal reactor. Both of the skill sets were ideal to fit the CTMP project.
The following descriptions represent the major technical accomplishments in the control systems efforts of the CTMP project. The examples typically represent a much larger body of work with similar and more detailed calculations. Most of the efforts used the TOM or it components to understand, evaluate and develop control recipes process while concentrating on activities related to the accelerated cooling and slow cooling. Included in these efforts were the resulting effects on the tube mill processes, and the application of those models to control algorithm simulations including the quantification of heat transfer on tube end effects. Part of this work involved developing an interface for running the model (once or multiple times) and quickly presenting the results in an intelligible form with user graphical interfaces. An example this was developing temperature profiles and grain size histories for the ID, midwall, and OD for a multitude of recipe possibilities. Another key effort was developing neural net representation of quench station. An “inverse model” was developed for particular quench combinations using multiple runs of the Accelerated Cooling Model. Given the temperature parameters of the entering tube and a desired temperature change to be produced by quenching, this model gave the appropriate tube speed through the quench zone to achieve it. The trained net was a relatively simple set of operations that could easily be implemented in any language. A rapid non-linear calculation such as this can be used as an open-loop controller within an industrial setting. An interactive version was demonstrated at a DoE review in Canton in December 2000. Efforts were also centered on developing a grain size control station from the elongator through the final cooling. Austenite grain size is an important metallurgical quantity that determines the type and transformation rate of subsequent microstructures resulting from austenite decomposition under various thermal regimes. The basic engine was a grain growth equation derived from the TOM, coded into evolving spreadsheet models. The grain size control station consisted of fast running models so that the control station could either be run off line or as a part of a real time supervisory control system to be used in actual production. To obtain the fast model speed for the elongator, advanced radial basis functions were developed from thousands of elongator model runs as a very fast alternative to the slower running FE models in the TOM. The other components of the grain size station used the fast running FE models in the TOM for air cooling, the reducing mill, and final rapid or CSC.
82
As a part of this grain size station, the real time tube mill database entries were needed to populate appropriate fields in the grain size station. A user graphical representation of one of the tube mills was prepared as an element of the controller interfaces suitable for plant operator use. Upon selecting an order, piece, release, heat, and piece number, a module within accessed the tube mill database files to provide the data for graphical processing. Because of changes in work scope, this was not further pursued, but the underlying programming information was made available. Post-elongation quench exploration was also conducted through an extensive series of model runs conducted to determine the evolution of microstructures immediately after the elongator. Because of the severe hot working in this device, dynamic recrystallization occurs and provides the primary basis for the tube’s final microstructure. Subsequent tube operations involve far less deformation and rely mainly on thermal cycles for final microstructure. Various quench geometries were modeled prior to conducting experimental trials. Applying quenches in this location is difficult mechanically because of the tube clearances required for the elongator’s drive mechanisms and the difficulties in removing expended quench water. A control system was sketched out as a first step in considering this arrangement. The metallurgical challenge with the arrangement is to apply sufficient quenching to obtain the desired grain size uniformly across the tube wall. The alternatives do avoid grain growth but at the cost of added wear to machinery and added risk of equipment failures and breakage. Another area of development focused on the final cooling. An important aspect of the economics and energy use patterns of tube production is the final cooling process which depends on the choice of either slow cooling, hot bed cooling, or a mill anneal furnace to achieve adequately the desired end microstructure. To achieve desired microstructures with minimal energy input in this area, a series of quench operations was explored. By the time this operation was considered, the Synaps optimization engine, EpogyTM, had been incorporated into TOM. Although its operation was not seamless, ORNL and INEEL teamed up to explore countless optimization runs to optimize the final cooling for a variety of process recipes and the background for installation a working industrial control system for implementation in Timken’s tube mills. In advanced stages of the optimization of specific CTMP recipes, both INEEL and ORNL personnel extensively considered a cost function in light of proposed CTMP processing hardware and procedures. The details of these are close to the heart of business decisions in revealing actual operating costs; moreover, even their general form reveals aspects of the overall business structure. The basic idea, however, was to quantify, as much as possible, the overall costs of producing tubes including roll wear, rework, and the cost of scrap along with the ability to robustly obtain the ideal microstructure. Thus, there were probabilistic as well as deterministic elements to the cost functions that were developed to minimize the inclusive cost function.
83

TASK 3
Pilot Plant
Task 3: Pilot Plant A pilot plant was to be constructed in parallel to an existing tubing production line at Timken's #4 Piercing Mill and was to be fed from the existing reheat furnace and piercer. The plan was to run the pilot with only little disruption to normal mill production. The plant tentatively included a new-concept planetary elongator - a Kocks Rolling Mill (KRM), extracting mill stands, cooling and reheating devices, a reducing mill, a Precision Sizing Mill (PSM) and cooling device. The decision to construct a pilot plant as a parallel process line in a Timken tube mill was rescinded early in the project. As noted, the capability to study alternate processed and equipment configurations was built into the VPP. This feature should make the TOM a more attractive tool to other tube makers.
TASK 4
Plant Trials
Task 4: Pilot Plant Trials The pilot plant was to be the site of equipment and control development, as well as sensor testing and test specimen generation. Trials of the various CTMP processes will be conducted for selected grades.
As explained, efforts to install full-scale, production equipment for CTMP concept demonstration were curtailed due to economic conditions. In some cases, trials were conducted using the VPP in lieu of full-scale plant trials. For example complete process recipes for bearing and automotive grades were optimized using the EpogyTM feature within TOM. For the bearing steel, critical ranges of operational conditions were evaluated around the recipe through a parametric study using TOM. For a few validation cases, the optimized recipes were demonstrated on the mills by conducting experiments. Both the rapid and slow cooling system equipment were thoroughly investigated and evaluated via expert consultation and physical testing. Rapid cooling equipment was designed, demonstrated, and validated while investigating new process recipes. Designs for renovating existing slow cooling chambers were created from detailed specifications resulting for process recipe requirements. Specifications for conceptual designs for advanced equipment to demonstrate the AFC recipes were detailed based on the TOM optimizations. Methods to control dynamically the new equipment to meet the process specifications were then logically and mathematically formulated by INEEL. Those specifications are ready for incorporation into machine code should such equipment be commissioned.
84

TASK 5
Robotically Enhanced Manufacturing Line The Robotically Enhanced Manufacturing Line (REML) task was proposed based upon preliminary research performed at The Timken Company that indicated substantial opportunities for energy reduction, productivity improvements and environmental impact improvements through application of robotics and advanced manufacturing theories. Robotic technology was proposed to remove repetitive manual labor, but it is also a key enabler in implementing alternative heating concepts that can be used on demand. Those batch or piece-heating processes offer potential cost and energy savings when compared to conventional gas and electric furnaces that must be run in 24 hours a day, 7 days a week. In addition, the robotic development was planned to investigate opportunities to reduce cost and save energy by advancing the area of “lightweight robotics.” Timken planned to pursue precise location positioning in the preliminary evaluation to demonstrate that lightweight robotics could be applied leading to energy savings through use of smaller electric motors. Timken also agreed to cooperate with the DoE in sponsoring and participating in the appropriate showcase or workshop to debate the subject of the use of lightweight robotics in metal processing. In the initial project year, subtasks were undertaken to acquire the major assets of the manufacturing line and to overcome technology constraints associated with robotic and environmental issues of the advanced line. The latter included optimization studies through discrete event simulation modeling that would be used in developing specifications for secondary and support assets. Preliminary studies of potential energy savings were conducted to quantify the potential improvements. In addition, studies to address gauging of product’s dimensional and material characteristics, and the performance of the material handling, maintenance and environmental containment assets were conducted. Subtask 5.0: Order and Delivery of Equipment The following assets have been acquired and installed in cells in a manufacturing line configuration. Green Cell Saw A CNC band saw cuts Timken steel tubes into slugs. Slugs are washed at the saw to remove chips. Initial blade tests were conducted to select commercial blades (type, pitch, coatings), which offer acceptable cutting performance (in-specification length and face squareness) and life, which minimizes burrs. Ring Roller The Ring Roller cold rolls a small family of tube slug sizes into a large family of different sizes of rectangular, cross section blanks. A range set mandrels are used in conjunction with one king roll to achieve the desired expansion. A post-roll wash removes the heavy rolling oil and cools the part. Initial testing has been conducted to obtain a preliminary understanding of the maximum expansion rates of high carbon and low carbon bearing steels and the process sensitivity to incoming variation in length, ID, OD and out-of-round. Chucker A dual-spindle, CNC turning lathe with swing arm robot machines the blanks into green inner and outer tapered roller bearing races. Inner races are called cones, outer races are called cups. Tooling and work holding for the lathe have been designed and fabricated.
85

Thermal Treatment Cell Rapid Carburizer Process concepts are being evaluated for case carburizable grades of bearing steel, but no commercial rapid carburizing system for high carbon steels is presently available to be ordered. Flexible Induction Heater An induction coil and power supply heat the cones and cups prior to being loaded into the hardening press. Range work holding for the heater has been designed and fabricated. Flexible Hardening Press The press applies a controlled thrust force to the cone or cup which is fixtured between a lower die and an upper die. Quench oil is pumped to the inside and outside of the part according to a prescribed recipe until the part is cooled to a prescribed temperature. A range set of dies are used. Post-Harden Washer A pass-through, conveyorized aqueous washer provides a secondary quench and removes the quench oil then dries the cone or cup. Flexible Induction Heater for Temper An induction coil and power supply heat the cones and cups to a temper temperature. Post Temper Washer A pass-through, conveyorized aqueous washer provides post-temper quench and dries the cone or cup for downstream NDE inspection or CMM gauging. Flexible Non Destructive Evaluation Eddy current sensors and signal processing software are employed to inspect inside and outside surfaces of cones and cups for surface defects (cracks) which may have arisen as a result of cold working or thermal treatment. The unit may also perform a non-destructive, sub-surface hardness or microstructure assurance check. Medium Accuracy Coordinate Measuring Machine A commercial, medium accuracy coordinate measuring machine (CMM) measures the diameters, length, and taper angle of cones and cups as they enter, are processed within, and prior to exiting the thermal treatment cell. The temperature control enclosure for the CMM was upgraded for improved cooling capacity and tighter temperature control. Initial testing has been conducted to select optimum scan velocities and point densities. Formal repeatability and reproducibility testing was conducted to confirm the CMM’s capability for the required measurements. Timken engineers collaborated with the CMM vendor to design an interface with the thermal treatment cell gantry robot. Conventional Gantry Robot An overhead rail-mounted, six-axis, electric servo-driven articulated gantry robot which loads and unloads all the assets within the thermal treatment cell. Other features include an underslung configuration for symmetrical work envelope and automatic end of arm tool (gripper) change. Included are a ranged set of grippers for handling hot and / or wet cones and cups and a different set of customized grippers for handling room temperature and clean cones and cups. Timken engineers have undergone detailed training on programming the robotic motion. They have performed simulations to minimize the potential for inadvertent, corner-rounding collisions.
86

Finish Cell Flexible Face Finisher A CNC machine tool finish machines at least one face of the cone or cup in a single pass. Flexible Finisher A CNC machine tool finish machines the IDs and ODs of the cone and cups including the bearing raceways. This machine also superfinishes the raceways of the cones and cups. High Accuracy Flexible Measuring Machine A commercial, high accuracy CMM measures the diameters, length, taper angle, profile, and out-of-round of cones and cups as they are processed within and prior to exiting the finishing cell. This measuring machine has been modified to incorporate a rotary axis, Timken proprietary high performance probes, a Timken proprietary automatic part centering device, and Timken proprietary machine control software and measurement analysis software. A custom designed temperature environmental control enclosure precisely regulates the temperature and humidity of the measuring machine and the cones and cups being measured. The measurement performance and axes metrology of the measuring machine has been documented. Flexible Surface Inspection An end-of-line, camera based system inspects all finished machined surfaces. De-Magnetization Station This station removes residual magnetism from cone or cup prior to finish wash. Finish Washer and Temperature Normalizer A custom ultrasonic washer with spin blow off removes contamination on the cone or cup to within corporate dirt count specification, normalizes the cone or cup to 68 F, and applies thin film rust inhibitor. The cone or cup is prepared for end-of-line surface inspection or high accuracy dimensional measurement. High-Speed, High Positioning Accuracy Gantry Robot A lightweight, high-speed, high-placement accuracy gantry robot loads and unloads all the assets within the finish cell.
87

Subtask 5.1: Energy Savings Model Task An initial evaluation of potential energy savings from employing the new REML line was made by comparing the energy consumed in green machining, heat treating and finishing a sample batch of parts. That study was conducted using metered measurements of motors and heating coils. The results in relative and normalized energy units (Figure 5-1) showed that while the sum of energy in green and finish were in total nearly equal between the baseline and new process, the 25% reduction in heat treating made the REML process overall that 25% less energy intensive.
Green Heat Treat Finish TOTAL
REML
Base Line
Green Heat Treat Finish TOTAL
REML
Base Line
Figure 5-1. Comparison of energy consumption of REML line versus current process baseline. Subtask 5.2: Tube Optimization Model (TOM) Task Timken high carbon, 52100 steel tubes which have been spheriodized annealed are the source material for the REML line. A fully-spheriodized microstructure is essential to the performance of the cold ring rolling process and to other downstream processes in REML. The T-ESA process, and D-ESA when implemented inline, will be applied to REML tubes. Each of the critical REML processes will undergo screening DoX to identify factors that are important to the desired product responses for that process. After those factors are established, the capabilities of the TOM will be employed to optimize material conditions for the best overall performance of the REML processes. In a manner similar to that described in Subtask 2.6, the TOM will predict material for the best compromise of minimum product distortion during thermal treatment and maximum green and finish machining tool life. The FE modeling (DEFORMTM2-D deformation) will be used to predict product microstructure and distortion as a result from cold rolling and thermal treatment as a function of material and metallurgical properties.
88

REFERENCES
Introduction: 0. Energy Intensity of Major Steelmaking Unit Operations for Use with DoE’s Steel Project
Analysis Tool.
Subtask 2.2: 1. Recrystallization and Related Annealing Phenomena, F.J. Humphreys and M. Hatherly,
Pergamon Press, 1995, pp 284.). 2. A. Laasraoui and J.J. Jonas, Met. Trans., 22A, 1991, pp 151 -- ref. 2.] P.D. Hodgson,
“Mathematical Modeling of Recrystallization Processes During the Hot Rolling of Steels”, Ph.D. Thesis, Univ. Queensland, 1993).
3. H.L. Andrade, M.G. Akben and J.J. Jonas, Met. Trans. 14A, 1983, p1967). 4. Miodownik et al., Scripta Mater. 42 (2000) 1172.3-1177.) 5. A Laasraoui and J.J. Jonas, Met. Trans., 22A, 1991, p1545). 6. D. J. Bammann, Appl. Mech. Rev.,1990, 43, 5, 2, 312 – 319) 7. Kirkaldy et al at McMasters University 8. R.C. Reed and J.H. Root, Scripta Materialia, 1998. 38(1): p. 92.5-99. 9. M. Onink, et al., Scripta Metallurgica et Materialia, 1993. 29(8): p. 1011-101 10. L. Cheng, et al., Metallurgical Transactions A, 1988. 19A(Oct): p. 2412.5-2426 11. Heat Treaters Guide
Subtask 2.6:
12. Kubel, Edward Jr., Editorial – “Industrial Ecology 101,” Industrial Heating, August 2005, p. 16.
89