controlling laser high-order harmonic generation using
TRANSCRIPT
Brigham Young University Brigham Young University
BYU ScholarsArchive BYU ScholarsArchive
Theses and Dissertations
2002-12-16
Controlling Laser High-Order Harmonic Generation Using Weak Controlling Laser High-Order Harmonic Generation Using Weak
Counter-Propagating Light Counter-Propagating Light
Sergei Leonidovich Voronov Brigham Young University - Provo
Follow this and additional works at: https://scholarsarchive.byu.edu/etd
Part of the Astrophysics and Astronomy Commons, and the Physics Commons
BYU ScholarsArchive Citation BYU ScholarsArchive Citation Voronov, Sergei Leonidovich, "Controlling Laser High-Order Harmonic Generation Using Weak Counter-Propagating Light" (2002). Theses and Dissertations. 49. https://scholarsarchive.byu.edu/etd/49
This Dissertation is brought to you for free and open access by BYU ScholarsArchive. It has been accepted for inclusion in Theses and Dissertations by an authorized administrator of BYU ScholarsArchive. For more information, please contact [email protected], [email protected].

CONTROLLING LASER HIGH-ORDER HARMONIC GENERATION
USING WEAK COUNTER-PROPAGATING LIGHT
by
Sergei L. Voronov
A dissertation submitted to the faculty of
Brigham Young University
in partial fulfillment of the requirements for the degree of
Doctor of Philosophy
Department of Physics and Astronomy
Brigham Young University
April 2003
BRIGHAM YOUNG UNIVERSITY
GRADUATE COMMITTEE APROVAL
of a dissertation submitted by
Sergei L. Voronov
This dissertation has been read by each member of the following graduate committee andby majority vote has been found to be satisfactory.
Date Justin B. Peatross, Chair
Date R. Steven Turley
Date Ross L. Spencer
Date Harold T. Stokes
Date Bret C. Hess
BRIGHAM YOUNG UNIVERSITY
As chair of the candidate's committee, I have read the dissertation of Sergei L. Voronovin its final form and have found that (1) its format, citations, and bibliographical style areconsistent and acceptable and fulfill university and department style requirements; (2) itsillustrative materials including figures, tables, and charts are in place; and (3) the finalmanuscript is satisfactory to the graduate committee and is ready for submission to theuniversity library.
Date Justin B. Peatross, Chair Graduate Committee
Accepted for the Department
R. Steven Turley, Chair Department of Physics and Astronomy
Accepted for the College
G. Rex Bryce, Associate Dean College of Physical and Mathematical Sciences

ABSTRACT
CONTROLLING LASER HIGH-ORDER HARMONIC GENERATION
USING WEAK COUNTER-PROPAGATING LIGHT
Sergei L. Voronov
Department of Physics and Astronomy
Doctor of Philosophy
Laser high-order harmonic generation in the presence of relatively weak
interfering light is investigated. The interfering pulses intersect the primary harmonic-
generating laser pulse at the laser focus. The interfering light creates a standing intensity
and phase modulation on the field, which disrupts microscopic phase matching and shuts
down local high harmonic production. Suppression of the 23rd harmonic (by two orders of
magnitude) is observed when a counter-propagating interfering pulse of light is
introduced. A sequence of counter-propagating pulses can be used to shut down harmonic
production in out-of-phase zones of the generating volume to achieve quasi phase
matching. Harmonic emission is enhanced in this case.
A new high-power laser system with higher pulse energy has been constructed to
further investigate quasi phase matching of high-order harmonics generated in difficult-
to-ionize atomic gases (e.g., neon as opposed to argon). The new system can also be used

to study harmonic generation in ions. A new counter-propagating beam produces a train
of 5 pulses with regulated timing. In preliminary tests, the new system has produced high
harmonics up to the 65th order in neon. This should increase with additional adjustments
to the laser system. The high-order harmonics have also demonstrated to be useful for
polarized reflectometry measurements of optical surfaces in the extreme ultraviolet
(EUV) wavelength range.
ACKNOWLEDGMENTS
I would thank my advisor Dr. Justin B. Peatross for his support, encouragement,
and teaching. Thanks to those in our research group for their support and help. Thanks to
the members of my graduation committee for discussing my dissertation. I wish to thank
my parents for teaching me the principles that finally helped me reach the goals. I want to
thank my beautiful wife, Julia, for being loving, patient, and supportive during all the
years I devoted to the study. I would like to thank my children Anton, Victoria, and Sofia
for their love and understanding.
vii
PUBLICATIONS
1. J.B. Madsen, L.A. Hancock, S.L. Voronov, and J. Peatross, “High-Order Harmonic
Generation in Crossed Laser Beams," J. Opt. Soc. Am. B 20, 166 (2003).
2. S.L. Voronov, I. Kohl, J.B. Madsen, N. Terry, J. Titensor, Q. Wang, and J. Peatross,
"Control of Laser High Harmonic Generation with Counter-Propagating Light," Phys.
Rev. Lett. 87, 133902 (2001).
3. J. Peatross, S. Voronov, and I. Prokopovich, "Selective Zoning of High-Harmonic
Emission Using Counter-Propagating Light," Optics Express, Vol.1, No.5 (1997).

viii
CURRICULUM VITAE
The author was born in Ukraine on March 11, 1966. He attended Tomsk State
University, Russia, from 1983 to 1991, and graduated with a Master of Science degree in
Optics and Photonics. He came to Brigham Young University in fall of 1996 and began
graduate studies in the Department of Physics and Astronomy. His research work was
performed under the direction of Professor Justin B. Peatross.

ix
TABLE OF CONTENTS
LIST OF FIGURES xiii
LIST OF TABLES xvii
CHAPTER 1
PRINCIPLES OF HIGH HARMONIC GENERATION 1
1.1 INTRODUCTION TO HIGH-ORDER HARMONICS 1
1.2 HARMONIC GENERATION AT THE ATOMIC LEVEL 6
1.3 CLASSICAL AND QUANTUM MODELS FOR HIGH HARMONIC
GENERATION 14
A. Classical model 14
B. Quantum model 20
1.4 PHASE MISMATCHES IN HIGH HARMONIC GENERATION 21
A. Plasma phase mismatches 24
B. Geometrical phase mismatches 26
C. Intensity-dependent phase mismatches 27
1.5 PHASE-MATCHING IN HIGH HARMONIC GENERATION 28
CHAPTER 2
QUASI PHASE MATCHING WITH WEAK INTERFERING LIGHT 33
2.1 INTRODUCTION 33

x
2.2 MICROSCOPIC PHASE DISRUPTION IN SUPERIMPOSED COUNTER-
PROPAGATING FIELDS 36
CHAPTER 3
EXPERIMENTS ON HIGH HARMONIC GENERATION IN
INTERFERING LIGHT 43
3.1 LASER SYSTEM 43
3.2 HARMONICS PRODUCTION AND DETECTION SETUPS 47
3.3. LASER SYSTEM ANOMALIES 54
3.4 CONTROL OF LASER HIGH HARMONIC GENERATION 56
3.5 HIGH-ORDER HARMONIC GENERATION IN
CROSSED LASER BEAMS 60
3.6 CONCLUSION 61
CHAPTER 4
DEVELOPMENT OF COMPACT EXTREME ULTRAVIOLET
REFLECTOMETER 63
4.1 INTRODUCTION 63
4.2 HIGH-ORDER HARMONICS AS A SOURCE OF POLARIZED
EUV LIGHT 65
4.3 REFLECTOMETER SETUP 68
4.4 CONCLUSION 72
xi
CHAPTER 5
CONSTRUCTION OF HIGHER-POWER LASER SYSTEM 75
5.1 INTRODUCTION 75
5.2 CHIRPED PULSE AMPLIFICATION 76
A. Chirped pulse amplification with Ti:Sapphire 76
B. Stretcher 78
C. Compressor 80
5.3 COUNTER-PROPAGATING TRAIN OF PULSES SOLUTION 81
5.4 LASER SYSTEM LAYOUT AND CHARACTERISTICS 83
5.5 PULSE COMPRESSION 99
A. Overview of pulse compression chamber and experimental setup 99
B. Compressor 101
C. Auto- and cross-correlation 103
5.6 SUMMARY OF LASER SYSTEM 106
CHAPTER 6
EXPERIMENTAL RESULTS 109
6.1 SUPPRESSION OF HARMONICS AND SEARCH FOR HARMONICS
ENHANCEMENT 109
A. Limitations of former experimental setup designs 109
B. Experimental setup 111
6.2 PRELIMINARY EXPERIMENTAL RESULTS 117

xii
6.3 HIGH-ORDER HARMONIC GENERATION IN COLLIDING PULSES 123
6.4 INTERPRETATION OF EXPERIMENTAL RESULTS 124
REFERENCES 127
APPENDIX 139
A1. Auto- and cross-correlation techniques 139
A2. Timing sequencing in the system 140
xiii
LIST OF FIGURES
Fig. 1.1 Typical setup for producing laser high-order harmonics in gas. 4
Fig. 1.2 A schematic representation of high harmonic emission cut-off seen in
krypton, argon, and helium noble gases (taken from Ref.[7]). 8
Fig. 1.3 One-dimensional atomic potential well (solid line) and applied electric
potential (dashed line). 9
Fig. 1.4 Potential of an atom, which is distorted in a strong laser field at an instant
in time. 10
Fig. 1.5 Escape of an electron from the atom. 15
Fig. 1.6 Return of an electron to the atomic center, positioned at x=0. 16
Fig. 1.7 Maximum electron kinetic energy of 3.17Up occurs for f=-17∞. 17
Fig. 1.8 A particular harmonic produced from gas atoms at different locations in
the laser focus. 23
Fig. 1.9 Harmonic light is phase-matched only at a few positions in the laser
focus. 23
Fig. 2.1 Modulated gas density distribution to eliminate harmonic emission from
regions with undesirable phase. 33
Fig. 2.2 Elimination of harmonic production in (a) the “out-of-phase” regions
using (b) a train of counter-propagating pulses. 34
Fig. 2.3 Schematic of experiment on colliding beams. 35
Fig. 2.4 Standing intensity and phase variations resulting when a plane wave is
met by a counter-propagating plane wave one hundredth as intense. 38

xiv
Fig. 2.5 Accumulated harmonic field produced in an interval of half wavelength
and exiting this interval at time t. 39
Fig. 2.6 The effective emission from a microscopic phase-matching interval for
11th, 31st, and 51st harmonics as a function of relative counter-propagating field
strength. 40
Fig. 3.1 Block-diagram of the laser setup. 43
Fig. 3.2 Laser system schematic. 44
Fig. 3.3 Compression, harmonic generation (interaction), and detection
chambers. 48
Fig. 3.4 Focal measurements of the (a) forward-propagating beam and
(b) the counter-propagating beam. 49
Fig. 3.5 Appearance of the excess Rayleigh scattering (a bright dot) of the two
focused compressed beams in the chamber back-filled with atmospheric pressure
air. 51
Fig. 3.6 Harmonic signal as a function of counter-propagating pulse delay
with a narrow gas distribution. 57
Fig. 3.7 Harmonic signal as a function of counter-propagating pulse delay with a
wide gas distribution. 60
Fig. 4.1 High harmonics are generated in a jet of argon gas in a vacuum
chamber. 65
Fig. 4.2 EUV grating calibration showing similar response for either s- or
p-polarized light for the harmonic orders 13-29. 67
Fig. 4.3 Reflectometer setup. 68

xv
Fig. 4.4 Reflected from both wafers, the EUV signals are simultaneously
resolved using a focusing diffraction grating. 69
Fig. 4.5 S-polarized high harmonics registered on the MCP after being reflected
simultaneously from the “sample” (upper) and the “reference” (lower) wafers. 70
Fig. 4.6 S- and p-polarized high harmonic signals reflected at 45-degrees angle
from (a) the “reference” wafer and (b) the “sample” wafer. 71
Fig. 4.7 Harmonic signal reflected from the sample and reference surfaces as
a function of gas pressure. 72
Fig. 5.1 Diagram of an amplifier system based on chirped-pulse amplification. 77
Fig. 5.2 Design of a traditional stretcher. 78
Fig. 5.3 All reflective, single-grating stretcher design. 79
Fig. 5.4 Schematic of the grating compressor setup. 81
Fig. 5.5 Elimination of harmonic production (harmonic order in the upper
thirties) in the “out-of-phase” regions using a train of counter-propagating pulses
created by removing spectral regions of a chirped pulse. 82
Fig. 5.6 Block-diagram of new laser system. 84
Fig. 5.7 New laser setup. 84
Fig. 5.8 Measured spectrum of the K-M Labs “MTS” femtosecond oscillator. 85
Fig. 5.9 Pulse picker system (side view). 87
Fig. 5.10 Triangle-type multi-pass Chirped Pulse Amplifier stage #1 (top view). 88
Fig. 5.11 Aperture array AA (side view). 89
Fig. 5.12 The observed beam profile from the triangle amplifier in the case of (a) no
aperture array and (b) an aperture array with optimized hole diameter. 90

xvi
Fig. 5.13 Side view of the beam isolator setup. 93
Fig. 5.14 The stage creating the counter-propagating train of pulses. 95
Fig. 5.15 The second amplification stage (side view). 96
Fig. 5.16 Measured spectrum of the forward beam on exit from the second
amplification stage. 98
Fig. 5.17 Pulse compression chamber (left) and overview of the experimental
setup (right). 100
Fig. 5.18 Compressor setup. 102
Fig. 5.19 Auto- and cross-correlation setup. 104
Fig. 6.1 Experimental setup. 112
Fig. 6.2 The misaligned foci (a) in air-filled chamber so that (b) under vacuum
they align. 113
Fig. 6.3 The nozzle end-piece eroded (notched) during preliminary experiments. 116
Fig. 6.4 Snap-shot of the CCD camera 2 image; the height of the peaks shows the
relative brightness (arb. units) of the harmonics produced in neon gas. 118
Fig. 6.5 Train of five short counter-propagating pulses colliding with the forward
pulse in air (atmospheric pressure). 119
Fig. 6.6 Superposition of the total of five individual snap-shots of short counter-
propagating pulses (number 1 through 5) colliding with the short forward pulse in
air shows relative brightness of collision dots. 121
Fig. 6.7 Emission of the 39th harmonic produced in neon is suppressed with a weak
counter-propagating pulse of light. 123
xvii
LIST OF TABLES
Table 1.1 Ionization potentials in eV for neutrals and ions for the noble gases. 12
Table 1.2 Ionization intensities for some neutral noble gases and their ionization
state I. 13
Table 1.3 Maximum available harmonic orders for some neutral and singly
ionized noble gases. 18

1
CHAPTER 1
PRINCIPLES OF HIGH HARMONIC GENERATION
1.1 INTRODUCTION TO HIGH-ORDER HARMONICS
Lasers capable of generating terawatt peak powers with pulse durations on the
order of few tens of femtoseconds, or even shorter, are now routinely available in small-
scale laboratories. Such lasers are capable of generating light intensities corresponding to
electric fields that easily exceed the fields binding valence electrons to atoms [1].
Electrons that experience these extreme conditions can radiate high-order harmonics of
the stimulating laser field. Over the past decade, there has been much interest in the
process of high-order harmonic generation because of many potential applications in
science and technology [2,3].
P.A. Franken et al. at the University of Michigan [4] reported the first observation
of harmonic generation in 1961. This was soon after the invention of the laser itself
(1960) and represents the first experiment in non-linear optics. They used a pulsed ruby
laser that produced electric field strength 105 V/cm (wavelength 694.2 nm, pulse energy
3-joule, millisecond duration). When the laser light was focused into a non-isotropic
material such as quartz, the second harmonic was emitted at 347.2 nm. The efficiency of
converting the laser energy into the second harmonic was only a small fraction of a
percent.
Since that time, non-linear frequency-conversion techniques have typically relied
on crystalline solids as nonlinear media. For efficient conversion, the electromagnetic
waves corresponding to the driving and the generated signal must be phase-matched.

2
That is, the fundamental and the harmonic must have the same phase velocity as they
travel through the generating medium. In this case, the nonlinear polarization (described
in section 1.2) adds coherently as the waves co-propagate, resulting in a quadratic
increase in the signal intensity. Phase matching has generally been achieved in
birefringent materials with carefully chosen field polarization orientations, so that the
light of the fundamental and the harmonic frequencies travel with the same speed in the
material. Otherwise, the harmonic light produced up- and down-stream do not join in
phase.
The reliance on solid materials limits the application of nonlinear optical
techniques to wavelengths around 200 nm or longer [5]. In order to study high-order
harmonics, which have much shorter wavelengths, very high laser intensities must be
used. Solid materials are not suitable for this not only because they are opaque in the
extreme ultraviolet (EUV) range, but they also are unable to withstand the relatively high
intensities required for high-order processes. In contrast, many gases are transparent well
into EUV spectrum. Light at these shorter wavelengths propagates with only moderate
absorption in low-pressure gases. In addition, gases are “self-healing” which means that
extreme intensities can be used. However, because gases are isotropic, established phase-
matching techniques cannot be used, and thus, phase-matched frequency conversion
techniques are not well developed for the EUV and soft x-ray regions of the spectrum.
For many years, only second through fifth harmonics were studied. However, in
1987 McPherson et al. [6] from the University of Illinois at Chicago observed harmonics
as high as the seventeenth order produced in neon gas. Their ultraviolet (248-nm) laser
had the maximum pulse energy of 20mJ and pulse duration of 350 femtoseconds, creating

3
1015-1016 W/cm2 focused intensity. Since then, many other researchers have studied High-
Order Harmonic Generation (HHG) in an effort to achieve the highest possible
conversion efficiency and maximum available order, using a variety of wavelengths,
pulse durations, focused intensities and different gases to generate high harmonics. Anne
L’Hullier et al. [7] studied high harmonic generation using a 1-picosecond Nd:Glass laser
with wavelength 1.054 microns. They observed the 29th harmonic in Xe, the 57th in Ar,
and at least up to the 135th harmonic in Ne. They also investigated the influence of gas
density and focal geometry on the conversion efficiency. Macklin et al. observed
harmonics up to the 109th order using 125 fs, 806 nm pulses in neon [8]. Preston et al.
obtained the 37th order of a 380 fs, 248 nm KrF laser from helium ions [9].
The highly nonlinear nature of the ionization process makes it possible to generate
and detect harmonics up to several hundred orders, which correspond to wavelengths
below 3 nm. Z. Chang et al. [10] reported such harmonics using 26 fs, 20 mJ, 800 nm
laser pulses with 1015 W/cm2 intensity at the focus. The pulse duration of the harmonics
they produced is expected to be less than 3 fs, since the high-harmonic emission is
believed to occur on the rising edge of the 26 fs pulses. At very short pulse durations, the
combination of enhanced single-atom harmonic response and the tendency for reduced
phase mismatches can lead to relatively efficient production of sub-femtosecond
(attosecond) x-ray pulses, the output being 100 times brighter for 5 fs laser pulses than
for 10 fs laser pulses [11]. Nevertheless, the efficiency of converting laser energy into
potentially useful high harmonic light is typically poor (< 10-7 conversion efficiency of
laser light into one high harmonic order). Despite the low efficiency of this process, the

4
photon flux generated is sufficient to be useful for some applications in time-resolved
ultrafast x-ray spectroscopy.
An attractive feature of HHG is that the harmonics emerge from the generating
region as coherent beams with polarization similar to that of the generating beam. The
harmonics are embedded in the residual laser beam but with a typically narrower beam
divergence [12-14]. Fig. 1.1 represents a typical setup to produce the high-order
harmonics in a jet of gas inside a vacuum chamber.
gasjet
vacuum ~10-2 torr
incoming laser beam
gas atoms
out going laserbeam
harmonicbeams
Fig. 1.1 Typical setup for producing laser high-order harmonics in gas. The gas is
injected into the focus of the laser.
The low divergence of the high harmonic light may be useful for applications
such as the probing of dense plasmas, EUV lithography, ultrafast time-resolved
spectroscopy, EUV reflectometry or ellipsometry, or basic atomic physics research [1-
3,15]. Nevertheless, the harmonics generated in atomic gases (in particular the harmonics
of highest orders) have so little energy per pulse that their prospects of usefulness in
science and technology are limited. Geometrical, free-electron, and intensity-dependent

5
phase mismatches (between the generated high harmonic light and the laser field) play a
dominant and quite undesirable role in limiting the harmonic emission.
In my dissertation, I present a model and experimental verification that phase
mismatches in high harmonic generation can be significantly counteracted with weak
interfering light. The remainder of this chapter provides additional background
information about the high-harmonic generation process and review methods for
enhancing the efficiency of converting laser light into high-order harmonics. Chapter 2
describes how weak counter-propagating laser pulses can be used to disrupt harmonic
generation in out-of-phase regions in the laser focus. Chapter 3 describes our first
experiments in laser high-order harmonic disruption and enhancement using interfering
weak light. Chapter 4 outlines the development of a compact polarized EUV
reflectometer utilizing high-order harmonics. This EUV reflectometer illustrates a
possible application of high harmonics. Chapter 5 describes a new laser system we
constructed for the purpose of extending the phase matching technique to laser pulses
with higher energy and, hence, to higher harmonic orders. The new system enables the
simultaneous disruption of harmonic generation in several out-of-phase emission zones
for an overall harmonic emission enhancement (quasi phase match). Chapter 6 outlines
the new experimental setup for high harmonic production with multiple counter-
propagating pulses. This setup will be used for future experiments that extend my
dissertation work.

6
1.2 HARMONIC GENERATION AT THE ATOMIC LEVEL
When intense laser light interacts with an atom, the bound electrons undergo
violent and non-linear motions that can radiate high harmonics of the applied frequency.
The atomic potential is an even function because the medium is isotropic and
centrosymmetric [16]. As a result, the harmonics generated in gases are all odd order. In
the high-harmonic generation process, intense laser light with angular frequency w passes
through a non-linear medium and generates light with angular frequency Nw, where N is
the harmonic number. This is in contrast with the common situation for low-intensity
light where the polarization of the medium depends linearly on the electric field:
P E= e c0 , (1.1)
where c is the linear susceptibility. Hence, if light of angular frequency w passes
through the medium, a polarization also oscillating at w is produced. This is only an
approximation, which breaks down at high laser intensities when non-linear terms in the
electric field polarization become important. The polarization is often represented by an
expansion in terms of electric field:
P E E E= + + +( ) ( ) ( )e c e c e c01
03 3
05 5 K . (1.2)
In this case, the polarization is composed of non-linear terms such as e c03 3( ) E ,
e c05 5( ) E , etc., as well as the linear term e c0
1( ) E . These elements in the polarization
may oscillate at frequency 3w, 5w, etc., giving rise to harmonics. Because the higher
order terms in the susceptibility are small compared with the first term, non-linear optical
7
effects were not observed [4] until the development of the laser. In order to achieve
harmonic generation, the generating laser light must be linearly polarized (or close to it).
Until the early work of McPherson et al. [6], HHG had been described within a
framework of perturbation theory [17-19]. Perturbation theory suggests that each
harmonic order depends on the order immediately below it and that each harmonic order
should be progressively much dimmer than the last. Nevertheless, high harmonics are
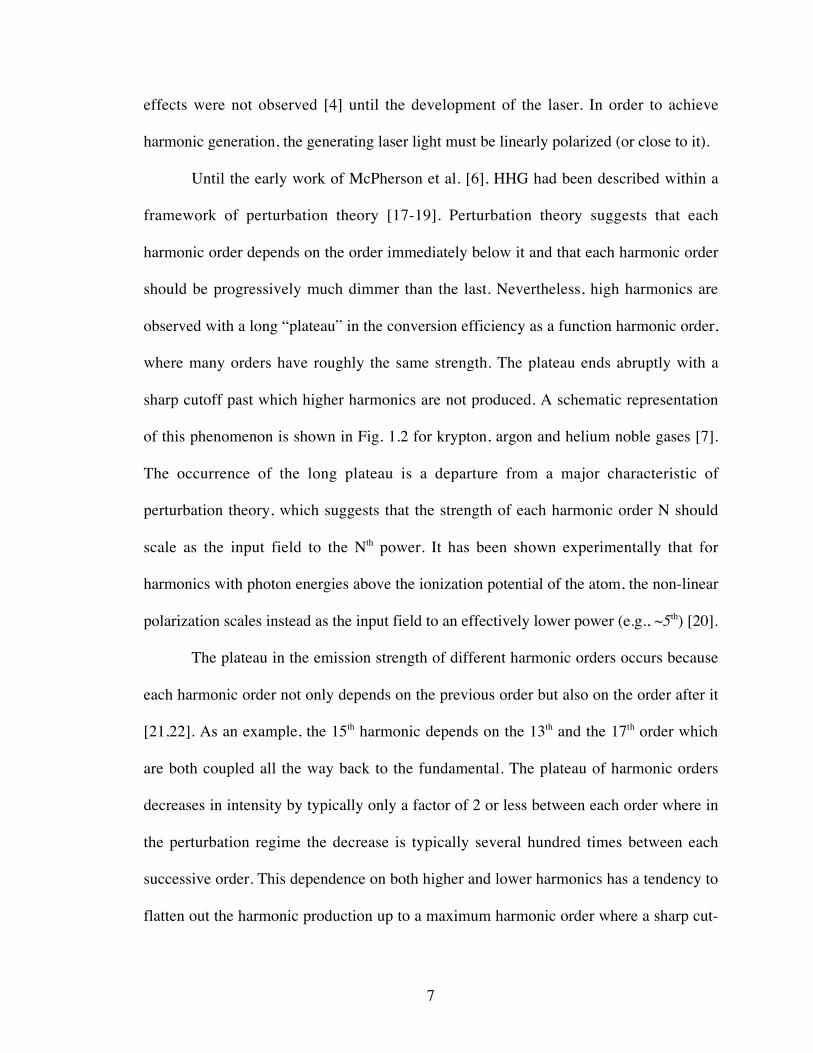
observed with a long “plateau” in the conversion efficiency as a function harmonic order,
where many orders have roughly the same strength. The plateau ends abruptly with a
sharp cutoff past which higher harmonics are not produced. A schematic representation
of this phenomenon is shown in Fig. 1.2 for krypton, argon and helium noble gases [7].
The occurrence of the long plateau is a departure from a major characteristic of
perturbation theory, which suggests that the strength of each harmonic order N should
scale as the input field to the Nth power. It has been shown experimentally that for
harmonics with photon energies above the ionization potential of the atom, the non-linear
polarization scales instead as the input field to an effectively lower power (e.g., ~5th) [20].
The plateau in the emission strength of different harmonic orders occurs because
each harmonic order not only depends on the previous order but also on the order after it
[21,22]. As an example, the 15th harmonic depends on the 13th and the 17th order which
are both coupled all the way back to the fundamental. The plateau of harmonic orders
decreases in intensity by typically only a factor of 2 or less between each order where in
the perturbation regime the decrease is typically several hundred times between each
successive order. This dependence on both higher and lower harmonics has a tendency to
flatten out the harmonic production up to a maximum harmonic order where a sharp cut-
8
off occurs. As it is seen on Fig. 1.2, the plateau region is longer for He, than for Ar or Kr,
though the relative conversion efficiency is lower. The interpretation of these results is
not an easy task because it involves both the single-atom response to the laser interaction
and the collective coordination of many atoms, the capability of the medium to ensure
proper phase matching between the incident field (the driving field) and the generated
harmonics.
Fig. 1.2 A schematic representation of high harmonic emission cut-off seen in krypton,
argon, and helium noble gases (taken from Ref.[7]).

9
Fig. 1.3 One-dimensional atomic potential well (solid line) and applied electric potential
(dashed line).
Traditionally, harmonic generation is described in terms of the non-linear
polarization induced in the medium by the high strength input electric field [16,23]. For
low-order harmonics, this polarization, described in Eq.(1.2), comes about from an
effective potential well wherein the electron resides, which varies from the parabolic
shape of a purely “harmonic” system. However, very strong external electric fields
change the dynamics of the interaction, especially when the field becomes comparable to
the Coulomb field (on the order of E=5*1011 N/C in hydrogen), which binds the electron
to the atom. As atomic electrons are driven strongly in a field, the potential that the

10
electron sees is extremely anharmonic – to the point where the electron may leave the
atom and become ionized.
Fig. 1.3 depicts the potential of a commonly used model for strong field-atom
interactions. The figure shows a hydrogenic atomic potential well (solid line) and the
potential of an applied strong oscillating electric field E=E0cos(wt) (dashed line) at an
instant in time. The combined potentials become
V x
ex
exE( ) = - -2
04p e, (1.3)
where e is the charge of the electron, and e0 is the permittivity constant.
Fig. 1.4 Potential of an atom distorted in a strong laser field at an instant in time.

11
We can estimate the intensity at which the laser field becomes comparable to the
atomic field, in which case the electron may freely escape according to the Barrier
Suppression Ionization (BSI) model [24,25], which has proven to be remarkably accurate.
This provides a benchmark for the maximum intensity an atom can experience before
ionizing. If the field is strong enough, the coulomb barrier falls below the initial binding
energy of the electron. Fig. 1.4 shows the combined potentials of the atom and a field
sufficiently strong to allow the electron can escape over the barrier.
Of course, there can be quantum tunneling before the barrier is suppressed
completely to the level of the binding energy [26]. There can also be quantum wave
packet reflections from the barrier even when it is suppressed below the binding
potential. Nevertheless, we ignore these effects in this estimate.
To find the electric field E needed to allow the electron to escape, we find the
extremum of V(x) in Eq.(1.3) and solve for x, which yields
x
eE
=4 0pe
. (1.4)
This is the position of the highest point on the barrier. We substitute this position back
into Eq. (1.3) and set the potential equal to the binding energy -V0:
V x
eE
eE V=
È
ÎÍ
˘
˚˙ = - = -
-
4 0
3 2
00pe pe
/
. (1.5)
From this, we see that the electric field needed to ionize the atom is
E
Ve
= pe0 02
3 . (1.6)
The corresponding intensity for linear polarized laser light is found to be
I
cE ce
V= =e p e02 2
03
6 04
2 2, (1.7)

12
where c is the speed of light in vacuum. Table 1.1 shows the ionization potential in eV for
neutral atoms and ion states of the most commonly used noble gases [24,27].
Gas
Species
Neutral I II III IV V
Helium 24.6 54.4
Neon 21.6 41.0 63.4 97.1 126.2 157.9
Argon 15.8 27.6 40.7 59.8 75.0 91.0
Krypton 14.0 24.4 37.0 52.5 64.7 78.5
Xenon 12.0 21.2 32.1 47.6 59.0 72.0
Table 1.1 Ionization potentials in eV for neutrals and ions for the noble gases.
Table 1.2 shows the ionization intensities calculated with Eq. (1.7). In order to
achieve the intensities shown in the Table 1.2, a millijoule-class laser pulse with the
duration of a few tens of femtoseconds need only be focused to a diameter tens of
micrometers wide. The peak intensity of a laser pulse may be estimated as follows:
Intensity
PowerArea
Energyduration Area
= =*
. (1.8)
For example, our first ultrafast laser setup at Brigham Young University designed
to produce high-order harmonics utilized 0.5-millijoule, 30-fs laser pulses focused onto a
spot of the radius of 25 microns (Gaussian profile). Under these conditions, the peak laser
intensity of the laser in focus was approximately I=2x10¹⁵ W/cm2. According to Eq.(1.7),
the electric field of the laser was on the order of 1011N/C. This electric field strength is
13
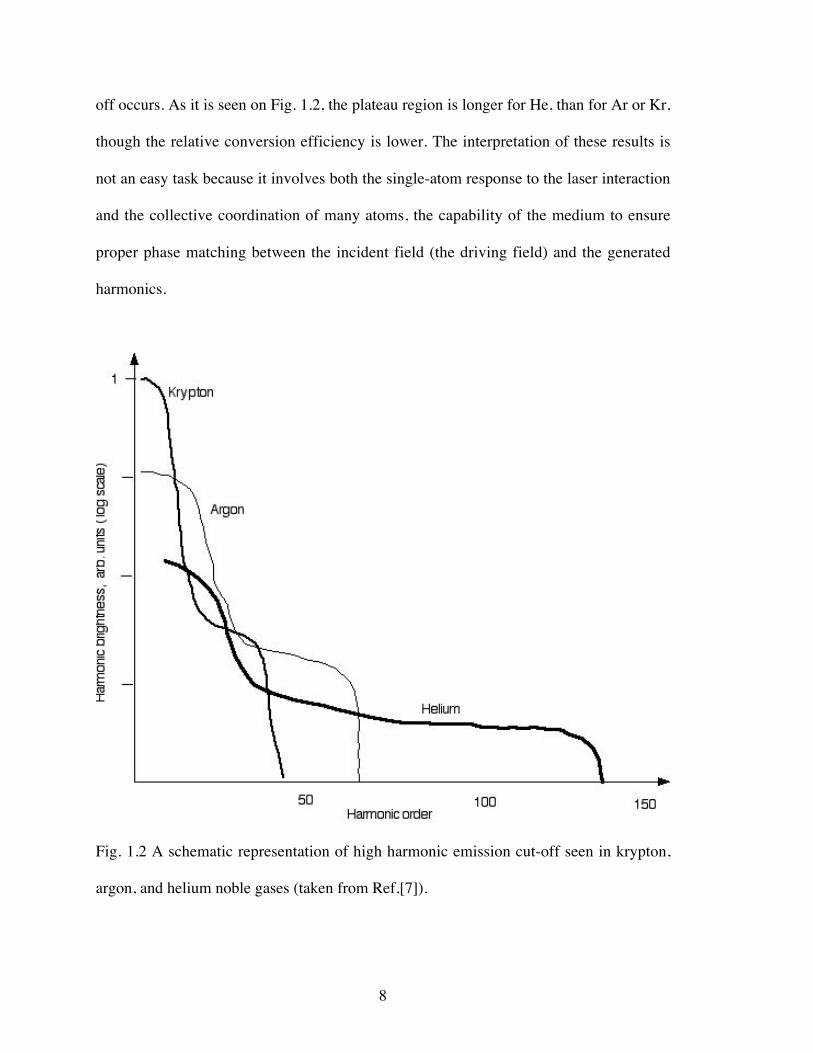
comparable to the Coulomb field binding the electron in a hydrogen atom. Modern lasers
can routinely produce electric field strengths as high as 103 Volts per Angstrom (laser
intensity ~1019 W/cm2).
Gas Species Ionization intensity, W/cm2 Ion state I ionization
intensity, W/cm2
Helium 1.5x10¹⁵ 3.5x10¹⁶
Neon 8.7x10¹⁴ 1.1x10¹⁶
Argon 2.5x10¹⁴ 2.3x10¹⁵
Krypton 1.5x10¹⁴ 1.4x10¹⁵
Xenon 8.3x10¹³ 8.1x10¹⁴
Table 1.2 Ionization intensities for some neutral noble gases and their ionization
state I.
A typical high-intensity laser produces 800 nm wavelength radiation (Ti:Sapphire
active medium, photon energy 1.55 eV). The ionization suggested by the above model is
often referred to as multiphoton ionization. For example, ~ 11 photons are needed to
ionize a neutral atom of argon gas.

14
1.3 CLASSICAL AND QUANTUM MODELS FOR HIGH HARMONIC
GENERATION
A. Classical model
We now consider high harmonic emission by electrons undergoing the ionization
process described in the previous section. We can apply classical kinematics to estimate
the maximum energy available to an atomic electron in the applied oscillating electric
field, which might be emitted as a high-harmonic photon.
Kenneth Kulander et al. [28] and Paul Corkum [29] first suggested theoretically
that the maximum photon energy in harmonic generation follows the universal law:
K V Upmax .= +0 3 17 , (1.9)
where V0 is the energy needed to ionize the atom, and Up is the mean kinetic energy of a
free electron oscillating in the laser field (no drift velocity), called the ponderomotive
potential. According to the model, the electron acquires a maximum kinetic energy of
3 17. U p as it is pulled from the atom by the laser field (leaving the atom momentarily
ionized) and subsequently slammed back into the atom when the polarity of the laser field
reverses.
Applying classical kinematics, the equation of motion of a free (not influenced by
the atomic potential) electron under the applied laser field is
F mx eE t= = - +( )˙ cos0 w f , (1.10)
where m is the mass of the electron, w is the angular frequency of the laser radiation, E0
is the electric field amplitude of the laser radiation, and f determines the phase of the

15
field at the moment the electron becomes free of the atom. The coordinate x indicates the
distance from the atomic center to the electron oscillating in the field.
Upon integration of Eq.(1.10), we get
˙ [sin sin( )]xeE
mt= - +( ) -0
ww f f
,(1.11)
assuming that the particle is at rest when t=0. If f is not zero, then we see from Eq.(1.11)
that there will be a net drift to the motion of the electron.
The mean kinetic energy of the electron in the case of no net drift, or the
ponderomotive potential, is
U K m Xe E
mt
e E
mp = = = ( ) =∑1
212
14
22
02
22
202
2ww
wsin , (1.12)
which is a useful energy benchmark. In terms of the intensity of an applied linearly
polarized laser field, I cE0 0 02 2= e , the ponderomotive potential may be written as
Ue I
m cp =2
02
02 w e . (1.13)
Nucleus
electron
Fig. 1.5 Escape of an electron from the atom.
16
Fig. 1.5 shows a case when f in the Eq.(1.11) is some positive value. As the
electron oscillates in the electric field, it never returns again to the nucleus because of a
net drift, owing to the particular initial condition. On the other hand, if f is negative (even
slightly), the drift is such that the electron returns to the nucleus with considerable
velocity. Integrating Eq.(1.11) we obtain
xeE
mwt
eE
mwt= +( ) - + ( )0
20[cos cos( )] sinw f f f
, (1.14)
assuming that the particle is at the origin when t=0. The time when the particle returns to
the nucleus (i.e., to the position x=0) can be found by setting Eq.(1.14) equal to zero and
solving the following transcendental equation for t > 0 :
[cos cos( )] sin( )w f f w ft t+( ) - = - . (1.15)
The kinetic energy of the electron upon return is
E mxe E
mt U tpmax ˙ sin sin( ) sin( ) sin( )= = +( ) -[ ] = + -[ ]1
2 22
202
2
2 2
ww f f w f f , (1.16)
where the value for wt is found from Eq.(1.15).
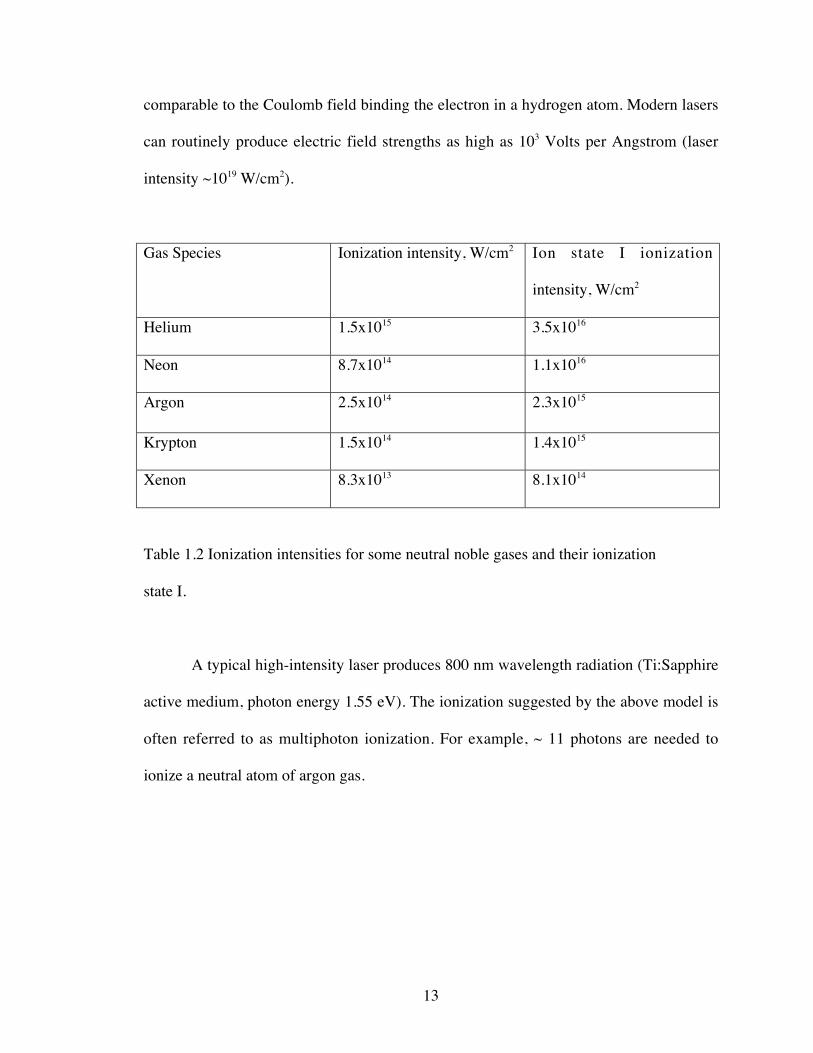
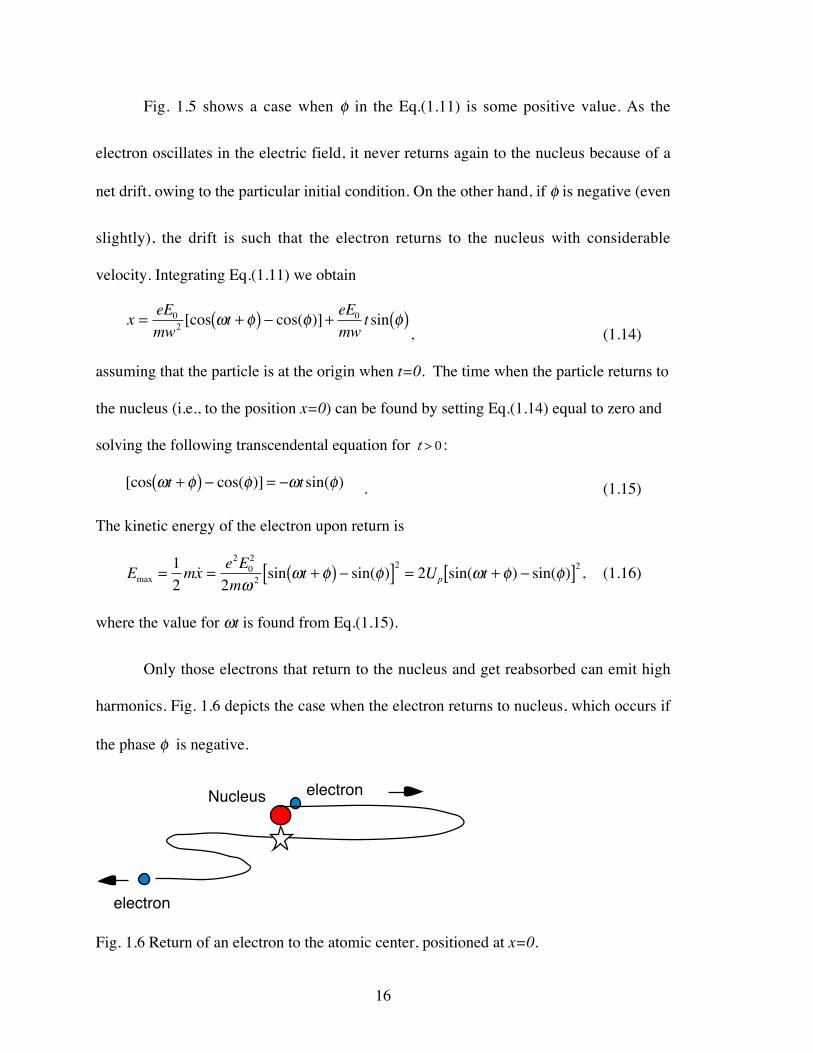
Only those electrons that return to the nucleus and get reabsorbed can emit high
harmonics. Fig. 1.6 depicts the case when the electron returns to nucleus, which occurs if
the phase f is negative.
Nucleus
electron
electron
Fig. 1.6 Return of an electron to the atomic center, positioned at x=0.
17
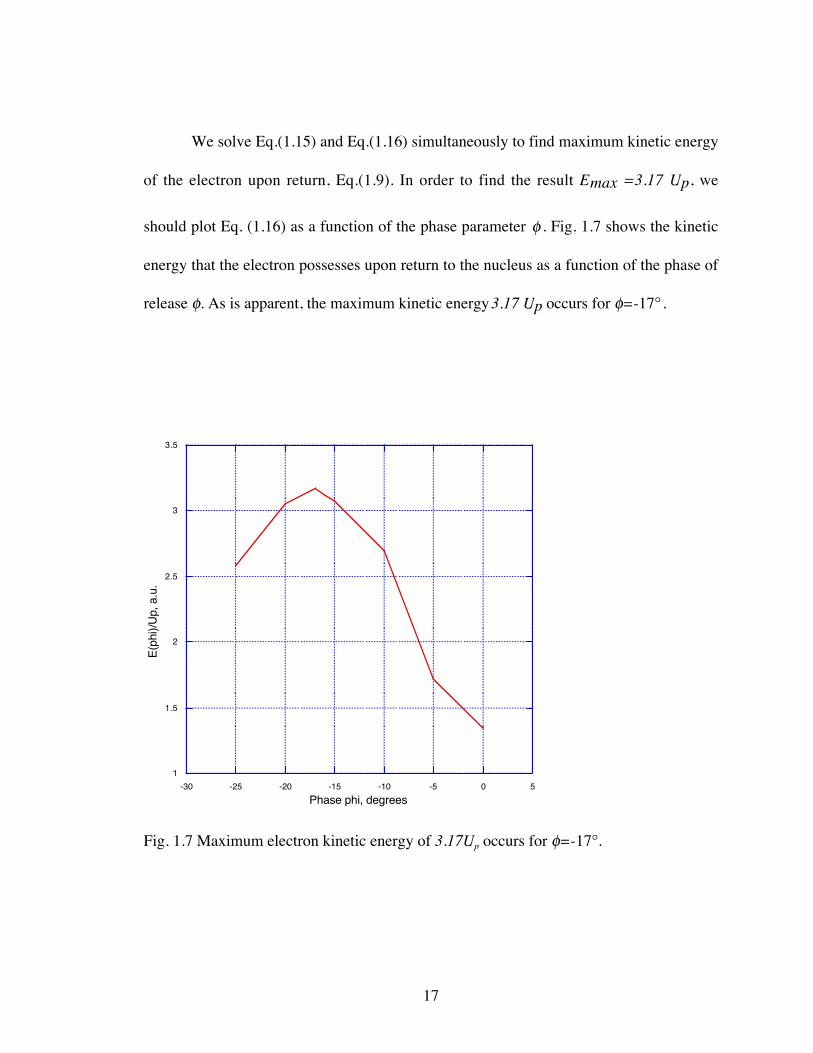
We solve Eq.(1.15) and Eq.(1.16) simultaneously to find maximum kinetic energy
of the electron upon return, Eq.(1.9). In order to find the result Emax = 3.17 Up, we
should plot Eq. (1.16) as a function of the phase parameter f . Fig. 1.7 shows the kinetic
energy that the electron possesses upon return to the nucleus as a function of the phase of
release f. As is apparent, the maximum kinetic energy 3.17 Up occurs for f=-17∞ .
1
1.5
2
2.5
3
3.5
-30 -25 -20 -15 -10 -5 0 5
E(p
hi)/
Up,
a.u
.
Phase phi, degrees
Fig. 1.7 Maximum electron kinetic energy of 3.17Up occurs for f=-17∞.
18
Upon return to the atom, the electron can recombine, giving up not only all of its
kinetic energy, but also the ionization potential of the atom in the form of a single photon.
Thus, the highest possible photon energy that the electron can generate is given by
Eq.(1.9). Of course, if the electron does not recombine it can re-scatter giving up part of
its energy as radiation, i.e. it may produce a high harmonic photon, but not the highest
possible photon energy.
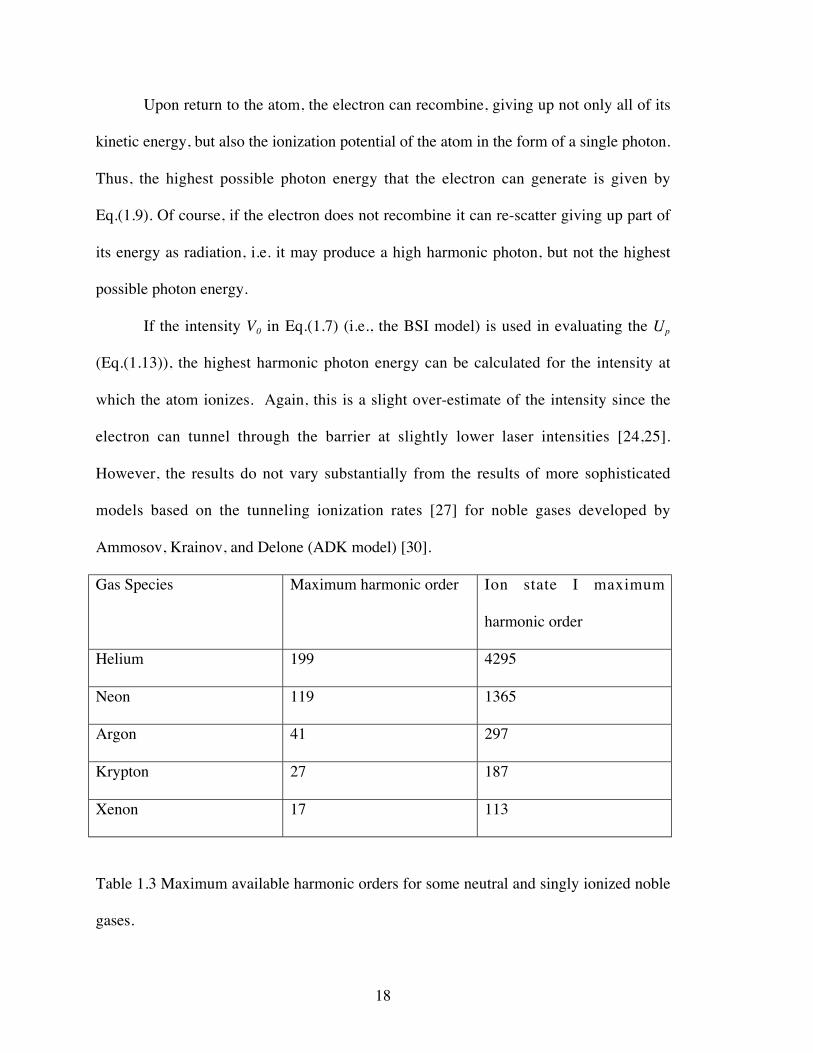
If the intensity V0 in Eq.(1.7) (i.e., the BSI model) is used in evaluating the Up
(Eq.(1.13)), the highest harmonic photon energy can be calculated for the intensity at
which the atom ionizes. Again, this is a slight over-estimate of the intensity since the
electron can tunnel through the barrier at slightly lower laser intensities [24,25].
However, the results do not vary substantially from the results of more sophisticated
models based on the tunneling ionization rates [27] for noble gases developed by
Ammosov, Krainov, and Delone (ADK model) [30].
Gas Species Maximum harmonic order Ion state I maximum
harmonic order
Helium 199 4295
Neon 119 1365
Argon 41 297
Krypton 27 187
Xenon 17 113
Table 1.3 Maximum available harmonic orders for some neutral and singly ionized noble
gases.

19
According to Eq. (1.9), the maximum harmonic order that can be produced is
N
V U pmax
.=
+0 3 17
hw, (1.17)
where hw is the photon energy of the generating light. From Eq. (1.13) and Eq. (1.17),
we can estimate the maximum harmonic order possible for 800 nm laser field. We
employ the data from table 1.2 to construct table 1.3.
An increase of laser intensity increases Up and, hence, the maximum photon
energy. Thus, the gases that require more intensity to ionize are able to produce higher
harmonic orders. The ionization process sets an upper limit on the intensity to which an
atom can be exposed. The ionization intensity can be increased somewhat by making the
laser pulses shorter, because the atom can survive to higher intensities [31].
Compared to the heavier noble gases, the electronic structure of neon and helium
are more tightly bound. The heavier noble gases therefore produce fewer harmonic
orders. However, they have significantly higher conversion efficiencies [7,32]. This
happens because a more tightly bound initial electron wave packet (e.g., He or Ne)
undergoes a larger spread before returning to recombine with the atom (see Fig. 1.6).
This lessens the probability of recombination to the ground state of the atom [18].
J. Zhou et al. [32] measured the number of harmonic orders generated as a
function of laser pulse duration. They found that for short pulses, 25 fs, the maximum
harmonic order is much higher than that predicted using the BSI assumption because the
field grows appreciably during the excursion time of the electron. For example, orders up
to the 61st were produced from neutral argon atoms (compare with order 41 in table 1.3.)
The possibility of generating high-order harmonics from neutrals with much higher

20
maximum harmonic orders using extremely short laser pulses is the subject of theoretical
and experimental investigation [11, 33-40].
Eq.(1.17) together with the BSI model gives a reasonable estimate for the
maximum harmonic order. However, collective effects (phase mismatches in the
harmonic emission from an ensemble of atoms) can alter this rule [31]. It is interesting to
mention that the maximum harmonic order for some gas species in the Table 1.3 is on the
order of hundreds, or even thousands. In practice, however, the overall emission of the
highest harmonics can be quite small. Moreover, it can be difficult to reliably detect the
faint signal of the highest harmonics for which mismatches can be severe. Nevertheless,
this short-wavelength source has important implications technologically if it can be made
sufficiently bright [1-3,15]. The search for methods to counteract phase-mismatches of
high-order harmonic emission in atomic gases, especially for higher harmonic orders, is a
main priority.
Using ions to generate high harmonics is a possibility since they typically have
higher ionization potentials, but the problem with ions is that they necessitate the
presence of free electrons, which make phase matching of high harmonic generation
difficult.
B. Quantum model
To obtain a more complete understanding of high-harmonic generation, an
investigation of the atomic wave function obeying the Schrödinger equation can be very
instructive. Lewenstein et al. [41] developed a quantum mechanical model of high-
harmonic generation in an oscillating field with photon energy much less than the atomic

21
binding potential. They used the adiabatic assumption, meaning that the laser intensity
varies slowly with respect to an optical period. Their theoretical work corresponds well to
experimental evidence [31] that the cut-off harmonic energy tends to be slightly lower
than that predicted by Kulander and Corkum.
If the electric field of the laser changes direction while part of the electron wave
packet escapes to the continuum states, that part of the electron wave packet can
approach the nucleus and recombine to the ground state, producing a photon
corresponding to the kinetic energy acquired by the electron wave packet plus the
ionization potential. In the approach of Lewenstein et al., the contribution of all excited
bound states is neglected, as well as the depletion of the ground state. The other basic
assumptions in this model are:
1) only a single bound state and the continuum states are needed to describe the wave
packet;
2) in the continuum, the electron can be treated as a free particle moving in the electric
field with no effect of the atomic potential Vatomic ;
3) the acceleration of the wave function position rr is Fourier transformed to find the
spectrum of high harmonic emission.
Lewenstein et al. showed that the classical model gives essential agreement with
the quantum-mechanical approach. They verified that the maximum photon energy in
harmonic generation agrees reasonably well with Eq.(1.7), but tends to exhibit a slightly
lower harmonic order. In order to make a realistic comparison between the Lewenstein et
al. model and experimental data [31], one has to take into account propagation effects.
22
1.4 PHASE MISMATCHES IN HIGH HARMONIC GENERATION
As mentioned in section 1.1, in order to have strong harmonic emission, the
generating laser light and the created harmonics must travel in phase for a coherent
buildup of energy. To understand phase matching, consider a wave front of the laser,
which propagates in an atomic medium. The atoms along the path of the laser emit
harmonics. These join with previously emitted harmonics with some kind of definite
phase relationship. As the harmonics propagate with the laser field, they are joined by
additional harmonics emitted by atoms “down stream”, their phases being associated with
the laser wave front that creates them. Beneficial phase matching occurs for an individual
harmonic order when the laser wave fronts and the harmonic wave fronts propagate in
phase. However, this does not happen typically in a real process because the speeds of the
incident and harmonic waves can vary.
Typically, a particular generated harmonic and the laser field (fundamental) are
matched in phase over distances that are many times the wavelength of the incident light.
However, the length over which the harmonic phases are matched (called “the coherence
length”) can be much shorter than the focal depth (typically, 1 mm) owing to different
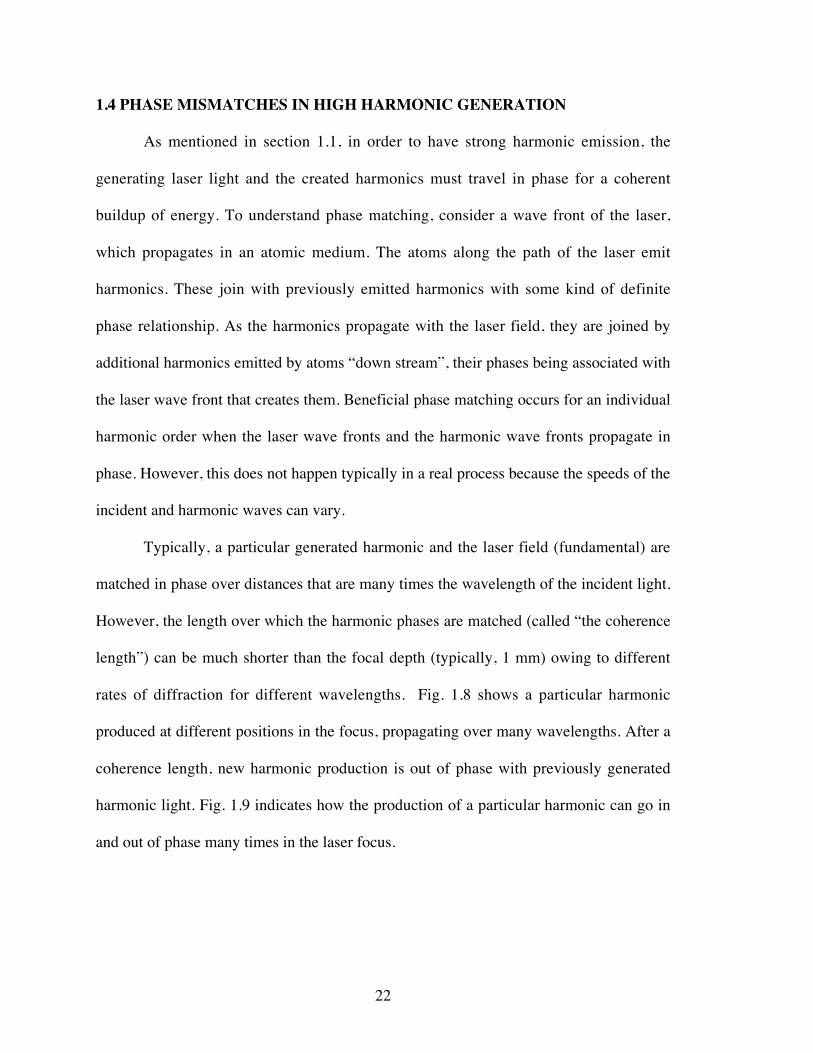
rates of diffraction for different wavelengths. Fig. 1.8 shows a particular harmonic
produced at different positions in the focus, propagating over many wavelengths. After a
coherence length, new harmonic production is out of phase with previously generated
harmonic light. Fig. 1.9 indicates how the production of a particular harmonic can go in
and out of phase many times in the laser focus.

23
Fig. 1.8 A particular harmonic produced from atoms at different locations in the laser
focus. Harmonic light generated at the first position is out of phase with the harmonic
light generated at the second position, but in phase with the light generated at the third
position.
Fig. 1.9 Phase variation of harmonic emission throughout the laser focus.
Phase mismatches can cause severe destructive interference for harmonic light
emerging from different locations in the laser focus. The efficiency of converting the
24
fundamental light into high-order harmonics is limited by several phase mismatch
phenomena:
1) geometrical phase mismatches arise from discrepancies between the diffraction rates
for the laser and for individual harmonics;
2) the refractive index for the fundamental laser light differs from the refractive index for
the shorter-wavelength harmonics (this occurs mainly due to free electrons);
3) the intrinsic phase of harmonic emission can vary longitudinally and radially
throughout the focus because of varied atomic response to the local laser intensity.
Obviously, to produce the brightest possible high harmonic light, we must
mitigate phase-mismatches in the generation volume. This is a separate issue from the
possibility of re-absorption of harmonic light within the relatively dense generating
medium. We should keep in mind that phase issues do not alter the single-atom response
to the laser field, which is the primary driver of the harmonic generation process.
A. Plasma phase mismatches
Since the strongest harmonic emission occurs as atoms undergo ionization by the
laser field, we are often interested in harmonic generation in the presence of plasma
consisting of free electrons and their parent ions together with the remaining intact
neutral atoms. Under typical high-harmonic generation conditions [42], if the gas
becomes fully ionized, the appearance of free electrons associated with ionization causes
the length over which the harmonic phase slips by p relative to the phase of new
harmonic production to be as little as few tens of microns.
The index of refraction for plasma is given by

25
n p
plasma ( )www
= -12
2 , (1.18)
where w is the laser frequency and w p is the plasma frequency. The plasma frequency is
given by
w
epo
Nem
22
= , (1.19)
where N is the density of free electrons. The index of refraction in plasma is less than
unity for all light traveling through the plasma and depends on the frequency of the
traveling light. Eq. (1.19) can be approximated for the case of high harmonic generation
as
n p
plasma ( )ww
w@ -1
2
2
2 , (1.20)
since the laser frequency w is typically far above the plasma frequency w p .
The coherence length Lc for generating the qth harmonic in a medium with
frequency-dependent refractive index is found from
qk k L
qn n q Lq c
oplasma plasma c-[ ] = -[ ] =2p
lw w p( ) ( ) . (1.21)
When the refractive index for plasma, Eq. (1.20), is used in this formula, we find
L
qm
q Neco
p o o
@ @l ww
pl m
2
2
2
2
4, (1.22)
where we have assumed that q>>1. As an example, if one electron per atom is ionized in
1 torr of gas (initially at room temperature, i.e., N m@ ¥ -3 1022 3), the coherence length
is found to be L cm qc ( ) @ 4 . Thus, the coherence length for the 39th harmonic in this case
is 100mm, and is ten times shorter if the pressure is increased to 10torr. Plasma phase-
26
mismatches become of greater importance (i.e., the coherence length gets shorter) with
increased harmonic order. This means that a higher order harmonic goes in and out of
phase with the fundamental field more often.
Eq.(1.22) shows that the coherence length can decrease as gas density increases.
This means that the harmonic signal does not necessarily improve merely because the
density of harmonic emitters increases [43]. The conversion efficiency can also be
limited by the defocusing of the laser light if the on-axis density of free electrons
becomes too large. The density of free electrons depends on the level of ionization. For
lower order harmonics (e.g., orders in the teens or less), which can be generated with
little ionization, the phase mismatch due to plasma is of relatively minor importance. For
very short pump pulses (tens of femtoseconds and less), ionization is delayed until after
significant amounts of harmonic radiation are emitted. Therefore, if the pressure is not
too high, the coherence length in this case can approach that of a neutral gas.
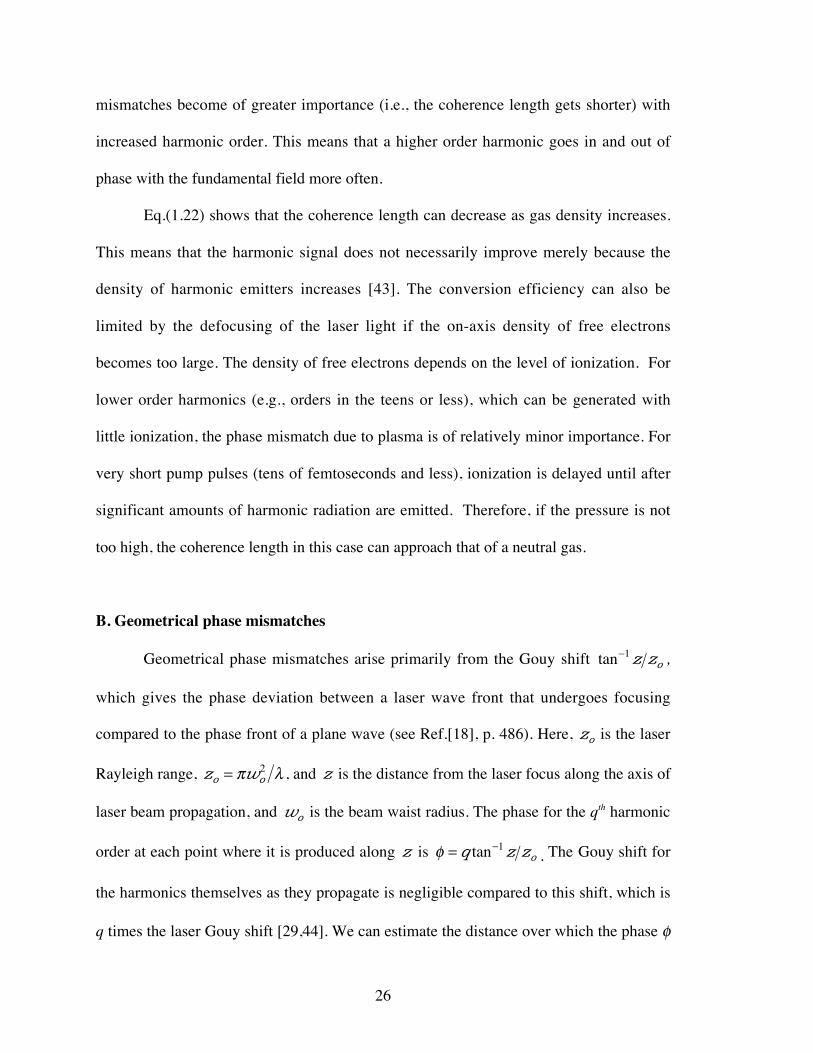
B. Geometrical phase mismatches
Geometrical phase mismatches arise primarily from the Gouy shift tan-1 z zo ,
which gives the phase deviation between a laser wave front that undergoes focusing
compared to the phase front of a plane wave (see Ref.[18], p. 486). Here, zo is the laser
Rayleigh range, z wo o= p l2 , and z is the distance from the laser focus along the axis of
laser beam propagation, and wo is the beam waist radius. The phase for the qth harmonic
order at each point where it is produced along z is f = -q z zotan 1. The Gouy shift for
the harmonics themselves as they propagate is negligible compared to this shift, which is
q times the laser Gouy shift [29,44]. We can estimate the distance over which the phase f
27
changes by p. For this purpose, we take the derivative of this phase term:
d dz = q z zo of +( )z 2 . This implies a phase change of Df p= over an approximate
coherence length of
Dz
zz
z
q=
+p ( )0
2
0
, (1.23)
or simply Dzªpz0/q near the center of the laser focus.
For a typical f/50 geometry with and 800nm wavelength, the Rayleigh range is
about z0=2.5mm. In this case, the coherence length for the harmonic number q=39 turns
out to be 200 mm near the center of the focus. According to Eq.(1.23), the coherence
length becomes somewhat longer if evaluated away from the focus. To reduce
geometrical phase mismatches, the depth of focus can be increased relative to the gas jet
width to confine the interaction region to a single geometrical coherence length, thus
avoiding destructive phase cancellations [44,45]. However, loose focusing requires
greater laser pulse energy to achieve the same intensity. Unfortunately, the high-intensity
regions in the beam before and after the single coherence length cannot be utilized in this
case.
C. Intensity-dependent phase mismatches
The intensity-dependent phase of single-atom emission of a particular harmonic
can have macroscopic effects since different atoms throughout the focus experience
different intensities. The laser intensity can significantly vary along its axis within the gas
medium. The intensity-dependent phases can therefore vary axially as well. This can lead

28
to phase mismatches and deterioration of harmonic emission. This has been demonstrated
experimentally [46,47] and is in agreement with theoretical expectations [48]. It is
possible to find situations in which the intrinsic phases can be played against geometrical
phase mismatches for a modest improvement to overall phase matching [46,47]. Our
group has also made attempts to learn more about the nature of intrinsic phase
mismatches [49].
1.5 PHASE-MATCHING IN HIGH HARMONIC GENERATION
Since high harmonics were discovered in 1987 [6], a basic understanding of the
phase matching for high harmonics generated in gases has emerged. Wahlstrom et al.
[40] and Altucci et al. [50] investigated harmonic generation as a function of atomic
density. They found well-defined limitations to the gas density depending on harmonic
order and atomic species beyond which index-related phase mismatches overcame the
benefit of having an increased number of harmonic emitters.
L’Huillier et al. [44,45] investigated extensively the phase matching limitations
associated with focal geometry. Because of these issues, it is typical to confine the
interaction region to a single geometrical coherence length to avoid destructive phase
cancellations (geometrical only). This is usually done by lengthening the laser focus
relative to the width of the gas jet or by working outside of the focus. As mentioned
above, this method does not utilize the high-intensity focal volume outside of the
coherence length.
A remarkable approach for improving the conversion efficiency of high-order
harmonic generation has been demonstrated by the group headed by Margaret Murnane

29
and Henry Kapteyn. By generating the high harmonics inside of a hollow core fiber, they
reached harmonic conversion efficiencies beyond 10-5, owing to a greatly extended
coherence length in the wave-guide [51,52].
Hergott et al. [53] demonstrated relatively high conversion efficiency for
harmonic orders 23-31 using a long focal length lens (~2 meters). They increased the
energy of high harmonics by at least one order of magnitude (achieving microjoule
harmonic energies). In the experiments, Hergott et al. controlled the diameter of the laser
aperture placed before the focusing lens, interaction length, pressure, and position of the
gas medium relative to the laser focus [44,45].
Braun et al. proposed a phase-matching technique [54] that relies on a self-
channeling effect of the laser in gas near atmospheric pressure with laser intensities near
1014W/cm2. A single filament (a self-focused beam) can form with pulse energy as high
as 30 mJ. A limitation of this self-channeling technique is its interaction length. When the
laser intensity exceeds 1014 W/cm2, which is typically required to produce high-order
harmonics, self-focusing is no longer in balance with plasma defocusing. Nevertheless,
the confocal parameter can elongate to 10 times that in vacuum [55], leading to improved
phase matching for some of the lower high harmonic orders [55,56].
More recently, Tamaki et al. [57] demonstrated phase matching of high harmonics
via self-focusing of the laser in a low-density gas. They observed elongated focal lengths
up to 7 mm. The high-order harmonics appeared to be emitted from all the gas volume
within this length. The coherence length for harmonic emission was reported
experimentally to be similar in length (few mm). This improved the conversion efficiency
of the 49th harmonic of 800 nm light by 40 times. The scheme enhances the conversion

30
efficiencies in the cut-off region to as much as ~10-6 (i.e., up to two orders of magnitude
enhancement for the harmonic orders in upper forties). Tamaki and coworkers used a gas
cell with two 300-micrometer diameter pinholes, isolating the gas from the ambient
vacuum chamber. Pinholes were used to transmit the focusing laser beam into and out of
the cell. The cell was pressurized with neon atomic gas at 50 torr and the ambient
vacuum chamber pressure was held to below a millitorr. Their approach is now in wide
use due to its greatly reduced geometrical phase mismatch. On the other hand, plasma
mismatches can become significant for this increased propagation (interaction) length.
An important limitation to the enhancement of high harmonic generation is the re-
absorption of harmonic light within the generating medium reported by E. Constant et al.
[58]. This limitation is the same for both the case of a loosely focused beam or a beam
guided in a gas-filled hollow-core fiber or cell. Under optimal conditions, they measured
the conversion efficiency of 4x10⁻⁵ (two orders of magnitude enhancement) for the 15th
harmonic generated in xenon gas using a 40 fs laser pulse of wavelength 800 nm. They
demonstrated sufficiently good phase matching that the output was re-absorption limited.
Aside from issues of phase matching, it is worth noting that shorter laser pulse
durations lead to increased conversion efficiency because strong ionization occurs only
after significant amounts of harmonic radiation is emitted. [11,59]. Special laser pulse
temporal profiles can be designed to enhance the atomic response [60]. An improvement
to harmonic emission has been demonstrated using a genetic algorithm to adjust the
computer-controlled pulse temporal profile [61]. The inter-play between intrinsic and
geometrical phase mismatches may play a role for conversion efficiency enhancement
[62]. Another scheme that has been implemented produces harmonics from two

31
superimposed laser foci. The foci are separated longitudinally by a few millimeters. This
scheme enhances the phase matching for an improved output [63].
The enhancement of the conversion efficiency is especially important for high-
order harmonic wavelengths between 2 and 5 nm, in the so-called “water window”
between the carbon and oxygen absorption edges where carbon absorbs and water
transmits, permitting the possibility of high-resolution biological imaging. Promising
work by Z. Chang et al. [10] shows that high harmonic generation at 2.7 nm may be
useful for biological experiments.
In summary, the efficiency of converting laser light into the high harmonics can
be enhanced through various methods. However, the high harmonics remain several
orders of magnitude dimmer than other EUV sources such as a capillary discharge
sources [64] producing 7 mJ pulses of spatially incoherent radiation in a 0.3nm
bandwidth centered at 13.4 nm (comparatively long duration). This wavelength
corresponds to high harmonic emission of the order 59. There is no particular method yet
that can enhance the HHG conversion efficiency to become comparable with the brightest
plasma sources, but there is room for optimism. The quasi phase matching presented in
this dissertation is one method that together with other approaches may bring high
harmonics into direct competition with plasma sources in terms of absolute yield. Quasi
phase matching of HHG with weak interfering light may prove particularly useful for the
very high order harmonics (on the order of fifties or higher) produced in neutral gases or
generated from ions where phase mismatches can be very severe and difficult to control
[50,65].

32
33
CHAPTER 2
QUASI PHASE MATCHING WITH WEAK INTERFERING LIGHT
2.1 INTRODUCTION
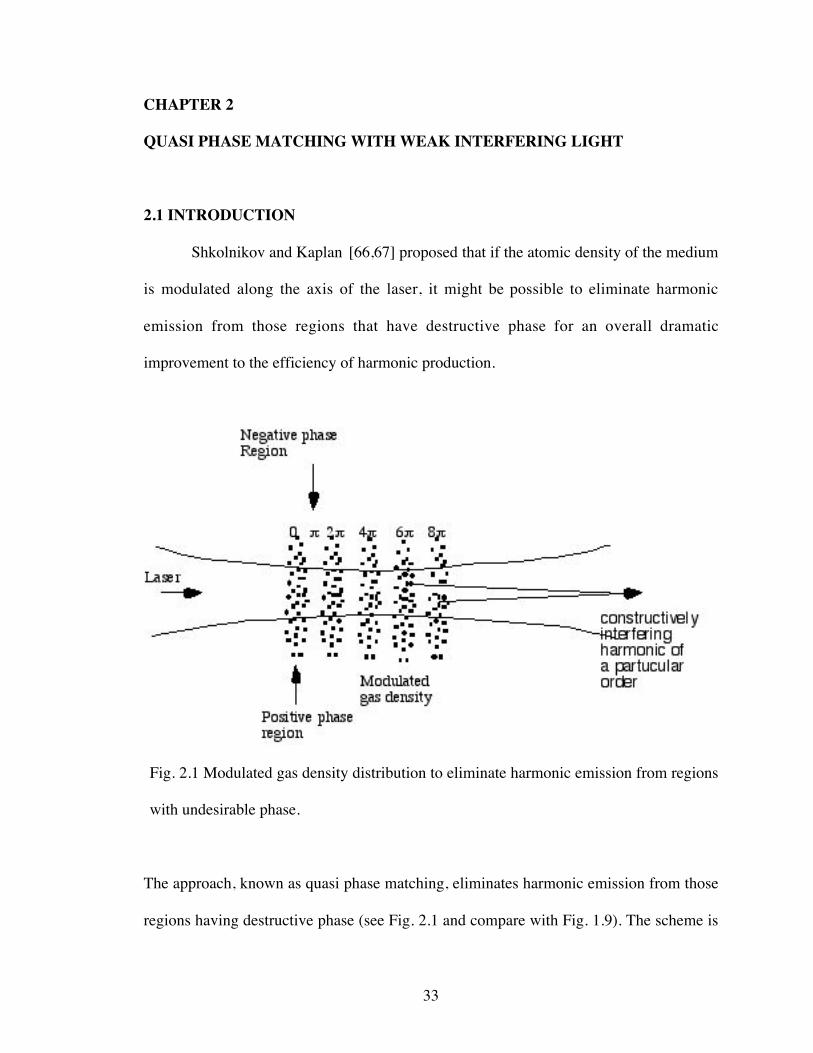
Shkolnikov and Kaplan [66,67] proposed that if the atomic density of the medium
is modulated along the axis of the laser, it might be possible to eliminate harmonic
emission from those regions that have destructive phase for an overall dramatic
improvement to the efficiency of harmonic production.
Fig. 2.1 Modulated gas density distribution to eliminate harmonic emission from regions
with undesirable phase.
The approach, known as quasi phase matching, eliminates harmonic emission from those
regions having destructive phase (see Fig. 2.1 and compare with Fig. 1.9). The scheme is

34
only able to counteract geometric phase mismatches, and does not deal with index phase
and intrinsic phase mismatches. In addition, creating such a modulated gas distribution
presents significant experimental challenges.
Fig. 2.2 Elimination of harmonic production in (a) the “out-of-phase” regions using (b) a
train of counter-propagating pulses. Weak counter-propagating pulses collide with the
forward harmonic generating pulse to frustrate emission from undesirable phase zones;
(c) harmonic emission from the gas atoms in the remaining zones then constructively
interfere.
We propose a new approach for achieving quasi phase matching in a focused laser
beam. Rather than attempting to modulate spatially either the density of the atomic

35
medium or the density of free electrons, we use counter-propagating light to disrupt
harmonic emission in specific regions of the focus. In this chapter, we analyze how even
relatively weak counter-propagating light can seriously disrupt phase matching at the
microscopic level [68].
To achieve quasi phase matching, multiple counter propagating light pulses can
be made to collide with the main generating pulse throughout the laser focus, as depicted
in Fig. 2.2. The timing and duration of these counter-propagating pulses can be chosen
appropriately to frustrate harmonic production in regions with undesirable phase. The
emission from the remaining regions then constructively interferes.
Fig. 2.3 Schematic of experiment on colliding beams (based on the proposal from
Ref.[37]).
As discussed in Chapter 1, the geometrical phase mismatches arise primarily from
the Gouy shift in a Gaussian laser focus. According to Eq.(1.23), there can be a number
36
of harmonic (coherent) phase zones along the focus, as depicted in the upper part of
Fig.2.2. The quasi phase matching technique that we propose, shown in Fig.2.3, can
address this problem by directing a series of counter-propagating light pulses into the
focus while enabling detection of the high harmonics.
As described by J. Peatross et al. [48], when an annular beam is focused, the
center fills in to produce a central peak similar to that of a usual laser focus surrounded
by faint rings. The nonlinearity of high-order harmonic generation concentrates the
harmonic production in the central peak, and the harmonics emerge as usual, centered
along the laser axis so that much of their energy lies inside of the original hole. The holes
are necessary because of the lack of suitable materials able to transmit extreme ultraviolet
light (EUV).
This approach is fundamentally different form other proposed phase-matching
methods using dual laser sources. In other scenarios, either difference-frequency mixing
[67] or angular tuning of crossing beams [69] is proposed to allow for phase matching in
a positive dispersive medium (i.e., in plasma).
2.2 MICROSCOPIC PHASE DISRUPTION IN SUPERIMPOSED COUNTER-
PROPAGATING FIELDS
Consider two plane-wave fields with real amplitudes E1 and E2 which propagate in
opposite directions towards each other. We will assume that the E1 is the larger of the
fields. We will write the sum of the two fields as a single field having the form of the
larger plane wave:
E e E e E z ei kz t i kz tt
i kz t z1 2
-( ) - +( ) - + ( )( )+ = ( )w w w f .` (2.1)

37
The total amplitude, which varies spatially, is found to be
E z E
EE
EE
kzt ( ) = +ÊËÁ
ˆ¯
+12
1
2
2
1
1 2 2cos . (2.2)
The phase modulation, which also varies spatially, is found to be
f z
EE
kz
EE
kz( ) = -
+-tan
sin
cos
1
2
1
2
1
2
1 2. (2.3)
In the limit of a very weak counter-propagating field (i.e., E E2 1<< ), the total
field reduces to that of the larger plane wave (i.e., E z Et ( ) Æ 1 and f z( ) Æ 0).
Nevertheless, even a relatively weak field E2 can cause a strong standing intensity
modulation. The fringe visibility for the standing intensity modulation is given by
V
I II I
E E
E E= -
+=
+ ( )max min
max min
2
12 1
2 12 . (2.4)
If E2 is only a tenth as strong as E1 (i.e., one hundred times less intense), the
standing intensity pattern has fringe visibility of 0.20. In this case, I max is 49% more
intense than I min. Fig. 2.4 represents the standing intensity profile for this case. By
intensity, we do not refer to net energy propagation (i.e., Poynting vector) but rather to
the square of the combined field (i.e., eo tcE z2 2( ) ). Fig. 2.4 also shows the standing
phase variation described by Eq. (2.3) as well as the relative intensity E z Et ( )( )12 and
phase f z( ) in the case that the weak field is 100 times less intense (i.e., E E2 1 0 1= . ).
The standing phase variation fluctuates over a total range of 0 06. p , which translates into
a phase variation of more than p for harmonics beyond the 15th order. As seen in Fig. 2.4,
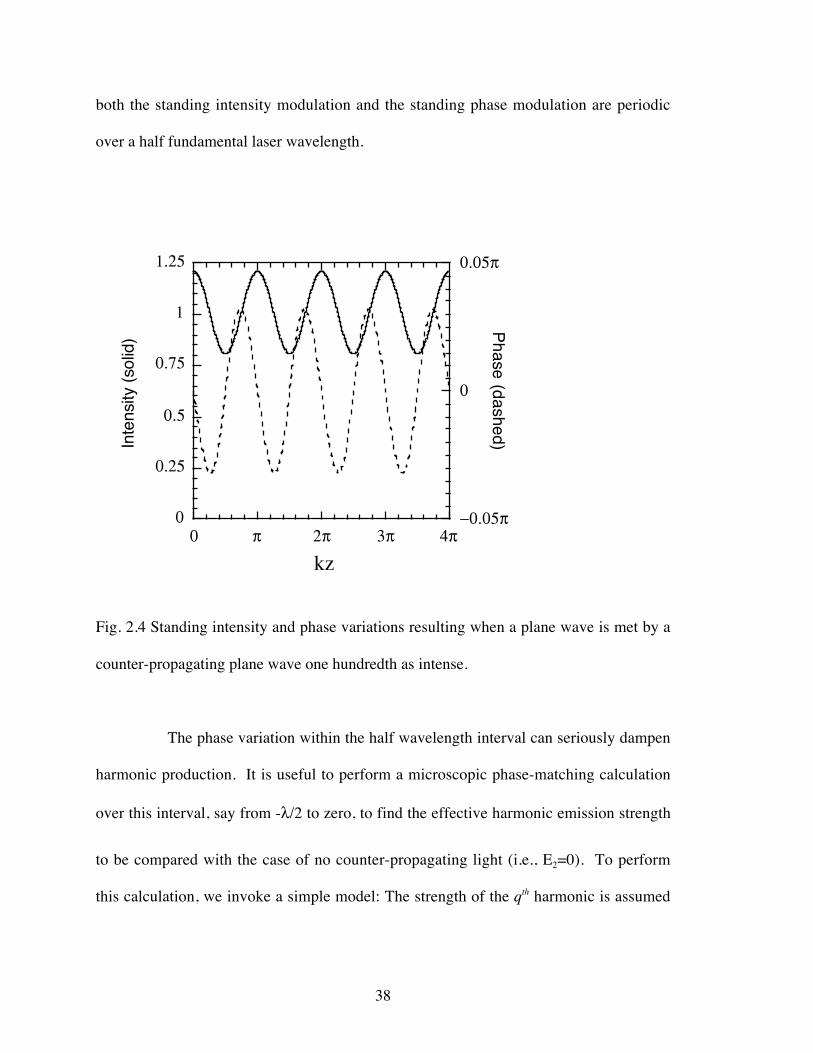
38
both the standing intensity modulation and the standing phase modulation are periodic
over a half fundamental laser wavelength.
0
0.25
0.5
0.75
1
1.25
-0.05p
0
0.05p
0 p 2p 3p 4p
Inte
nsity
(so
lid)
Phase (dashed)
kz
Fig. 2.4 Standing intensity and phase variations resulting when a plane wave is met by a
counter-propagating plane wave one hundredth as intense.
The phase variation within the half wavelength interval can seriously dampen
harmonic production. It is useful to perform a microscopic phase-matching calculation
over this interval, say from -l/2 to zero, to find the effective harmonic emission strength
to be compared with the case of no counter-propagating light (i.e., E2=0). To perform
this calculation, we invoke a simple model: The strength of the qth harmonic is assumed

39
to follow the laser field strength raised to the pth power [22]. That is, the emission from
individual atoms within the interval is proportional to
E z t E z eq tp qi kz t z, ~( ) ( ) - + ( )( )w f
. (2.5)
Forward laser light
l/2
Eq(z,t+z/c)z-direction
Fig. 2.5 Accumulated harmonic field produced from gas atoms in an interval of a half
wavelength and exiting this interval at time t.
The effective emission from the interval is found by summing up the
contributions from all participating dipoles to the net field leaving the interval (i.e., at
z=0). Fig. 2.5 represents a medium emitting a particular harmonic in a half-wavelength
interval. To obtain the net harmonic emission in the direction of the strong beam, one
integrates (along z) the emission with the time argument adjusted appropriately for a
traveling wave. The net field at the edge of the interval is proportional to
40
E z t z c dz e E z e dzqiq t
tp qi z, ~+( ) ( )
-
- ( )
-Ú Úl
w f
l2
0
2
0
. (2.6)
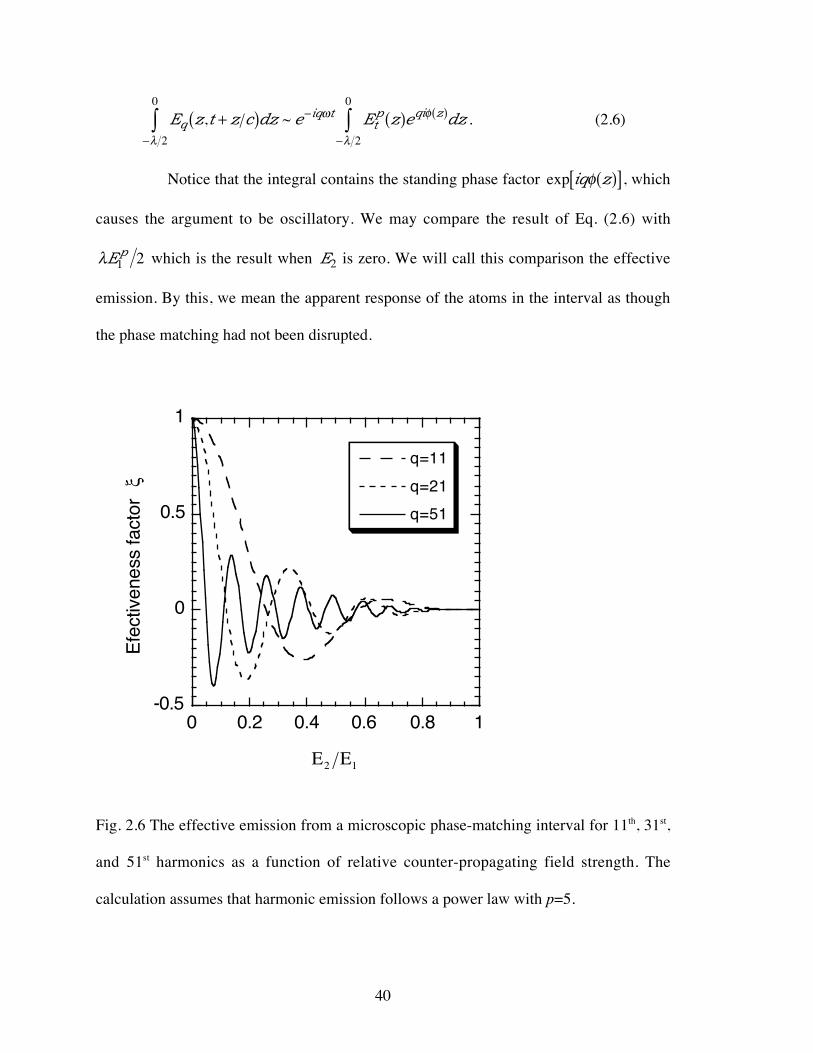
Notice that the integral contains the standing phase factor exp iq zf( )[ ], which
causes the argument to be oscillatory. We may compare the result of Eq. (2.6) with
lE p1 2 which is the result when E2 is zero. We will call this comparison the effective
emission. By this, we mean the apparent response of the atoms in the interval as though
the phase matching had not been disrupted.
-0.5
0
0.5
1
0 0.2 0.4 0.6 0.8 1
q=11
q=21
q=51
Efe
ctiv
enes
s fa
ctor
E E2 1
x
Fig. 2.6 The effective emission from a microscopic phase-matching interval for 11th, 31st,
and 51st harmonics as a function of relative counter-propagating field strength. The
calculation assumes that harmonic emission follows a power law with p=5.

41
We define a microscopic phase-matching factor as
xl
f
l
∫ ( ) ( )
-Ú2
1 2
0
EE z e dzp t
p qi z
. (2.7)
Note that x is real because E zt ( ) is even and f z( ) is odd over the interval of integration.
Fig. 2.6 shows the behavior of the effectiveness factor x for a variety of
harmonic orders as a function of counter-propagating field. In all cases, p is chosen to be
equal 5. As is evident, the emitted harmonics are significantly degraded even with a
modest counter-propagating field. For harmonic orders in the twenties or higher, a
counter-propagating field strength of only one tenth the main field is sufficient to
seriously disrupt the harmonic emission, owing to the standing phase factor exp iq zf( )[ ]
in Eq.(2.6). This means that to realize this situation experimentally, counter-propagating
pulses need only have one hundredth the intensity of the main pulse. As is also evident in
Fig. 2.6, the effectiveness of emission is zero only at a few specific counter-propagating
field strengths. However, where the effectiveness goes negative, the emission is out of
phase by p . Since the reason for suppressing the harmonic production is to eliminate
emission having the incorrect phase, the p phase change is actually more beneficial than
if the effectiveness factor were zero at the corresponding counter-propagating field
values. It should be noted that the decrease in the microscopic factor with counter-
propagating field strength is entirely due to the functional form of f z( ); if f z( ) is
arbitrarily set to zero, the result of Eq.(2.7) continually increases above one, owing to the
standing intensity modulation.
In the next chapter, we show experimentally that the microscopic phase
mismatch in colliding pulses does indeed effectively extinguish high harmonic
42
generation. We also demonstrate an overall enhancement to harmonic production when
counter-propagating light disrupts a single out-of-phase zone in the focus. The eventual
goal of our work is to produce a series of weak counter-propagating pulses with
appropriate timing and durations to suppress the emission in many regions in a laser
focus that have undesirable phase. Assuming good harmonic suppression in the “out-of-
phase” regions, overall harmonic production is expected to increase in proportion to the
square of the number of suppressed regions, since the harmonic power is proportional to
the square of the electric field. Progress towards these experiments is described in
Chapter 6.
43
CHAPTER 3
EXPERIMENTS ON HIGH HARMONIC GENERATION IN INTERFERING
LIGHT
3.1 LASER SYSTEM
The laser for the experiments described in this chapter is a chirped pulse
amplification system. A more detailed description of the laser setup is given in the
Masters Thesis of Ian Kohl [70]. I helped in the construction the laser system and in the
optimization of its performance for experiments. Further discussion of the chirped pulse
amplification techniques is addressed in Chapter 5, where the construction of a larger
laser system is described in detail.
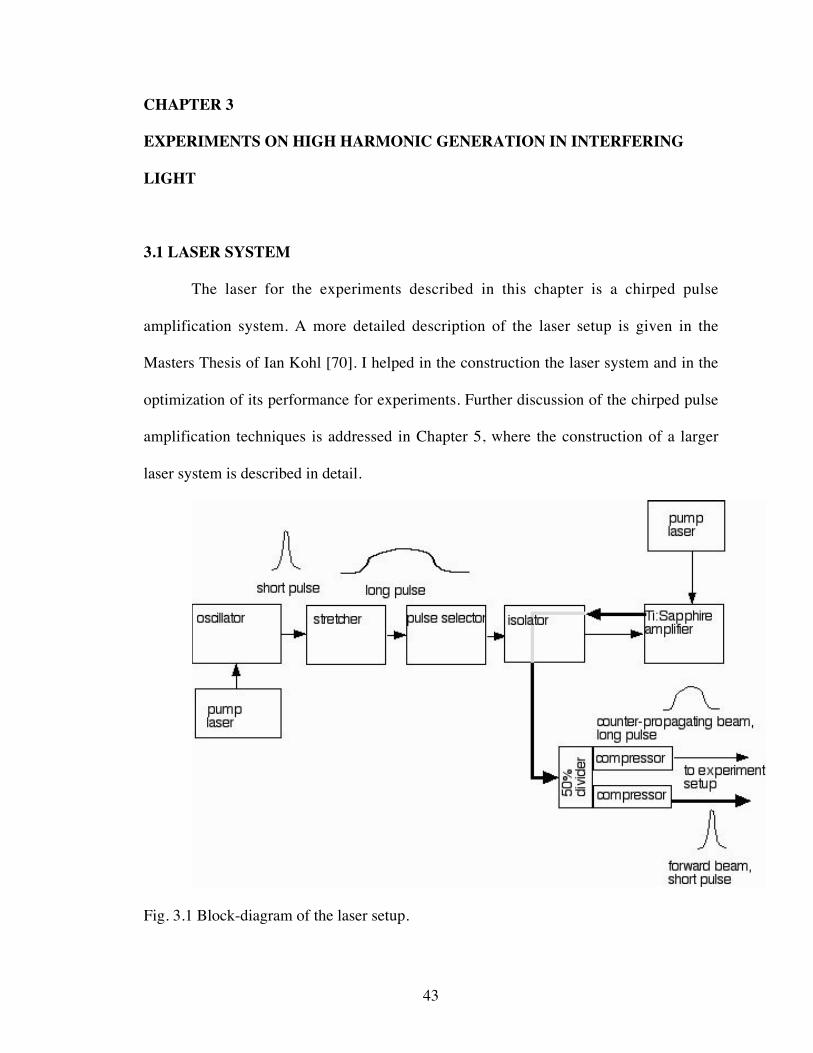
Fig. 3.1 Block-diagram of the laser setup.

44
An overview of the laser setup is shown on Fig. 3.1. Short pulses (p-polarized)
originate in the oscillator, following the design published by Henry Kapteyn and
Margaret Murnane [71]. The beam consists of a train of 18 femtosecond pulses separated
by 11 nanoseconds (the repetition rate of 90.9 MHz), which corresponds to the round-trip
time in the cavity. The oscillator is a passively mode-locked Ti:Sapphire cavity which
uses a Spectra Physics “Millenium” laser (wavelength 532 nm) as the pump source. Fig.
3.2 shows a schematic of the oscillator, stretcher, pulse selector and amplifier portions of
the laser setup [72].
Fig. 3.2 Laser system schematic.
45
The pulses are stretched in duration to avoid pulse intensities that may damage the
amplifier crystal and the other optical elements in the system. The pulses enter the
stretcher, which expands the 18fs pulses to about 70ps duration. The pulses become
negatively chirped (see Chapter 5). In our setup, the direction of p-polarization is parallel
to the optical table surface. The pulses proceed to the pulse picker, which consists of a
Quantum Technology Pockels cell #1 with two crossed polarizers on its entrance and
exit. This Pockels cell selects pulses for amplification and injects them into the amplifier
stage.
Pockels cell #1 selects a pulse for amplification at a repetition rate of 1 kHz. This
repetition rate matches the rate of available pump energy from a 1 kHz Nd:YAG laser
(Lee Lasers, series 800). As shown on Fig. 3.2, the train enters the pulse picker through a
polarizer transmitting p-polarized light only. When activated, Pockels cell #1 energizes
for only 6 nanoseconds and rotates the polarization of a single pulse to s-polarized. A
second polarizer transmits only s-polarized light (the “seed” pulse). This selected pulse
encounters another polarizer, which reflects s-polarized light and transmits p-polarized
light. A 40 cm focal length lens is used to match the size of the “seed” beam to the most
effective amplifier “mode,” which is determined experimentally. The pulse encounters
Pockels cell #2, which rotates the polarization back to p-orientation. The role of the
second Pockels cell is twofold: it acts as an isolator to prevent premature amplifier lasing
as well as a means of capturing the “seed” pulse for amplification. It also provides an
avenue for pulses to exit the multi-pass amplifier system.
The lasing in the cavity occurs for p-polarized light, which matches the Brewster
cut of the amplifying Ti:Sapphire crystal. It transmits p-polarized light with nearly 100%

46
efficiency but reflects about 26% of s-polarized light on each side. The beam in the
amplifier travels along a counter-clockwise spiral-like progression for 6 passes through
the amplifier crystal (see top view on the Fig. 3.2). Then, it gets retro-reflected to make 6
more amplification passes in the reverse direction until it re-encounters Pockels cell #2.
Since this Pockels cell is no longer energized, the p-polarized amplified pulses pass freely
through it and also through the subsequent polarizer. The measured average power of the
beam lies in the range between 0.65 and 0.90 W. This wide spread of amplified power
occurs mainly because of necessity of frequently adjusting the laser system alignment.
The Ti:Sapphire crystal is cooled to near 0-degrees Celsius, which reduces thermal
lensing effects in the Ti:Sapphire amplifying crystal.
The pump energy for the Ti:Sapphire crystal comes from two beams with
combined energy ~15 mJ per pulse. The pump beams are focused from either side of the
Ti:Sapphire crystal to a common area of diameter ~600mm Full Width at Half Maximum
(FWHM), where they overlap the aligned “seed” pulse injected into the amplifier. The
pump pulses are created in an intra-cavity frequency-doubling LBO crystal that produces
the second harmonic (532 nm) of the 1064 nm light that lases in the pump laser. The
LBO crystal phase matching is dependent on its temperature stability. If the temperature
changes by ~1∞ C, the LBO crystal performance drops ~30%. An external cooler is used
to keep the crystal temperature to within the limits of ±0.5∞ C. Since the amplifier gain
after the total of 12 passes through the Ti:Sapphire crystal is on the order of a few
million, even a small change in the pump power is followed by a significant change in the

47
amplified signal. This inherent instability posed some challenges while running
experiments, but with patience it was possible to proceed.
3.2 HARMONICS PRODUCTION AND DETECTION SETUPS
For our experiment, we required two laser pulses, a short forward propagating and
a longer counter-propagating pulse. Fig. 3.3 shows the schematic of the compression
stage of the laser amplifier together with the setup used for harmonic production and
detection. After the beam exits the amplifier, it is expanded up to few millimeters in
diameter; hence, we significantly reduce its intensity. The beam encounters a 50% beam
splitter just before the compression stage. The compression stage consists of two
independent parallel grating modules, one to achieve the shortest possible duration of the
forward pulse and a second for creating a somewhat longer pulse (typically, 1ps) for the
counter-propagating beam. The pulses are sent side-by-side through the compression
grating pairs. A delay stage controls the relative arrival timing of the two pulses. The two
beams enter the experimental chamber from different directions. The forward (main)
strong beam generates high harmonics, and the other beam provides the weak counter-
propagating light. The shortest measured duration of the forward pulse that is achieved
with this laser system is 30 fs (FWHM).

48
Gas jet
Grating MCP
Translationstage
Delaystage
Beam splitter
Dual-beamcompressionsetup
Counter-propagatingpulse
Harmonics
Maingeneratingpulse
Gratings
M
CCD
10-2 torr 10-6 torr
Fig. 3.3 Compression, harmonics generation (interaction), and detection chambers.
We used a standard auto-correlation technique to measure the forward pulse
duration and a cross-correlation technique to measure the counter-propagating pulse
duration relative to that of the short forward pulse. For this purpose, it was necessary to
disrupt the experiment and divert the beams to the auto- and cross-correlation setups. A
more detailed description of the correlation technique is given in Chapter 6.
The experimental chamber consists of a vacuum-tight stainless steel chamber
body with attached Varian 500 l/s turbo pump and scroll roughing pump. The laser beams
enter through ports. In the case of the forward beam, a 30 cm focal-length lens functions
as the vacuum window. The other beam enters the chamber through a flat 800nm AR-
coated glass window; the beam passes through a 30cm lens inside the chamber. A gas jet

49
is placed on an adjustable arm that can move in three dimensions. A CCD camera and a
flat mirror enable simultaneous viewing of the colliding beams from the perpendicular
direction and at an angle at ~45∞ from above.
The counter-propagating light is directed to the intersection area through a 30-cm
focal-length lens and a flat mirror with a 2.5 mm diameter hole drilled through. The hole
provides an avenue for high harmonics emerging in vacuum to be measured while
allowing some fraction of counter-propagating beam energy to be reflected towards the
focus. The hole is necessary because of the lack of suitable materials able to transmit high
harmonic (EUV) light.
The spatial alignment of two colliding pulses is crucial since in order to have the
superposition of the beams required for the experiment, the beams must be collinear [73].
Each beam waist is on the order of few tens of micrometers. Fig. 3.4 shows the measured
focal dimensions of both beams.
Fig. 3.4 Focal measurements of the (a) forward-propagating beam and (b) the counter-
propagating beam.
The counter-propagating light gets reflected from the center of a flat mirror 25 cm
before the focus (5 cm after the focusing lens). The beam’s diameter is 6.3 mm when it

50
hits the mirror. The mirror has a 2.5 mm hole drilled through its center, which cuts a
portion of the beam’s energy. Even though the counter-propagating beam loses its central
part to the mirror with the hole, its focused profile is similar to that of the forward beam,
as is evident in Fig. 3.4. The hole allows about half of the counter-propagating pulse
energy to be directed towards the laser focus.
Fine spatial adjustment of the counter-propagating beam to the forward beam is
accomplished with the mirror labeled M in Fig. 3.3. A tilt to this mirror in either
dimension moves the beam focus perpendicular to the direction of propagation. For our
experimental setup, the foci become misaligned (i.e. the counter-propagating beam’s
focus moves laterally by ~15µm), when the knob on mirror M is rotated by only
3 degrees. This makes the alignment difficult and tedious albeit possible.
The jet is approximately 300 µm wide and is backed with argon gas with pressure
between 20 to 150 torr. In the experiments, the duration of the chirped, weak counter-
propagating pulse was set to approximately 30 times longer than that of the forward
pulse. Owing to the duration of the counter-propagating pulse, the two pulses encounter
each other in a region with width similar to the thickness of the gas jet (300mm). Since
both beams travel with the speed of light in opposite directions near the gas jet, the
interaction region length is effectively half the length corresponding to the duration of the
counter-propagating pulse. The useful duration of the counter-propagating pulse is about
twice the FWHM, so the effective interaction distance is about 1ps / c = 300mm, where c
is the speed of light in vacuum.
Of critical importance is the temporal alignment between the two beams since
they must arrive to the gas jet at the same time. This short interaction length (sub-

51
millimeter) creates significant challenges in the temporal alignment. Prior to an
experiment, we back-fill the chamber with air and temporally re-compress the duration of
counter-propagating pulse so that it ionizes a track through the air similar to the track
made by the forward pulse. Rayleigh scattering from the resulting free electrons is
observed with a CCD camera. As shown in the Fig. 3.5, a distinctively higher amount of
Rayleigh scattering occurs from the region where the two pulses collide. From this
observation, the timing of the two beams can be set.
1.2mm
Fig. 3.5 Appearance of excess Rayleigh scattering (a bright dot) from colliding pulses in
air.
We explored different search techniques to find the intersection point of the
colliding pulses. It was necessary to adjust the delay stage and mirror M of Fig. 3.3 in an
iterative search. The Rayleigh scattering from the collision area is monitored
52
simultaneously in two dimensions with a CCD camera connected to a TV monitor. This
assures both spatial and temporal alignment of the two pulses. As the chamber is
evacuated, the excess Rayleigh scattering from the collision point can also be observed in
the gas jet when backed with the gas pressure of a hundred torr or more. The increased
scattering is due to enhanced ionization, owing to the interference between the two
pulses. After alignment, the counter-propagating pulse is chirped to the necessary pulse
duration. Since this requires the distance between grating pair in the compressor to be
changed, the arrival time of the pulse must be simultaneously adjusted using the delay
stage. In this way we guarantee that the pulses still meet in the gas jet.
A distinct advantage to using weak counter-propagating light is that it does not
harm or alter the medium as it passes through. The weak counter-propagating pulse
cannot ionize the medium significantly. Thus, the counter-propagating light can meet the
main generating pulse at any point in the medium without affecting regions yet to be
encountered by the main generating pulse. The arrival time of the short forward pulse can
be scanned to produce harmonics at different locations throughout the medium while
interacting with the wide counter-propagating pulse. The disadvantage of using the
counter-propagating beam is that, even though its power is relatively small, it travels
back to the laser system where it runs the risk of damaging the optics. However, the weak
counter-propagating light traveling back to the Ti:Sapphire crystal has an advantage in
the case when the amplifier works in a saturation regime. The crystal emits some
spontaneous radiation in all directions, but the presence of backward traveling counter-
propagating beam takes some of that energy for coherent amplification. Thus, the
presence of the counter-propagating beam significantly decreases the amount of

53
spontaneous radiation emitted from the crystal. If we periodically block and re-open the
spatially aligned counter-propagating beam, we may observe the effect of the dimming of
the spontaneous emission from the Ti:Sapphire crystal with the same periodicity. This
effect is a nice tool for spatial alignment of the colliding beams. After both beams are
spatially aligned, the temporal alignment is just a straight-forward search for the excess
Rayleigh scattering (bright dot) mentioned earlier in this section. We do it by means of
adjusting the arrival time of the forward beam while moving the delay stage back and
forth.
The spectrometer design is explained in more detail in Natan Terry’s
undergraduate thesis [74]. I helped to construct the spectrometer. The high harmonics are
detected using a 600-lines-per-millimeter grazing-incidence tungsten-coated grating
prepared on BK-7 substrate with 1-meter radius of curvature. The grating has relatively
high reflectivity in the EUV spectrum range. It disperses different harmonic orders
spatially and focuses them onto a Micro Channel Plate (MCP) placed along a section of
the grating’s Rowland circle. The MCP is coupled to a phosphorus screen to visualize the
harmonics. A CCD camera is used to observe the light emission pattern on the phosphor
screen. The CCD camera is read by a Spiricon beam profiler connected to a PC computer
running LabView software. The detection chamber is connected to the harmonic
production chamber via an intermediate section necessary for differential pumping of the
experimental setup. The intermediate section includes its own 65 liter/sec Balzer turbo
pump. The detection setup consists of the following:
1) a vacuum-tight stainless steel chamber body with 70 liter/sec Varian turbo pump and a
cold cathode pressure gauge;
54
2) an EUV diffraction focusing grating;
3) a rotational and translational stage for adjusting the grating angle and distance to the
MCP for proper focusing of particular harmonics.
The detection setup is designed to resolve harmonics of orders 7 through 35
focused by the grating onto the MCP. The pressure in the interaction chamber is
maintained below 10-2 torr despite the large “leak” that is the gas jet. From our
observations, the pressure in the chamber is low enough to avoid serious re-absorption of
the harmonics traveling from the focus to the detection chamber. Nevertheless, the
pressure in the detection chamber must be on the order of 10-5 torr or lower for the MCP
to function properly (the reason for the 3-stage differential vacuum-pumping scheme).
Small apertures (~3 mm diameter) are used to isolate the three pumping chambers. The
grating diffracts the harmonics into a horizontally dispersed series of vertical lines on the
phosphor screen. Many harmonic orders can be resolved and observed simultaneously.
The lines pattern can be observed by eye and also using a CCD camera. A typical CCD
camera image is similar to that shown in Fig. 4.5.
3.3. LASER SYSTEM ANOMALIES
We observed spectral splitting of the high harmonic signal during some of our
experiments. We determined that the splitting has origins in the laser oscillator system
rather than in the dynamics of the harmonic generation phenomenon [75]. Since the
oscillator used in this system is a “home-made” system, many of its parameters need
optimization and frequent re-adjustment during operation. For instance, we observed that
the oscillator prefers to double-pulse when its pump power is just above 4.25 W. The

55
double pulsing is especially frustrating in the presence of feedback from the amplification
stage or when some mechanical stress is introduced to the optical table. When the
oscillator is double-pulsed, each of the two pulses generates harmonics. Typically, the
separation between pulses can be a few nanoseconds, or sometimes a few picoseconds.
The two pulses have slightly different spectral content centered on different wavelengths,
so the pulses produce slightly different harmonic frequencies during experiments. In our
detection system, the two lines representing the qth harmonic appear close enough to each
other to give the appearance of one line, slightly split. The double pulsing is an especially
undesirable defect because the amplified pulse energy gets divided into two parts with
some unknown proportionality factor. Each of these two pulses has energy lower than
that in the ideal case of no double pulsing. This frustrates the production of higher
harmonic orders. If this defect occurs randomly or on purpose by introducing some stress
into the oscillator, it can be detected by a sudden decrease in the highest harmonic order
produced. The double pulsing can also be detected in the focus as multiple bright plasma
dots (in the case when both pulses are well compressed). The most obvious detection of
multiple pulsing is seen using the cross-correlation technique (see Chapter 6).
The energy of the laser system differs over time by ~10%. This results in the
harmonics significantly changing their brightness over short periods of time. There may
be more than one factor that contributes to this unstable performance. The Ti:Sapphire
crystal might be working in an under-saturation regime. While the gain in our amplifier is
~4 times per pass (12 passes total), the total amplification gain is on the order of few
million. Even a slight change in the oscillator pulse energy, or pump pulse energy, can
cause large changes in the amplified signal. When the amplifier medium is saturated, the

56
erratic pulse energy fluctuation is limited and helps the amplified pulse energy to be more
stable. In addition, certain modes of the oscillator produce pulses, whose energies differ
from shot to shot. The thermal effects in the amplifying Ti:Sapphire crystal also affect its
performance. This unstable shot-to-shot operation is mitigated by averaging data from
hundreds of laser shots using a computer acquisition program.
3.4 CONTROL OF LASER HIGH HARMONIC GENERATION
Each of the two beams is focused using a 30 cm focal-length lens. The beam
diameter at each lens is 7.5mm, providing f/40 focusing. The laser wavelength is centered
on 800nm. The two beams have equal energies of ~0.15mJ. The duration of the
generating laser pulse is measured by autocorrelation to be 30fs (FWHM), producing a
peak intensity of approximately 5¥1014 W/cm2 on a 50mm diameter focal spot (measured
from 1/e2 intensity). The focused beam is 1.2 times diffraction limited.
The gas nozzle consists of a 3mm section of a syringe needle with 300 mm
diameter. It is positioned at the collision point of the two pulses. The temporal alignment
of the counter-propagating pulse is marked in a cross-correlation setup between the two
pulses. The duration of the counter-propagating light is adjusted by changing the
compression grating separation and thereby introducing chirp. The pulse duration gets
lengthened to 1ps (FWHM), measured by cross-correlation with the forward-propagating
pulse. When the counter-propagating pulse is strongly chirped, the collision of the two
pulses cannot be discerned through Rayleigh scattering from ionized electrons. However,
the temporal alignment is assured by monitoring the cross correlation of the two beams.
The gas nozzle is positioned just at the edge of the colliding laser beams where the

57
thickness of the gas flow is similar to the thickness of the nozzle opening. The gas flows
continuously during the experiment. The backing pressure for the experiment is typically
a few tens of torr.
0
50
100
150
-2 -1 0 1 2
23
rd H
arm
on
ic (
arb
. u
nits
)
Counter-propagating delay (mm)
Fig. 3.6 Harmonic signal as a function of counter-propagating pulse delay with a narrow
gas distribution.
The highest harmonic produced in argon observed under our laser conditions is
the 31st. Fig. 3.6 shows the relative emission of the 23rd harmonic produced in argon with
a jet backing pressure of 20 torr. The relative arrival time of the 1ps counter-propagating
pulse has been scanned (plotted as a function of delay stage shift). We checked that when
the counter-propagating pulse arrived either well before or after the main generating
pulse, the harmonic production was the same with or without the counter-propagating
light. This rules out the possibility that the counter-propagating light harms the medium
(e.g., through ionization). The intensity of the counter-propagating light is lower than the

58
main generating pulse intensity by roughly a factor of 60. Thus, its intensity is
insufficient to ionize the medium significantly.
As is evident in Fig. 3.6, the harmonic generation process is turned off, nearly to
the point of extinction. The contrast for the 23rd harmonic is approximately two orders of
magnitude. Similar behavior is seen for the neighboring harmonics, although the lower
harmonic orders (i.e. the teens) do not show as strong an extinction. This is expected
since a stronger standing phase modulation on the laser field is required to suppress the
lower harmonic orders.
In the actual experiment, the envelope of each laser pulse varies in time, in
contrast with true plane waves. This is especially true of the well-compressed forward-
traveling pulse. Moreover, the counter-propagating pulse we use in the experiments is
chirped so that the frequencies of the colliding pulses do not necessarily match
everywhere in the collision region. Nevertheless, as evidenced by the experimental
results, the details of how the pulses vary somewhat from true plane waves are not critical
to achieving strong suppression of harmonic buildup. It is possible that intensity-
dependent intrinsic phases also play a role [76].
We created poor phase matching conditions by moving the gas jet away from the
laser focus a distance of 1mm. This produced a gas distribution in the laser focus
approximately 1 mm thick. The backing pressure was increased to 50 torr in order to
maintain pressure at the interaction area similar to what we had in the previous
experiment. In the absence of counter-propagating light, the 23rd harmonic emission with
the wider gas distribution was very poor due to a severe phase mismatch, arising mainly
from geometrical effects owing to the Gouy shift. The Rayleigh range of each laser beam
59
is approximately z0 = 2 mm. Near the focus, the phase mismatch becomes p over a
distance of roughly Dz= 0.3 mm (coherence length for 23rd harmonic). Therefore, we
estimate there to be approximately three phase zones within the gas distribution (see
Eq.(1.23) in Chapter 1), the outer two zones having the same phase and differing from the
center zone by p. The result is very poor emission of the 23rd harmonic because the
center zone with its higher gas density presumably offsets the emission from the other
zones.
Fig. 3.7 shows the emission of the 23rd harmonic as a function of the counter-
propagating pulse delay. Since the gas distribution is much thicker, the 1ps counter-
propagating pulse is only able to interact with the generating pulse over a fraction of the
gas distribution (i.e., approximately one phase zone). As seen in Fig. 3.7, the harmonic
emission shows a dramatic increase, as the counter-propagating light is able to suppress
harmonic emission in a portion of the gas jet. This restored the signal to about the level
when the jet is close to the laser beam in the absence of counter-propagating light. The
curve also gives direct evidence for the thickness of the gas jet.
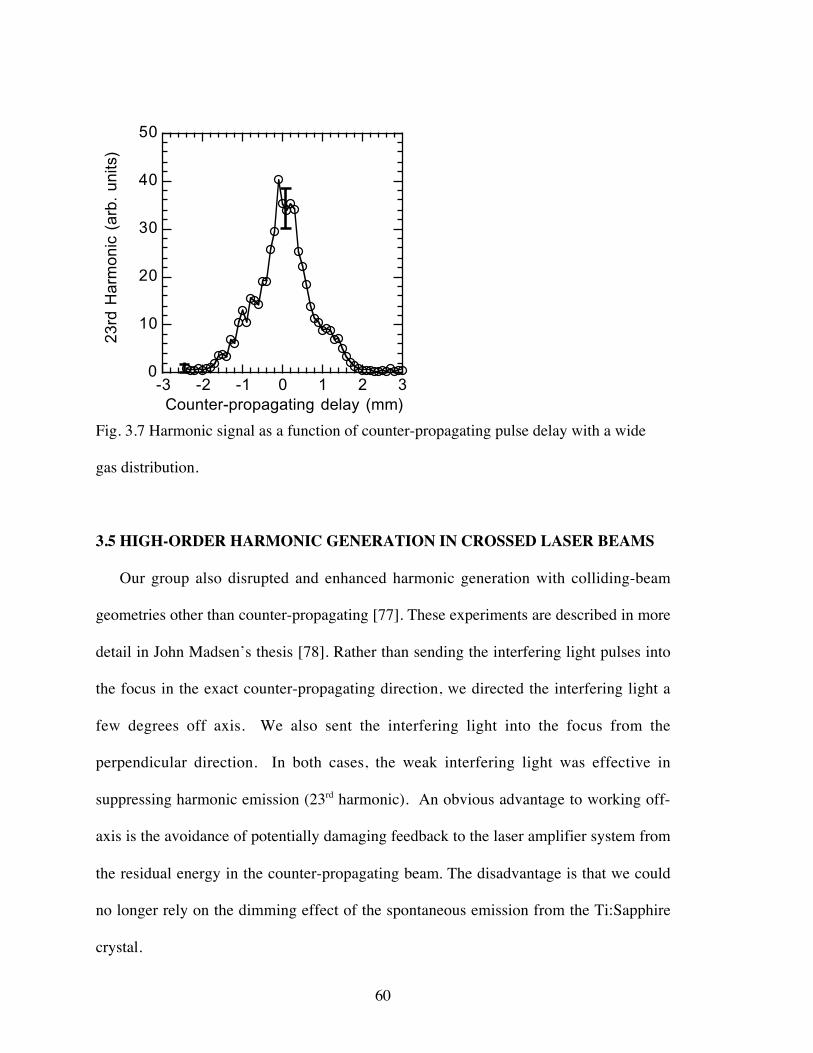
60
0
10
20
30
40
50
-3 -2 -1 0 1 2 3
23
rd H
arm
on
ic (
arb
. u
nits
)
Counter-propagating delay (mm)
Fig. 3.7 Harmonic signal as a function of counter-propagating pulse delay with a wide
gas distribution.
3.5 HIGH-ORDER HARMONIC GENERATION IN CROSSED LASER BEAMS
Our group also disrupted and enhanced harmonic generation with colliding-beam
geometries other than counter-propagating [77]. These experiments are described in more
detail in John Madsen’s thesis [78]. Rather than sending the interfering light pulses into
the focus in the exact counter-propagating direction, we directed the interfering light a
few degrees off axis. We also sent the interfering light into the focus from the
perpendicular direction. In both cases, the weak interfering light was effective in
suppressing harmonic emission (23rd harmonic). An obvious advantage to working off-
axis is the avoidance of potentially damaging feedback to the laser amplifier system from
the residual energy in the counter-propagating beam. The disadvantage is that we could
no longer rely on the dimming effect of the spontaneous emission from the Ti:Sapphire
crystal.

61
For both off axis cases, we created poor phase matching conditions by moving the
gas jet away from the laser focus a distance of 1 mm. We estimated that this produced a
gas distribution in the laser focus approximately 1 mm thick. The pressure in the wider
gas distribution was adjusted to 2-4 torr (with increased backing pressure). Under these
conditions, there was more than one phase zone within the gas distribution, which
resulted in very poor emission for the 23rd harmonic. Again, we were able to restore the
harmonic production with the interfering laser pulse crossing the primary beam in a
region of the focus.
3.6 CONCLUSION
We have demonstrated that it is possible to “turn off” harmonic production with
relatively weak interfering light [72,77]. The interfering light may intersect the primary
laser pulse at virtually any angle (other than near co-propagating with the primary laser
pulse). We have shown that our approach is an effective tool for quasi phase matching.
However, these results, which constitute the central message of this dissertation, merely
show proof-of-principle that the quasi phase-matching approach works. The next step is
to apply the technique to much higher harmonic orders (where better phase-matching
techniques are most needed) and to utilize multiple counter-propagating pulses for a
substantial boost to harmonic output. For this purpose, we have constructed a larger laser
system, capable of producing up to two orders of magnitude more energy per pulse. The
new laser system is described in Chapter 5. The experimental setup for producing high
harmonics is described in Chapter 6. With the new system, we expect to generate
harmonics beyond 100 orders from neon. Although, I have constructed the new laser
62
system, the experiments that will be performed with it are not included in this
dissertation.
When considering quasi phase matching with counter-propagating light, one
should keep in mind that there is an efficiency cost associated with diverting laser energy
into an interfering beam; if the energy is retained in the forward beam, presumably a
somewhat larger focus could be used to increase the harmonic output. Nevertheless,
because only relatively low intensity is required in the interfering beam, the amount of
energy required for even a comparatively long interfering pulse is modest, and the
potential for an over all efficiency gain is substantial, especially in situations where the
phase matching is otherwise poor (higher order of the observed harmonics, higher free
electron concentration in the laser plasma, etc.).

63
CHAPTER 4
DEVELOPMENT OF COMPACT EXTREME ULTRAVIOLET
REFLECTOMETER
4.1 INTRODUCTION
High-order harmonic are polarized, highly directional and coherent (i.e.,
focusable). As discussed in Chapter 1, the harmonics form a comb of frequencies with
nearly uniform intensity throughout the EUV spectral range (the “plateau”) of
wavelengths ranging from a few nanometers to hundreds of nanometers. This radiation
comb of wavelengths can be utilized to perform EUV spectroscopic reflectometry on
various sample surfaces.
As was described in Chapter 3, a compact laser source constructed at Brigham
Young University reaches intensity up to 1015 W/cm2. This is sufficient to produce high-
order harmonics of the 800 nm laser light in argon gas. As mentioned in Chapter 1, the
efficiency of converting the high-intensity laser light into a particular harmonic order is
typically quite low, on the order of 10-7 (31st harmonic, wavelength 26 nm). However,
this provides a flux of about 109 photons per laser shot for a harmonic order in the
twenties.
Reflectometry that utilizes the high harmonics has not been previously developed.
The commonly used sources of EUV light are synchrotrons and plasma sources. One
advantage of the harmonics compared to a plasma source is that they are polarized
(similar to a synchrotron source), and the polarization can be easily rotated using a half-
wave plate placed in the laser beam before the harmonic production vacuum chamber.

64
Another advantage of the harmonics is the broad spectral coverage. In this chapter I show
that it is feasible to utilize a wide range of harmonics simultaneously.
Spectroscopic reflectometry is an important tool for thin film metrology and for
finding optical constants [79]. Optical constants define how light interacts with a
material. The optical constants of materials often depend on the fabrication methods.
Hence, one must determine the optical constants for the particular methods used rather
than to rely on handbook values for the elements involved. Reflectometry measures the
power ratio of reflected s- and p- polarizations. Polarized reflectometry measurements
typically utilize synchrotron radiation as a light source [80]. However, synchrotron
sources are expensive and unavailable to some research teams. The relatively inexpensive
plasma source has the disadvantage of not being polarized as well as of sparseness of the
available wavelengths. As a consequence, many of the optical constants of materials used
in thin films are not well known in the EUV range.
Ellipsometry, in general, is a more powerful method to measure optical constants
and thin film layer thicknesses [81]. Ellipsometry reveals the complex reflection
coefficients of a surface, whereas reflectometry reveals only the amplitudes of those
coefficients. However, ellipsometry requires a means of measuring change of polarization
state upon reflection. Thus, special EUV light analyzers of polarization are required [81-
85], which are not available at our research group. This chapter discusses preliminary
proof-of-concept experiments on EUV polarized reflectometry using the laser high
harmonics.

65
4.2 HIGH-ORDER HARMONICS AS A SOURCE OF POLARIZED EUV LIGHT
The experimental setup for producing and detecting high-order harmonics is
shown in Fig. 4.1. The 30fs laser pulses, having focused intensity 1014 -1015 W/cm2 and
repetition rate of 1 kHz, interact with a low-density jet of argon gas in the vacuum
chamber. The spectral “comb” of high-order harmonic beams produced in the jet
emerges from the focus as coherent beams embedded in the residual laser beam [12-14].
Turbo pump
roughing scrollpump,~10-2 torr
Apertures fordifferential pumping
gas jet
l/2 rotatablewave-platechanging orientation of linear polarization
Focusing lens
Phosphor screen
turbo pump,~10-6 torr
MCP
EUVgrating
Flange
p-polarizedinsident800 nmlight
extension
Fig. 4.1 High harmonics are generated in a jet of argon gas in vacuum chamber.
High-order harmonics can only be produced in linearly polarized laser light
interacting with an atomic gas. Assuming the classical model for the harmonic generation
(see Chapter 1), the harmonics bear the same polarization orientation as the incident light.
Thus, we can produce pure s- or p- polarizations, relative to a sample surface. We use a
half-wave plate to change the orientation of linear polarization of the harmonics simply

66
by rotating the polarization of the 800 nm light. Then, the linearly polarized laser light is
focused with f/50 geometry to a gas jet with a 300 mm diameter nozzle.
The setup consists of three vacuum chambers: the harmonic production
(interaction) chamber, the intermediate chamber (for differential pumping) and the
detection chamber. Despite a backing pressure of few tens of torr on the gas jet, the
pressure in the harmonics production chamber is on the order of 10-2 – 10-1 torr. This low
pressure helps avoid re-absorption of the EUV light in the gas used to produce it.
Moreover, we decrease significantly the total path length for the harmonics within the
focus by using a special extension to the intermediate chamber. This extension, shown in
the Fig. 4.1, has a 3 mm diameter hole (aperture) on its end to reduce the gas flow into
the intermediate chamber from the interaction chamber. The exit of the intermediate
chamber also has a small aperture for the same purpose. The three-stage differential
pump system reduces the pressure near the MCP detector, which is similar to one
described in Chapter 3.
In order to evaluate the Polarization Dependent Loss (PDL) for the EUV grating,
we must calibrate s- and p- polarized light reflectivity in the spectral region of interest.
The definition of PDL commonly used in the characterization of its diffraction gratings
[86] is
PDL p
s
=ÊËÁ
ˆ¯
10 10logee
, (4.2)
where e p and es are the measured diffraction efficiencies for p- and s-plane polarized
incident light, respectively. The PDL is expressed in decibels.

67
We produced high-order harmonics of pure s- and pure p- polarizations, and
compared the reflected signals. The results, Fig. 4.2, suggest that there is little difference
between s- and p-polarized grating diffraction for wavelengths ranging from 27nm to
61nm. This is somewhat surprising. The harmonic signal varies from shot to shot, so that
we averaged hundreds of laser shots for each picture. We used a PC computer running a
LabView software to collect and process a series of digitized images taken with the CCD
camera. As is seen from the figure, the PDL is assumed to be very close to zero since the
grating response in the measured spectral range is similar for both s- and p- polarizations.
0
50
100
150
200
250
300
0 20 40 60 80 100 120
Grating Calibration, Jet backed 40 torr Ar
No Sample, S-polNo Sample, P-pol
Ha
rmo
nic
sig
na
l (a
rb.
un
its)
Harmonic number
13 15 17 19 21 23 25 2729
Fig. 4.2 EUV grating calibration showing similar response for either s- or p- polarized
light for the harmonic orders 13-29.

68
4.3 REFLECTOMETER SETUP
Undergraduate students Greg Harris and Richard Curras helped to construct most
of the reflectometer setup. We optimized the setup design and produced the experimental
data. The setup, shown on Fig. 4.1, was made such that the EUV grating chamber can be
easily turned 90 degrees counterclockwise (as seen on the top view on figure). We install
two surfaces for testing in the middle of the chamber at 45∞ to the incident harmonics.
The 45-degree angle is chosen since it is very close to Brewster’s angle for the EUV light
spectra. The high-harmonic reflectometer instrument is shown in Fig. 4.3.
Phosphor screen
MCP
turbo pump~10-6 torr
Apertures fordifferential pumping
gas jet
Flange
Sample andreferencewafers
Sample
Reference
EUVgrating
CCD
l/2 rotatablewave-platechanging orientation of linear polarization
Focusing lens
roughing scrollpump,~10-2 torr
p-polarizedinsident800 nmlight
Turbo pump
extension
Fig. 4.3 Reflectometer setup.
We installed two thin flat wafers in the detection chamber, one called the
“reference,” and the other called the “sample.” Half of the harmonic beam hits each wafer
so that the reflectivity of both can be measured simultaneously. The reference and the

69
sample wafers are aligned such that the harmonics reflected from the wafers are separated
spatially as they travel to the MCP (Fig. 4.4).
Fig. 4.4 Reflected from both wafers, the EUV signals are simultaneously resolved using a
focusing diffraction grating.
Reflected signals are detected on the MCP (Fig. 4.5). We have chosen a “pure”
silicon wafer (with residual silicon oxide film on silicon substrate film, ~18 Angstrom
thick) as the “reference” and a second silicon wafer with a ~250-Angstrom silicon oxide
film as the “sample.” These wafers were surplus samples that were given to us by
Professor David Allred. They were not new and may have been exposed to unknown

70
contaminants. Nevertheless, they were adequate for performing proof-of-principle
reflectometry measurements.
Fig. 4.5 S-polarized high harmonics registered on the MCP after being reflected
simultaneously from the “sample” (upper) and the “reference” (lower) wafers.
Fig. 4.5 shows a digitized snapshot taken from the CCD camera for s-polarized
light. Harmonics reflected from the reference and the sample film are both displayed.
Harmonics ranged from the 13th to the 27th order are observed. In order to evaluate the
feasibility of using the high order harmonics in this reflectometer scheme, we have
measured signals for both s- and p-polarizations reflected from the wafers. The
comparison is shown on Fig. 4.6.
The harmonic signals are measured simultaneously on each sample for a given
polarization, which is an attractive feature of the EUV reflectometer design. Fig. 4.6
indicates significant differences between the reflectivities of s- and p- for most
wavelengths. Figures 4.6 (a) and (b) also indicate that the signals reflected from each
wafer vary, presumably because the wafers have different thicknesses of SiO2 coatings.

71
Harmonics reflected from the “reference” (thinner oxide film) appear to reflect low-order
spectral components better while harmonics reflected from the “sample” appear to reflect
higher spectral components better.
Fig. 4.6 S- and p-polarized high harmonic signals reflected at 45-degrees angle from (a)
the “reference” wafer and (b) the “sample” wafer.
Some anomalous effects occur if the pressure for producing harmonics is too
high. As seen in Fig. 4.7, harmonics of higher orders have higher intensity if the gas
density (backing pressure) is kept lower. This may happen in part because of pressure-
dependent harmonic beam deflection so that the test and reference substrates are not
illuminated the same. In fact, whether each wafer is illuminated equally is general
concern that should be investigated. To eliminate this potential problem, we could raster
the wafers up and down such that whole harmonics beams hit each wafer in an alternating
fashion. Also, we might use a gas cell instead of the jet since the gas flowing from jet into
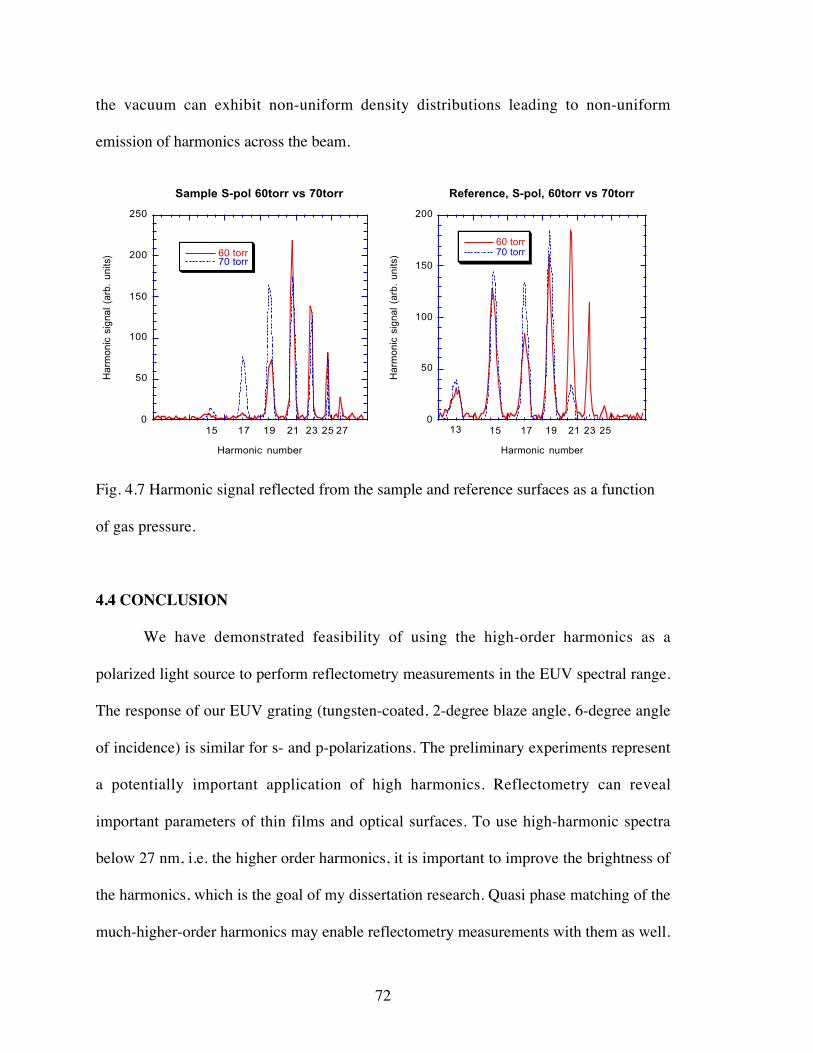
72
the vacuum can exhibit non-uniform density distributions leading to non-uniform
emission of harmonics across the beam.
0
50
100
150
200
250
Sample S-pol 60torr vs 70torr
60 torr70 torr
Har
mon
ic s
igna
l (a
rb.
units
)
Harmonic number
272523211917150
50
100
150
200
Reference, S-pol, 60torr vs 70torr
60 torr70 torr
Har
mon
ic s
igna
l (a
rb.
units
)
Harmonic number
13 252321191715
Fig. 4.7 Harmonic signal reflected from the sample and reference surfaces as a function
of gas pressure.
4.4 CONCLUSION
We have demonstrated feasibility of using the high-order harmonics as a
polarized light source to perform reflectometry measurements in the EUV spectral range.
The response of our EUV grating (tungsten-coated, 2-degree blaze angle, 6-degree angle
of incidence) is similar for s- and p-polarizations. The preliminary experiments represent
a potentially important application of high harmonics. Reflectometry can reveal
important parameters of thin films and optical surfaces. To use high-harmonic spectra
below 27 nm, i.e. the higher order harmonics, it is important to improve the brightness of
the harmonics, which is the goal of my dissertation research. Quasi phase matching of the
much-higher-order harmonics may enable reflectometry measurements with them as well.

73
A future goal is the development of ellipsometric capabilities. It will be necessary
to develop an analyzer capable of measuring the orientation of the polarization ellipse to
determine the phase differences between the complex reflection coefficients for s- and p-
polarized light.

74
75
CHAPTER 5
CONSTRUCTION OF HIGHER-POWER LASER SYSTEM
5.1 INTRODUCTION
The experiments reported in Chapter 3 showed feasibility of using weak
interfering light as an effective tool for achieving the quasi-phase matching. Using the
theory and techniques explained in Chapters 2 and 3, we showed that we are able to
increase the efficiency of converting laser light into a particular high harmonic. However,
our investigations were limited to relatively low-order high harmonics because of energy
limitations in our laser system. This chapter discusses the principles and design of a new
high-power laser system. The new system produces not only higher pulse energy but also
a train of counter-propagating pulses to disrupt harmonic emission in many zones with
undesirable phase. The new system accomplishes the following objectives:
1) the system must produce sufficient pulse energy to achieve intensities as high as
~1016W/cm2 (necessary for ionizing Ne and He gases) in a relatively large focal volume
(i.e., f/50 focusing geometry);
2) the temporal separation between individual pulses in the counter-propagating train
must be independently adjustable to enable finding the optimal configuration for
suppressing zones with out-of-phase harmonic emission (refer to Fig. 2.2 in Chapter 2).

76
5.2 CHIRPED PULSE AMPLIFICATION
A. Chirped pulse amplification with Ti:Sapphire
The technique of Chirped Pulse Amplification (CPA) was introduced by Mourou
and Strickland [87] in 1987. The technique allows one to increase the energy of short
pulses while avoiding very high peak powers that can damage to the amplifier material or
other optics in the laser system. As shown by Martinez et al., the pulse can be stretched in
time by introducing a frequency chirp caused when the pulse undergoes a large amount of
dispersion [88]. This frequency chirp (or stretch) must be reversible since we desire to
re-compress the duration of the pulse after amplification.
The CPA scheme is illustrated on Fig. 5.1. Ultrashort (100 fs or less) light pulses
are generated at low pulse energy in a modelocked laser oscillator. Typically, an
oscillator produces light pulses at high repetition rate (~ 108 Hz) corresponding to the
round-trip time of the cavity with pulse energies in the range of ~10-9 J, and with pulse
duration of a few, or a few tens of femtoseconds. These ultrafast pulses are then chirped
using a diffraction-grating stretcher. The pulses are typically stretched to the duration of
about 100 picoseconds, decreasing their peak power by three or four orders of magnitude.
The stretched pulses then enter amplification stages where their energy increases by six
to nine orders of magnitude, reaching the level of a few tens of millijoules per pulse.
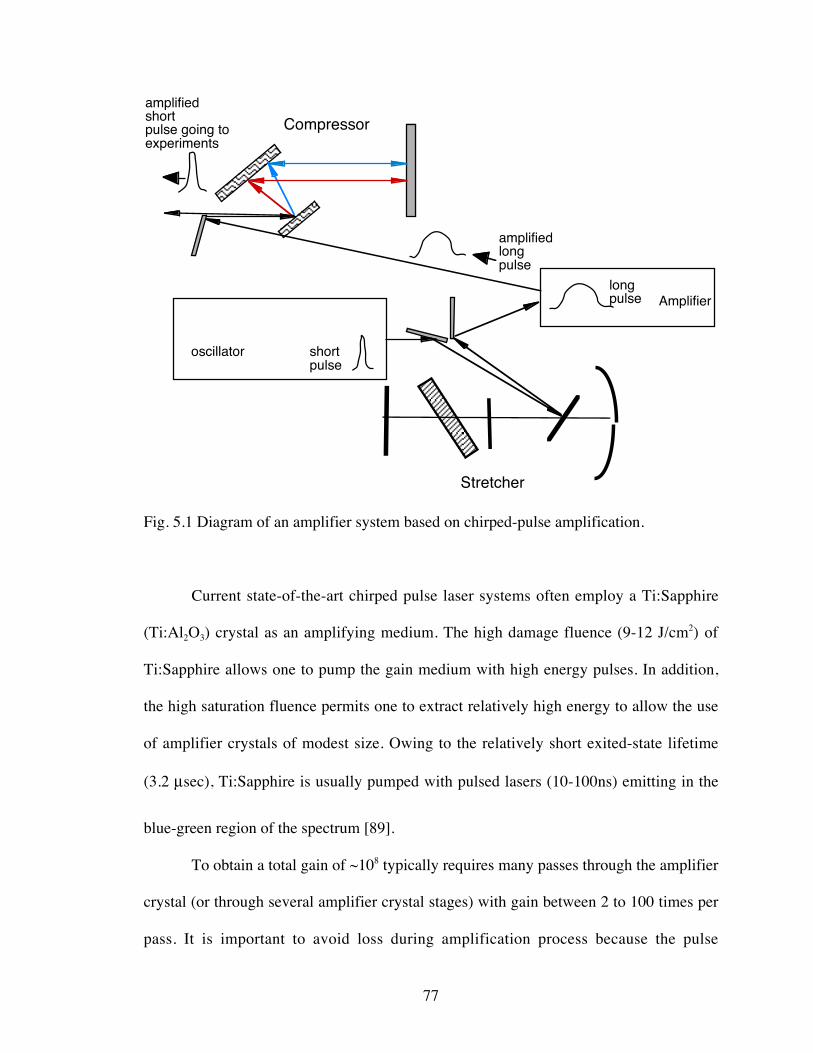
77
amplifiedshortpulse going toexperiments
oscillator shortpulse
longpulse Amplifier
Compressor
Stretcher
amplifiedlongpulse
Fig. 5.1 Diagram of an amplifier system based on chirped-pulse amplification.
Current state-of-the-art chirped pulse laser systems often employ a Ti:Sapphire
(Ti:Al2O3) crystal as an amplifying medium. The high damage fluence (9-12 J/cm2) of
Ti:Sapphire allows one to pump the gain medium with high energy pulses. In addition,
the high saturation fluence permits one to extract relatively high energy to allow the use
of amplifier crystals of modest size. Owing to the relatively short exited-state lifetime
(3.2 msec), Ti:Sapphire is usually pumped with pulsed lasers (10-100ns) emitting in the
blue-green region of the spectrum [89].
To obtain a total gain of ~108 typically requires many passes through the amplifier
crystal (or through several amplifier crystal stages) with gain between 2 to 100 times per
pass. It is important to avoid loss during amplification process because the pulse
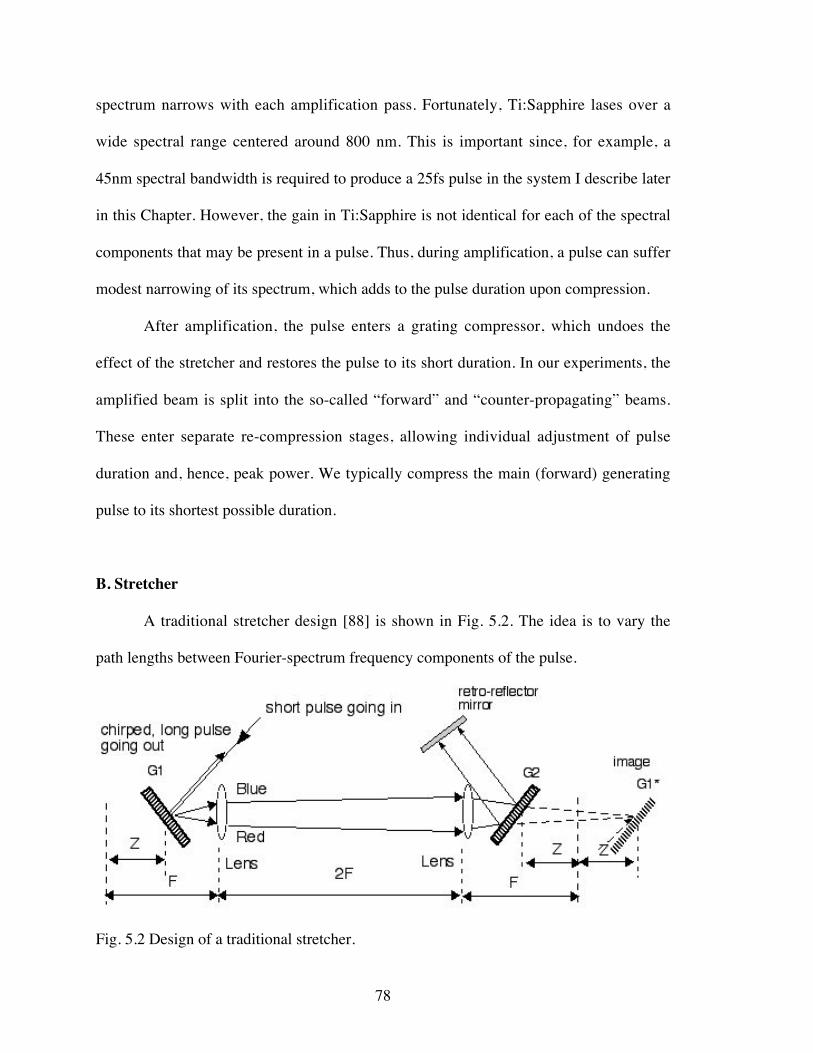
78
spectrum narrows with each amplification pass. Fortunately, Ti:Sapphire lases over a
wide spectral range centered around 800 nm. This is important since, for example, a
45nm spectral bandwidth is required to produce a 25fs pulse in the system I describe later
in this Chapter. However, the gain in Ti:Sapphire is not identical for each of the spectral
components that may be present in a pulse. Thus, during amplification, a pulse can suffer
modest narrowing of its spectrum, which adds to the pulse duration upon compression.
After amplification, the pulse enters a grating compressor, which undoes the
effect of the stretcher and restores the pulse to its short duration. In our experiments, the
amplified beam is split into the so-called “forward” and “counter-propagating” beams.
These enter separate re-compression stages, allowing individual adjustment of pulse
duration and, hence, peak power. We typically compress the main (forward) generating
pulse to its shortest possible duration.
B. Stretcher
A traditional stretcher design [88] is shown in Fig. 5.2. The idea is to vary the
path lengths between Fourier-spectrum frequency components of the pulse.
Fig. 5.2 Design of a traditional stretcher.

79
The typical design consists of two identical lenses forming a 1:1 telescope
between a pair of gratings with the same groove density and a retro-reflector mirror. The
first grating G1 is imaged to G1*. The grating G2 and the image G1* are parallel while
G1 and G2 are anti-parallel. Different frequency components travel different path lengths
by means of the retro-reflector (flat mirror). The frequency components retrace their
paths back through the system. The purpose of the telescope is to cause a negative
distance between G1* and G2. Then, the effect can later be undone by bouncing the
pulse between two parallel gratings with no telescope in place.
Fig. 5.3 All reflective, single-grating stretcher design.

80
The higher-frequency components (“blue”) experience longer path lengths (i.e., they
emerge from the system at the back of the chirped pulse). In this case, the pulse is called
“positively chirped” since the frequency of the pulse increases in time. The pulse is called
“negatively chirped” if the “red” frequencies occur at the back of the pulse.
In our laser system, we followed the design given in Ref.[90] to eliminate
refractive optics, which can introduce undesirable dispersion and chromatic aberration. A
folded reflective concave mirror setup substitutes for the two lenses. One advantages is
that only one grating is required, but the principle is the same as in Fig. 5.2. Fig. 5.3
depicts this stretcher design.
C. Compressor
In the compressor, the spectral components of the previously stretched (chirped)
pulse undergo the reverse process. That is, the pulse is made short again. In the
compression system (Fig. 5.4), the initial pulse diffracts from the first diffraction grating,
which sends different frequency components along different paths. The difference in path
lengths depends on the spacing between the gratings, the angle between the beam and
each grating and the grating groove density. The spectral components diffract from a
second grating, which causes them to travel parallel to each other again before being
retro-reflected from a flat mirror. By using the right choice of the above-mentioned
parameters, the pulse chirp can be undone. To ensure optimal compression, fine
adjustment to the grating spacing must be done while measuring the pulse duration.

81
retro-reflectormirror
grating
grating
red
blue
red blue
redblue
Fig. 5.4 Schematic of the grating compressor setup.
5.3 COUNTER-PROPAGATING TRAIN OF PULSES SOLUTION
As explained in Chapter 3, we showed experimental feasibility of colliding
multiple beams for an overall harmonic emission enhancement. Using only one
interfering counter-propagating pulse, we were able to enhance harmonic emission by
eliminating emission from one out-of-phase zone in a relatively wide generating medium
(especially at poor phase matching conditions). In order to see more significant harmonic
emission enhancement, we should frustrate harmonic emission from several out-of phase
zones. We investigated the possibility of creating a sequence of counter-propagating
pulses in the grating compression setup. In the compressor (see Fig. 5.4), the frequency
components of the pulse diffracted from the gratings are spatially separated horizontally
along the retro-reflector mirror (see side view of the mirror on the upper portion of Fig.
5.5). If a mask is placed in front of the retro-reflector mirror, thus blocking particular
portions of pulse spectra dispersed on the retro-reflector mirror, it appears possible to
modulate the amplitude of pulse upon reflection from the mirror. Then, as the beam
retraces its path, the spectral components are put back together. If the “re-compressed”
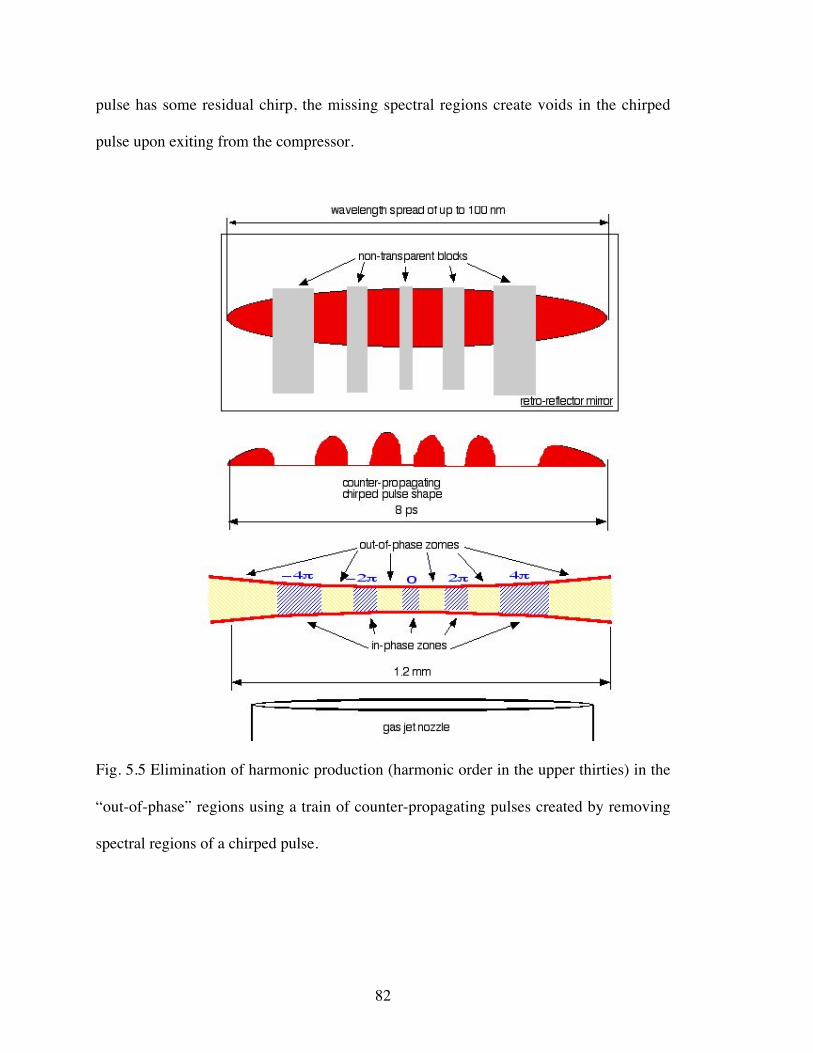
82
pulse has some residual chirp, the missing spectral regions create voids in the chirped
pulse upon exiting from the compressor.
Fig. 5.5 Elimination of harmonic production (harmonic order in the upper thirties) in the
“out-of-phase” regions using a train of counter-propagating pulses created by removing
spectral regions of a chirped pulse.

83
As depicted on Fig. 5.5, the timing and durations of these counter-propagating
pulses can be chosen to frustrate harmonic production in regions with undesirable phase,
which is the goal of the technique. The remaining regions then constructively interfere.
As described in Jamie Titensor’s thesis [91], this technique suffers from
limitations of the Uncertainty Principle:
D Dw FWHM FWHMt Const≥ . (5.1)
The Uncertainty Principle requires the pulse structure to be on the order of picoseconds
or longer before the multiple pulses can be clearly separated.
We elected to utilize a different scheme to create a train of amplified pulses with
variable durations between individual pulses. The pulse train is produced by a series of
beam splitters followed by amplification of the train of pulses. The scheme offers
complete adjustability of the timing of pulses in the train. However, the scheme does not
permit the adjustment of duration individual pulses in the train since the counter-
propagating pulses all encounter the same compression setup, in sequence one after
another.
5.4 LASER SYSTEM LAYOUT AND CHARACTERISTICS
A block-diagram of our new laser setup is shown in Fig. 5.6. The essentials of
stretching the pulse, amplifying, and then recompressing are represented.

84
Fig. 5.6 Block-diagram of new laser system.
A more detailed schematic of the new laser setup is shown on Fig. 5.7. The new
system has built into it a separate channel producing a train of up to five independent
counter-propagating pulses.
Fig. 5.7 New laser setup.
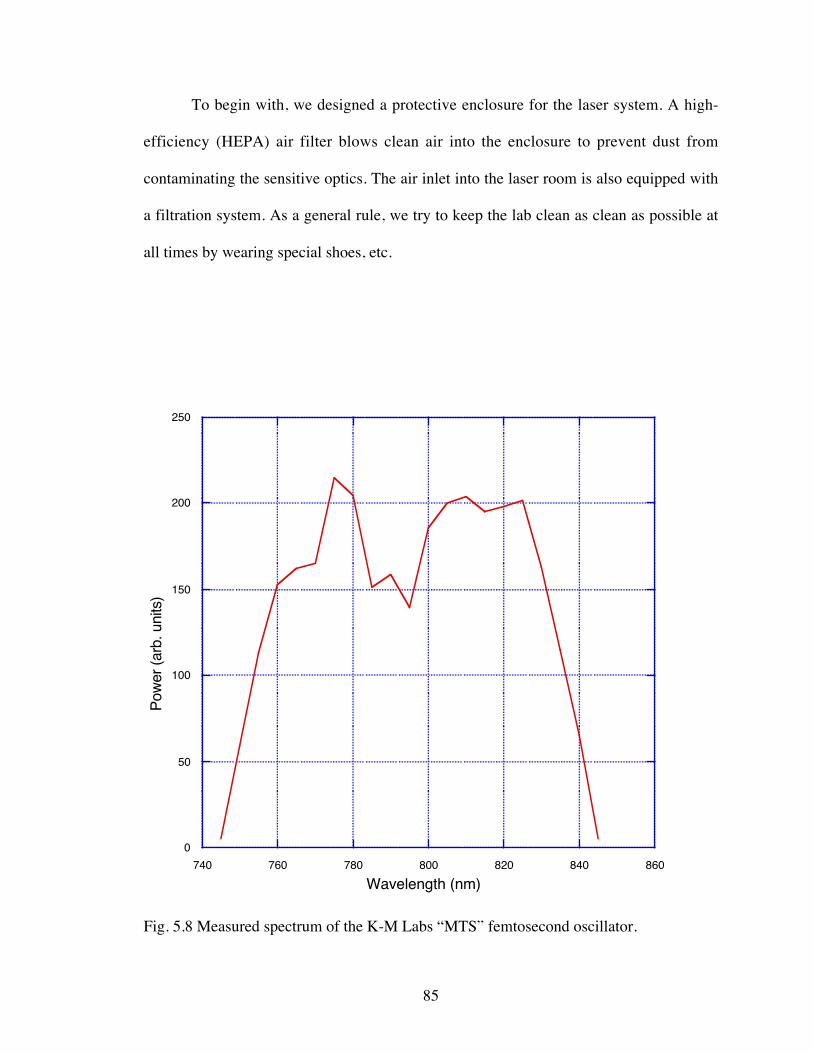
85
To begin with, we designed a protective enclosure for the laser system. A high-
efficiency (HEPA) air filter blows clean air into the enclosure to prevent dust from
contaminating the sensitive optics. The air inlet into the laser room is also equipped with
a filtration system. As a general rule, we try to keep the lab clean as clean as possible at
all times by wearing special shoes, etc.
0
50
100
150
200
250
740 760 780 800 820 840 860
Pow
er (a
rb. u
nits
)
Wavelength (nm)
Fig. 5.8 Measured spectrum of the K-M Labs “MTS” femtosecond oscillator.

86
Our pulses originate from a K-M Labs “MTS” oscillator (2), a passively mode-
locked Ti:Sapphire laser producing a train of ~15 fs (FWHM) p-polarized pulses. The
wavelength is centered near 800 nm with a spectral bandwidth approaching 100nm. The
pulses are separated by 11 ns (repetition rate 90.9 MHz), and the total output power is
around 600 mW. The oscillator is pumped by a continuous 4.5Watt, 532nm beam,
produced by a Coherent “Verdi” laser (1). The Verdi laser produces s-polarized light.
Mirror periscope #1 switches the polarization of the oscillator pump beam to p-type. In
our setup, the direction of p-polarization is parallel to optical table surface. The measured
spectrum of the oscillator is shown on Fig. 5.8.
The train of oscillator pulses travels through a collimation lens (3) and enters the
pulse stretcher (4), which expands the 15 fs pulse duration to about 70 ps. The concave
mirror in the stretcher setup has radius of curvature 75 cm. The focal distance F (see Fig.
5.3) is 37.5 cm. The distance between the centers of the grating and the concave mirror is
23 cm. The Thermo-RGL grating’s reflectivity in the spectral range of the pulse is below
70% despite our expectations. In the stretcher, the pulse becomes negatively chirped.
After the stretcher, the 800 nm light is diverted into the pulse picker system (5). The
diagram of the pulse picker setup is shown on Fig. 5.9.

87
periscope #2
collimatinglens
cubepolarizer#1
Pockelscell #1 turnable
polarizer
beam of chirped pulses going from stretcher
polarizationturn
Fig. 5.9 Pulse picker system (side view).
The pulse picker consists of periscope #2, which switches polarization of light from
p- to s- type, and Pockels cell #1 with two crossed polarizers on its entrance and exit. A
collimating lens is placed just before the entrance cube polarizer #1.
A Pockels cell is a KDP crystal that becomes a wave-plate when an electric field is
applied. The electrically induced birefringence rotates the polarization of the light that
passes through it. The length of our KDP non-linear crystal is made such that it rotates
linear polarized 800 nm infrared (IR) light by 90 degrees when a high voltage (~4.8 kV)
is applied across the crystal (this happens when ~7kV is applied to the driver).
The entrance polarizer is necessary to clean the s-polarization state of the incoming
light. The crossed polarizer on the exit is used to block s-polarized light and transmit p-
polarized light. When the Pockels cell is not active, the pulses are extinguished on the
second polarizer. When the Pockels cell is energized for approximately 10ns, it selects a
single pulse to become p-polarized (the “seed” pulse) from the oscillator’s train of pulses.
This is done at a repetition rate of 10 times per second since this is how often our pump
laser fires.

88
After the first Pockels cell, the p-polarized 800 nm “seed” pulses enter the first
amplification stage, which consists of triangle-style multi-pass setup [1] as shown on
Fig. 5.10. The beam is parallel to the optical table surface. The height of the beam is 4
inches above the optical table.
“seed” pulse entrance
amplified pulse exit
M1
M2 M3
M4
7a
pump beam entranceM5
BS2
WP1
BS3M6
M7
L1L2
M8M9
M10 Ti:Sapphire
AA
68∞
7b
Fig. 5.10 Triangle-type multi-pass Chirped Pulse Amplifier stage #1 (top view).
The beam enters at the turning mirror M1. The mirrors M2 and M3 are concave
dielectric mirrors of focal length 50 cm each. They reflect 800 nm light and transmit
532nm light. The mirrors are located 100 cm from each other, forming a triangle
arrangement together with a flat wide mirror M4. The Ti:Sapphire crystal (produced by
Saint Gobain Crystals) is a 0.25% doped, Brewster-cut, 7 mm thick crystal. The
Ti:Sapphire crystal is centered between the mirrors M2 and M3. The “seed” pulse makes
9 passes counter clockwise (see top view in Fig. 5.10) around the triangle formed by the
mirrors M2-M3-M4. On each pass, the beam hits different places on each of the mirrors
but passes through the same point in the amplifier crystal. On the ninth pass, the
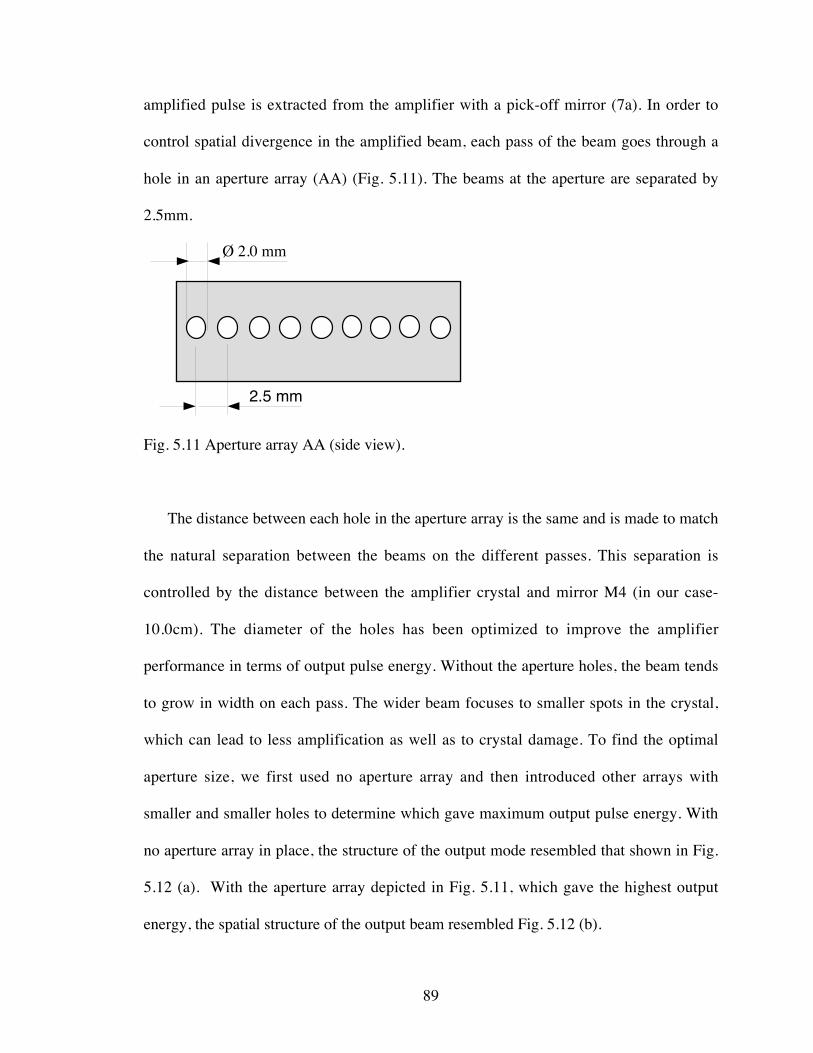
89
amplified pulse is extracted from the amplifier with a pick-off mirror (7a). In order to
control spatial divergence in the amplified beam, each pass of the beam goes through a
hole in an aperture array (AA) (Fig. 5.11). The beams at the aperture are separated by
2.5mm.
2.5 mm
Ø 2.0 mm
Fig. 5.11 Aperture array AA (side view).
The distance between each hole in the aperture array is the same and is made to match
the natural separation between the beams on the different passes. This separation is
controlled by the distance between the amplifier crystal and mirror M4 (in our case-
10.0cm). The diameter of the holes has been optimized to improve the amplifier
performance in terms of output pulse energy. Without the aperture holes, the beam tends
to grow in width on each pass. The wider beam focuses to smaller spots in the crystal,
which can lead to less amplification as well as to crystal damage. To find the optimal
aperture size, we first used no aperture array and then introduced other arrays with
smaller and smaller holes to determine which gave maximum output pulse energy. With
no aperture array in place, the structure of the output mode resembled that shown in Fig.
5.12 (a). With the aperture array depicted in Fig. 5.11, which gave the highest output
energy, the spatial structure of the output beam resembled Fig. 5.12 (b).

90
(a) (b)
Fig. 5.12 The observed beam profile from the triangle amplifier in the case of (a) no
aperture array and (b) an aperture array with optimized hole diameter.
We synchronized the timing of Pockels cell #1 with the pump laser repetition rate.
We have placed an avalanche photodiode near the oscillator output to detect spurious
light. The signal from the photodiode triggers the timing circuits for the laser system,
which consists of a pair of interlinked Stanford Research System (SRS, model DG 535)
delay boxes. The two boxes are configured such that one is slave to the other. The delay
boxes have sub-nanosecond fine delay steps and variety of triggering options. One
channel of the coupled delay boxes is used solely for introducing the repetition rate of
10Hz in the laser system. The boxes wait for that channel to finish executing its 0.1s
delay before accepting a new trigger. The delay boxes controls the firing of the pump
laser and the various Pockels cells in the system. The pump pulse activates the
Ti:Sapphire crystal a few tens of nanoseconds prior to the arrival of the “seed” pulse,
which is sent into the amplifier stage by the pulse picker. The exited-state lifetime in the
Ti:Sapphire crystal is about 3ms, which is long compared to all timing intervals except for
91
the delay channel that enforces the 10Hz repetition rate. The timing sequencing is
explained in Appendix A2.
The amplifier is pumped by a 532nm Spectra-Physics “Quanta-Ray” laser, which
produces s-polarized light pulses with 12ns duration and energy up to 700mJ. The
repetition rate of the laser is internally/externally adjustable over the range of 10±1 Hz.
The “Quanta-Ray” (Spectra Physics) laser is a two-stage Q-switched Nd:YAG
amplification system with extracavity frequency-doubling. The two amplifier stages are
pumped by krypton flash lamps. The Q-switch of “Quanta-Ray” laser receives a signal
from the delay controller that is correlated with the other timing circuits in the laser
system. The timing boxes also supply a pre-trigger to initiate the flash lamps in the
“Quanta-Ray” laser about 180ms before its Q-switch is fired.
We switch the polarization of the green pump laser to p-polarized light by means
of mirror periscope #3. We then split the pump beam into two parts at the beamsplitter
(BS1). About 45% of the beam energy goes through it and is sent directly to the second
Ti:Sapphire amplifier stage. The 55% beam then arrives at an 80% reflecting beamsplitter
(BS2), which sends most of the energy also to the second Ti:Sapphire amplifier stage
from the opposite direction. This leaves about 12% of the original green pump beam
energy, which goes to the first Ti:Sapphire amplifier stage. Another beamsplitter (BS3)
divides this weaker beam into two equal beams that are sent into the first Ti:Sapphire
amplifier stage from both directions. These pump beams travel by means of mirrors M8-
M9-M10 (on the left-hand side) and M6-M7 (on the right-hand side). The beams transmit
through mirrors M2 and M3, which are reasonably transparent to the 532 nm pump light.
92
Telescopes focus each pump beam in the first amplifier stage to points about
10cm beyond the Ti:Sapphire crystal, in each case. Each telescope consists of a negative
lens followed by a positive lens (L2 and L3) creating a controllable focal length that we
set to approximately to 72cm. This focal length was experimentally chosen to create the
highest possible pump intensity for which no damage occurs to the Ti:Sapphire crystal
when the Quanta Ray laser is set to maximum.
After a series of performance optimizations, we are able to achieve as high as 8mJ
from the first amplifier stage, although we usually operate at 5mJ or less to avoid
damaging optics in the system. The overall gain of this triangle amplifier stage is
therefore near 107. In order to regulate the output power of the first stage, we use a half-
wave-plate in the beam path of the pump beam for that amplifier stage. Since the
Ti:Sapphire crystal is Brewster-cut, s-polarized light experiences a ~26% reflection as it
enters the crystal. By turning the linear polarization axis of the pump light with the wave
plate, we regulate the amplifier’s output power by restricting pump energy. The diameter
of the diverging beam emerging from the first amplifier stage is ~2 mm. This beam grows
in size at a rate of an additional 2mm per meter of propagation. Thus, the diameter of the
beam at the second amplification stage is close to 5mm.
The first amplifier stage is similar to the amplifier we used in our earlier laser
system (see Chapter 3), but has several advantages:
1) a mutual alignment of the “seed” beam and pump beams is much simpler since the
pump beams have a wider diameter in the crystal;
2) the pump beam power never reaches the damage threshold value at the crystal;

93
3) we are able to regulate output power of the amplifier by changing the polarization state
of the pumping beams.
The amplified pulses exit the first stage and enter the beam isolator setup (8) (see
side view on Fig. 5.13).
Pockels scell #2
Pockels cell #3
cube polarizer #2
cubepolarizer #3
beam 1beam 1
beam 2 goingbackwardsfrom the amplifier stage #2
beam 2
plate polarizer
72∞
periscope #4beam 2 goingbackwardsto the amplifier stage #2
Fig. 5.13 Side view of the beam isolator setup.
The beam from the first-stage amplifier enters cube polarizer #2, where p-
polarized light is cleaned for polarization purity. The p-polarized light then enters
Pockels cell #2, which rotates the polarization of the pulse to s-type. This Pockels cell is
energized only at the time when the amplified pulse goes through. Cube polarizer #3
deflects undesirable p-polarized light to the extent that Pockels cell #2 does not perfectly
rotate the polarization of the laser pulse. The now s-polarized pulse exits cube polarizer
#3. A subsequent plate polarizer transmits the s-polarized light while rejecting any p-
polarized light.
The pulse then goes through Pockels cell #3, which functions as follows:
1) Pockels cell #3 becomes energized when the incoming s-polarized pulse goes through
it, turning the polarization back into p-type;

94
2) it turns off when retro-reflected light pulses return to it from the opposite direction at a
later time (described later).
While traversing the entire selector setup, the laser beam loses about 40-45% of
its energy. However, most of the lost energy corresponds to spontaneous emission and
satellite pulses that we wish to eliminate from the beam.
The beam leaves the pulse isolator setup and enters the second amplification
stage. The beam makes two passes through the second Ti:Sapphire crystal (9) for an
overall additional gain of ~10. An extraction mirror (10) sends the amplified pulse to the
setup that creates counter-propagating pulses (11). The beam looses ~30% of its power
on a series of beamsplitters that are used to create the counter-propagating pulses. The
beam emerges from beamsplitter array (11) whereupon a mirror (12) sends the pulse to a
long delay stage (13) to compensate for timing. The delay stage (13) plays the same role
as the delay stage we used in former experiments. The stage movement mechanism is
operated by Melles-Griott “Nanomover” driver controlled from a PC computer running a
LabView software. The delay scans the forward beam arrival timing relative to that of the
counter-propagating pulses that are created (11). The forward beam (14) then exits the
table and enters the pulse compression chamber.
The setup for creating the train of counter-propagating pulses is shown in
Fig.5.14. The beam hits several 45∞ beamsplitters (BS4, BS5, BS6, BS7, and BS8) that
each reflects 95% of the incident power. In each case, 5% of the pulse energy goes
through to a retro-reflecting mirror (RM1, RM2, RM3, RM4, and RM5). In each case, the
retro-reflected light transmits again through the corresponding beamsplitter with 5%
efficiency. The retro-reflected pulses all are very weak with slightly different energies

95
depending on which channel creates each of them in the system. The counter-
propagating pulse created by RM1 has 0.250% of the original energy, by RM2 – 0.226%,
by RM3 – 0.204%, by RM4 – 0.184% and by RM5 – 0.166%. The ratio of energy
between the first and last created pulses is 1.36. It is to our advantage that there is a slight
discrepancy in the quality of the CVI beamsplitters we use; we put the most reflective
ones in first (BS4) to help make all of the retro-reflected beams be similar in pulse
energy.
11
10
to the delay stage 13
amplified beam 1going in
12
BS4
BS5 BS6
BS7 BS8
RM2
RM1
RM4
RM3
RM5
retro-beam 1
retro-beam 3
retro-beam 5
counter-propagating train of pulses going out
Fig. 5.14 The stage creating the counter-propagating train of pulses.
The distance between beamsplitter BS4 and any of the retro-reflection mirrors
RM1, RM2, RM3, RM4 and RM5 is approximately 30.5cm. We are able to vary the
position of each retro-reflecting mirror RM1 – RM4 over several centimeters with sub-
micron precision using the New Focus “Picomotor” fine-alignment drivers on which the
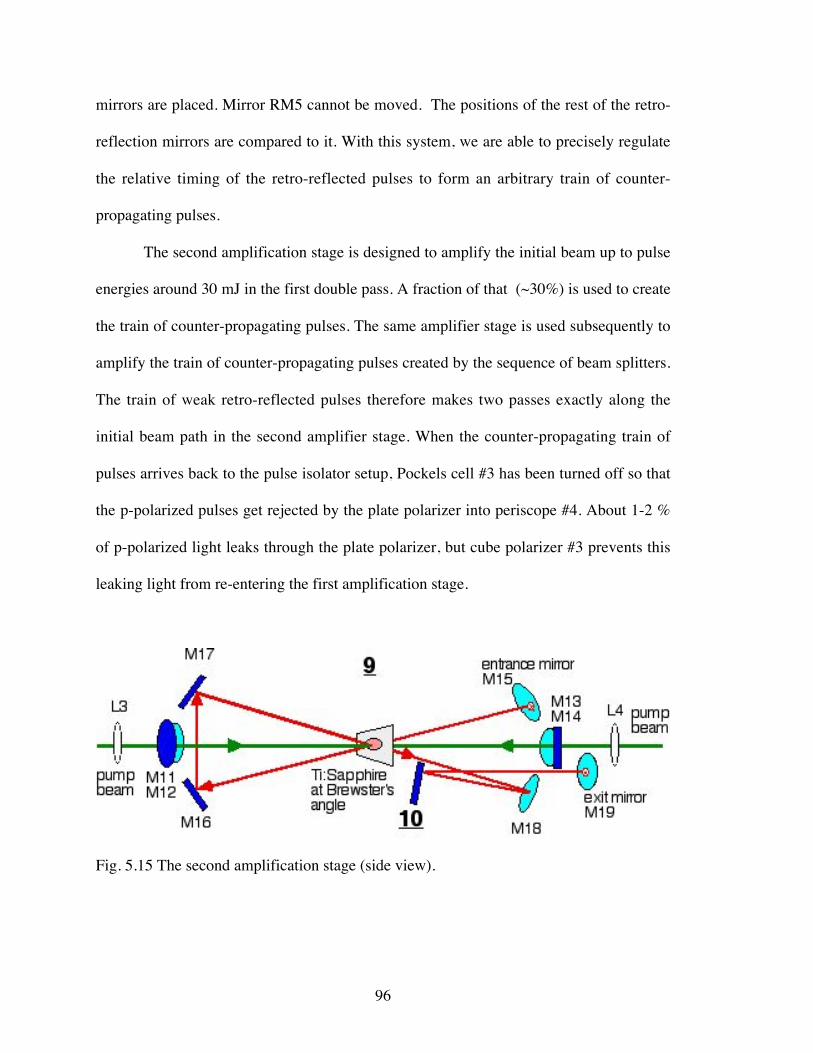
96
mirrors are placed. Mirror RM5 cannot be moved. The positions of the rest of the retro-
reflection mirrors are compared to it. With this system, we are able to precisely regulate
the relative timing of the retro-reflected pulses to form an arbitrary train of counter-
propagating pulses.
The second amplification stage is designed to amplify the initial beam up to pulse
energies around 30 mJ in the first double pass. A fraction of that (~30%) is used to create
the train of counter-propagating pulses. The same amplifier stage is used subsequently to
amplify the train of counter-propagating pulses created by the sequence of beam splitters.
The train of weak retro-reflected pulses therefore makes two passes exactly along the
initial beam path in the second amplifier stage. When the counter-propagating train of
pulses arrives back to the pulse isolator setup, Pockels cell #3 has been turned off so that
the p-polarized pulses get rejected by the plate polarizer into periscope #4. About 1-2 %
of p-polarized light leaks through the plate polarizer, but cube polarizer #3 prevents this
leaking light from re-entering the first amplification stage.
Fig. 5.15 The second amplification stage (side view).

97
The pulse train is then sent for two more passes through the same Ti:Sapphire
crystal along new beam paths. All together, the gain is sufficient to increase the energy in
each counter-propagating pulse to over 10mJ. Fig. 5.15 shows a side view of the second
amplification stage with the path of the counter-propagating beam explicitly shown. The
counter-propagating beam is sent by M15 for its final two amplification passes through
the Ti:Sapphire crystal.
The lenses L3 and L4 in Fig. 5.5 are positive 75 cm focal length lenses. They
focus the 532 nm pumping light from the “Quanta Ray” laser. The focal points of the
lenses are located in each case behind the crystal such that the 3mm diameter beam
strikes the crystal from each direction. Again, we want to prevent damage at the crystal
while maintaining the highest possible pump fluence. The beam exits at the mirror M19,
which sends it to the turning mirror M20, shown on the Fig. 5.7.
The measured spectrum of the forward beam (14) is shown in Fig. 5.16. If we
compare this amplified spectrum with the spectrum of the Ti:Sapphire oscillator (Fig.
5.8), we see that the amplified pulse spectrum is no longer centered at 800 nm, but rather
at 790 nm. Also, the spectrum gets narrower during the amplification process as is
expected. The pulse width is ~32 nm (FWHM). The Uncertainty Principle (Eq.(5.1))
predicts that the shortest available pulse duration after re-compression will be about 46 fs.
This is much longer than the15 fs pulse duration we have in the oscillator where the pulse
spectral bandwidth was about 100 nm. This is due mainly to the bandwidth narrowing
effect mentioned earlier in this chapter. Also, the spectral response characteristic of the
stretcher grating (Thermo-RGL) might significantly shift and narrow the spectrum.

98
0
50
100
150
200
775 780 785 790 795 800 805 810 815
Pow
er (a
rb. u
nits
)
Wavelength (nm)
Fig. 5.16 Measured spectrum of the forward beam on exit from the second amplification
stage.
To avoid damage to the compression gratings, the high-energy beams are
expanded to ~1.5 cm diameter (measured from 1/e2 intensity) by means of the telescopes
T1 and T2 (see Fig. 5.7). The forward beam (14) goes through a negative lens with focal
length 20cm followed by a positive lens with focal length 50cm located at the distance of

99
30.4 cm after the negative lens. The counter-propagating beam (15) goes through a
negative lens with focal length 20cm followed by a positive lens with focal length 75 cm
located at a distance of 56.6 cm after the negative lens. The telescope separations
collimate the two beams (compensating for any previous divergence). The counter-
propagating beam (15) and the forward beam (14) then exit the laser setup and enter the
pulse compression chamber.
The Ti:Sapphire crystals in the oscillator and both amplification stages are
temperature stabilized at 18.0∞ C, using the water-cooling stage (Coherent Laser)
connected in parallel to each of the crystal mounts. This stabilizes the temperature and
helps avoid long-term over-heating of the crystals that can cause beam distortion and
deflection.
5.5 PULSE COMPRESSION
A. Overview of pulse compression chamber and experimental setup
The pulse compression setup, cross- and auto-correlation setup, and overall view
of the experiment setup are shown in Fig. 5.17. The pulse compression chamber is a
stand-alone vacuum-tight chamber with a large optical breadboard mounted inside.
However, for our current experiments we do not require the pulse compression chamber
to be evacuated. The vacuum compatibility is available for future experiments where all
available energy is put into a single well-compressed pulse. The forward beam (14) and
the counter-propagating beam (15) enter the pulse compression setup where each beam is
temporally re-compressed independently. After the re-compression, the pulses reflect
from 95% beamsplitters (BS9) and (BS10) directing most of the power towards the
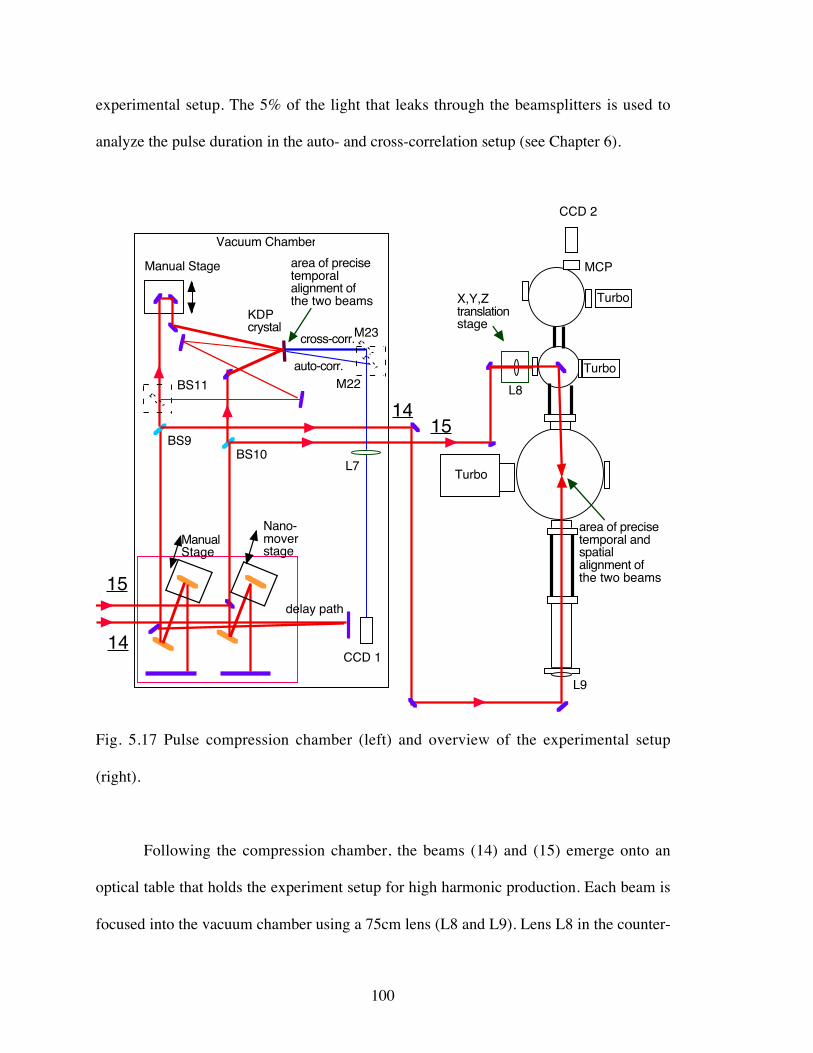
100
experimental setup. The 5% of the light that leaks through the beamsplitters is used to
analyze the pulse duration in the auto- and cross-correlation setup (see Chapter 6).
Vacuum Chamber
Turbo
Turbo
MCP
X,Y,Ztranslationstage
KDPcrystal
Nano-moverstage
ManualStage
Manual Stage
Turbo
CCD 1
15
14
1415
CCD 2
L7
BS9BS10
BS11 M22 L8
L9
cross-corr.
auto-corr.
delay path
M23
area of precisetemporal and spatial alignment of the two beams
area of precisetemporal alignment ofthe two beams
Fig. 5.17 Pulse compression chamber (left) and overview of the experimental setup
(right).
Following the compression chamber, the beams (14) and (15) emerge onto an
optical table that holds the experiment setup for high harmonic production. Each beam is
focused into the vacuum chamber using a 75cm lens (L8 and L9). Lens L8 in the counter-

101
propagating beam is placed on the New Focus “Picomotor” X-Y-Z stage. We use the
stage to adjust the alignment of the focused counter-propagating beam in the collision
chamber. The overall path lengths of the forward and the counter-propagating beams are
~15 meters, measured from the beamsplitter BS4 (see Fig. 5.14). The path lengths must
be equal to each other while the two beams meet either in cross-correlation setup and in
the interaction chamber in order to achieve temporal alignment of the pulses within tens
of femtoseconds precision. This precision corresponds to a spatial alignment of the
colliding beams to within few of micrometers.
B. Compressor
An expanded view of the compressor setup is shown on the Fig. 5.18. The setup
consists of two independent compressor stages. The alignment of the gratings is critical to
achieve the best possible compression of the pulse. This is especially important for the
forward pulse, which has to be re-compressed to the shortest possible pulse duration to
excite the highest harmonic orders as possible. The forward beam (14) performs an extra
delay path between mirrors M24 and M25 to accommodate for unaccounted path
difference. The height of the beam is 4 inches above the optical breadboard in the pulse
compression chamber. The grating G2 is placed on a manual translation stage to adjust
the distance between gratings G1 and G2. The gratings’ grooves are set to be parallel to
each other and perpendicular to the optical table. The retro-mirror set (M26, see Fig.
5.18) consists of two plane mirrors placed one above the other, forming a right angle
between them. The mirrors lift the retro path to a height of 5.5 inches above the optical

102
table surface, so that the re-compressed beam passes freely above mirror M25 towards
the beam splitter BS9.
Nano-moverstage
ManualStage
15
14
14
15
BS9
BS10
delay pathM24
M25
M26
M27
M28
G1
G2
G3
G4
Fig. 5.18 Compressor setup.
The angle between the beam pathways M25-G1 and G1-G2 as well as between
pathways M27-G3 and G3-G4 has been chosen to be the minimum available (about 15∞)
to achieve a quasi-Littrow angle re-compression. The beams traveling from M25 to G1

103
and from G2 to mirror set M26 are set to be parallel to each other and to the optical table.
After careful alignment and optimization, the pulse re-compression of the amplified pulse
is as short as 45±4 fs duration. This is the shortest available pulse duration we may
achieve upon compression according to the Uncertainty Principle (see section 5.4).
However, this is about 15fs longer than we would like, so more work will need to be
done on this in the future. The counter-propagating pulse compression setup is similar to
the one for the forward pulse. The only difference is that we use a Melles-Griott
“Nanomover” driver controlled from a PC computer running a LabView software. The
delay stage (13) (see Fig. 5.7) and the grating G4 must move together in such a way that
the relative timing of the two beams is preserved while adjusting the compression of the
counter-propagating pulses. The optimal distance between the centers of the gratings G1
and G2 is found to be 32.5 cm, which produces the shortest available forward pulse
duration. The distance between G3 and G4 is 34.4 cm when the duration of each counter-
propagating pulse is 0.83 ps.
C. Auto- and cross-correlation
The auto- and cross-correlation setup uses a 20cm-focal-length lens (L7) for 1:1
imaging of light produced in a KDP crystal (Quantum Technology). The second
harmonic light is generated by mixing two laser pulses in the crystal. The light is
observed by a CCD camera (CCD camera 1) placed after the lens. This CCD camera is
read by a Spiricon beam profile analyzer. The distance between lens L7 and CCD camera
1 is 40 cm, which matches the distance from the crystal to the lens.

104
The counter-propagating pulse train is temporally characterized through a
traditional cross-correlation technique, relying on our short forward-traveling pulse. The
short forward-traveling pulse is analyzed through an auto-correlation technique [91,92].
An expanded view of the auto- and cross-correlation setup is shown on the Fig. 5.19.
KDPcrystal
Manual Stage
14
15
to CCD 1 camera
BS9 BS10
BS11M22
cross-corr.
auto-corr.
M23
toexperiment
14 15
M29 M30
M31
M32
M34
M33 400 nmlight
Fig. 5.19 Auto- and cross-correlation setup.
Compared to our former setup (see Fig. 3.3 in Chapter 3), the main advantage of
our new auto- and cross-correlation setup is that we can do pulse duration measurements
without interrupting the pulses that go to the experiments. The purpose of our setup is:
1) to measure the duration of the forward beam using an auto-correlation technique;

105
2) to measure the duration and relative timing of the counter-propagating pulse train
using a cross-correlation technique;
3) to ensure temporal alignment of the colliding pulses while altering the compression of
the counter-propagating pulses and simultaneously moving the translation stage (13) and
the grating G4.
As was previously mentioned, the beams for the auto- and cross-correlation setup
are obtained from beam splitters BS9 and BS10. Each transmits 5% of the incident
power. The forward beam (14) reflects from the manual translation stage formed by the
mirrors M29 and M30, which control the path length of the beam. This beam and the
counter-propagating beam are both diverted towards the KDP crystal, which we use also
for cross-correlation measurements (with slightly different alignment). The KDP crystal
is only 0.1 mm thick to minimize phase mismatch of the second order harmonic produced
within crystal’s volume. The crystal is cut in a specific crystallographic orientation for
near-normal-incidence auto-correlation measurements of a femtosecond pulse. Typically,
the angular separation between the correlating beams is 10∞ or less. Each beam sent into
the crystal produces second harmonic light (blue color, 400 nm). When two beams have
temporally overlapping pulses within the crystal volume, a third beam of the second
harmonic light emerges in a direction between the two original beams. The orientation of
the crystal influences the strength of the second harmonic emission through phase
matching. This second harmonic light emerging from the crystal reflects from mirror
M23 mounted on a removable magnetic mount and is sent towards the CCD camera 1.
The auto-correlation setup for measuring the duration of the forward-propagating
pulse utilizes a 50% beam splitter BS11 to create a replica of that pulse. The beam splitter

106
is placed on a removable magnetic mount such that it intersects the beam going to the
manual stage (M29, M30). This beam splitter is installed when it is desired to make an
autocorrelation measurement. The two beams are then sent to mix in the crystal. Extra
reflections in the setup (M33, M34) ensure that the relative path length of the two beams
is similar. The second harmonic light is reflected from the mirror M22 mounted on a
removable magnetic mount, and imaged at the CCD camera 1. More description of the
auto- and cross-correlation techniques is given in Appendix A1.
5.6 SUMMARY OF LASER SYSTEM
A pulse from the femtosecond oscillator (“MKS” oscillator, K-M Labs) having
energy of ~1 nJ is amplified in the first amplification stage to an energy of about 5mJ
(gain ~107 times). The oscillator tends to double-pulse if its pump power is about 5 Watts
or more. We avoid this double pulsing by pumping the oscillator with 4.5 Watts. The
oscillator produces on average about 450 mW of power. The amplified pulse loses about
50% of its energy while traveling through the pulse isolator setup. However, the pulse
reaches an energy of ~30 mJ after two passes in the second amplification stage (gain 12
times). Part of this pulse is used to create additional counter-propagating pulses with
typical initial energy of ~75 mJ. After a total of four passes, these pulses individually
reach intensities up to 11 mJ (gain ~147 times).
The spectral bandwidth of the forward pulse at the exit from the laser setup
(before the compressor) is measured to be only ~32 nm (FWHM), which is one-third of
the pulse bandwidth produced by the oscillator. The forward pulse is re-compressed to a
measured duration of 45±4 fs. The measurement error is due to the resolution of our auto-
107
correlation setup. The amplified pulse spectrum is centered at 790 nm instead of 800 nm
as expected. This may give us a clue as to why the spectral bandwidth is disappointingly
narrow. In the future, we plan to perform further investigations of the amplified spectrum
narrowing phenomena due to stretcher and compressor gratings, and due to the
amplification narrowing effect.
We have examined the intensity profiles in two dimensions of the forward beam
before and after re-compression. The intensity profiles are very close to the ideal
Gaussian distributions in both dimensions.
We have evaluated the operation of the laser system for a regime that does not
damage laser components too easily. For best results, we adjust the pump power at the
first amplification stage such that its output is near ~5 mJ per pulse The forward beam
pulse energy is about 20 mJ following the series of beam splitters. The pulse energy of
beam #5 in the counter-propagating train of pulses ends up being 10 mJ. The sum of the
energies for all five counter-propagating pulses reaches 55 mJ.
We re-compress all pulses in the counter-propagating train in a single grating
setup. This means that they all have the same pulse duration (which we leave somewhat
chirped). The relative temporal alignment of the colliding forward and counter-
propagating beams is not affected by re-compression or chirping of the counter-
propagating beams. We can adjust the relative timing of the counter-propagating pulses
while observing their temporal alignment in the cross-correlation setup. This makes it
easy to coordinate the timing of the forward-propagating pulse via its delay stage (13)
with the counter-propagating pulses when their compression is adjusted. We use a
108
computer running a LabView software to keep track of the simultaneous movements of
the stages. The software accuracy is calibrated by cross-correlation measurements.
109
CHAPTER 6
EXPERIMENTAL RESULTS
6.1 SUPPRESSION OF HARMONICS AND SEARCH FOR ENHANCEMENT
A. Limitations of former experimental setup designs
The apparatus we designed and constructed for our new experiments is similar in
organization to that used in the earlier experiments (see Chapters 3 and 4), but it is more
advanced. There are several major differences between the current and old designs. Some
criticisms of our old approaches are presented here in order to appreciate the capabilities
of the new setup.
In the earlier experiments we experienced difficulties with spatial misalignment of
counter-propagating beams when the atmospheric gas from the chamber got evacuated.
Even though the beams were originally well aligned in atmosphere, the alignment would
shift seriously when the chamber was evacuated. The phenomenon was likely due to the
movement of vacuum chamber walls during pumping. One of the lenses was installed
directly on a chamber port (see Fig. 3.3 in Chapter 3). In addition, the optical breadboard
inside the interaction chamber was attached to the chamber walls. Thus, any deformation
of the chamber could also cause misalignment of the internal optics. To preserve
alignment of the colliding beams, we had to pump the chamber gradually in several
iterative steps, lowering the pressure inside the chamber by a few hundred torr at each
step while re-aligning the beams to keep a bright dot of plasma visible (the result of
colliding pulses if sufficiently well-aligned). When the chamber was evacuated
completely, we relied on the dimming of the spontaneous emission from the Ti:Sapphire
110
crystal (owing to beam feedback) to indicate the closeness of the alignment (see
description of this effect in Chapter 3).
We had two separate roughing pumps, one connected to the interaction chamber
turbo-pump, and another connected to both turbo pumps of the intermediate and the
detection chambers. The former had a much higher pump rate than the latter, which
caused the apertures between differential pumping chambers to move out of alignment,
owing to momentary high pressure differentials during initial evacuation.
In the old setup, there was no way to adjust the spacing between the lens that
focuses the forward beam and the lens that focuses the counter-propagating beam while
the chamber was under vacuum. The self-focusing of both beams in air caused the
apparent focus to occur at a shifted position (~0.5cm). Thus, the alignment of the focal
positions found in air became obsolete in vacuum. John Madsen’s thesis [78] explains the
difficulty of troubleshooting this type of misalignment.
A single CCD camera observed the alignment of the beams in two dimensions.
The CCD was positioned horizontally from the intersecting beams, while vertical images
of the interaction area were observed with the same camera by means of a 45∞ mirror
installed just above the collision region a few millimeters away. The laser ablated the end
of the steel nozzle during experiments, which quickly degraded the reflectivity of the
near-by mirror with a layer of debris. Cleaning and re-installing the mirror was a difficult
task. In addition to the problems in the experimental setup, we also had to deal with the
unstable operation of the laser system as mentioned in Chapter 3.

111
B. Experimental setup
Most of the problems that we encountered in the former experimental and laser
setups (see Chapter 3) have been fixed. A detailed view of the new experimental setup is
shown on the Fig. 6.1. The forward beam (14) is directed to the interaction chamber by
mirrors M35-M37 and focused by a 75 cm focal length lens L9 to the center of the
chamber. The diameter of the beam-traversing aperture A1 is 15 mm (measured from 1/e2
intensity), providing the f/50 focusing geometry. The measured focal spot diameter is
~70mm (measured from 1/e2 intensity). The counter-propagating beam (15) is reflected
from mirrors M38 and M39. The counter-propagating beam is focused into the
interacting chamber by means of a 75 cm focal length lens L8 and a 45∞ mirror M40. The
beam enters the vacuum chamber through an AR-coated window placed on the chamber
vacuum flange between L8 and M40. The beam diameter at the aperture A2 is identical to
one in the forward beam providing f/50 focusing. The lens L8 is installed on a motorized
translation stage, which can adjust the position of the lens in three dimensions with sub-
micron precision. The X and Y adjustment is used to spatially align aiming of the
colliding beams. The Z coordinate adjustment moves the counter-propagating beam waist
towards or away from the forward beam as necessary, even when the chamber is
evacuated.

112
Turbo
Turbo
Turbo
L8
Micro Channel Plate (MCP)
X,Y,Z“Picomotor”translator
Gas jet
Counter-propagatingbeam
Forward beam L9
EUVgrating
Interactionchamber
Counter-propagating beam insertionchamber
Detectionchamber
CCD 3 , 4
14
15
CCD 2
M35
M36M37
M38
M39M40
Forward beam focusing lenschamber
gratingtranslationand rotationstage
A2
A1
Fig. 6.1 Experimental setup.

113
We observe plasma streaks in the focus of the intense pulses, seen when the
chamber is backfilled with air, using CCD cameras 3 and 4 facing along X and Y
coordinates. The CCD cameras are connected to separate TV monitors. When the
chamber is back-filled with atmospheric pressure air, each beam nominally should focus
to positions 75cm after their respective lenses, but instead they each focus to ~74.5cm
due to the self-focusing effect [78]. When the chamber is evacuated, they focus again at
75cm (because the self-focusing effect goes away). We calibrated the positions of the
beam waists using the CCD cameras observing the plasma streaks in air. We then
determined the necessary displacement for the Z-translation of lens L8 to compensate for
alignment as the chamber was evacuated. For this purpose, lens L8 is moved ~1 cm
towards the focus. The alignment technique is shown in Fig. 6.2.
(a)
(b)~ 1 cm
forward beam
dim dot
bright dot
Fig. 6.2 The misaligned foci (a) in air and (b) under vacuum.
Mirror M40 has a 3 mm diameter hole drilled through its center. The counter-
propagating beam diameter is 9.3 mm upon reflecting from M40. This means that about

114
10% of the beam’s area on the mirror is cut. The energy loss because of the hole is much
less than the loss we incurred for the experiments described in Chapter 3, about 20%. The
focal diameter of the counter-propagating beam is similar that of the forward beam (see
measurement results in Fig. 3.4 in Chapter 3).
The vacuum chamber consists of four sections forming a common vacuum
volume. Each section of the chamber is clamped tight to the optical table and connected
via flexible bellows to the other sections. This provides stability of optical alignment
while the chamber is evacuated. All turbo pumps in the setup are connected to a single
oil-free scroll-roughing pump, which ensures that all sections of the chamber are
evacuated together.
The detection chamber is the same one used in former experiments [72,77]. It
houses either a 1200 lines/mm or a 600 lines/mm tungsten coated grating deposited on
BK-7 glass substrate of focal length 1 meter. The 1200 lines/mm grating can resolve
harmonic orders in the forties or higher, but it is ineffective for harmonic orders in the
twenties. The 600 lines/mm grating is effective for harmonic orders in the twenties and
teens, but the maximum order it can resolve reliably is about the 35th. The detection setup
produces sharp images of distinguished harmonic orders on the phosphor screen. A turbo
pump (70 liter/sec) maintains ~10-6 torr vacuum in the detection chamber. This is
important for the MCP to function properly. The image produced by the MCP can be
observed by eye or on CCD camera 2 connected to a Spiricon beam profiler, coupled
with a PC computer running a LabView software. The entrance to the chamber has a
5mm diameter aperture to restrict the flow of gas from the interaction chamber.

115
An intermediate section of the vacuum chamber setup enables the counter-
propagating beam to enter. Mirror M40, which has a hole through it, is mounted on a
small optical breadboard inside this section. This section is equipped with a turbo pump
(60 liters/sec) for the purpose of differential pumping.
The section of the vacuum chamber where harmonic generation occurs is
equipped with a positioning arm connected to the top flange. The positioner moves the
gas jet in three dimensions within the center of the chamber. At the exit from this
chamber section, a 3mm-diameter aperture restricts gas flow into the intermediate and
detection chamber sections. Two CCD cameras, #3 and #4, are mounted on the bottom in
the middle of this chamber section. They are used to align the colliding beams both
spatially and temporally. The chamber is equipped with a large turbo pump designed to
withstand high gas loads.
The forward beam entrance chamber has AR-coated lens L9 mounted on a flange.
The lens serves as the entrance window for the forward beam. This chamber is designed
not to move when the chamber is evacuated.
The gas jet consists of an electrical pulsed valve (The Lee Company, model VHS-
SP) triggered from the SRS laser-timing box. An oval-shaped nozzle (width 1 mm,
thickness 0.3 mm, length 1 cm) is connected to the valve. We estimate that the width of
the nozzle should correspond to approximately 4 phase zones for the highest-order
harmonics that we observe (see Eq.(1.23)). As seen in Fig. 6.3, the laser notched the
nozzle end-piece since the nozzle was placed as close as possible to the focus during the
preliminary experiments. However, the shape of the eroded nozzle probably helps
maintain a more uniform and concentrated gas density distribution in the region of

116
harmonic generation. In the future, our research group plans to incorporate a gas cell
rather than a pulsed jet, since the cell can provide a more uniform gas distribution in the
interaction region.
Fig. 6.3 The nozzle end-piece eroded (notched) during preliminary experiments.
The repetition rate for the pulsed valve is set to that of the laser, i.e. 10 Hz. The
valve opens ~180 ms prior to the laser pulse arrival. The valve stays open for a regulated
duration as short as 250ms. The pulsed operation of the gas jet helps preserve expensive
gases and decreases the load on the vacuum pumps. The area of the jet’s opening is about
four times that used in former experiments (we used a 300mm diameter nozzle constantly
117
supplying gas into the collision area). If we used a constant flow of gas through this
larger new nozzle opening, it would represent a significant increase in gas usage. Most of
the gas would be wasted between the 10 Hz laser shots. The jet is connected through
flexible tubing to a swage-lock jack mounted on top of the interaction chamber. Outside
of the chamber, the flow is controlled with a leak valve and pressure gauge (species
insensitive). A cylinder of neon or argon gas is hooked up to the valve with flexible
tubing and a gas regulator.
6.2 PRELIMINARY EXPERIMENTAL RESULTS
We generated high-order harmonics in neon gas in the final days before our
laboratory had to be closed for building renovation. The maximum observed harmonic
order was 65th, but only harmonics in the mid-forties were distinguishable on the MCP
after being dispersed from the 1200 lines/mm EUV grating. The detection has to be
modified to effectively resolve harmonic orders higher than mid-forties. Fig. 6.4
represents the image produced on the phosphor screen. Harmonic orders 39th through 45th
are resolved with CCD camera 2.
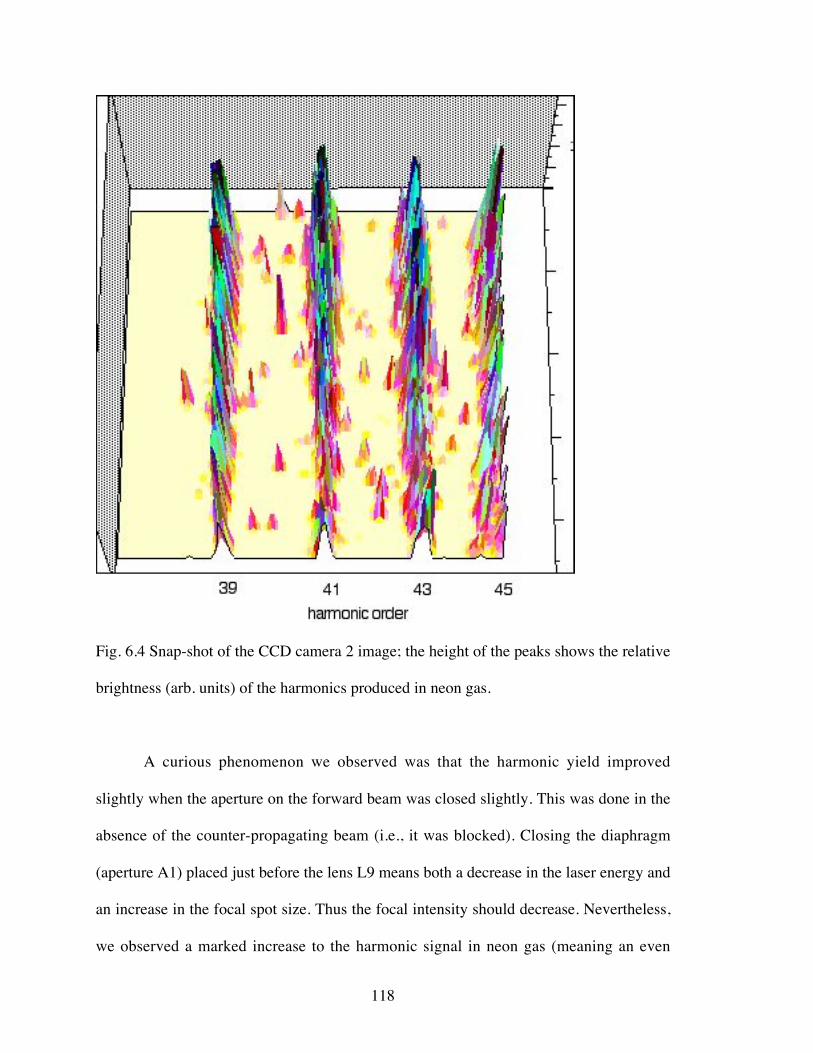
118
Fig. 6.4 Snap-shot of the CCD camera 2 image; the height of the peaks shows the relative
brightness (arb. units) of the harmonics produced in neon gas.
A curious phenomenon we observed was that the harmonic yield improved
slightly when the aperture on the forward beam was closed slightly. This was done in the
absence of the counter-propagating beam (i.e., it was blocked). Closing the diaphragm
(aperture A1) placed just before the lens L9 means both a decrease in the laser energy and
an increase in the focal spot size. Thus the focal intensity should decrease. Nevertheless,
we observed a marked increase to the harmonic signal in neon gas (meaning an even

119
stronger increase of the conversion efficiency). Of course the harmonic production
eventually decreased if the aperture size became too small. Under our conditions, we
observed that the optimal aperture size was 15 mm in diameter. This effect was observed
at several research groups [8,53,93,94]. They used different laser parameters and gases.
We intend to do further study of this phenomenon.
Fig. 6.5 Train of five short counter-propagating pulses colliding with the forward pulse in
air (atmospheric pressure).

120
We created a train of five counter-propagating pulses. The pulses were
compressed to ~80 fs duration and collided with the short forward pulse in the middle of
the air-filled interaction chamber. The pattern of the resulting five bright plasma dots was
observed using CCD camera 3. The image is shown on Fig. 6.5. The vertical axis
indicates the relative brightness. The other two dimensions indicate the positions of the
interacting pulses along the axis of the beam.
Pulse #5 occurs before pulses #4 through #1 in the train. Using the cross-
correlator, we set the distance between two neighboring pulses to be 0.5 mm, which
corresponds to a timing interval of 1.67 ps. Since the forward pulse and the counter-
propagating train of pulses collide with a relative speed of 2c, the distance between the
dots is 0.25 mm (timing 0.83 ps), which is also observed in the cross-correlation setup by
CCD camera 1. We blocked both beams and installed a millimeter-graded ruler at the
place where the beams collided, and confirmed the data obtained by cross-correlation.

121
Fig. 6.6 Superposition of the total of five individual snap-shots of short counter-
propagating pulses (number 1 through 5) colliding with the short forward pulse in air
shows relative brightness of collision dots.
We also took five snap shots of individual pulses in the counter-propagating train
colliding with the forward beam. For this purpose, we blocked four pulses at the retro-
mirror set RM1-RM5 (see Fig. 5.14 in Chapter 5), leaving one of the mirrors unblocked
for each picture. We combined all five data arrays of the snap shots into one, represented
on Fig. 6.6. This figure suggests that each of the collision dots #5 through #1 has a
similar brightness, i.e., the energies of pulses #5 through #1 in the train are similar.
Nevertheless, each of the five dots in Fig. 6.5 has a different brightness. This can be

122
explained by the fact that the forward pulse gets dispersed more and more as it produces
each plasma dot. Thus, it loses its energy before it has a chance to produce the final dots.
That is why the dot #1, the most intense one in the Fig. 6.6, happens to be the weakest
one in the Fig. 6.5.
If the pulses in the counter-propagating train overlap in time, we observe a “beat”
pattern (interference) using the cross-correlation setup. These “beats” occur when the
separation between two neighboring pulses is on the order of the pulse width. The
periodicity of the interference varies depending on the amount of overlap and the pulse
chirp. In the case where two counter-propagating pulses were nearly exactly overlapped
in time, we measured the energy of the output (Molectron detector). A significant
increase in pulse energy was observed, which may be explained by the high degree of
constructive interference between individual pulses. In this case when the pulse power is
high (10 mJ for each pulse in the train before entering the compressor), the optical
elements in the laser and compression setups can be seriously endangered. If these
“beats” are inadvertently formed while adjusting pulse timing during optimization scans
to maximize high harmonics, the experimental results might be misinterpreted. However,
there is a possibility of using the “beats” produced from a pair of pulses to create a rapid
pulse train with many peaks. This might be useful for dealing with severe phase
mismatches where a short period for quasi phase match would be ideal. The period of the
interference peaks could be chosen to align with the period of the “out-of-phase” zones.
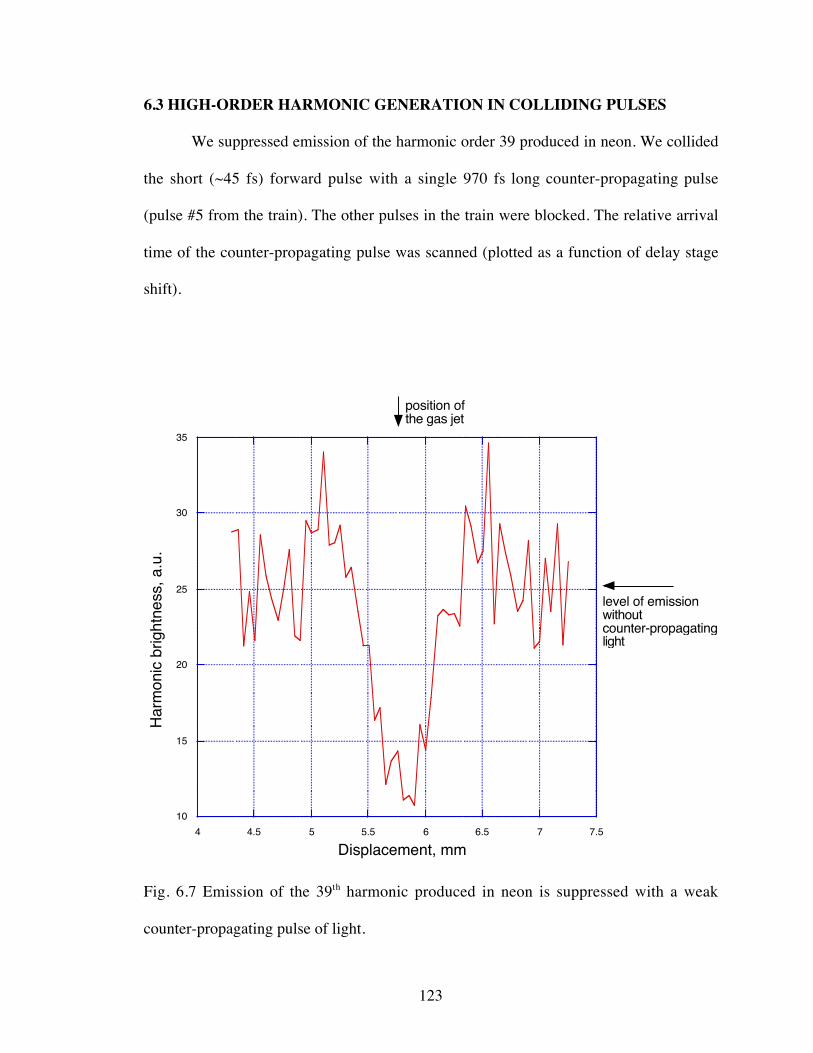
123
6.3 HIGH-ORDER HARMONIC GENERATION IN COLLIDING PULSES
We suppressed emission of the harmonic order 39 produced in neon. We collided
the short (~45 fs) forward pulse with a single 970 fs long counter-propagating pulse
(pulse #5 from the train). The other pulses in the train were blocked. The relative arrival
time of the counter-propagating pulse was scanned (plotted as a function of delay stage
shift).
10
15
20
25
30
35
4 4.5 5 5.5 6 6.5 7 7.5
Har
mon
ic b
right
ness
, a.u
.
Displacement, mm
level of emissionwithoutcounter-propagatinglight
position of the gas jet
Fig. 6.7 Emission of the 39th harmonic produced in neon is suppressed with a weak
counter-propagating pulse of light.

124
The intensity of the counter-propagating light is lower than the main generating pulse
intensity by roughly a factor of 60. Thus, its intensity is insufficient to ionize the medium
significantly. We checked that when the counter-propagating pulse arrived either well
before or after the main generating pulse, the harmonic production was the same with or
without the counter-propagating light.
As is evident in Fig. 6.7, the harmonic generation process is turned off in part.
The delay stage (13) displacement is correspondent to the relative arrival of forward
beam. The emission of 39th harmonic is reduced by a factor of 3. The figure shows the
emission of the 39th harmonic produced in neon with a jet backing pressure of 225 torr.
This is a relatively high backing pressure despite the use of the pulsing jet. This backing
pressure reveals the fact that the jet nozzle opening is much wider than that used in
former experiments (see Chapter 3).
6.4 INTERPRETATION OF EXPERIMENTAL RESULTS
Our new laser system does not require frequent re-alignment. The shot-to-shot
energy fluctuation of the laser system is ~10%. The forward and counter-propagating
beams are identically p-polarized with f/50 focusing. The measured forward beam waist
diameter is 70 mm (FWHM, measured from 1/e2 intensity) indicating 1.3 times the
diffraction limit. The energies of the forward and counter-propagating pulses before
entering the compressor setup are 21 mJ and 10 mJ, 4mJ and 1.8 mJ after the
compressors, respectively. The forward pulse can be compressed to a duration of 45±4 fs,

125
reaching a focused intensity of 2.4¥1015 W/cm2 (see Eq.(1.8)). The error in the pulse
duration measurement is due to the resolution in our auto-correlator setup.
We can produce high harmonics up to the 65th order in neon. However, currently
we can reliably distinguish the harmonics up to the 45th order; our detection setup has to
be upgraded to accommodate higher orders. The laser intensity necessary to produce
harmonics from neon ions is around 1.1¥1016 W/cm2 (see Table 1.2). If the energy loss in
the main pulse re-compression stage was a factor of 2 instead of 5 and if it had a duration
of 25fs, we could, in principle, produce the harmonics from neon ions past the 119th
order. The gratings (Thermo-RGL) in the stretcher and in the main beam compressor are
the first objective of our future experiment optimization investigations.
We created a train of five counter-propagating pulses. The distance between
neighboring pulses in the train can be varied with sub-femtosecond precision (much more
accuracy than needed). The pulses in the counter-propagating train can be chirped all
together to any desired duration, so that they can be collided with the strong forward
harmonics-generating pulse throughout a wide jet of gas. We hope to control emission of
particular harmonic orders using several counter-propagating pulses through a trial-and-
error procedure in order to find particular “out-of-phase” zones in laser focus where
harmonic emission should be diminished. This technique should lead to overall
enhancement of high-harmonic production. A computer program running the translation
stages at the mirrors RM1-RM4, coupled with the CCD camera 2 (see Chapter 5) and
using a genetic algorithm [95] would be ideal for future experiments.
We suppressed harmonic emission produced in neon. The contrast for the 39th
harmonic is approximately 3 times. This is not a significant suppression compared with
126
the cases discussed in Chapter 3. However, these trial runs represent an initial step
towards a series of new experiments at higher pulse energy. They demonstrate that the
necessary equipment is in place and functioning. The earlier proof-of-principle
experiments (see Chapter 3) give reason for optimism that it should be possible to
improve output of high-order harmonics by as much as two orders of magnitude.

127
REFERENCES
1 . S. Backus, J. Peatross, C.P. Huang, M.M. Murnane, and H.C. Kapteyn,
“Ti:Sapphire amplifier producing millijoule-level, 21 fs pulses at 1 kHz,” Opt.
Lett. 20, 2000 (1995).
2. Sterling Backus, Charles G. Durfee III, Margaret M. Murnane, and Henry C.
Kapteyn, “High power ultrafast lasers,” Rev. Sci. Instrum. 69, 1207 (1998).
3 . C.-G. Wahlstrom, “Generation and applications of high-order harmonic
radiation,” Proc. SPIE, Vol. 2520, p.105.
4. P.A. Franken, P.A. Hill, C.W. Peters, and G. Weinreich, “Generation of optical
harmonics,” Phys. Rev. Lett. 7, 118 (1961).
5. U. Heitmann, M. Kotteritzsch, S. Heitz, A. Hese, Appl. Phys. B 55, 419 (1992).
6. A. McPherson, G. Gibson, H. Jara, U. Johann, T.S. Luk, L.A. Mcintyre, K. Boyer,
and C.K. Rhodes, “Studies of Multiphoton Production of Vacuum-Ultraviolet
Radiation in Rare Gases,” J. Opt. Soc. Am. B 4, 595 (1987).
7. A. L’Hullier and P. Balcou, “High-order harmonic generation in rare gases with a
1-ps 1053 nm laser,” Phys. Rev. Lett. 70, 774 (1993).
8. J.J. Macklin, J.D. Kmetec and C.L. Gordon III, “High-order harmonic generation
using intense femtosecond pulses,” Phys. Rev. Lett. 70, 766 (1993).
9. S. G. Preston, A. Sanpera, M. Zepf, W. J. Blyth, C. G. Smith, J. S. Wark, M. H.
Key1, K. Burnett, M. Nakai, D. Neely, and A. A. Offenberger, “High-order
harmonics of 248.6-nm KrF laser from helium and neon ions,” Phys. Rev. A 53,
31 (1996).
128
10. Zenghu Chang, Andy Rundquist, Haiwen Wang, Margaret M. Murnane, and
Henry C. Kapteyn, “Generation of coherent soft x-rays at 2.7 nm using high
harmonics,” Phys. Rev. Lett. 79, 2967 (1997).
11. Ivan P. Christov, Margaret M. Murnane, and Henry C. Kapteyn, “Generation and
propagation of attosecond x-ray pulses in gaseous media,” Physical Review A 57,
R2285 (1998).
12. Raoul Zerne, Carlo Altucci, Marco Bellini, Mette B. Gaarde, T. W. Hänsch,
Anne L'Huillier, Claire Lyngå, and C.-G. Wahlström, “Phase-Locked High-Order
Harmonic Sources,” Phys. Rev. Lett. 79, 1006 (1997).
13. P. Salieries, A. L’Huiller, P. Antoine, and M. Lewenstein, “Spatial and Temporal
coherence of high-order harmonics,” J. Phys. B: At. Mol. Opt. Phys. 41, 84
(1999).
14. T. Ditmire, E. T. Gumbrell, R. A. Smith, J. W. G. Tisch, D. D. Meyerhofer, and
M. H. R. Hutchinson, “Spatial Coherence Measurement of Soft X-Ray Radiation
Produced by High Order Harmonic Generation,” Phys. Rev. Lett. 77, 4756
(1996).
15. D. Attwood, “Soft X-rays and Extreme Ultraviolet Radiation,” Cambridge View
Press, Cambridge (1999).
16. J.F. Reintjes, “Nonlinear Optical Parametric Processes in Liquids and Gases,”
Academic Press, Orlando (1984).
17. R.W. Boyd, “Nonlinear Optics,” Academic Press, San Diego (1992).
18. P.W. Milonni and J.H. Eberly, “Lasers,” Wiley, New York (1988).

129
19. N. Bloembergen, “Nonlinear Optics,” 2nd ed., Benjamin, Reading, Massachusetts
(1977).
20. K.C. Kulander and B.W. Shore, “Calculations of multi-harmonic conversion of
1064-nm radiation in Xe,” Phys. Rev. Lett. 62, 524 (1989).
21. L. Plaja and L. Roso-Franco, “Adiabatic theory for high-order harmonic
generation in a two-level atom,” J. Opt. Soc. Am. B 9, 2210 (1992).
22. J. Peatross, “The Far-Field Angular Distribution of High-Order Harmonics
Produced in Light Scattering From a Thin Low-Density Gas Target,” Ph.D.
Dissertation, Laboratory for Laser Energetics Report No. 239, University of
Rochester (1993).
23. B.W. Shore and P.L. Knight, “Enhancement of high optical harmonics by
excess-photon ionization,” J. Phys. B: At. Mol. Opt. Phys. 20 (1987).
24 . S. Augst, D. Strickland, D.D. Meyerhofer, S.L. Chin, and J.H. Eberly,
“Tunneling ionization of noble gases in a high-intensity laser field,” Phys. Rev.
Lett. 63, 2212 (1989).
25. P. Moreno, L. Plaja, V. Malyshev and L. Roso, “Influence of barrier suppression
in high-order harmonic generation,” Phys. Rev. A 58, 4746 (1995).
26. Kenzo Miyazaki and Hideyuki Takada, “High-order harmonic generation in the
tunneling regime,” Phys. Rev. A 52, 3007 (1995).
27. S. Augst, D.D. Meyerhofer, D. Strickland, and S.L. Chin, “Laser ionization of
noble gases by Coulomb-barrier suppression,” J. Opt. Soc. Am. B 8 (4) (1991).
130
28. J.L .Krause, K.J. Schafer, and K.C. Kulander, "High-order harmonic generation
from atoms and ions in the high intensity regime," Phys. Rev. Lett. 68, 3535
(1992).
29. P.B. Corkum, "Plasma perspective on strong-field multiphoton ionization,” Phys.
Rev. Lett. 71, 1994 (1993).
30. M.V. Ammosov, N.B. Delone and V.P. Krainov, “Tunnel ionization of complex
atoms and of atomic ions in an alternating electromagnetic field,” Soviet Physics
JETP 64 (6), 1191 (1986).
31. Anne L'Huillier, M. Lewenstein, P. Solieres, and Ph. Balcou, "High-order
harmonic generation cutoff," Phys. Rev. A.48, R3433 (1993).
32. J. Zhou, J. Peatross, M.M. Murnane, and H.C. Kapteyn, “Enhanced high-
harmonic generation using 25 fs laser pulses,” Phys. Rev. Lett. 76, 752 (1996).
33. Ivan P. Christov, J. Zhou, J. Peatross, A. Rundquist, M.M. Murnane, and H.C.
Kapteyn, “Non-adiabatic effects in high-harmonic generation with ultrashort
pulses,” Phys. Rev. Lett. 77, 1743 (1996).
34. Jeffrey L. Krause, Kenneth J. Schafer, and Kenneth C. Kulander, “High-order
harmonic generation from atoms and ions in the high intensity regime,” Phys.
Rev. Lett. 68, 3535 (1992).
35. M.W. Walser, C.H. Keitel, A. Scrinzi, and T. Brabec, “High harmonic generation
beyond the electric dipole approximation,” Phys. Rev. Lett. 85, 5082 (2000).
36. I.P. Christov, R. Bartels, H.C. Kapeyn, and M.M. Murnane, “Attosecond time-
scale intra-atomic phase-matching of high-harmonic generation,” Phys. Rev. Lett.
86, 5458 (2001).

131
37. Dejan B. Miloshevich, Suxing Hu, and Wilhelm Becker, “Quantum-mechanical
model for ultrahigh-order harmonic generation in the moderately relativistic
regime,” Phys. Rev. A 63, 011403(R) (2001).
38. M.Yu. Kuchiev and V.N. Ostrovsky, “Quantum theory of high harmonic
generation as a three-step process,” Phys. Rev. A 60, 3111 (1999).
39. Hyun Joon Shin, Dong Gun Lee, Yong Ho Cha, Kyung Han Hong, and Chang
Hee Nam, “Generation of non-adiabatic blueshift of high harmonics in an intense
femtosecond laser field,” Phys. Rev. Lett. 83, 2544 (1999).
40. Armin Scrinzi, Michael Geissler, and Thomas Brabec, “Ionization above the
Coulomb barrier,” Phys. Rev. Lett. 83, 706 (1999).
41. M. Lewenstein, Ph. Balcou, M.Yu. Ivanov, Anne L'Huillier, and P.B. Corkum,
"Theory of high-harmonic generation by low-frequency laser fields," Phys. Rev.
A 49, 2117 (1994).
42. A. L’Huillier, X. Li, and L. Lompre, “Propagation effects in high-order harmonic
generation in rare gases,” J. Opt. Soc. Am. B 7, 527 (1990).
43. C. Altucci, T. Starczewski, E. Mevel, C.-G. Wahlstrom, B. Carre, A. L'Huillier,
“Influence of atomic density in high-order harmonic generation,” J. Opt. Soc. Am.
B 13, 148 (1996).
44. A. L’Huillier, K. J. Schafer, and K. C. Kulander, “Theoretical Aspects of Intense
Field Harmonic Generation,” J. Phys. B: At. Mol. Opt. Phys. 24, 3315 (1991).
45. A. L'Huillier, Ph. Balcou, S. Candel, K. J. Schafer, and K. C. Kulander,
"Calculations of High-Order Harmonic-Generation Processes in Xenon at
1064nm," Phys. Rev. A 46, 2778 (1992).

132
46. J. Peatross and D.D. Meyerhofer, “Intensity-dependent phase effects in high-
order harmonic generation,” Phys. Rev. A 52, 3976 (1995).
47. P. Salieres, A. L'Huillier, and M. Lewenstein, “Coherence control of high-order
harmonics,” Phys. Rev. Lett. 74, 3776 (1995).
48. J. Peatross, M. V. Fedorov, K. C. Kulander, “Intensity-dependent phase-matching
effects in harmonic generation,” J. Opt. Soc. Am. B 12, 863 (1995).
49. J.B. Madsen, L. Hancock, I.Kohl, S.L. Voronov, and J. Peatross, “Search for
High Harmonic Generation in the Reverse Direction Due to Intrinsic Phases,”
Proceedings of the “Application of High Field and Short Wavelength Sources IX,”
OSA topical meeting, Palm Springs, CA (2001).
50. C. Altucci, T. Starczewski, E. Mével, C. G. Wahlström, B. Carré, and A.
L’Huillier, “Influence of Atomic Density In High-Order Harmonic Generation,” J.
Opt. Soc. Am. B 13, 148-156 (1996).
51. Charles G. Durfee III, Sterling Backus, Margaret M. Murnane, and Henry C.
Kapteyn, “Ultrabroadband phase-matched optical parametric generation in the
ultraviolet by use of guided waves,” Phys. Rev. Lett. 83, 2187 (1999).
52. Andy Rundquist, Charles G. Durfee III, Zenghu Chang, Catherine Herne,
Sterling Backus, Margaret M. Murnane, and Henry C. Kapteyn, “Phase-matched
generation of coherent soft x-rays,” Science, vol. 280 (1998).
53. J.-F. Hergott, M. Kovacev, H. Merdji, C. Hubert, Y. Mairesse, E. Jean, P. Breger,
P. Agostini, B. Carré, and P. Salières,” Extreme-ultraviolet high-order harmonic
pulses in the microjoule range,” Phys. Rev. A 66, 021801(R) (2002).

133
54. A. Braun, G. Korn, X. Liu, D. Du, J. Squier, G. Mourou, “Self-channeling of
high-peak-power femtosecond laser pulses in air,” Opt. Lett. 20, 73 (1995).
55. C. W. Siders, N. C. Turner III, M. C. Downer, A. Babine, A. Stepanov, A. M.
Sergeev, “Blue-shifted third-harmonic generation and correlated self-guiding
during ultrafast barrier suppression ionization of sub-atmospheric density noble
gases,” J. Opt. Soc. Am. B 13, 330 (1996).
56. H. R. Lange, A. Chiron, J.-F. Ripoche, A. Mysyrowicz, P. Breger, and P.
Agostini, “High-Order Harmonic Generation and Quasi Phase Matching in Xenon
Using Self-Guided Femtosecond Pulses,” Phys. Rev. Lett. 81, 1611 (1998).
57. Y. Tamaki, J. Itatani, Y Nagata, M. Obara, and K.Midirikawa, “Highly efficient,
phase-matched high-harmonic generation by a self-guided laser beam,” Phys.
Rev. Lett. 82,1422 (1999).
58. E. Constant, D. Garzella, P. Breger, E. Mevel, Ch. Dorrer, C. Le Blanc, F. Salin,
and P. Agostini, "Optimizing high harmonic generation in absorbing gases: model
and experiment," Phys. Rev. Lett. 82, 1668 (1999).
59. J. Peatross et al., “High-Order Harmonic Generation with a 25-femtosecond
Laser Pulse,” Proceedings of the “NATO Advanced Research Workshop on Super
Intense Laser-Atom Physics IV” (Moscow, Russia), p.455 (1995).
60. Z. Chang, A. Rundquist, H. Wang, I. Christov, H.C. Kapteyn, and M.M.
Murnane, “Temporal phase control of soft-x-ray harmonic emission,” Phys. Rev.
A 58, R30 (1998).
134
61. R. Bartels, S. Backus, E. Zeek, L. Misogiti, G. Vdovin, I.P. Christov. M.M.
Murnane, and H.C. Kepteyn, “Shaped-pulse optimization of coherent emission of
high-harmonic soft x-rays,” Nature, vol. 406, 164 (2000).
62. P. Salieres, A. L'Huillier, and M. Lewenstein, "Coherence Control of High-Order
Harmonics," Phys. Rev. Lett. 74, 3776 (1995).
63. L. Roos, E. Constant, E. Mevel, Ph. Balcou, D. Descamps, M. Gaarde, A.
Valette, R. Haroutunian, and A. L’Huillier, “Controlling phase matching of high-
order harmonic generation by manipulating the fundamental field,” Phys. Rev. A
60, 5010 (1999).
64. Fornaciari, Neal R.; Chang, Jim J.; Folk, Daniel R.; Gianoulakis, Steven E.;
Goldsmith, John E.; Kubiak, Glenn D.; Long, Bruce C.; O'Connell, Donna J.;
Shimkaveg, Gregory M.; Silfvast, William T.; Stewart, Kenneth D.;
“Development of an electric capillary discharge source,” Proc. SPIE, Vol. 3997,
120 (2000).
65. C.-G. Wahlstrom, S. Borgstrom, J. Larsson, and S.-G. Pettersson, "High-Order
Harmonic Generation in Laser-Produced Ions Using a Near-Infrared Laser," Phys.
Rev. A 51, 585 (1995).
66. P. L. Shkolnikov, A. Lago, and A. E. Kaplan, “Optimal quasi-phase-matching for
high-order harmonic generation in gases and plasmas,” Phys. Rev. A 50 (6),
R4461 (1994).
67. P. L. Shkolnikov, A. E. Kaplan, and A. Lago, "Phase-Matching Optimization of
Large-Scale Nonlinear Frequency Upconversion in Neutral and Ionized Gases," J.
Opt. Soc. Am. B 13, 412 (1996).

135
68. J. Peatross, S. Voronov, and I. Prokopovich, "Selective Zoning of High
Harmonic Emission Using Counter-Propagating Light," Optics Express 1, 114
(1997).
69. Birulin et al., “High-Harmonic Generation in Interfering Waves,” JETP 83, 33
(1996).
70. Ian Kohl, “Construction of a high-intensity femtosecond laser system for
experiments in intrinsic atomic phase effects in high harmonic generation,” M.Sc.
Thesis, Brigham Young University (1999).
71. Margaret Murnane and Henry Kapteyn, Chung-Po Huang and Melanie T. Asaki,
“Mode-locked Ti:Sapphire Laser,” Rev. 1.7, Washington State University (1994).
72. S.L. Voronov, I. Kohl, J.B. Madsen, N. Terry, J. Titensor, Q. Wang, and J.
Peatross, "Control of Laser High Harmonic Generation with Counter-Propagating
Light," Phys. Rev. Lett. 87, 133902 (2001).
73. J. Peatross, J. Chaloupka, and D. D. Meyerhofer, "High-Order Harmonic
Generation with an Annular Laser Beam," Opt. Lett. 19, 942 (1994).
74. N. Terry, “Imaging High Order Harmonics With a Curved Diffraction Grating,”
Senior Thesis, Brigham Young University (2000).
75. Y.Wang, Y. Liu, X. Yang, and Z. Xu, ”Spectral splitting in high-order harmonic
generation,” Phys. Rev. A 62, 063806 (2000).
76. J. Peatross, M. V. Fedorov, and K. C. Kulander, "Intensity-Dependent Phase-
Matching Effects in Harmonic Generation," J. Opt. Soc. Am. B 12, 863 (1995).

136
77. J.B. Madsen, L.A. Hancock, S.L. Voronov, and J. Peatross, “High-Order
Harmonic Generation in Crossed Laser Beams," J. Opt. Soc. Am. B 20, 166
(2003).
78. John B. Madsen, “Experiments in laser high harmonic generation with multiple
beams,” M.Sc. Thesis, Brigham Young University (2001).
79. D.E. Aspnes, “The accurate determination of optical properties by ellipsometry,”
Handbook of Optical Constants of Solids, Academic Press (1985).
80. J. Barth, R.L. Johnson, S. Logothetidis, M. Cardona, D. Fuchs, and A.M.
Bradshaw, “Spectroscopic ellipsometry with synchrotron radiation: latest
developments,” Proc. SPIE, 733, 265 (1986).
8 1 . D. Chandler-Horowitz and G.A. Candela, “Principal angle spectroscopic
ellipsometry utilizing a rotating analyzer,” Appl. Opt. 21, 2972 (1982).
82. R.M.A. Azzam and N.M. Bashara, “Ellipsometry and Polarized Light,” Elsevier
(1987).
83. H. Hochst, P. Bulicke, T. Nelson, and F. Middleton, “Performance evaluation of
a soft x-ray quadruple reflection circular polarizer,” Rev. Sci. Instr. 66 (2), 1598
(1995).
84. J. Barth, R.L. Johnson, and M. Cardona, “Spectroscopic ellipsometry in the 6-35
nm region,” Handbook of Optical Constants of Solids, Academic Press (1985).
85 . H. G. Tompkins and W. A. McGahan, “Spectroscopic Ellipsometry and
Reflectometry: A User’s Guide,” John Wiley & Sons, New York (1999).
86. Technical note 13, Thermo-RGL internal publication (2002).
137
87. D. Strickland and G. Mourou, “Compression of amplified optical pulses,” Opt.
Comm. 56, 219 (1985).
88. O.E. Martinez, J.P. Gordon, and R.L. Fork, “Negative group- velocity dispersion
using refraction,” J. Opt. Soc. Am. A 1 (10), 1003 (1984).
89. P.F. Moulton, “Spectroscopic and laser characteristics of Ti:Al2O3,” J. Opt. Soc.
Am. B 3,125 (1986).
90. J. Zhou, “Temporal stretching, recompression and amplification of ultrashort
pulses,” M.Sc. Thesis, Washington State University (1992).
91. Jamie Titensor, “Creating shaped counter-propagating laser pulses to increase
high harmonic production,” B.Sc. Thesis, Brigham Young University (2001).
92. J. Peatross and A Rundquist, “Temporal decorrelation of short laser pulses,” J.
Opt. Soc. Am. B 15, 216 (1998).
93. Ph. Balcou, C. Cornaggia, A.S.L. Gomes, L.A. Lompre, and A. L’Huillier,
J.Phys. B: At. Mol. Opt. Phys. 25, 4467 (1992).
94. T. Ditmire, J.K. Crane, H. Nguyen, L.B. DaSilva, and M.D. Perry, “Energy-yield
and conversion-efficiency measurements of high-order harmonic radiation,” Phys.
Rev. A 51, R902 (1995).
95. B.J. Pearson, J.L. White, T.C. Weinacht, and P.H. Bucksbaum, “Coherent control
using adaptive learning algorithms,” Phys. Rev. A 63, 063412 (2001).

138

139
APPENDIX
A1. Auto- and cross-correlation techniques
The cross-correlation uses a CCD camera and a beam profile analyzer (Spiricon)
to view the second harmonic light (400 nm) generated by mixing of two crossing pulses
in the crystal. The path lengths of both beams must be matched so that the pulses arrive
simultaneously in the crystal. The crystal is installed on a rotation stage, which may tilt
the crystal to an arbitrary angle relative to the crossing beams. The crystal is a square
piece of KDP crystal with 0.1 mm thickness and 4.5x4.5 mm2 surface area. It is mounted
vertically in a 1-inch round holder that can rotate. The holder can be turned within this
mount around an axis normal to the crystal’s surface. The crystal surface plane stays
perpendicular to the optical table surface at all times. For cross-correlation, the
beamsplitterr BS11 must be removed from its kinematic mount and set away. The mirror
M23 must be installed in its place on the same kinematic mount. The image of the cross-
correlation stripe in the crystal is projected in 1:1 proportion onto the CCD camera 1
using the 20 cm focal length lens L7.
For auto-correlation, the beamsplitter BS11 must be installed on its magnetic
mount. The distances “BS11-M33-M34-crystal” and “BS11-M29-M30-M31-crystal”
must be equal to each other in order to cause an interaction between the pulses (making a
stripe of 400 nm light (blue color) from the crystal). The tilt of the crystal relative to the
auto-correlated beams directions is not necessarily similar to the cross-correlation case
tilt. Since the angle between the auto-correlated beams is different (usually, smaller) from
the cross-correlation case, the tilt must be adjusted to achieve the best phase match of the

140
two correlated beams, i.e., the best second harmonic generation efficiency. The mirror
M22 shares the same magnetic mount with the mirror M23. Mirror M23 must be
substituted for the mirror M22 for auto-correlation.
A2. Timing sequencing in the system
A periodic signal of positive polarity with the threshold amplitude of 0.04-0.20 V
and frequency 100 MHz arrives at the SRS timing box from an avalanche photodiode
installed in the oscillator. The timing box triggers on one of these peaks after which it
ignores input until all timing delays have been executed. The signal gives a timing mark
to the rest of the delay channels in the box.
SRS delay box #1.
1. Channel C. Timing C=T+0.100000000 s. This is a “dummy” channel, which creates
the repetition rate of 10Hz for the rest of delay circuits. The SRS delay box is
triggered from one of the peaks in the signal arriving from an avalanche photodiode
(50 Ohm load). The channel C allows triggering of the rest of the delays in the system
only at the repetition rate set at C, i.e., at 10 Hz. The signal from channel C triggers
the flashlamps in the “Quanta Ray” pump laser.
2. Channels A and B. Timing A=T+181.800 ms and timing B=A+0.300 ms. These two
channels produce a rectangular signal at the “positive” AB output. This AB output is
coupled to the Q-switch trigger of the “Quanta Ray” laser. The Q-switch can release
the stored energy from that laser at the rising edge of the “positive” AB signal. The
12ns pulse from the “Quanta Ray” laser occurs at the repetition rate set at channel.

141
The laser produces of up to 700 mW of average power. The timing B is necessary to
reset the triggering logic in the laser.
3. Channel D. Timing D=T+0.001 s. This channel is coupled with the pulsing gas jet
electronics. The jet starts opening at the time T for the duration 0.001 s.
The delay box #2 is triggered by positive signal of 1.9±0.1 V from box #1 output.
The two boxes work as if they were one, the repetition rate being directed by the channel
C of the box #1.
SRS delay box #2.
1. Channel A. Timing A=T+181.938 ms. This channel is the only channel that must
be adjusted ±5 ns or less at any start-up of the oscillator (the maximum value of
amplified pulse peak power is observed using a photodiode connected to an
oscilloscope and placed after the first amplification stage). The signal from A
arrives at trigger port #1 of Pockels cell #1. A 6-foot coaxial cable is connected
between trigger ports #1 and #2, providing a rectangular window of the 6ns
duration during which the cell is energized.
2. Channel B. Timing B=A+0.042 ms. The signal from B arrives at trigger port #1 of
Pockels cell #2. The 6-foot coaxial cable is connected between trigger ports #1
and #2 providing a window of the 6ns duration during which the cell is energized.
142
3. Channel C. Timing C=A+0.043 ms. The signal from C arrives at trigger port #1 of
Pockels cell #3. A difference of 1 ns between B and C naturally corresponds to a
distance of 1 foot that light travels between Pockels cells #2 and #3.
4. Channel D. Timing D=A+0.059 ms. The signal from D arrives at trigger port #2 of
Pockels cell #3. The signals from C and D provide a 16 ns window during which
the cell is energized allowing the amplified pulse travel from amplifier stage #1 to
amplifier stage #2. By the time the cell later becomes de-energized, the counter-
propagating train returns (about 15ns later). The counter-propagating beam is
ejected from the plate polarizer towards periscope #4.