convenience foods for the hotel, restaurant, and
TRANSCRIPT
Convenience Foods for the Hotel, Restaurant, and Institutional Market
The Processor's View Agricultural Economic Report No.344
Economic Research Service U.S. Department of Agriculture
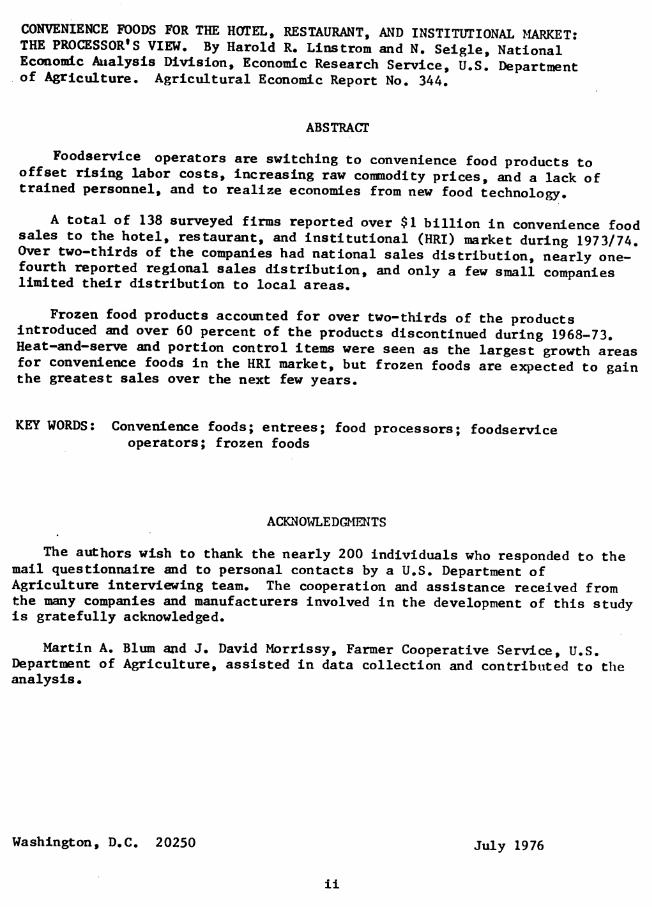
CONVENIENCE FOODS FOR THE HOTEL, RESTAURANT, AND INSTITUTIONAL MARKET: THE PROCESSOR'S VIEW. By Harold R. Linstrom and N. Seigle, National Economie Analysis Division, Economic Research Service, U.S. Department of Agriculture. Agricultural Economic Report No. 344.
ABSTRACT
Foodservice operators are switching to convenience food products to offset rising labor costs, increasing raw commodity prices, and a lack of trained personnel, and to realize economies from new food technology.
A total of 138 surveyed firms reported over $1 billion in convenience food sales to the hotel, restaurant, and institutional (HRI) market during 1973/74. Over two-thirds of the companies had national sales distribution, nearly one- fourth reported regional sales distribution, and only a few small companies limited their distribution to local areas.
Frozen food products accounted for over two-thirds of the products introduced and over 60 percent of the products discontinued during 1968-73. Heat-and-serve and portion control items were seen as the largest growth areas for convenience foods in the HRI market, but frozen foods are expected to gain the greatest sales over the next few years.
KEY WORDS: Convenience foods; entrees; food processors; foodservice operators; frozen foods
ACKNOWLEDGMENTS
The authors wish to thank the nearly 200 individuals who responded to the mail questionnaire and to personal contacts by a U.S. Department of Agriculture interviewing team. The cooperation and assistance received from the many companies and manufacturers involved in the development of this study is gratefully acknowledged.
Martin A. Blum and J. David Morrissy, Farmer Cooperative Service, U.S. Department of Agriculture, assisted in data collection and contributed to the analysis.
Washington, D.C. 20250 July 1976
ii
CONTENTS
Page
iv Summary
Introduction
\íhat is a Convenience Food? ^
2 Why Convenience Foods?
Importance of Technology
3 Sales Analysis
\flio Buys Convenience Foods?
New Ideas
Q Products Introduced •
Products Discontinued
Substitutes and Analogs
A Look at the Future ^^
iii
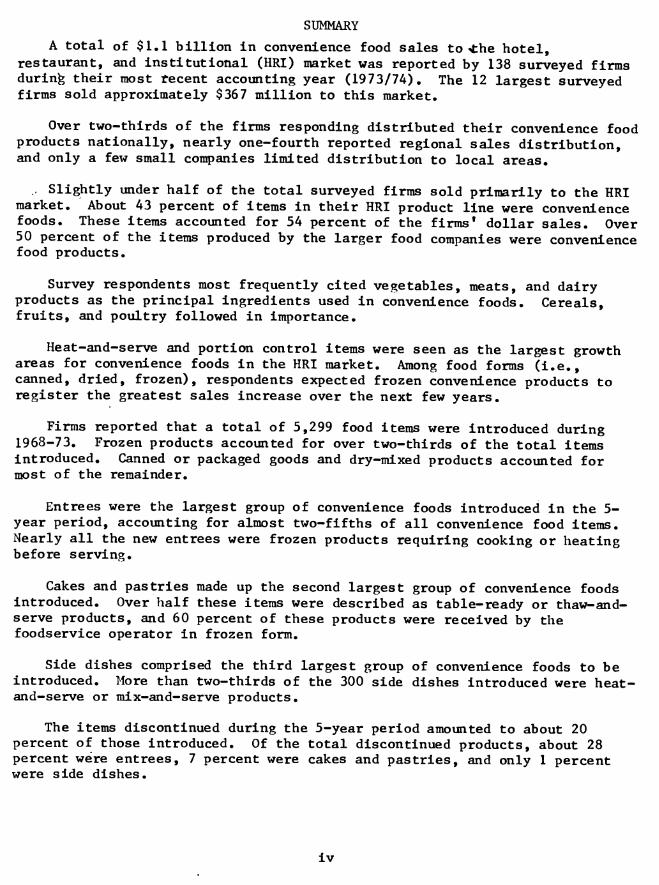
SUMMARY
A total of $!•! billion in convenience food sales to ^he hotel, restaurant, and institutional (HRI) market was reported by 138 surveyed firms during their most recent accounting year (1973/74)• The 12 largest surveyed firms sold approximately $367 million to this market*
Over two-thirds of the firms responding distributed their convenience food products nationally, nearly one-fourth reported regional sales distribution, and only a few small companies limited distribution to local areas,
.. Slightly under half of the total surveyed firms sold primarily to the HRI market. About 43 percent of items in their HRI product line were convenience foods. These items accounted for 54 percent of the firms' dollar sales. Over 50 percent of the items produced by the larger food companies were convenience food products.
Survey respondents most frequently cited vegetables, meats, and dairy products as the principal ingredients used in convenience foods. Cereals, fruits, and poultry followed in importance.
Heat-and-serve and portion control items were seen as the largest growth areas for convenience foods in the HRI market. Among food forms (i.e., canned, dried, frozen), respondents expected frozen convenience products to register the greatest sales increase over the next few years.
Firms reported that a total of 5,299 food items were introduced during 1968-73. Frozen products accounted for over two-thirds of the total items introduced. Canned or packaged goods and dry-mixed products accounted for most of the remainder.
Entrees were the largest group of convenience foods introduced in the 5- year period, accounting for almost two-fifths of all convenience food items. Nearly all the new entrees were frozen products requiring cooking or heating before serving.
Cakes and pastries made up the second largest group of convenience foods introduced. Over half these items were described as table-ready or thaw-and- serve products, and 60 percent of these products were received by the foodservice operator in frozen form.
Side dishes comprised the third largest group of convenience foods to be introduced. More than two-thirds of the 300 side dishes introduced were heat- and-serve or mix-and-serve products.
The items discontinued during the 5-year period amounted to about 20 percent of those introduced. Of the total discontinued products, about 28 percent were entrees, 7 percent were cakes and pastries, and only 1 percent were side dishes.
iv
CONVENIENCE FOODS FOR THE HOTEL, RESTAURAîiT, AI^D INSTITUTIONAL MARICET: THE PROCESSOR'S VIEW
By
Harold R, Linstrom and N. Seiç>le, Agricultural Economists National Economic Analysis Division
Economic Research Service
INTRODUCTION
Since World War II, there has been a rapid growth in the use of convenience foods in home-prepared meals. Convenience foods are characterized by frozen, canned, dry mixes, powdered, and freeze-dried products. Consumers, familiar with these convenience foods, are becominj^ aware of their increasing use by fast-food outlets, restaurants, and other foodservices. High costs of labor and energy, equipment, food ingredients, and the lack of culinary skill are reasons why food managers are attracted to the convenience food concept.
In 1974, Americans spent over $147 billion for food. Nearly a third of this amount was spent for food eaten away from home, and about one out of three meals is now eaten away from home._l^/ By 1985, our food spending may be evenly divided between home and away-from-home eating.
The use of convenience foods is expected to continue to increase as a result of new technology, including the use of disposable packaging, new package coatings and films, and the concept of portion control.
This report suggests a definition for convenience foods used in the foodservice industry, discusses reasons for their growing importance, and reports the results of a survey of firms manufacturing these foods for the hotel, restaurant, and institutional (HRI) market.
A mail survey of 430 food processing firms selling to the HRI market was conducted in 1973. Over 30 percent (138) of the companies returned completed questionnaires, and another 28 firms were personally interviewed. The interviews, designed to obtain trend and opinion information rather than statistical data, were completed in 1974.
WHAT IS A CONVENIENCE FOOD?
Quite often different features come to mind when discussing convenience foods. For years, the food industry has been seeking a common definition for these products which could be used by manufacturers and consumers. Earlier studies of convenience foods have used the following generic description:
y Marketing and Transportation Situation, Econ. Res. Serv,, U.S. Dept. Agr., Aug. 1975, p. 26.

"foods which have services added to the basic inj^redients to reduce the amount of preparation required in the home."2^/
Discussions with leaders in the food industry, social scientists, and USDA market research experts led to the use of the following definition for convenience foods for this report: "...fully or partially prepared dishes; foods in which significant amounts of preparation time, culinary skills, and energy inputs have been transferred from the kitchen of the foodservice operator to the food processor and distributor." This definition prefaced the mail survey and was used during personal interviews with members of the food processing industry. Respondents were asked to limit their comments to convenience products which had been introduced during 1968-73. By this approach, discussion was limited to the more recent convenience foods and excluded such staple convenience items as canned soup, sliced bread, and frozen concentrated orange juice.
Respondents to the survey were given the opportunity to express their o^^n ideas of a convenience food. The properties most frequently mentioned were cost savings, time and labor reductions, heat-and-serve readiness, pre- prepared and frozen foods, and elimination of professional cooks. The "value- added" idea was frequently a part of the industry's definition. However, respondents included one or more of the above features in their "value-added" concept.
WHY CONVENIENCE FOODS?
The lifestyle of the American consumer is moving significantly toward one with more leisure activities. And in spite of inflation, more income is being spent on these activities. The daily three-meal schedule has changed because population mobility has increased, eating patterns have become more individualistic, and more time is used for leisure activities. Because people are eating away from home more often, the traditional family gathering at the dinner table has become less frequent. Social mobility has given rise to fast-food operations, the steak and seafood restaurant, and other foodservice establishments.
With proper planning and management, convenience items may reduce purchasing time, storage facilities, and food costs. Convenience foods require more freezer space but less preparation area. The market for convenience foods in the HRI sector will continue to grow as long as the food processors provide product variety with uniformity, and high quality items. As one respondent to the survey stated, "It is not enough that the foodservice industry simply be a provider of commodities; the industry of tomorrow must be oriented to the idea that convenience is basic to food products."
2_/ Harp, Harry H. and Denis F. Dunham, Comparative Cost of Convenience Foods and Home-Prepared Foods, ÍIRR-609, Econ. Res. Serv., U.S. Dept. Agr., Wash., D.C., June 1963, p. 3. Also, Harp, Harry H. and Marshall E. Miller, Convenience Food; The Relationship Between Sales Volume and Factors Influencing Demand, AER-81, Econ. Res. Serv., U.S. Dept. Agr. , Wash., D.C, Aug. 1965, p. 2.
The preparedness level of convenience foods can vary greatly. Some raw portion-controlled meats and vegetables require primary cooking, while other foods require only browning. Some foods need only thawing, heating, or mixing before serving, and others are ready to serve.
Convenience foods also come in many product forms. They can be fresh, frozen, freeze-dried, or dehydrated. The quality of convenience foods ranges from the le^st expensive to the highest quality gourmet items.
Some of the economic advantages of convenience foods as perceived by the processors are: (1) labor-saving equipment; (2) timesaving methods and equipment; and (3) reduced labor costs.
Faced with rising food prices, increasing wages, and a lack of skilled personnel, the foodservice industry could reduce some costs and increase efficiency by using convenience foods. The foodservice operator may pay a little more for convenience items, but he is also obtaining benefits through reduced needs for certain types of kitchen equipment, space, and labor. As a result of the wide variety of convenience foods, the operator can augment the menu and offer customers special diet foods, such as those low in cholesterol, salt, carbohydrates, or high in protein.
IMPORTANCE OF TECHNOLOGY
New technologies have created new types of foods. The spray-drying technique developed the instant powdered foods. Freeze-drying is used mainly for highly specialized ingredients and products. This process has its widest uses in soup mixes and camping foods. The newer methods of food drying have virtually eliminated heat damage, off-color, off-flavor, and off-texture.
The development of modified starches mixed with fat and packaged in flexible aluminum foil has made dry mixes available to the foodservice industry. The instantizing process, along with the necessary packaging, has created instant rice, milk, coffee, and cereals.
The packaging industry has contributed to convenience foods with the use of foil cans, two-piece cans, pop-tops, portion-control trays, individual serving packs, and many other packaging ideas. The canning industry introduced asceptic canning, which led to a variety of new dairy products. The chemical industry developed the polyethylene pouch that could be sealed to withstand boiling water, launching the boil-in-the-bag concept. The use of antioxidants and gas flushing was initiated to reduce fat rancidity and to preserve food. Improved processing, storage, and distribution systems have also helped secure a place for convenience foods in the foodservice industry.
SALES ANALYSIS
The 138 firms surveyed reported combined sales of convenience foods to the HRI market in the latest accounting year, 1973/74, at over $1.1 billion. Over 35 percent of this amount was accounted for by the 12 largest firms.
Annual average sales per food item, including all items offered in a company's product line, were greatest among the largest firms—$520,000 per item—and least among the smallest firms—$58,000 per item,^/ Slightly over half the companies sold primarily to the HRI market, and over 40 percent of their HRI product line was comprised of convenience food items.
In terms of annual institutional sales among the firms studied, convenience items accounted for more than half of the HRI sales dollars. The proportion was highest among the smaller firms, which also reported a high proportion of HRI and convenience products in their overall product lines (table 1). Smaller food processors tended to be more specialized in their product offerings and HRI market segments. The product line for the larger food conglomerates covered more of the household and institutional markets with nonprepared products as well as convenience foods.
VmO BUYS CONVENIEÎÎCE FOODS?
About half of the surveyed food processors sold more than 50 percent of their products to retail stores and the other half sold most of their products to foodservice outlets. One-third of the companies also sold to the industrial market (other food processors or food assemblers), but industrial sales were no more than a fifth of the estimated annual sales of any firm.
Nearly 6 out of 10 firms sold the majority of their institutional convenience food items through their OT^n sales staff. One-third of the surveyed companies exclusively depended on brokers. Most of the remainder distributed through a combination of brokers and company salesmen, or through arrangements with brokers and distributors.
Table restaurants and cafeterias were the most frequently mentioned customers in the restaurant category. Hotel and motel dining rooms were next, followed by fast-food operations, then caterers and airlines.
Schools and colleges were the most frequently mentioned users of convenience foods among institutions, trailed by hospitals, in-plant feeding operations, correctional institutions, and the military.
Distribution Area
All of the large firms had national sales distribution of their convenience food products. About 70 percent of the medium-sized firms also reported national sales distribution. Overall, about one-fourth of the companies reported a regional sales distribution area, and only a few of the smaller companies limited their distribution to local areas (table 2). It should be noted that national distribution, as reported by the respondents, did not necessarily mean that their products v/ere found in all 50 States, but meant they sold to a number of major metropolitan areas from coast to coast.
3/ Based on annual sales, firms were classified as small with sales under $2 miTlion, medium with sales from $2-250 million, and large with sales over ^250 million.
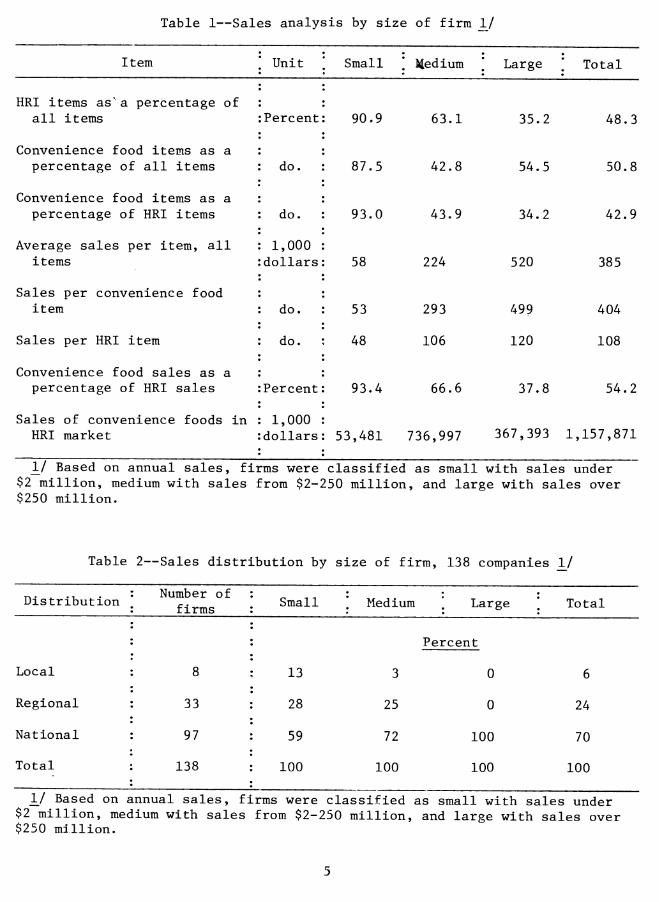
Table 1—Sales analysis by size of firm 1/
Item ; Unit ; Small ] iledium ; Large • ', Total
HRI items as'a percentage of all items : Percent 90,9 63.1 35.2 48.3
Convenience food items as a percentage of all items : do. : 87.5 42.8 5A.5 50.8
Convenience food items as a : percentage of HRI items do. : 93.0 43.9 34.2 42.9
Average sales per item, all : 1,000 : items : dollars: 58 224 520 385
Sales per convenience food item do. : 53 293 499 404
Sales per HRI item : do. ; 48 106 120 108
Convenience food sales as a percentage of HRI sales : Percent: 93.4 66.6 37.8 54.2
Sales of convenience foods in : 1,000 : HRI market : dollars : 53,481 736,997 367,393 1,157,871
1/ Based on annual sales, firms were classified as small with sales under $2 million, medium with sales from $2-250 million, and large with sales over $250 million.
Table 2—Sales distribution by size of firm, 138 companies 1/
Distribution Number of firms ; Small \ Medium \ Large 1 Total
Percent
Local 8 : 13 3 0 6
Regional 33 28 25 0 24
National 97 59 72 100 70
Total 138 100 100 100 100
1/ Based on annual sales, firms were classified as small with sales under $2 million, medium with sales from $2-250 million, and large with sales over $250 million.

NEW IDEAS
Some new culinary ideas have been developed in response to the customer's needs and suggestions* Generally, it is the final user who determines the acceptability of a new idea and provides input for the processor's marketing research. This study indicates that about 30 percent of the new ideas originated outside of the firm. About 45 percent of these ideas were taken from trade shows, meetings, and magazines, 25 percent were purchased from other research firms, 18 percent were obtained through acquisitions, and about 10 percent were derived from Government research.
Respondents indicated that feedback for ideas was generally obtained from the processor's sales force, brokers, and customers. The foodservice operators usually give suggestions to the processor and the broker. The processors also conduct in-house research before creating new ideas and products. If a processor is under a division or a subsidiary of a large company, it may often have difficulty in interesting the research and development laboratory of the parent company in its ideas.
Imaginative presentations with gamishings, plating techniques, and food combinations are advantages firms can use in introducing convenience foods. By utilizing these ideas, the food industry can serve the HRI market with a variety of interesting and tasty foods.
The foodservice buyer of convenience foods will generally try a new idea if he can be assured a highly skilled chef is not required, time between preparation and serving is reduced, food is savory, and a profit will be realized. The foodservice industry must know the ethnic, geographic, and demographic characteristics of each region in which they intend to introduce a new product. Tlie food must be tailored to fit the final user.
Customers' Receptiveness to New Ideas
The foodservice industry is greatly concerned with which users will be the most receptive to a new idea or product. Market research is being implemented to determine the customers' receptiveness to change. New uses for existing products, variations in packaging, or entirely new ideas and products, if accepted, can cause significant shifts in the HRI market for convenience
foods.
Hospitals^ Schools^ Colleges
According to the survey, hospitals, schools, and colleges were the most receptive to new ideas and products. These foodservice operators must hold food costs within tight budgets and must vary menus for clients who eat all, or nearly all, meals at the institution. The foodservice managers of these operations place greater emphasis on the menu cycle and new trends than other foodservice categories.
Schools and colleges seem somewhat more willing to experiment with new products. By using unique foods, plating techniques, and efficient service, they are able to attract more students to the dining hall. They need new
products and raust have great flexibility in menu planning to keep up with food fads.
Hospitals and institutions are changing from the notion of the "Basic Four" menu planning to the concept of the recommended dietary allowances. They are looking for new ways to improve menu planning and cycling. Hospitals and institutions need new ideas along modified diet lines such as low-sodium, low-calorie, and low-fat foods. Because they must operate on strict budgets, hospitals and institutions must find products and ideas which meet patient acceptance.
Many institutions are now using catering services. The caterers provide both tray and cafeteria service, and may often use the cafeteria as a testing ground for new products. If a product is popular in the cafeteria, it may be used in the patients' tray service.
Airlines
Foodservice on the airlines is mainly for passengers who would otherwise not be able to eat because of flight schedulings. Host travelers now take foodservice aboard planes for granted. The airlines are very receptive to new ideas that are different and unique from those of their competitors. Airlines are reluctant to do away with meals; therefore, they must develop appetizing and tasty new dishes. Since most passengers prefer to eat on planes, meal flights have increased over beverage-only flights.
Most airlines cannot afford to maintain their own inflight kitchens so they depend on caterers. These caterers often supply one or more companies at the same time by offering a line of items on a exclusive basis for a menu cycle and then offering the items to another airline.
With higher food and service costs, some airlines are expressing an interest in appetizing, less expensive foods such as casseroles and cold dishes. They are also interested in foods geared to the family,
In-Plant Operators
According to the survey, the successful in-plant food operator is interested in maintaining quality and service while holding down cost. The in-plant feeder generally uses a 4- to 6-week menu cycle, rotating popular items with new ideas. To hold their customers, in-plant feeders add flexibility and variety to the menu,
Fast-Food Operators
Fast-food operators generally have a limited menu using pre-prepared items that require little garnishing, but which will result in an acceptable and palatable meal. Sheer convenience remains a major selling point, but some fast-food outlets now have salad bars and self-service tables. Others feature hostess service and dining by candlelight. There are growing possibilities for adding more variety to the fast-food segment of the foodservice industry.
Table Restaurants
The survey indicated the independent family and fine dining restaurants also need new ideas. To attract families, food establishments must continuously have new ideas, new ways of presenting old ideas, and good quality. These restaurants generally have big kitchen facilities and a full- course menu. The major problem facing this type of restaurant is the high cost of labor. According to some food processors, labor turnover is estimated at 60-75 percent annually. Therefore, consideration is being given to increased use of convenience foods and automation in table restaurants.
miitary
Now that the Army is directed toward volunteer service, respondents indicated that the military must have new foods and new ideas to attract young people. Volunteers want the same food options they had as civilians. The military has taken some measures to improve their foodservices. All types of food, including food fads, have been introduced and incorporated in menu planning. Respondents indicated that convenience foods have a promising future in military feeding.
Correctional Institutions
According to the survey, correctional institutions formerly were not very receptive to new food ideas. Since about 1970, the American Correctional Food Service Association has sought to improve foodservice in correctional institutions with the premise that well-fed inmates are more cooperative. Many institutions are on a 30- to 50-day menu cycle, but most inmates eat all meals at the institution, creating a need for new food products and ideas.
PRODUCTS INTRODUCED
Firms reported a total of 5,299 convenience food items introduced during 1968-73. Half of these products were either mix-and-serve or heat-and-serve. Slightly over one-fourth required additional cooking and the remainder were either thaw-and-serve or table ready. Frozen products accounted for over two- thirds of the total items introduced; canned or packaged, and dry-mixed products accounted for over 11 percent; and fresh and freeze-dried items accounted for the remainder (table 3).
Food Categories
Nearly two-fifths of all convenience foods introduced during 1968-73 were entrees (table 3). Most of these products were frozen, requiring cooking or heating before serving.
Cakes and pastries were the second largest group of convenience foods introduced. Over half of these items were either in the thaw-and-serve or table-ready form. Sixty percent of the tptal items were frozen and 24 percent were fresh.
8
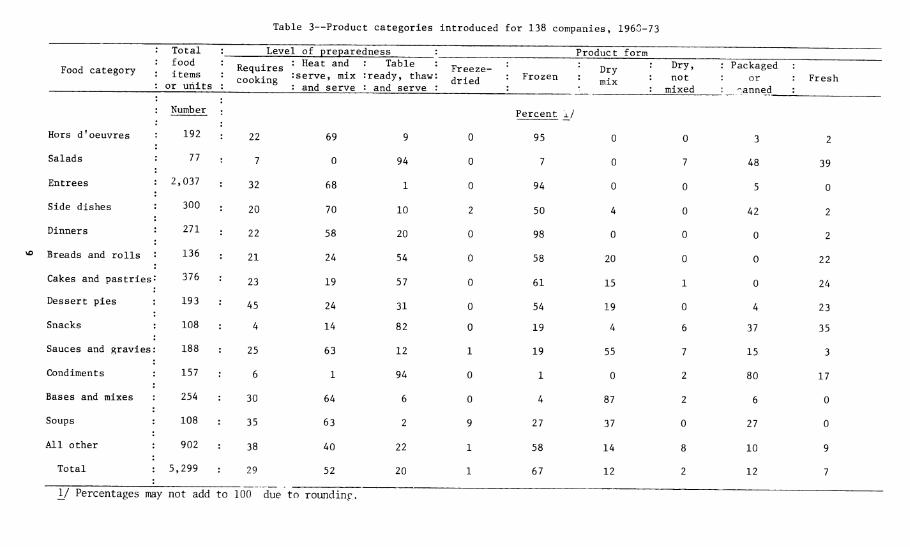
Table 3—Product categories introduced for 138 companies, 1963-73
: Total : : food : : items : : or units :
Level of preparedness Product form
Food category Requires [ cooking ;
Heat and serve, mix and serve
: Table : ready, thaw : and serve
Fr dr
eeze- ied : Frozen
Dry * ' mix
Dry, not
mixed
: Packaged : or °. ^anned
Fresh
: Number Percent £/
Hors d'oeuvres : 192 : 22 69 9 0 95 0 0 3 2
Salads : 77 : 7 0 94 0 7 0 7 48 39
Entrees : 2,037 : 32 68 1 0 94 0 0 5 0
Side dishes 300 : 20 70 10 2 50 4 0 42 2
Dinners 271 . 22 58 20 0 98 0 0 0 2
^ Breads and rolls 136 : 21 24 54 0 58 20 0 0 22
Cakes and pastries 376 : 23 19 57 0 61 15 1 0 24
Dessert pies : 193 : 45 24 31 0 54 19 0 4 23
Snacks 108 : 4 14 82 0 19 4 6 37 35
Sauces and gravies: 188 : 25 63 12 1 19 55 7 15 3
Condiments : 157 : 6 1 94 0 1 0 2 80 17
Bases and mixes : 254 : 30 64 6 0 4 87 2 6 0
Soups : 108 : 35 63 2 9 27 37 0 27 0
All other : 902 : 38 40 22 1 58 14 8 10 9
Total : 5,299 29 52 20 1 67 12 2 12 7
The third largest segment were the side dishes. Over two-thirds of the side dishes were heat-and-serve or mix-and-serve products, and one-fifth required cooking. About 40 percent of the side dishes were either packaged or canned, another 50 percent were frozen, and the remainder was divided among freeze-dried, dry-mixed, and fresh.
Dinners were the fourth largest group of convenience foods to be introduced over the 5-year period. Nearly 60 percent of these items were heat-and-serve products and another 22 percent required cooking. Most of the dinners were frozen items.
PRODUCTS DISCONTINUED
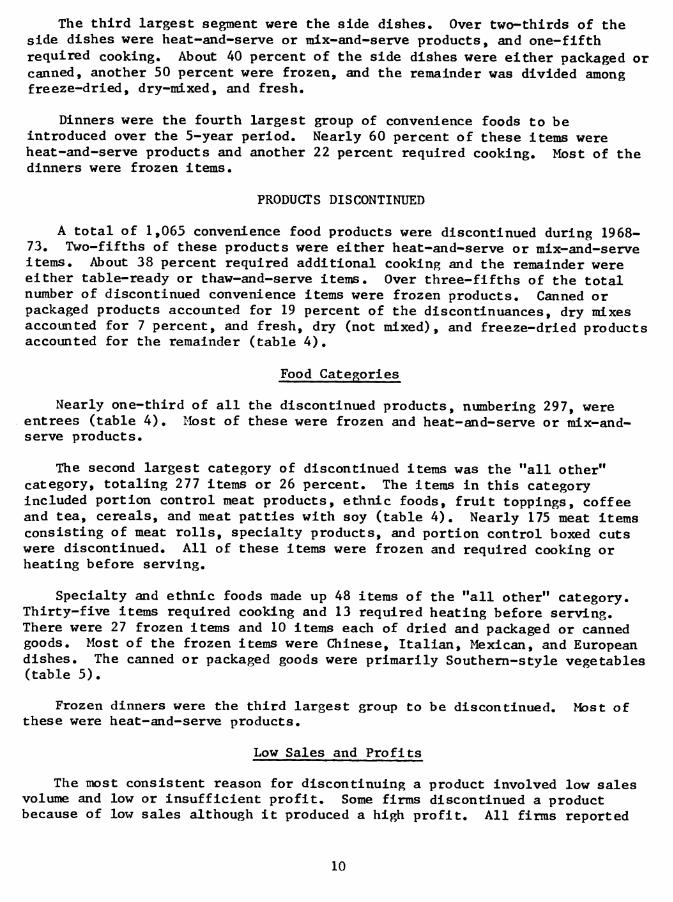
A total of 1,065 convenience food products were discontinued during 1968- 73. Two-fifths of these products were either heat-and-serve or mix-and-serve items. About 38 percent required additional cooking and the remainder were either table-ready or thaw-and-serve items. Over three-fifths of the total number of discontinued convenience items were frozen products. Canned or packaged products accounted for 19 percent of the discontinuances, dry mixes accounted for 7 percent, and fresh, dry (not mixed), and freeze-dried products accounted for the remainder (table 4).
Food Categories
Nearly one-third of all the discontinued products, numbering 297, were entrees (table 4). Most of these were frozen and heat-and-serve or mix-and- serve products.
The second largest category of discontinued items was the "all other" category, totaling 277 items or 26 percent. The items in this category included portion control meat products, ethnic foods, fruit toppings, coffee and tea, cereals, and meat patties with soy (table 4). Nearly 175 meat items consisting of meat rolls, specialty products, and portion control boxed cuts were discontinued. All of these items were frozen and required cooking or heating before serving.
Specialty and ethnic foods made up 48 items of the "all other" category. Thirty-five items required cooking and 13 required heating before serving. There were 27 frozen items and 10 items each of dried and packaged or canned goods. Most of the frozen items were Chinese, Italian, Mexican, and European dishes. The canned or packaged goods were primarily Southern-style vegetables (table 5).
Frozen dinners were the third largest group to be discontinued. îiost of these were heat-and-serve products.
Low Sales and Profits
The most consistent reason for discontinuing a product involved low sales volume and low or insufficient profit. Some firms discontinued a product because of low sales although it produced a high profit. All firms reported
10
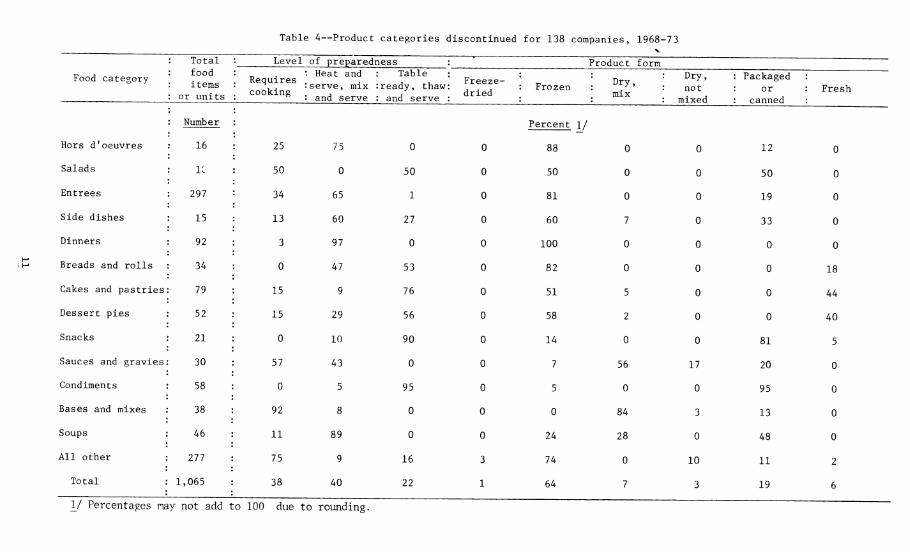
Table 4—Product categories discontinued for 138 companies, 1968-73
: Total : food : items : or units
Level of preparedness Product form
Food category Requires \ cooking
• Heat and "serve, mix ' and serve
: Table : ready, thaw : and serve
Freeze- dried
: Frozen Dry, not
mixed
: Packaged : or : canned
Fresh
: Number Percent 1/
Hors d'oeuvres : 16 25 75 0 0 88 0 0 12 0
Salads : IC 50 0 50 0 50 0 0 50 0
Entrees : 297 34 65 1 0 81 0 0 19 0
Side dishes 15 13 60 27 0 60 7 0 33 0
Dinners 92 3 97 0 0 100 0 0 0 0
Breads and rolls 34 0 47 53 0 82 0 0 0 18
Cakes and pastries 79 15 9 76 0 51 5 0 0 44
Dessert pies 52 15 29 56 0 58 2 0 0 40
Snacks 21 0 10 90 0 14 0 0 81 5
Sauces and gravies. 30 57 43 0 0 7 56 17 20 0
Condiments : 58 0 5 95 0 5 0 0 95 0
Bases and mixes : 38 : 92 8 0 0 0 84 3 13 0
Soups : 46 : 11 89 0 0 24 28 0 48 0
All other : 277 : 75 9 16 3 74 0 10 11 2
Total 1,065 : 38 40 22 1 64 7 3 19 6
V Percentages nay not add to 100 due to rounding.
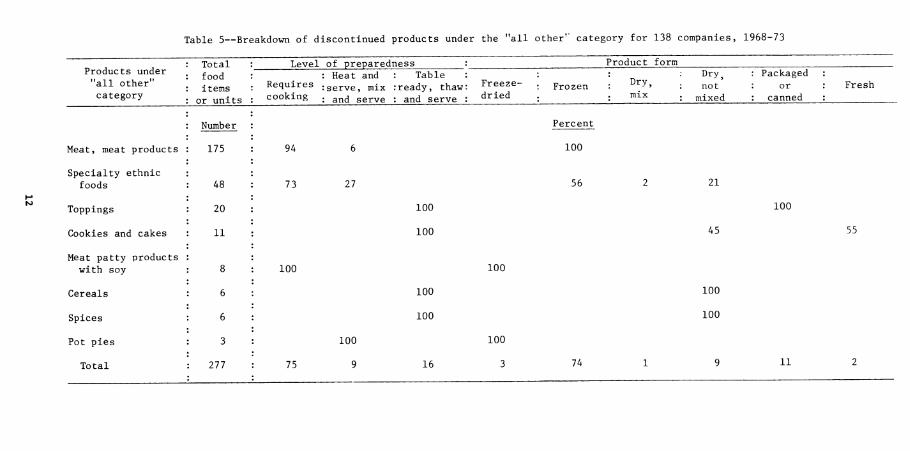
Table 5—Breakdown of discontinued products under the "all other'' category for 138 companies, 1968-73
Products under "all other" category
Meat, meat products
Specialty ethnic foods
Toppings
48
20
Cookies and cakes 11
Meat patty products with soy 8
Cereals 6
Spices 6
Pot pies 3
Total : 277
Total food items
or units
Number
175
Level of preparedness : Heat and : Table
Requires tg^^ve, mix : ready, thaw cooking . g^¿ serve : and serve
94
73
100
75
Product form
Freeze- dried
Frozen Dry, mix
Dry, : Packaged not : or lixed : canned
27
100
100
100
100
100
100 100
9 16 3
Percent
100
56
74
21
45
100
100
100
11
Fresh
55
that they judged sales aind profits by a product's market position and relationship to othfer products.
There are generally no absolute or foolproof new product marketing techniques. Each new product must be custom built for the market target and for the company's marketing and sales objectives. The test of new product success is repeat sales and a reasonable profit.
Inadequate Research and Poor Technology
Inadequate marketing analysis and testing, poor timing, higher costs than anticipated, competitive reaction, product oversaturation, and consumer whims can lead to product failures.
Being first on the market with a new product does not assure success. The first product may just be a novelty or satisfy momentary needs in the marketplace and result in a short life. But these products can serve as a guide to unfulfilled customer needs.
There have been some product failures because of technological problems. There has been little standardization of package size or type. Some new product failures were due to processing which affected shelf life. Several of the surveyed firms discontinued canned salads because of the acid content which attacked the can liners during long storage and produced undesirable flavor and color changes.
Market strategy plays an important part in the success of a product. One company introduced a line of soups that failed because the firm was not experienced in marketing such a product. Another small company introduced several frozen soups and found that it could not compete with a major supplier of frozen and canned soups in either distribution or price.
Another factor in product failure is a limited sales and distribution area. The availability of a product from another firm can limit the sales especially when the competitor's product is less expensive.
Price Margins
There have been some discontinuances because of high ingredient costs and unavailability of ingredients. A number of these instances occurred among processors supplying school lunch programs. These firms noted that allowances for the program have not, in some cases, kept up with the increases in the prices of ingredients. Some of the suppliers to the school lunch program stated that the price margins were not sufficient to supply the program with a high-cost ingredient item.
13
Ethnic Foods
Surveyed firms indicated that the ethnic food market is a limited one. These foods are used mainly among the originating groups. The exceptions are mainly pizza, spaghetti, lasagna, kosher-style pickles, hot dogs, and some Chinese foods. Most people will try some form of ethnic food if it can be related to their own food liabits or style. Also, within the school lunch progt'am, there have been some discontinuances because the food may have been
too exotic.
SUBSTITUTES AND ANALOGS
Processors faced with rising prices, diminishing supplies, and new technologies are using substitutes and analogs for more expensive products in short supply, and for partial or complete replacements for other agricultural products. In many foods, these ingredients are used as flavor intensifiers, extenders, and to increase nutrition. The extenders are sometimes used as a stabilizer. In other instances, extenders are used as fortifiers and protein
improvers.
Substitutes
The word substitute is used to indicate an exchange of one food product for another. For example, some manufacturers are using whey to replace nonfat dried milk. \^ey is a versatile protein ingredient that has freeze-thaw stability, and bland flavor and aroma. Whey can be used in baked goods, desserts, and dinners. One manufacturer mentioned using lecithin as a substitute emulsifier for albumen.
A number of the surveyed firms have substituted com syrup for sugar. The relative prices of sweeteners affect the proportions of sugar used. At the time of this survey, even though the price of com syrup was increasing, the increase was not as rapid as that for sugar.
Some firms reported using nondairy creamers instead of real cream. The substitution was based on supply, price, and technology. These nondairy products are available in emulsions, oil, soluble liquids, and powders. All are relatively low cost, easily stored, and uniform in flavor. These products can be used at high levels and impart the natural flavor of dairy products to foods without developing off tastes.
Although cottonseed, corn, and other plant sources may be used in edible foods, soy is presently the major source of vegetable protein. Utilization of soybeans as a major food, or food ingredient, is a result of new technology, changes in consumer attitudes, price, and market strategy. Soy and soy products have largely moved from the specialty food sector to acceptance by the general consumer. Soy products are fairly bland in flavor and easily masked in most foods, or they can be flavored.
Textured soy vegetable proteins have the ability to absorb water and retain juices when incorporated into meat. These vegetable proteins may also
14
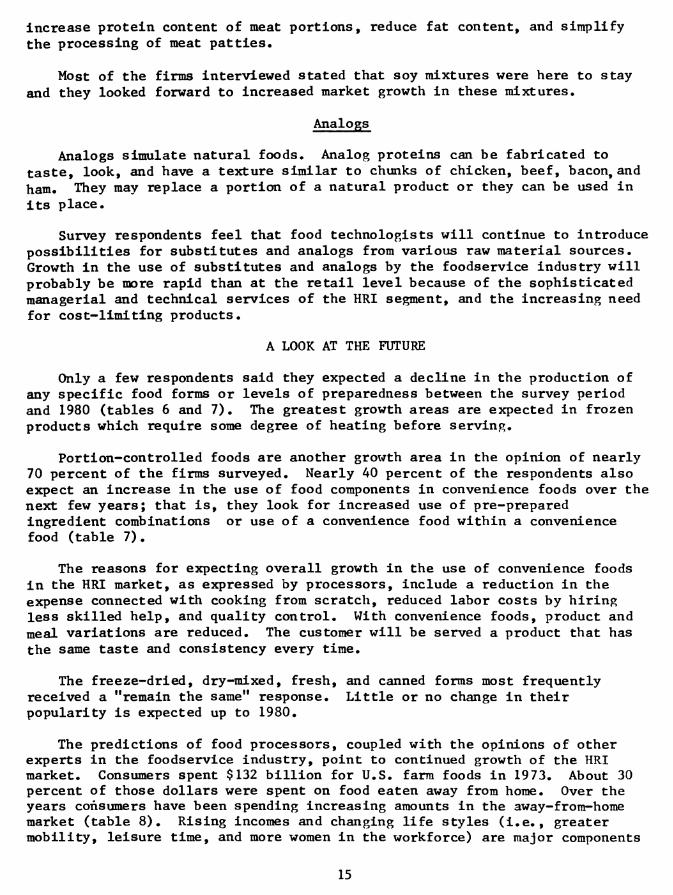
increase protein content of meat portions, reduce fat content, and simplify the processing of meat patties«
Most of the firms interviewed stated that soy mixtures were here to stay and they looked forward to increased market growth in these mixtures.
Analogs
Analogs simulate natural foods* Analog proteins can be fabricated to taste, look, and have a texture similar to chunks of chicken, beef, bacon, and ham« They may replace a portion of a natural product or they can be used in its place.
Survey respondents feel that food technologists will continue to introduce possibilities for substitutes and analogs from various raw material sources. Growth in the use of substitutes and analogs by the foodservice industry will probably be more rapid than at the retail level because of the sophisticated managerial and technical services of the HRI segment, and the increasing need for cost-limiting products.
A LOOK AT THE FUTURE
Only a few respondents said they expected a decline in the production of any specific food forms or levels of preparedness between the survey period and 1980 (tables 6 and 7). The greatest growth areas are expected in frozen products which require some degree of heating before serving.
Portion-controlled foods are another grox^th area in the opinion of nearly 70 percent of the firms surveyed. Nearly 40 percent of the respondents also expect an increase in the use of food components in convenience foods over the next few years; that is, they look for increased use of pre-prepared ingredient combinations or use of a convenience food within a convenience food (table 7).
The reasons for expecting overall growth in the use of convenience foods in the HRI market, as expressed by processors, include a reduction in the expense connected with cooking from scratch, reduced labor costs by hiring less skilled help, and quality control. With convenience foods, product and meal variations are reduced. The customer will be served a product that has the same taste and consistency every time.
The freeze-dried, dry-mixed, fresh, and canned forms most frequently received a "remain the same" response. Little or no change in their popularity is expected up to 1980.
The predictions of food processors, coupled with the opinions of other experts in the foodservice industry, point to continued growth of the HRI market. Consumers spent $132 billion for U.S. farm foods in 1973. About 30 percent of those dollars were spent on food eaten away from home. Over the years consumers have been spending increasing amounts in the away-from-home market (table 8). Rising incomes and changing life styles (i.e., greater mobility, leisure time, and more women in the workforce) are major components
15
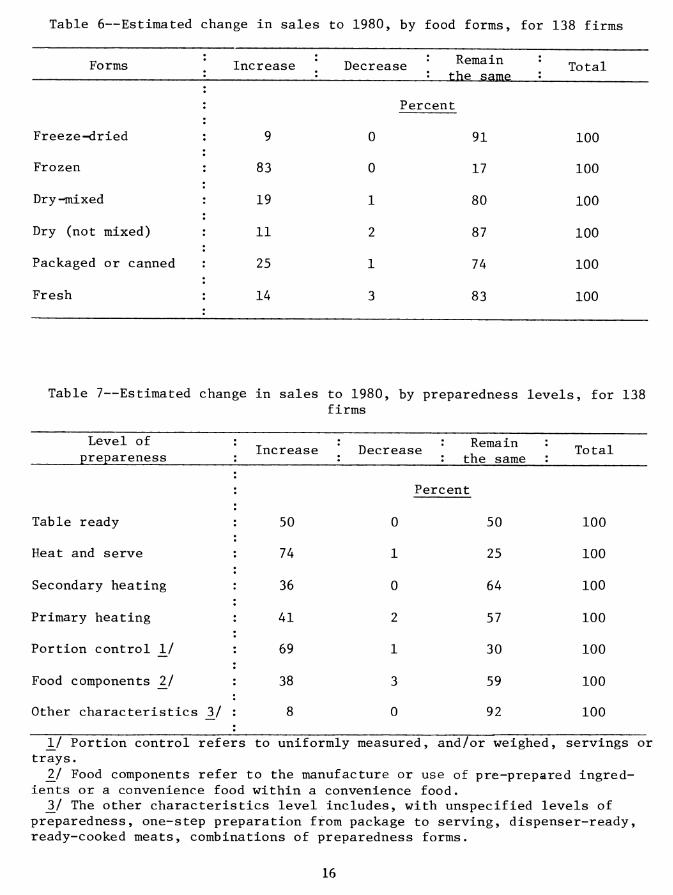
Table 6—Estimated change in sales to 1980, by food forms, for 138 firms
Forms ' Increase \ Decrease • Remain the same
' Total
Percent
Freeze-dried 9 0 91 100
Frozen : 83 0 17 100
Dry-mixed 19 1 80 100
Dry (not mixed) 11 2 87 100
Packaged or canned : 25 1 74 100
Fresh ; 14 3 83 100
Table 7—Estimated change in sales to 1980, by preparedness levels, for 138 firms
Level of prepareness \ Increase * Decrease : Remain :
: the same : Total
Percent
Table ready : 50 0 50 100
Heat and serve : 74 1 25 100
Secondary heating : 36 0 64 100
Primary heating : 41 2 57 100
Portion control 1/ : 69 1 30 100
Food components 2^/ 38 3 59 100
Other characteristics 3/ : 8 0 92 100
1^/ Portion control refers to uniformly measured, and/or weighed, servings or trays.
_2/ Food components refer to the manufacture or use of pre-prepared ingred- ients or a convenience food within a convenience food. V The other characteristics level includes, with unspecified levels of
preparedness, one-step preparation from package to serving, dispenser-ready, ready-cooked meats, combinations of preparedness forms.
16
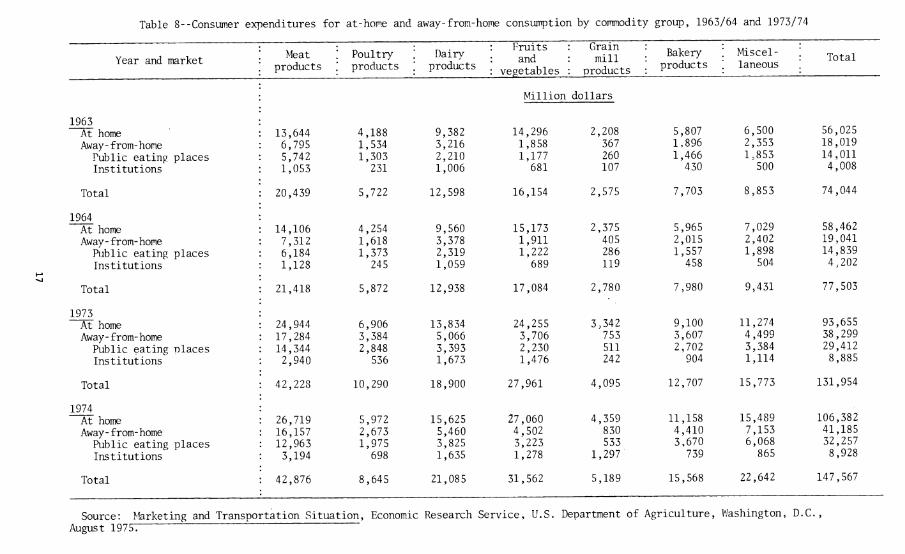
Table 8--Consum.er expenditures for at-home and away-from-home consumption by commodity group, 1963/64 and 1973/74
Year and market Meat
products : Poultry ; products
; Dairy .' products
: Fruits : and : vegetables
: Grain : mill . products
; Bakery ; products
: Miscel- \ laneous
: Total
Million dollars
1963 At home Away-from-hone
Public eating places Institutions
13,644 6,795 5,742 1,053
4,188 1,534 1,303
231
9,382 3,216 2,210 1,006
14,296 1,858 1,177
681
2,208 367 260 107
5,807 1.896 1,466
430
6,500 2,353 1,853
500
56,025 18,019 14,011 4,008
Total 20,439 5,722 12,598 16,154 2,575 7,703 8,853 74,044
1964 At home Away-from-home
Public eating places Institutions
14,106 7,312 6,184 1,128
4,254 1,618 1,373
245
9,560 3,378 2,319 1,059
15,173 1,911 1,222
689
2,375 405 286 119
5,965 2,015 1,557
458
7,029 2,402 1,898
504
58,462 19,041 14,839 4,202
Total 21,418 5,872 12,938 17,084 2,780 7,980 9,431 77,503
1973 At home Away-from-home
Public eating Dlaces Institutions
24,944 17,284 14,344 2,940
6,906 3,384 2,848
536
13,834 5,066 3,393 1,673
24,255 3,706 2,230 1,476
3,342 753 511 242
9,100 3,607 2,702
904
11,274 4,499 3,384 1,114
93,655 38,299 29,412 8,885
Total 42,228 10,290 18,900 27,961 4,095 12,707 15,773 131,954
1974 At home Away-from-home
Public eating places Institutions
26,719 • 16,157 : 12,963
3,194
5,972 2,673 1,975
698
15,625 5,460 3,825 1,635
27,060 4,502 3,223 1,278
4,359 830 533
1,297
11,158 4,410 3,670
739
15,489 7,153 6,068
865
106,382 41,185 32,257 8,928
Total 42,876 8,645 21,085 31,562 5,189 15,568 22,642 147,567
Source: Marketing and Transportation Situation, Economic Research Service. August 1975:
U.S. Department of Agriculture, Washington, D.C..
of this phenomenon» A growing market, coupled with the cost squeeze placed on foodservice operators by higher labor, energy, equipment, and food and beverage prices, has moved even the most conventional of foodservice establishments to purchase at least some forms of convenience food. As demand rises, a new class of supplier, the fabricator, is emerging. "This supplier delivers increasing quantities of food in prepared and semiprepared forms to restaurants or institutions where the items are served to customers with minimal labor input. Meats are being cut, wrapped, and boxed at the packing plant and sent to the kitchen ready for cooking. The operator can buy steaks, roasts, or hamburger as needed. Other restaurant or institutional operators are going into the business of preparing main courses or complete meals in a fashion analogous to the process used to prepare frozen TV dinners."4/ Furnishing complete meals or the main course in a form which requires^ only heating before serving has become particularly important for foodservice operators, such as airlines, school lunchrooms, and similar establishments.
Continued growth of the HRI market will mean continued growth in the demand for convenience foods and in the need for suppliers who can provide prepared and semiprepared foods in the forms, quantities, and packages that will fit the food handling and preparation systems of the foodservice operator.
hj The Food and Fiber System ~ How it Works> Agr. Info. Bui. 383, Econ. Res. Serv., U.S. Dept. Agr., Wash., D.C., Mar. 1975, p. 34.
18