convention on wetlands global wetland outlook: technical note … · information on wetland area...
TRANSCRIPT

1
Global Wetland Outlook: Technical Note on Status and Trends The Status and Trends section of the Global Wetland Outlook (GWO) provides the context for the report by examining the distribution and condition of wetlands globally. This Technical Note provides further information on the area of wetlands globally. This is provided in support of the information on wetland area that has been summarised and included in the GWO. Further information on other measures used to describe the ecological character of wetlands is presented in the GWO and is not considered further in this Technical Note. Specifically, data from the Supplementary Material (https://doi.org/10.1071/MF17377) compiled by Davidson & Finlayson (2018) are presented here (with permission from CSIRO Publishing) to provide more detailed information on the extent of 22 individual wetland classes; the relationships between these and the Ramsar wetland typology are shown in the Appendix provided by Davidson & Finlayson (2018). The information that is provided here shows that inland natural surface wetlands are dominated by non-forested peatlands, marshes and swamps on alluvial soils, with peatlands forming approximately 33% of these wetlands. The area of marine or coastal wetlands is dominated by unvegetated tidal flats and saltmarshes. The total global wetland area estimated from these individual wetland classes is between 15.2 x 10⁶ and 16.2 x 10⁶ km2, which is greater than that obtained from recent global estimates derived largely from remote sensing (Davidson & Finlayson 2018). Given considerable data gaps for some wetland classes included in the Ramsar wetland typology, these figures are seen as underestimating the area of global wetlands.
Authors C. Max Finlayson and Nick C. Davidson
Convention on Wetlands
Background The GWO, which is the Ramsar Convention’s flagship publication, reports on the status and trends of the world’s wetlands. The Contracting Parties requested the GWO in Ramsar Resolution XII.5, which called upon the Convention’s Scientific and Technical Review Panel (STRP) to update and expand upon Ramsar Briefing Note 7, State of the World’s Wetlands and their Services to People: A compilation of recent analyses. The Standing Committee subsequently identified this task as among the STRP’s highest priorities.
Purpose Technical notes are complementary to the GWO. They consist of technical information to explain the methodology or analysis supporting findings published in the GWO. They also provide supplemental details and references.
2
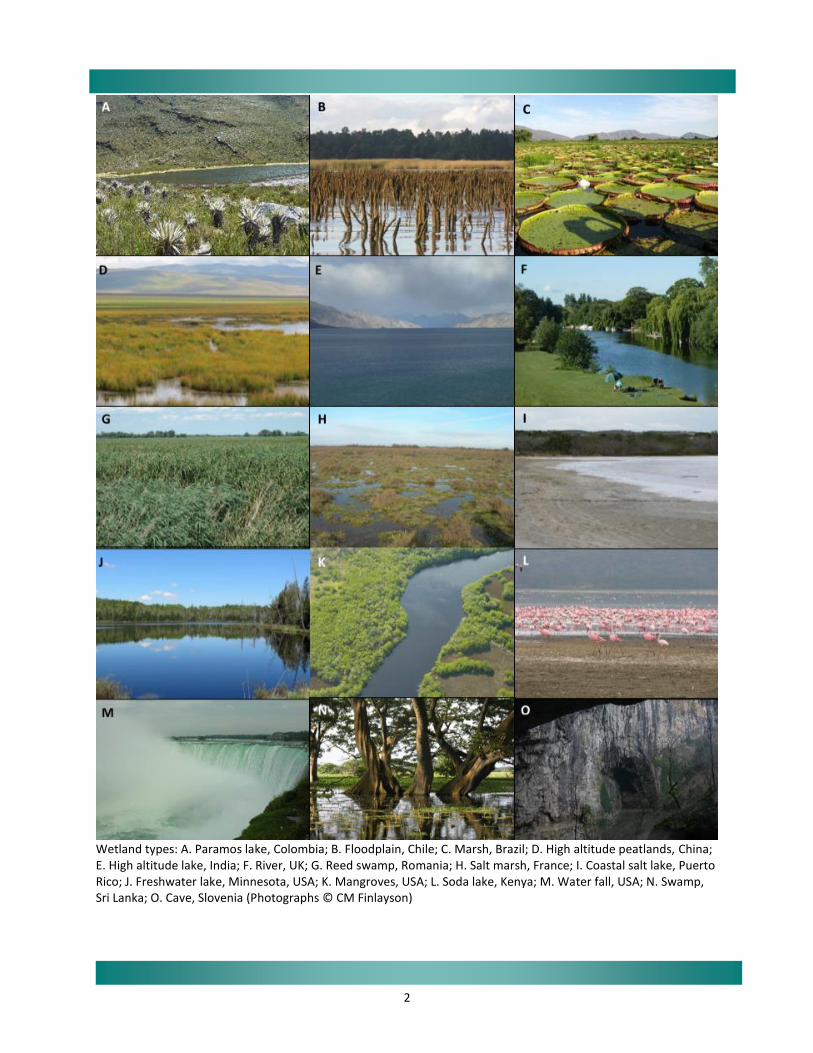
Wetland types: A. Paramos lake, Colombia; B. Floodplain, Chile; C. Marsh, Brazil; D. High altitude peatlands, China; E. High altitude lake, India; F. River, UK; G. Reed swamp, Romania; H. Salt marsh, France; I. Coastal salt lake, Puerto Rico; J. Freshwater lake, Minnesota, USA; K. Mangroves, USA; L. Soda lake, Kenya; M. Water fall, USA; N. Swamp, Sri Lanka; O. Cave, Slovenia (Photographs © CM Finlayson)
3
Assessment of data and information for individual wetland classes An assessment of the data and information on the area of individual wetland classes is provided below. It draws on the supplementary material provided in Davidson & Finlayson (2018). Information on the global extent of wetland classes is provided in Davidson et al. (2018). General information on the ecology and conservation of individual wetland classes and sites is not presented here, but can be found in papers in numerous compilations, including the 170 papers most recently included in the compendium published by Finlayson et al. (2018). The following text is divided into the three categories used in the higher level of the Ramsar typology of wetlands, namely:
Inland natural wetlands – rivers and streams; lakes; peatlands; marshes and swamps; and groundwater-dependent wetlands.
Marine and coastal wetlands – estuaries; tidal flats and saltmarshes; coastal deltas; mangroves; seagrasses; coral reefs; shellfish reefs; coastal lagoons; kelp forests; and shallow subtidal marine systems.
Human-made wetlands – reservoirs; small ponds; rice paddy; oil palm plantation; agricultural wet grasslands; wastewater treatment ponds; salt production ponds; and aquaculture ponds.
For further information on the range of wetland types and their classification, the reader is directed to a recent review by Gerbeaux et al. (2018). The global area of wetlands provided by the combined estimates for individual wetland classes considered by Davidson & Finlayson (2018) amounted to 15.2 to 16.2 x 10⁶ km2. This estimate for global wetland area is higher than the 12.1 x 10⁶ km2 obtained from recent global wetland area estimates of permanently and seasonally inundated wetlands derived from remote sensing (Davidson et al. 2018); however, given the considerable data gaps for individual wetland classes, these estimates are both likely to be underestimates. Inland natural wetlands Rivers and streams The surface area of rivers and streams is hard to measure and probably makes little sense, particularly over large geographical scales, as they are largely narrow, linear features, and flooding, particularly in tropical areas, can increase the areal extent of rivers 100–1000-fold (Melack et al. 2009). These changes suggest that it could be difficult to consistently determine the area of rivers and streams. Nevertheless, global area estimates have been made and vary, with Raymond et al. (2013) most recently providing an estimate of 0.624 × 10⁶ km2, slightly smaller than the 0.662 × 10⁶ km2 of Downing et al. (2012), but larger than the 0.360 × 10⁶ km2 of Lehner & Döll (2004). Allen & Pavelsky (2018) in a new analysis show that global river and stream surface area (at mean annual discharge) is 0.773 x 10⁶ km2, an area larger than previous estimates. Area estimates for most regions are not available, except for North America with 0.124 × 10⁶ km2 (Allen & Pavelsky 2015). Lakes Lakes are water-filled depressions located in a basin and surrounded by land, varying in size (see below). The frequency of flooding and filling varies greatly, with some remaining dry for extended periods of time. The most recent global estimates of the area of natural lakes are 4.200 × 10⁶ km2 for lakes >0.1 ha (Downing et al. 2006) and 3.232 × 10⁶ km2 for lakes >1 ha (Messager et al. 2016), with the former including more than 277 × 106 very small lakes (0.1 to 1 ha), with a global area estimate of 0.693 × 10⁶ km2, 16.5% of the estimated area of all lakes. Both estimates are higher than a previous estimate of 2.43 × 10⁶ km2 (Lehner & Döll 2004). However, the latter is, by inference, for permanent freshwater lakes only since they also provide separate figures for ‘pan, brackish/saline

4
wetland’, which includes salt and soda (alkaline) lakes, and ‘intermittent lake/wetland’, which includes intermittent lakes. Messager et al. (2016) provided an estimate of 2.670 × 10⁶ km2, for lakes >10 ha, similar to the 2.905 × 10⁶ km2 of Downing et al. (2006). By subtraction, the global area of lakes of 1-10 ha area from Messager et al. (2016) is 0.562 × 10⁶ km2, which is not greatly different from the 0.602 × 10⁶ km2 estimate from Downing et al. (2006). Natural lakes >10 ha are widely distributed across all continents, with the largest areas in North America (including Central America and the Caribbean): 1.23 × 10⁶ km2 (46% of global area); and Europe, including Russia: 0.78 × 10⁶ km2 (29%), with much smaller total lake areas in Asia (10%), Africa (9%), South America (4%) and Oceania (2%) (Messager et al. 2016). Countries with the most lakes and the largest areas of lakes are Canada (880; 0.86 × 10⁶
km2), Russia (201; 0.67 × 10⁶ km2) and the USA (103; 0.34 × 10⁶ km2). By surface area, by far the largest natural lake is the Caspian Sea (0.34 × 10⁶ km2) followed by Lake Victoria (0.07 × 10⁶ km2) and three of the North American Great Lakes – Superior, Huron and Michigan (Messager et al. 2016). Changes in the area of lakes indicate differences in area change between regions and lakes (Pekel et al. 2016; UNEP 2007). An exception occurs on the Tibetan Plateau where many of the endorheic lakes (lakes in closed drainage basins) are expanding and new lakes are forming due to increased run-off from accelerated snow and glacier melt, leading to a 20% increase in area, 0.008 × 10⁶ km2 (Pekel et al. 2016). Peatlands Peatlands have been defined by Joosten & Clarke (2002) as areas of land with a naturally accumulated layer of peat, formed from carbon-rich dead and decaying plant material under waterlogged and low oxygen conditions, generally comprising at least 30% dry mass of dead organic material and greater than 30 cm deep. They can develop under a wide range of vegetation types in fresh and saline water (Finlayson & Milton 2018). Freshwater peatlands, including both forested and non-forested inland peatlands, are estimated as covering 4.232 × 10⁶ km2 (Xu et al. 2018), a larger area than an earlier estimate of 3.814 × 10⁶ km2 (Joosten 2010). Regionally, the largest areas are in Asia (38%), North America (33%), Europe (12%) and Latin America and the Caribbean (11%), with much smaller areas in Africa (4%) and Oceania (2%) (Xu et al. 2018). They also occur in the Antarctic and sub-Antarctic islands, but their area is very small (<1% of the global peatland area). Eighty-two percent of global peatland area is non-forested mires (bogs, fens and freshwater marshes) (3.118 × 10⁶ km2), with the largest areas in Asia (48% of this area), North America (35%) and Europe (11%) (Joosten 2010). Forested peatlands are estimated to cover 0.696 ×10⁶ km2 (Joosten 2010), with the largest areas in North America (38%), Europe (24%) and Latin America and the Caribbean (19%). Tropical and subtropical peatland area has been estimated as 1.505 × 10⁶ km2 (Gumbricht et al. 2017), a considerably larger area than the 0.385 × 10⁶ km2 estimated by Page et al. (2011). In part this is because much larger areas of tropical peatland have now been identified in Latin America (Amazon Basin) and in Africa (Congo Basin) (see e.g., Lähteenoja et al. 2012; Dargie et al. 2017). These areas had previously been recognised as wetlands (e.g., Lehner & Döll 2004), but not as peatlands. A much larger proportion of the area of tropical peatlands are now known to be in Latin America and the Caribbean (46%), with smaller proportions in Asia (34%) and Africa (18%) and ~2% in Oceania (Gumbricht et al. 2017). The largest areas of temperate peatlands are in Russia (1.241 × 10⁶ km2) and Canada (1.133 × 10⁶ km2) (Xu et al. 2018). Between 1990 and 2008 there was a small decrease in the extent of all peatlands (–0.97%), based on the areal estimates provided by Joosten (2010). The largest decrease was in Europe (–4%). Area change in all other regions was ±<1%. These figures mask major differences in trends between non-forested and forested peatlands. The global area of non-forested peatlands increased by +7%, possibly due to the conversion of forested peatlands, with the largest increases in Oceania (+16%) and Asia (+16%) (Joosten 2010). Area change in other regions was much smaller (±<3%). In contrast, forested peatlands decreased globally by –25%, with by far the largest percentage decrease in Asia (–80%), with smaller decreases in Oceania (–11%) and Europe (–10%). In south-east Asia
5
(Peninsular Malaysia, Sumatra and Borneo), ~0.018 × 10⁶ km2 of peat swamp forest was lost between 2007 and 2015, an area decrease of –28%, largely through their conversion to oil palm and pulpwood plantations (Miettinen et al. 2016). In part of south-east Asia (Malay Peninsula, Borneo, Sumatra, and Java), between 2000 and 2010, peat swamp forests experienced a much higher rate of deforestation (–3.7% year–1) than did lowland forests (–1.6% year–1) or montane forests (–0.1% year–1), and are being lost most quickly in Sumatra (–5.2% year–1) followed by Borneo (–2.8% year–1) (Wilcove et al. 2013). Historical losses of peatlands have been considerable, although the ability to record such changes has been limited until the second half of the 20th century. European bogs, fens and mires decreased by –3.5% from 1990 to 2000. A total of 90% of raised bogs in the Netherlands were destroyed in the 20th century, and in Scotland 44% of lowland mires and 21% of blanket mires were lost between 1947 and 1988 (Mackey et al. 1998), and 15% of Flow Country blanket mires between 1970 and 1987 (Stroud et al. 1988). Initiations of restoration processes of bog habitat are now taking place in North America and Northern Europe, but not at a sufficient scale as to influence global figures. Marshes and swamps Freshwater marshes and swamps comprise a large variety of non-tidal forested and non-forested wetlands. They have hydric soils and do not accumulate large amounts of peat. Swamps are dominated by trees and marshes by emergent herbaceous plants. The terms, however, have not been used consistently, and many wetlands may contain both treed and non-treed components (Finlayson 2018a). The global extent of marshes and swamps on alluvial soils is not well established. Lehner & Döll (2004) estimated the global area of freshwater marshes and floodplains as 2.53 × 10⁶ km2, ~25–31% of their global wetland area. Tropical freshwater swamps on alluvial soils, some of which are forested, occur mostly on floodplains, with a total estimated area of 1.46 × 10⁶ km2, 38% occurring in Africa, 33% in South America, 24% in Asia, and 5% in Australasia (Giesen 2018). Swamp and flooded forests on alluvial soils have been estimated as covering 1.17 × 10⁶ km2 (Lehner & Döll 2004). This may be an underestimate as areas of some major seasonally flooded forest systems such as in the Amazon and Congo Basins are considered to be generally underestimated in global wetland assessments. For the Amazon Basin, wetland area has been estimated as 0.480 × 10⁶ km2, with the main-stem Amazon floodplain forests covering 0.098 × 10⁶ km2 (Junk et al. 2014). However, 1.17 × 10⁶ km2 may be an overestimate, given that some large areas of tropical forested wetlands have recently been recognised as forested peatlands in the Amazon and Congo Basins (Lähteenoja et al. 2012; Dargie et al. 2017). A global area trend for swamps and marshes is not available, but there have been decreases in many regions. In Asia, freshwater swamps in China decreased by 23% and the area of natural marshland in north-east China by 55% from 1950 to 2000 through their conversion to agricultural land, and on the West Songnen Plain, 74% of marshes were converted between 1954 and 2008 (An et al. 2007; Huang et al. 2010; Wang et al. 2011). The Mesopotamian Marshes (Iraq) were massively drained between the 1970s and 2000s, but since then there have been major re-flooding and restoration efforts leading to reinstatement of marshes and swamps over a substantial area, with almost 60% of the marsh area present in the mid-1970s having been at least partially restored by the late 2000s – but owing to reduced river water flows, the marsh area is currently shrinking again (Becker 2014). In North America, there was a small (+1%) overall increase in area of marshes and swamps in the USA in 2004–2009, largely a consequence of wetland restoration and creation activities (Dahl 2011), but in the prairie pothole Dakota region of the USA, 28–35% of natural pothole wetland area was converted to agriculture between 2001 and 2011 (Johnston 2013). In addition, almost 23,000 ha of wetlands have been created to remove and store nutrients before discharging into the Everglades (https://www.sfwmd.gov/our-work/wq-stas). On the Canadian shoreline of Lake Ontario by the late 1970s, some 43% of marshes may have been lost since the 18th century, and 70% of prairie wetlands (Whillans 1982). In Mexico some 1.758 x 10³ ha of wetlands have been lost in the Central Plain of the Gulf of Mexico (Landgrave & Moreno-Casasola 2012).

6
In Europe, in the Po Delta, Italy, an estimated 98% of freshwater marshes have been converted since the start of the 20th century, 94% of Macedonian (Greece) marshes between 1930 and the mid-1980s (Jones & Hughes 1993), and 76% of Estonian floodplains between 1950s and 1990s (Kimmel et al. 2010). Overall, European inland vegetated wetlands decreased by 3% from 1990 to 2006 (EEA 2010). Some restoration projects have been undertaken (e.g., Germany, Denmark, Sweden, UK) although not yet to a sufficient extent as to influence these overall trends. In other regions, 13% of the freshwater marshes of the Kafue Flats (Zambia) were converted from 1984 to 1994 (Munyati 2000); 88% of wetlands in the Cauca River Valley (Colombia) were drained from the 1950s–1989 (Naranjo 1993), as were 15% of New Zealand North Island freshwater wetlands between 1979 and 1983 (Ministry of the Environment 1997). Groundwater-dependent wetlands Areas of underground wetlands, notably in karst and cave systems, are difficult to measure. Over thirteen percent of the global land surface is formed of carbonate rock outcrops, under which underground cave wetlands will occur widely, including in the Middle East and Central Asia, Europe, Russia and North America (Beltram 2018). Carbonate rocks with underground karst groundwater circulation may cover 19 × 106 km2 of global land surface (Williams 2008). Given that such systems are largely surface-porous, there may be little spatial overlap with surface water systems and so they will likely form a major component of inland natural wetland area, but areal estimates specifically for these underground wetlands are not available. Springs are widespread around the world, as are oases in arid and semi-arid zones. Although no area estimates are available, their global areas are likely to be small. Many other wetlands are groundwater-dependent, either wholly or partly, permanently or seasonally (Eamus & Froend 2006), but there are no estimates of the area or proportion of inland wetlands which are groundwater-dependent. Marine and coastal wetlands Estuaries Estuaries are often seen as semi-enclosed bodies of water that have a connection with the open sea and within which sea water is diluted with fresh water derived from the surrounding and upstream land. This includes a number of coastal environments, such as river mouths, deltas, lagoons, fjords, bays, and straits (Daborn & Redden 2018). Lehner & Döll (2004) give a global area of 0.660 × 10⁶ km2 for ‘coastal wetlands’, which includes ‘lagoon, delta, mangrove, estuary, coastal wetland and tidal wetland’ classes from their sources. The global area of 1200 major estuaries has been estimated as approx. 0.500 × 10⁶ km2 (UNEP-WCMC 2003; Agardy & Alder 2005). This is likely to include areas of saltmarshes and unvegetated tidal flats, but it is not clear if it also includes mangroves. Regional distribution data is not available, but major estuaries occur in all regions of the world (except the Antarctic), with relatively fewer in Africa (Agardy & Alder 2005). Tidal flats and saltmarshes Tidal flats are gently inclined non-vegetated coastal wetlands that occur in estuaries or along low energy marine environments with regular exposure and flooding by tides (Finlayson et al. 2018). The global area of unvegetated tidal flats has been estimated as 0.458 × 10⁶ km2 (Schuyt & Brander 2004). Regionally, the largest areas of unvegetated tidal flats are in North America (37%), Latin America and the Caribbean (20%) and Asia (18%), together forming 75% of the global total (Schuyt & Brander 2004). Saltmarshes are the main type of vegetated wetland in the coastal intertidal zone in high latitudes, the major areas being largely in temperate zones, particularly in regions with high tidal ranges such as around the North Atlantic.

7
The global extent and distribution of coastal tidal saltmarshes has not been comprehensively assessed. The most recent estimate of global area is a minimum of 0.550 × 10⁶ km2, from 43 of the 99 countries in which saltmarsh is known to occur (UNEP-WCMC 2017). Regionally, the largest areas of saltmarsh are in North America (41%), Oceania (Australia) (25%) and Europe (including the Russian Federation) (21%), together forming 87% of the global resource (Mcowen et al. 2017). In Asia, there have been major losses of tidal flats and marshes: 28% of tidal flats existing in the 1980s in the Yellow Sea (China, Republic of Korea, Democratic Republic of Korea) had been lost by the late 2000s (at a rate of –1.2% annually), and from historical maps up to 65% of tidal flats have been lost over the past five decades (since the mid-1950s) (Murray et al. 2012, 2014). In China, coastal wetland losses have been variously reported as –16% (1990–2000), –40% (1978–2008) and –51% (1950–2000) at annual rates of between –1.0 and –1.6% per year, with the fastest rate over the most recent time period (An et al. 2007; Gong et al. 2010; Niu et al. 2012). In the Republic of Korea, at least 20% of intertidal wetlands were converted between 1987 and 2005 (Republic of Korea 2009). In North America, 24% of USA estuarine intertidal area was lost between 1922 and 2004, and losses in some regions of the USA even greater: for example, 50% of saltmarshes in the Mississippi Delta between 1956 and 2004. More recently, losses have been much smaller: saltmarshes decreased by only –0.7% between 1998 and 2004 (Bernier et al. 2006). In the USA between 2004 and 2009, non-vegetated estuarine area increased by 2.2%, but saltmarshes decreased by a further 2.8% – attributed largely to impacts of coastal processes including sea-level rise rather than land claims (Dahl 2011). In Canada, losses by 1985 included 65% of the Atlantic coastal salt marshes, 70% of Pacific estuarine marshes and 80% of the Fraser River Delta, British Columbia (Government of Canada 1991). In Europe, there have been long-term and widespread losses of coastal wetlands, exceeding 50% losses by the end of the 20th century on many parts of the coast (Airoldi & Beck 2007). Between 1990 and 2000, European coastal habitats decreased in area by about –1% (EEA 2007). On just 18 of Britain’s 155 estuaries, a total of at least 890 km2 had been claimed by the 1990s: 37% of their former area and an almost 25% loss of the overall British estuarine resource (Davidson et al. 1991). In south-east England, 25% of saltmarsh is estimated to have been lost in the last quarter of the 20th century through erosion and conversion, with losses continuing (Davidson et al. 1991). Wadden Sea saltmarshes decreased by –33% between 1950 and 1984, largely through conversion to farmland, and 56.5% of Rhone delta saltmarshes were lost between 1942 and 1984 (European Commission 1995). Such losses are now being partially counterbalanced by saltmarsh restoration through an increasing number of ‘managed realignment’ schemes in north-west Europe (Wolters et al. 2005), but overall areas are small. Coastal deltas Coastal deltas are fan-shaped and formed by the deposition of alluvial sediments at the mouth of a river. Of 52 major coastal deltas globally, Coleman et al. (2008) estimate the area of 14 of these as 0.030 × 10⁶ km2. All 14 major deltas assessed have decreased in area (Coleman et al. 2008). Some wetland loss was through coastal erosion converting coastal vegetated wetlands to open water (5104 km2), but a much larger area (10,786 km2) was lost through human conversion, an overall loss of –52.4% over just 14 years (1986–2000). The largest reported losses have occurred in the Shatt al Arab (6699 km2), Ganges-Brahmaputra (4290 km2), Indus (1595 km2) and Yukon (1100 km2) deltas. Only small losses (<100 km2) were reported from the Danube, Mackenzie, Mahanadi, Niger and Nile deltas. Other reported delta area losses include: Don delta (–22%: 1980s–1990s), Kuban delta (–48%: 1930s–1970s), Camargue (–31%: 1942–1974) (Tamisier 1992). Most of the world’s medium and large sized coastal deltas are currently receiving less sediment than they need to grow to keep pace with rising sea levels. Hence their areas are generally decreasing (Giosan et al. 2014). Mangroves Mangroves are trees or shrubs that are generally found in the intertidal zone along deltaic coasts, lagoons, and estuarine shorelines in the tropics and subtropics (Finlayson 2018b). Global mangrove area in 2000 was estimated as 0.137 × 10⁶ km2 in 118 countries and territories in the tropical and subtropical regions of the world (UNEP-

8
WCMC 2011; Giri et al. 2011). The largest extent of mangroves is in Asia (42%), followed by Africa (20%), North and Central America (15%), Oceania (12%) and South America (11%). Approximately 75% of the world’s mangroves are found in just 15 countries, the largest areas being in Indonesia (0.031 × 10⁶ km2), Australia (0.009 × 10⁶ km2) and Brazil (0.009 × 10⁶ km2) (2000 estimates; Giri et al. 2011). Global mangrove area was estimated by FAO (2007) to have decreased by 19% between 1980 and 2005, with the largest area loss being in Asia (–25%). More recent analyses through the Global Mangrove Watch (Lucas et al. 2014) will provide more detailed regional and national analyses (see https://www.globalmangrovewatch.org/), with initial data showing a global area for 2016 of 0.137 x 10⁶ km2 with a 4.3% loss from 1996–2016. Seagrasses Seagrasses are marine angiosperms that form extensive meadows in clear, shallow estuaries and coastal waters where they propagate both sexually and vegetatively (Short et al. 2018). They are widely distributed around temperate and tropical shores, occurring both intertidally and particularly in the shallow subtidal zone. They are most diverse in south-east Asia (UNEP-WCMC 2005; Short et al. 2007). The global extent is estimated as 0.177 × 10⁶ km2 (Spalding et al. 2003; Short et al. 2018). The global area of seagrass beds has been decreasing in all parts of the world, temperate and tropical, since at least the 1890s (Waycott et al. 2009). Overall, the measured area of seagrass loss was 3370 km2 between 1879 and 2006, representing 29% of the maximum area measured. The rate of decline in seagrass meadows has accelerated over the past eight decades, from –1% year–1 before 1940 to –5% year–1 after 1980. The largest losses have occurred between 1980 and 2006: in total, a loss of 35% of seagrass area. Overall, 58% of sites assessed declined, 25% increased, and 17% exhibited no detectable change. Sites with area increases are in Western Europe and part of the Atlantic coast of the USA, but their areas are small. Coral reefs Coral reefs are an underwater marine ecosystem formed by reef-building corals that are held together by calcium carbonate. Warm water coral reefs are widely distributed in subtropical and tropical latitude seas between 30°N and 30°S (Spalding et al. 2001). By far the largest coral reef areas, totalling 80% of global area, are in Asia (41%) and Oceania (39%) and in particular in Indonesia (18% of the global area) and Australia (17%). Cold water coral reefs have been discovered to be more widespread than previously thought (Freiwald et al. 2004), mostly from high latitudes where they occur in deep water, but also as in the tropics where they thrive at even greater depths. Their area is not known, but recent studies suggest that global coverage could equal, or even exceed, that of warm water reefs.
A global area change for warm water coral reefs is not available, but coral cover has been decreasing worldwide (Wilkinson 2008). As hard structures, the overall area of coral reefs does not change substantially except where, for example, physical dredging or infilling occurs. Coral reef change assessments largely concern changes in the percentage of live coral cover in reefs. By 2008, there had been an effective loss of 19% of the original global area cover of coral reefs; a further 15% are seriously threatened with loss within the next 10–20 years; and a further 20% are under threat of loss in the next 20–40 years (Wilkinson 2008). However, 46% of the world’s reefs are still regarded as being relatively healthy and not under any immediate threats of destruction. These reefs are generally either well managed or are remote from large land masses and human disturbances (e.g., in the Red Sea, the Maldives, Seychelles and Chagos archipelago in the Indian Ocean, and Papua New Guinea and many small atolls and islands in the Pacific Ocean) (Jackson et al. 2014). In the Caribbean, although the rate of coral loss has slowed in the 1990s–2000s compared to the 1980s, significant declines are continuing. Average coral cover for 88 locations with coral data in the Caribbean declined from 34.8% in 1970–1983 to 16.3% in 1999–2011 (Jackson et al. 2014). In Mexico, the area of coral reefs around Veracruz Port decreased by 41% between 1907 and 2007 through landfill and development of port infrastructure (Valadez-Rocha & Ortiz-Lozano 2013). The extent of coral degradation due to bleaching is also of increasing concern (Hughes et al. 2017).

9
Shellfish reefs
Shellfish reefs are made of oysters and bivalves, are widespread in temperate coastal regions and also occur tropically and sub-tropically in Latin America and the Caribbean and southern North America. They remain widespread in the intertidal and shallow subtidal coastal regions of the world, despite ~85% of historical oyster reefs having been completely destroyed (Beck et al. 2011). Many remaining reefs are in poor condition. A global assessment of the condition of oyster reefs across 144 bays and 44 ecoregions found that, in comparison with past abundance, more than 90% of reef area has been lost in 70% of bays and 63% of ecoregions (Beck et al. 2011). In many bays, more than 99% of oyster reefs have been lost and are functionally extinct. Overall, 85% of oyster reefs have been lost globally since records began (Beck et al. 2011). Regions with functionally extinct oyster reefs are particularly Australia, the North Sea and Atlantic coast of Europe and the Pacific coast of North America. Remaining reefs in fair to good condition are mostly in the Gulf of Mexico and Caribbean, Latin America and New Zealand (Zu Ermgassen et al. 2012). In Europe, native oyster reefs were ecologically extinct by the 1950s along most European coastlines and in many bays well before then due to over-exploitation (Airoldi & Beck 2007). In the USA, since the start of the 20th century, there has been a 64% decline in the spatial extent of oyster habitat and an 88% decline in oyster biomass over time, suggesting that many remaining reefs are in degraded condition (Airoldi & Beck 2007). Coastal lagoons Coastal lagoons are shallow coastal water bodies that vary from brackish to hypersaline conditions and generally contain submerged macrophytes. They occur along nearly 15% of the world’s shorelines, with lagoons largely backing barrier coasts (Kusky 2005). The global area of coastal lagoons is not known. The largest proportions of coastlines which are barrier coasts are in Africa (18%) and also in North America, with 14% in Asia, 12% in Latin America and the Caribbean, 11% in Australia and only 5% in Europe. In the USA, lagoons are found along more than 75% of its eastern and Gulf coasts. In the Mediterranean region, there are ~400 coastal lagoons, covering a surface of over 0.006 × 10⁶ km2 (Cataudella et al. 2014). In Mexico, coastal lagoons cover 1.567 x 10⁶ ha in the Gulf of Mexico (Contreras & Castaneda 2004). Kelp forests Kelp forests are underwater marine areas with a high density of the brown macroalgae kelps. They are distributed widely around northern and southern temperate coasts, in the north Pacific and north Atlantic, along the Pacific and southern Atlantic coasts of Latin America, southern Africa and Australia and New Zealand. No global or regional area estimates are available. A recent first global assessment identified a small global average area decline (at -.018% year–1) between 1952 and 2015, but this trend masks great regional variation, with declines in 38% of the regions for which there are data (-0.015 to -0.18% year–1), but increases in 27% of ecoregions (0.015 to 0.11% year–1), and no detectable change in 35% of ecoregions (Krumhansl et al. 2016). There are no clear geographical patterns in these trends in area changes, with increasing and decreasing area changes in adjacent ecoregions in most parts of the world. In Europe, 20th century losses, sometimes leading to virtual local disappearance, of kelp and other macroalgae beds have been widespread including in Iceland, Norway, Britain and Ireland, Sweden, Denmark, Finland, Germany, Lithuania, Italy, France, Spain, Croatia and Romania (Airoldi & Beck 2007). Shallow subtidal marine systems These areas, defined by the Ramsar Convention (1971) as being those of up to 6 m of permanent inundation by marine waters, can be expected to form a major component of coastal and nearshore marine wetlands. However, these areas have not been measured, except for the Mediterranean Basin: 0.042 × 10⁶ km2 (Mediterranean Wetland Observatory 2018). No global or regional areas are available.

10
Human-made wetlands Reservoirs Reservoirs are water storage bodies generally formed by an enlarged natural or artificial lake, storage pond or impoundment created using a dam or lock to store water. It is estimated that globally there are ~2.8 × 10⁶ reservoirs or impoundments larger than 0.1 ha worldwide, and 16.7 × 10⁶ when including those larger than 0.01 ha (Lehner et al. 2011). Their combined area is estimated at 0.443 × 10⁶ km2 (GRAnD database, see http://www.gwsp.org/products/grand-database.html, accessed 15 September 2017). The largest numbers of dams are in North America (particularly USA), Asia (particularly China) and Europe. There are now in excess of 30,000 large dams globally, compared with ~5000 in 1950. While the number of large dams constructed worldwide has increased greatly since the 1950s, in all parts of the world, the rate of increase appears to have slowed since 2000 (Steffen et al. 2015). As for the number of dams constructed, the global area of reservoirs has progressively increased: particularly rapidly from the 1950s to the 1980s, and recently more slowly. Global reservoir area increased by 0.289 × 10⁶ km2 (188% increase) between 1950 and 2010, with 0.106 × 10⁶ km2 (32% increase) being between 1970 and 2010 (GRAnD database; Lehner et al. 2011). It is not clear if these estimates include such impoundments as gas oil field lakes and mine tailings ponds. Small (e.g., farm) ponds Downing et al. (2006) estimated the global area of farm ponds as 0.077 × 10⁶ km2 and also reported that the area of farm ponds is increasing in many parts of the world, particularly in semi-arid areas, and at average rates of 0.7% year–1 in Great Britain and 1–2% year–1 in parts of the USA. Rice paddy A rice paddy is a flooded parcel of arable land used for growing semiaquatic rice. Rice paddy area is estimated as 1.282 × 10⁶ km2, of which 0.66 × 10⁶ km2 (51%) is irrigated paddy and 0.63 × 10⁶ km2 (49%) is rain-fed paddy (Salmon et al. 2015). The most recent estimate of global area of rice production (which includes rice paddy but also upland dry rice areas) is 1.635 × 10⁶ km2 (see http://ricestat.irri.org:8080/wrsv3/entrypoint.htm, accessed 20 July 2017), of which rice paddy forms 79%. A total of 88% of the global area of rice production is in Asia, stretching from India and Nepal in the west to Japan, South Korea, and Taiwan in the east, from China in the north to Timor-Leste in the south. Proportionally much smaller rice areas occur in other regions. Since 1965, rice production area has increased by 0.38 × 10⁶ km2, a 30.2% increase from 1965 to 2014, although the change varies between regions with an increase of 26% in Asia, and larger increases in the smaller areas in Europe (36%) and particularly Africa (270%), but small area declines in Latin America and Caribbean (–9%), North America (41%) and Oceania (134%). These average regional changes mask different change directions in different countries: for example, in Asia, although rice production area has increased in most countries, it has decreased in others such as Japan and Taiwan (see http://ricestat.irri.org:8080/wrsv3/entrypoint.htm, accessed 20 July 2017). Oil palm plantations Oil palm plantations, planted on drained wetlands (peatlands), in parts of South-east Asia (Peninsular Malaysia, Sumatra and Borneo) have increased since 1990, and in 2015 managed land cover types (industrial plantations and smallholder-dominated areas) covered 50% (7.8 × 10⁶ ha) of all peatlands, in this region, increasing from 11% in 1990 and 33% in 2007. Industrial (mostly oil palm) plantations have nearly doubled their extent on peatlands since 2007 and now cover 27% of peatlands (Miettinen et al. 2016) in the region. Plantations are also reported as increasing in Africa and Latin America, but areas are not available.

11
Agricultural wet grasslands In Europe and some other parts of the world, areas of floodplain wetland and sloping fens have for millennia been managed as agricultural wet grasslands for stock grazing and fodder cropping. Similar grasslands have developed coastally, behind the artificial embankment of estuaries. Global and regional areas are not known, but many areas are now much smaller than previously through their conversion to intensive agriculture and urban and industrial developments, for example in south-east England (Thornton & Kite 1990). Wastewater treatment wetlands Many, mostly small, wastewater treatment wetlands have been constructed, with others created for other purposes such as amenity and mitigation of wetland losses. No global area estimates are available. In the USA, there are almost 150,000 ha of industrial ponds and a further over 326,000 ha of urban ponds: a total area of 0.004 × 10⁶ km2 (Dahl 2011). There are also an increasing number (at least 223 by 2008) of wastewater treatment wetlands (of up to 1 ha area) in China (Liu et al. 2008). Salt production pans Salinas (salt production pans) are widespread in parts of the world where the climate is warm enough for rapid saline water evaporation. No global or regional area estimates are available, but in the Mediterranean in the 1990s, there were 165 salinas (90 of which were still producing salt) and a total area of 750 km2 (Perennou et al. 2012). Aquaculture ponds Aquaculture ponds for commercial fish and shellfish production are also widespread and most frequent in China, India, Viet Nam, Bangladesh, and Egypt, and also well developed in France, Greece, the Czech Republic, Austria and Hungary in Europe, and the Lao People’s Democratic Republic and Nepal in Asia (FAO 2016). No global or regional area estimates are available.
Human-made wetlands. A: reservoir, Australia; B: rice paddy, Bali; C: wet grasslands, UK; D: salt production pans (Salinas), Portugal. (Photographs © Nick Davidson)

12
Conclusions - data and information for individual wetland classes Although there are some data and information available for the area of most inland wetland classes, there are still gaps for many marine and coastal wetland classes, in particular for shellfish reefs, coastal deltas, coastal lagoons, kelp forests and shallow subtidal systems. There is a dearth of information on the human-made wetland classes, including for wet grasslands, wastewater treatment or constructed wetlands, saltpans and aquaculture ponds (both inland and coastal). Obtaining information to fill these gaps is seen as a priority for wetland managers and could possibly be done effectively using Earth Observation approaches, as recognised by the Ramsar Convention (Rebelo & Finlayson 2018). The above assessments confirm the findings of other assessments that the areal extent of both inland and marine/coastal wetlands is in decline (Davidson 2014; Gardner et al. 2015; Dixon et al. 2016) and that while human-made wetlands are increasing, they do not compensate for the declines (Davidson 2014; Davidson et al. 2018). Further, these assessments confirm that estimates of the global area of wetlands derived from ‘top-down’ remote sensing and mapping have only recently equalled or exceeded estimates derived from ‘bottom-up’ site-based estimates. As there are gaps in the data available for many wetland classes, these are themselves underestimates. Hence, the estimates of between 15.2 x 10⁶ and 16.2 x 10⁶ km2 are greater than the 12.5 to 14.4 x 10⁶ km2 derived by Milton & Finlayson (2018), and in the upper range of the 12.1 to 17.3 x 10⁶ km2 global wetland area derived by recent remote-sensing investigations (Fluet-Chouinard et al. 2015; Davidson et al. 2018). These results support calls for more attention to be directed towards resolving the limitations of remote sensing-based assessments as well as directing more attention towards assessments of the different classes of wetlands for which there are current information gaps (Davidson & Finlayson 2018).
Yellow Water, Kakadu NP Ramsar Site, Australia. (Photograph © Nick Davidson)

13
References
Agardy, T. & Alder, J. (2005). Coastal Systems. In H. Rashid, R. Scholes, & N. Ash (eds) Ecosystems and Human Well-being: Current Status and Trends, pp. 513–549. Washington, DC, USA: Island Press.
Airoldi, L. & Beck, M.W. (2007). Loss, status and trends for coastal marine habitats of Europe. Oceanography and Marine Biology - an Annual Review, 45, 345–405.
Allen, G.H. & Pavelsky, T.M. (2015). Patterns of river width and surface area revealed by the satellite-derived North American river width data set. Geophysical Research Letters, 42, 395–402. doi:10.1002/2014GL062764
Allen, G.H. & Pavelsky, T.M. (2018). Global extent of rivers and streams. Science (in press). doi:10.1126/science.aat0636
An, S., Li, H., Guan, B., Zhou, C., Wang, Z., et al. (2007). China’s natural wetlands: past problems, current status, and future challenges. Ambio, 36, 335–342. doi:10.1579/0044-7447(2007)36[335:CNWPPC]2.0.CO;2
Beck, M.W., Brumbaugh, R.D., Airoldi, L., Carranza, A., Coen, L. D., et al. (2011). Oyster reefs at risk and recommendations for conservation, restoration, and management. Bioscience, 61, 107–116. doi:10.1525/bio.2011.61.2.5
Becker, R.H. (2014). The stalled recovery of the Iraqi marshes. Remote Sensing, 6, 1260–1274. doi:10.3390/rs6021260
Beltram, G. (2018). Karst wetlands. In C.M. Finlayson, G.R. Milton, R.C. Prentice, & N.C. Davidson (eds) The Wetland Book II: Distribution, Description, and Conservation, pp. 313–329. Dordrecht (The Netherlands): Springer. doi:10.1007/978-94-007-6173-5_203-1
Bernier, J.C., Morton, R.A. & Barras, J.A. (2006). Constraining rates and trends of historical wetland loss, Mississippi River Delta Plain, south-central Louisiana. In Y.J. Xu & V.P. Singh (eds) Coastal Environment and Water Quality, pp. 371–382. Highlands Ranch, USA: Water Resources Publications.
Cataudella, S., Crosetti, D. & Massa, F. (eds). (2014). Mediterranean coastal lagoons: sustainable management and interactions among aquaculture, capture fisheries and environment. General Fisheries Commission for the Mediterranean. Studies and Reviews number 95. Rome, Italy: FAO.
Coleman, J.M., Huh, O.K. & Braud Jr., D. (2008). Wetland loss in world deltas. Journal of Coastal Research, 24(1A), 1–14. doi:10.2112/05-0607.1
Contreras, F. & Castaneda, O. (2004). La biodiversidad de las lagunas costeras. Ciencas, 76, 46-56.
Daborn, G.R. & Redden, A.M. (2018). Estuaries. In C.M. Finlayson, G.R. Milton, R.C. Prentice, & N.C. Davidson (eds) The Wetland Book II: Distribution, Description, and Conservation, pp. 37–54. Dordrecht (The Netherlands): Springer.
Dahl, T.E. (2011). Status and Trends of Wetlands in the Conterminous United States 2004 to 2009. Washington, DC, USA: US Department of the Interior, Fish and Wildlife Service.
Dargie, G.C., Lewis, S.L., Lawson, I.T., Mitchard, E.T., Page, S.E., et al. (2017). Age, extent and carbon storage of the central Congo Basin peatland complex. Nature, 542, 86–90. doi:10.1038/nature21048
Davidson, N.C. (2014). How much wetland has the world lost? Long-term and recent trends in global wetland area. Marine and Freshwater Research, 65, 934–941. doi:10.1071/MF14173
Davidson, N.C. & Finlayson, C.M. (2018). The extent, distribution and trends of different types of wetland. Marine and Freshwater Research (in press).
Davidson, N.C., Laffoley, D. d’A., Doody, J.P., Way, L.S., Gordon, et al. (1991). Nature Conservation and Estuaries in Great Britain. Peterborough, UK: Nature Conservancy Council.
Davidson, N.C., Fluet-Chouinard, E. & Finlayson, C.M. (2018). Global extent and distribution of wetlands: trends and issues. Marine and Freshwater Research, 69, 620–627. doi:10.1071/MF17019
Dixon, M.J.R., Loh, J., Davidson, N.C., Beltrame, C., Freeman, R. & Walpole, M. (2016). Tracking global change in ecosystem area: the Wetland Extent Trends index. Biological Conservation, 193, 27–35. doi:10.1016/J.BIOCON.2015.10.023
Downing, J.A., Prairie, Y.T., Cole, J.J., Duarte, C.M., Tranvik, L.J., et al. (2006). The global abundance and size distribution of lakes, ponds, and impoundments. Limnology and Oceanography, 51, 2388–2397. doi:10.4319/lo.2006.51.5.2388
Downing, J.A., Cole, J.J., Duarte, C.M., Middelburg, J.J., Melack, J.M., et al. (2012). Global abundance and size distribution of streams and rivers. Inland Waters, 2, 229–236. doi:10.5268/IW-2.4.502

14
Eamus, D. & Froend, R. (2006). Groundwater-dependent ecosystems: the where, what and why of GDEs. Australian Journal of Botany, 54, 91–96. doi:10.1071/BT06029
EEA. (2007). Europe’s Environment – the Fourth Assessment. Copenhagen, Denmark: European Environment Agency.
EEA. (2010). The European Environment – State and Outlook 2010. Copenhagen, Denmark: European Environment Agency.
European Commission. (1995). Wise use and conservation of wetlands. Communication from the Commission to the Council and the European Parliament. COM (95) 189 final, 29 May 1995. Brussels, Belgium: European Commission.
Finlayson, C.M. (2018a). Freshwater swamps and marshes. In C.M. Finlayson, G.R. Milton, R.C. Prentice, & N.C. Davidson (eds) The Wetland Book II: Distribution, Description, and Conservation, Pp. 169–181. Dordrecht (The Netherlands): Springer. doi:10.1007/978-94-007-6173-5_200-1
Finlayson, C.M. (2018b). Mangroves. In C.M. Finlayson, G.R. Milton, R.C. Prentice, & N.C. Davidson (eds) The Wetland Book II: Distribution, Description, and Conservation, pp. 93–108. Dordrecht (The Netherlands): Springer.
Finlayson, C.M. & Milton, G.R. (2018). Peatlands. In C.M. Finlayson, G.R. Milton, R.C. Prentice, & N.C. Davidson (eds) The Wetland Book II: Distribution, Description, and Conservation, pp. 227-244. Dordrecht (The Netherlands): Springer.
Finlayson, C.M., Milton, G.R. & Prentice, R.C. (2018). Wetland Types and Distribution. In C.M. Finlayson, G.R. Milton, R.C. Prentice, & N.C. Davidson (eds) The Wetland Book II: Distribution, Description, and Conservation, pp. 19-35. Dordrecht (The Netherlands): Springer.
Finlayson, C.M., Milton, G.R., Prentice, R.C. & Davidson, N.C. (eds). (2018). The Wetland Book II: Distribution, Description and Conservation. Dordrecht (The Netherlands): Springer.
Fluet-Chouinard, E., Lehner, B., Rebelo, L.M., Papa, F. & Hamilton, S.K. (2015). Development of a global inundation map at high spatial resolution from topographic downscaling of coarse-scale remote sensing data. Remote Sensing of Environment, 158, 348-361. doi:10.1016/j.rse.2014.10.015
FAO (Food and Agriculture Organisation). (2007). The world’s mangroves 1980–2005. FAO Forestry Paper number 153. Rome, Italy: Food and Agriculture Organisation.
FAO (Food and Agriculture Organisation). (2016). The state of world fisheries and aquaculture 2016: Contributing to food security and nutrition for all. Rome, Italy: Food and Agriculture Organisation.
Freiwald, A., Fosså, J.H., Grehan, A., Koslow, T. & Roberts, J.M. (2004). Cold-Water Coral Reefs. Cambridge, UK: UNEP-WCMC.
Gardner, R.C., Barchiesi, S., Beltrame, C., Finlayson, C.M., Galewski, T., et al. (2015). State of the World’s Wetlands and their Services to People: A compilation of recent analyses. Ramsar Scientific and Technical Briefing Note No. 7. Gland, Switzerland: Ramsar Convention Secretariat.
Gerbeaux, P., Finlayson, C.M. & van Dam, A.A. (2018). Wetland Classification: Overview. In C.M. Finlayson, M. Everard, K. Irvine, R.J. McInnes, B.A. Middleton, et al. (eds) The Wetland Book I: Structure and Function, Management and Methods, pp. 1461–1468. Dordrecht (The Netherlands): Springer. doi:10.1007/978-94-007-6172-8_329-1
Giesen, W. (2018). Tropical freshwater swamps (on mineral soils). In C.M. Finlayson, G.R. Milton, R.C. Prentice, & N.C. Davidson (eds) The Wetland Book II: Distribution, Description, and Conservation, pp. 199–226. Dordrecht (The Netherlands): Springer. doi:10.1007/978-94-007-6173-5_4-2
Giosan, L., Syyitski, J., Constantinescu, S. & Day, J. (2014). Climate change: Protect the world’s deltas. Nature, 516, 31–33. doi:10.1038/516031a
Giri, C., Ochieng, E., Tieszen, L. L., Zhu, Z., Singh, A. & Loveland, T. (2011). Status and distribution of mangrove forests of the world using earth observation satellite data. Global Ecology and Biogeography, 20, 154–159. doi:10.1111/j.1466-8238.2010.00584.x
Gong, P., Niu, Z.G., Cheng, X., Zhao, K.Y., Zhou, D.M., et al. (2010). China’s wetland change (1990–2000) determined by remote sensing. Science China: Earth Sciences, 53, 1036–1042. doi:10.1007/s11430-010-4002-3
Government of Canada. (1991). The Federal Policy on Wetland Conservation. Ottawa, ON, Canada: Minister of Supply and Services Canada. Retrieved from http://publications.gc.ca/collections/Collection/CW66-116-1991E.pdf

15
Gumbricht, T., Roman-Cuesta, R.M., Verchot, L., Herold, M., Wittmann, F., et al. (2017). An expert system model for mapping tropical wetlands and peatlands reveals South America as the largest contributor. Global Change Biology, 23, 3581–3599. doi:10.1111/gcb.13689
Huang, Y., Sun, W., Zhang, W., Yu, Y., Su, Y. & Song, C.C. (2010). Marshland conversion to cropland in northeast China from 1950 to 2000 reduced the greenhouse effect. Global Change Biology, 16(2), 680–695. doi:10.1111/j.1365-2486.2009.01976.x
Hughes, T.P., Kerry, J.T., Álvarez-Noriega, M., Álvarez-Romero, J-G., Anderson, K.D., et al. (2017). Global warming and recurrent mass bleaching of corals. Nature, 543, 373–377.
Jackson, J.B.C., Donovan, M.K., Cramer, K.L. & Lam, V.V. (eds). (2014). Status and Trends of Caribbean Coral Reefs: 1970–2012. Gland, Switzerland: Global Coral Reef Monitoring Network, IUCN.
Johnston, C.A. (2013). Wetland losses due to row crop expansion in the Dakota Prairie Pothole region. Wetlands, 33, 175–182. doi:10.1007/s13157-012-0365-x
Jones, T.J. & Hughes, J.M.R. (1993). Wetland inventories and wetland loss studies: a European perspective. In M. Moser, C. Prentice, & J. van Vessem (eds) Waterfowl and Wetland Conservation in the 1990s: a Global Perspective, pp. 164–169. IWRB Special Publication 26. Slimbridge, UK: International Waterfowl and Wetlands Research Bureau.
Joosten, H. (2010). The Global Peatland CO2 Picture. Peatland Status and Drainage Related Emissions in all Countries of the World. Ede, Netherlands: Wetlands International.
Joosten, H. & Clarke, D. (2002). Wise use of mires and peatlands – background and principles including a framework for decision-making. Saarikarvi: International Mire Conservation Group and International Peat Society.
Junk, W.J., Piedade, M.T.F., Lourival, R., Wittmann, F., Kandus, P., et al. (2014). Brazilian wetlands: their definition, delineation, and classification for research, sustainable management, and protection. Aquatic Conservation, 24, 5–22. doi:10.1002/aqc.2386
Kimmel, K., Kull, A., Salm, J.-O. & Mander, Ü. (2010). The status, conservation and sustainable use of Estonian wetlands. Wetlands Ecology and Management, 18, 375–395. doi:10.1007/s11273-008-9129-z
Krumhansl, K.A., Okamotoa, D.K., Rasserweiler, A., Novak, M., Bolton, J.J., et al. (2016). Global patterns of kelp forest change over the past half-century. Proceedings of the National Academy of Sciences of the United States of America, 113, 13785–13790. doi:10.1073/pnas.1606102113
Kusky, T. (Ed.) (2005). Coastal lagoons. In Encyclopedia of Earth Sciences, p. 245. New York, NY, USA: Facts on File.
Lähteenoja, O., Reategui, Y.R., Räsänen, M., Torres, D.D.C., Oinonen, M. & Page, S. (2012). The large Amazonian peatland carbon sink in the subsiding Pastaza-Marañón foreland basin, Peru. Global Change Biology, 18, 164–178. doi:10.1111/j.1365-2486.2011.02504.x
Landgrave, R. & Moreno-Casasola, P. (2012). Evaluación cuantitativa de la pérdida de humedales en México. Investigación ambiental, 4, 19-35.
Lehner, B. & Döll, P. (2004). Development and validation of a global database of lakes, reservoirs and wetlands. Journal of Hydrology, 296, 1–22. doi:10.1016/j.jhydrol.2004.03.028
Lehner, B., Liermann, R., Revenga, C., Vörösmarty, C., Fekete, C., et al. (2011). High resolution mapping of the world’s reservoirs and dams for sustainable river flow management. Frontiers in Ecology and the Environment, 9(9), 494–502. doi:10.1890/100125
Liu, D., Ge, Y., Chang, J., Peng, C., Gu, B., et al. (2008). Constructed wetlands in China: recent developments and future challenges. Frontiers in Ecology and the Environment, 6. doi:10.1890/070148
Lucas, R., Rebelo, L.-M., Fatoyinbo, L., Rosenqvist, A., Itoh, T., et al. (2014). Contribution of L-band SAR to systematic global mangrove monitoring. Marine and Freshwater Research, 65, 589–603. doi:10.1071/MF13177
Mackey, E.C., Shewry, M.C. & Tudor, G.J. (1998). Land Cover Change: Scotland from the 1940s to the 1980s. Edinburgh, UK: The Stationery Office.
Mcowen, C., Weatherdon, L.V., Bochove, J., Sullivan, E., Blyth, S., et al. (2017). A global map of saltmarshes. Biodiversity Data Journal, 5, e11764. doi:10.3897/BDJ.5.e11764
Mediterranean Wetland Observatory. (2018). Mediterranean Wetland Outlook 2. Le Sambuc, France: MWO.
16
Melack, J.M., Novo, E.M.L.M., Forsberg, B.R., Piedade, M.T.F. & Maurice, L. (2009). Floodplain ecosystem processes. Geophysical Monograph Series, 186, 525–541.
Messager, M.L., Lehner, B., Grill, G., Nedeva, I. & Schmitt, O. (2016). Estimating the volume and age of water stored in global lakes using a geo-statistical approach. Nature Communications, 7, doi:10.1038/ncomms13603
Miettinen, J., Shi, C. & Liew, S. C. (2016). Land cover distribution in the peatlands of Peninsular Malaysia, Sumatra and Borneo in 2015 with changes since 1990. Global Ecology and Conservation, 6, 67–78. doi:10.1016/j.gecco.2016.02.004
Milton, G.R. & Finlayson, C.M. (2018). Freshwater ecosystem types and extents. In C.M. Finlayson, A.H. Arthington, & J. Pittock (eds) Freshwater Ecosystems in Protected Areas: Conservation and Management, pp. 17–33. Oxford, UK: Taylor and Francis.
Ministry of the Environment. (1997). State of New Zealand’s Environment 1997. Wellington, New Zealand: MoE.
Munyati, C. (2000). Wetland change detection on the Kafue Flats, Zambia, by classification of a multitemporal remote sensing image dataset. International Journal of Remote Sensing, 21, 1787–1806. doi:10.1080/014311600209742
Murray, N.J., Phinn, S.R., Clemens, R.S., Roelfsema, C.M. & Fuller, R.A. (2012). Continental scale mapping of tidal flats across East Asia using the Landsat archive. Remote Sensing, 4, 3417–3426. doi:10.3390/rs4113417
Murray, N.J., Clemens, R.S., Phinn, S.R., Possingham, H.P. & Fuller, R.A. (2014). Tracking the rapid loss of tidal wetlands in the Yellow Sea. Frontiers in Ecology and the Environment, 12(5), 267–272. doi:10.1890/130260
Naranjo, L.G. (1993). Ecological change in Colombian wetlands. In M. Moser, C. Prentice, & J. van Vessem (eds) Waterfowl and Wetland Conservation in the 1990s: a Global Perspective, pp. 67–70. IWRB Special Publication 26. Slimbridge, UK: International Waterfowl and Wetlands Research Bureau.
Niu, Z.G., Zhang, H.Y., Wang, X.W., Yao, W.B., Zhou, D.M., et al. (2012). Mapping wetland changes in China between 1978 and 2008. Chinese Science Bulletin. doi:10.1007/s11434-012-5093-3
Page, S.E., Rieley, J.O. & Banks, C.J. (2011). Global and regional importance of the tropical peatland carbon pool. Global Change Biology, 17, 798–818. doi:10.1111/j.1365-2486.2010.02279.x
Pekel, J.F., Cottam, A., Gorelick, N. & Belward, A.S. (2016). High-resolution mapping of global surface water and its long-term changes. Nature, 540, 418–422. doi:10.1038/nature20584
Perennou, C., Beltrame, C., Guelami, A., Tomas Vives, P. & Caessteker, P. (2012). Existing areas and past changes of wetland extent in the Mediterranean region: an overview. Ecologia Mediterranea, 38, 53–66.
Ramsar Convention. (1971). Final Act of the International Conference on the Conservation of Wetlands and Waterfowl. In E. Carp (ed) Proceedings, International Conference on the Conservation of Wetlands and Waterfowl, 30 January–3 February 1971, Ramsar, Iran. Slimbridge, UK: International Wildfowl Research Bureau. Retrieved from https://www.ramsar.org/sites/default/files/documents/library/final_act_ramsar_conference1971.pdf
Raymond, P.A., Hartmann, J., Lauerwald, R., Sobek, S., McDonald, C., et al. (2013). Global carbon dioxide emissions from inland waters. Nature, 503, 355–359. doi:10.1038/nature12760
Rebelo, L-M. & Finlayson, C.M. (coordinating authors) (2018). The use of Earth Observation for wetland inventory, assessment and monitoring: an information source for the Ramsar Convention for Wetlands, Ramsar Technical Report (in press). Gland, Switzerland: Ramsar Convention Secretariat.
Republic of Korea. (2009). Fourth national report to the Convention on Biological Diversity. Seoul, South Korea: Ministry of Foreign Affairs and Trade. Retrieved from http://www.cbd.int/doc/world/kr/kr-nr-04-en.pdf
Salmon, J.M., Friedl, M.A., Frolking, S., Wisser, D. & Douglas, E.M. (2015). Global rain-fed, irrigated, and paddy croplands: A new high resolution map derived from remote sensing, crop inventories and climate data. International Journal of Applied Earth Observation and Geoinformation, 38, 321–334. doi:10.1016/j.jag.2015.01.014
Schuyt, K. & Brander, L.M. (2004). The Economic Values of the World’s Wetlands. Future Flooding and Coastal Erosion Risks. Gland, Switzerland: WWF.
Short, F., Carruthers, T., Dennison, W. & Waycott, M. (2007). Global seagrass distribution and diversity: A bioregional model. Journal of Experimental Marine Biology and Ecology, 350, 3–20. doi:10.1016/j.jembe.2007.06.012

17
Short, F.T., Short, C.A. & Novak, A.B. (2018). Seagrasses. In C.M. Finlayson, G.R. Milton, R.C. Prentice, & N.C. Davidson (eds) The Wetland Book II: Distribution, Description, and Conservation, pp. 73–91. Dordrecht (The Netherlands): Springer. doi:10.1007/978-94-007-6173-5_262-1
Spalding, M.D., Ravilious, C. & Green, E.P. (2001). World Atlas of Coral Reefs. Berkeley, CA, USA: University of California Press.
Spalding, M., Taylor, M., Ravilious, C., Short, F. & Green, E. (2003). Global overview: the distribution and status of seagrasses. In E.P. Green & F.T. Short (eds) World Atlas of Seagrasses, pp. 5–26. Berkeley, CA, USA: University of California Press.
Steffen, W., Broadgate, W., Deutsch, L., Gaffney, O, & Ludwig, C. (2015). The trajectory of the Anthropocene: the great acceleration. The Anthropocene Review, 2, 81–98. doi:10.1177/2053019614564785
Stroud, D.A., Reed, T.M., Pienkowski, M.W. & Lindsay, R.A. (1988). Birds, bogs and forestry - The peatlands of Caithness and Sutherland. Peterborough, UK: Nature Conservancy Council.
Tamisier, A. (1992). The Camargue: a model of environmental decline. In C.M. Finlayson, T. Hollis, & T. Davis (eds) Managing Mediterranean Wetlands and Their Birds. Proceedings of the Symposium, February 1991, Grado, Italy, pp. 106–108. IWRB Special Publication number 20. Slimbridge, UK: International Waterfowl and Wetlands Research Bureau.
Thornton, D. & Kite, D.J. (1990). Changes in the Extent of the Thames Estuary Grazing Marshes. London, UK: Nature Conservancy Council.
UNEP. (2007). Atlas of our Changing Environment. Nairobi, Kenya: United Nations Environment Programme.
UNEP. (2012). The drying of Iran’s Lake Urmia and its environmental consequences. UNEP Global Environmental Alert Service (GEAS). Retrieved from http://www.unep.org/pdf/GEAS_Feb2012.pdf
UNEP-WCMC. (2003). Estuaries. http://data.unep-wcmc.org/datasets/23
UNEP-WCMC. (2005). UNEP-WCMC Seagrass database. http://data.unep-wcmc.org/datasets/7
UNEP-WCMC (2011). Mangroves. http://data.unep-wcmc.org/datasets/4
UNEP-WCMC (2017). Global distribution of saltmarsh (ver. 4.0). Cambridge (UK): UNEP World Conservation Monitoring Centre. http://data.unep-wcmc.org/datasets/43
Valadez-Rocha, V. & Ortiz-Lozano, L. (2013). Spatial and temporal effects of port facilities expansion on the surface area of shallow coral reefs. Environmental Management, 52, 250–260. doi:10.1007/s00267-013-0098-5
Wang, Z., Huang, N., Luo, L., Ren, C., Song, K. & Chen, J. (2011). Shrinkage and fragmentation of marshes in the West Songnen Plain, China, from 1954 to 2008 and its possible causes. International Journal of Applied Earth Observation and Geoinformation, 13, 477–486. doi:10.1016/j.jag.2010.10.003
Waycott, M., Duarte, C.M., Carruthers, T.J.B., Orth, R.J., Dennison, W.C., et al. (2009). Accelerating loss of seagrasses across the globe threatens coastal ecosystems. Proceedings of the National Academy of Sciences of the United States of America, 106, 12377–12381. doi:10.1073/pnas.0905620106
Whillans, T.H. (1982). Changes in marsh area along the Canadian shore of Lake Ontario. Journal of Great Lakes Research, 8, 570–577. doi:10.1016/S0380-1330(82)71994-X
Wilcove, D.S., Giam, X., Edwards, D.P., Fisher, B. & Koh, L.P. (2013). Navjot’s nightmare revisited: logging, agriculture, and biodiversity in Southeast Asia. Trends in Ecology & Evolution, 28, 531–540. doi:10.1016/j.tree.2013.04.005
Wilkinson, C. (2008). Status of Coral Reefs of the World: 2008. Townsville, Qld, Australia: Global Coral Reef Monitoring Network and Reef and Rainforest Research Centre.
Williams, P. (2008). World Heritage Caves and Karst. Gland, Switzerland: IUCN.
Wolters, M., Garbutt, A. & Bakker, J.P. (2005). Salt-marsh restoration: evaluating the success of de-embankments in north-west Europe. Biological Conservation, 123, 249–268. doi:10.1016/j.biocon.2004.11.013
Xu, J., Morris, P.J., Liu, J. & Holden, J. (2018). PEATMAP: Refining estimates of global peatland distribution based on a meta-analysis. Catena, 160, 134–140. doi:10.1016/j.catena.2017.09.010
Zu Ermgassen, P.S.E., Spalding, M.D., Blake, B., Coen, L.D., Dumbauld, B., et al. (2012). Historical ecology with real numbers: past and present extent and biomass of an imperilled estuarine habitat. Proceedings of the Royal Society of London – B: Biological Sciences, 279(1742), 3393–3400. doi:10.1098/rspb.2012.0313

18
ACKNOWLEDGMENTS The authors thank the Secretariat for its support, STRP members Lars Dinesen, Dulce Maria Infante Mata, Laura Martinez Rios, and David Stroud for their review comments, Roy Gardner and Erin Okuno for their editorial support, and Shannon Edgar of Stetson University for layout and design of this Technical Note.
CITATION Finlayson, C.M & Davidson, N.C. (2018). Global Wetland Outlook: Technical Note on Status and Trends. Gland, Switzerland: Ramsar Convention Secretariat.
Okavango Delta, Botswana (Photograph above and cover photograph, © RC Gardner)
The views and designations expressed in this publication are those of its authors and do not represent officially-adopted views of the Ramsar Convention or its Secretariat. Reproduction of this document in whole or in part and in any form for educational or non-profit purposes may be made without special permission from the copyright holders, provided acknowledgment of the source is made. The Secretariat would appreciate receiving a copy of any publication or material that uses this document as a source. Except where otherwise noted, this work is protected under a Creative Commons Attribution Noncommercial-No Derivative Works License. Ramsar STRP products are published by the Ramsar Convention Secretariat in English, French and Spanish (the official languages of the Ramsar Convention) in electronic format, and also in printed form when required. Ramsar STRP products can be downloaded from: www.ramsar.org/resources Information about the STRP can be found at: www.ramsar.org/about/the-scientific-technical-review-panel © 2018 The Ramsar Convention Secretariat For more information about Ramsar STRP products or to request information on how to correspond with their authors, please contact the Ramsar Convention Secretariat at [email protected]