convergence and divergence in living standards …inter-national component, polarization, switching,...
TRANSCRIPT
Munich Personal RePEc Archive
Convergence and divergence in livingstandards among regions of the enlargedEuropean Union (1992-2006)
Novotný, JOSEF
Charles University Prague, Faculty of Science, dept. of Social
Geography and Regional Development
1 January 2011
Online at https://mpra.ub.uni-muenchen.de/34145/
MPRA Paper No. 34145, posted 16 Oct 2011 18:32 UTC

1
Convergence and divergence in living standards among regions of the enlarged
European Union (1992-2006)
Josef Novotný
Charles University in Prague, Faculty of Science, Department of Social Geography and
Regional Development, Prague, Czech Republic
JEL classification: C2, O18, O52, R12
Keywords: European Union, living standards, subjective judgements, real convergence,
regional dynamics
Brief bibliographic note: The author is assistant professor at Department of Social Geography and Regional
Development, Charles University in Prague with interests concerning economic and
development geography.
Address: Albertov 6, Praha 2, 12843, Czech Republic
Telephone: +420221951396
Fax: +420224920657
Email: [email protected]
Acknowledgement: This work was supported by the Ministry of Education, Youth and
Sports of the Czech Republic, project: MSM0021620831 “Geographic Systems and Risk
Processes in the Context of Global Change and European Integration.” The author thanks to
Jiří Blažek for useful comments on a draft of this paper.
2
Convergence and divergence in living standards among regions of the enlarged
European Union (1992-2006)
Longer summary This paper examines regional dynamics in the enlarged EU (264 EU27 regions) in the period
1992-2006. First, the subjective judgements of regional convergence are briefly addressed by
a simple questionnaire experiment that provides some anecdotal but illustrative departures for
the design of the empirical analysis. The exploratory analysis, which is the main contribution
of this paper, inspects various aspects of European regional dynamics such as convergence
and divergence, polarization, the role of inter-national component, switching, and mobility of
individual regions. Dissimilarly to other studies, both the development of absolute and
relative differentials in regional living standards (per capita GDP and per capita household
expenditures adjusted for international purchasing power differentials) are considered by
applying several different techniques including some intuitively appealing magnitude-free
statistics. The overall picture provided on convergence among European regions is somewhat
ambiguous: regional convergence in relative ratios was concurrent to widening of absolute
gaps over the considered period. For many people, this can be in conflict with the notion of
regional cohesion pushed forward by the EU institutions. Beyond the aggregate trends, it is
suggested that the distribution of regions was far from static – a significant extent of
switching and mobility of individual regions has been detected.
Shorter abstract This paper examines regional convergence in living standards among 264 EU27 regions
during1992-2006. The main contribution is the exploratory analysis, which inspects various
aspects of regional dynamics such as convergence and divergence, polarization, the role of
inter-national component, polarization, switching, and mobility of regions. Both the
development of absolute and relative differentials in regional living standards is considered by
applying several different techniques including some magnitude-free statistics. The results
indicate that regional convergence in relative differentials was concurrent to widening of
absolute gaps. Beyond the aggregate trends a significant extent of switching and mobility of
individual regions has been detected.
1. Introduction The very idea of cohesion is conceived as one of the most important principles of
European integration. The real convergence of living standards among regions is often
promoted as a “public good” delivered by the European community. As such, the empirical
evidence on regional convergence can provide us with an aggregate picture of whether and
how effectively the cohesion goals are being fulfilled (Esposti and Bussoletti 2008;
Rodriguez-Pose and Fratesi 2004; European Commission 2007). Given the contradictory
predictions about regional convergence provided in theories of regional development (e.g.
Blažek and Uhlíř 2002), these results are no less interesting from a theoretical perspective.
Not least, the analysis of regional convergence can also be utilized in a more explanatory
manner to investigate the role of individual factors behind differential growth trajectories of
regions (Quah 1996a; Ezcurra et al. 2005a). These and other motivations have catalysed an
explosion of empirical research on the regional dynamics in Europe. Much scientific activity
has been, at the same time, devoted to the advancement of econometric techniques for
analysing regional convergence (see Magrini 2004 for an overview).
Along these developments, the mere concept of regional convergence has become
somewhat fuzzy and some seemingly elementary issues have been surprisingly neglected. For
3
example, relatively little has been done to link the positive evidence with interpretations and
subjective perceptions of different concepts of regional convergence and divergence.
Although several different approaches to the study of regional convergence have been
distinguished in scientific literature (a brief overview appears in Section 3), these
scientifically established conceptions only partially reflect how the notion of regional
convergence is understood by public.
This article begins with a simple questionnaire experiment that considers personal
judgements of some model examples of regional dynamics (Section 2). It illustrates that
people tend to assess regional convergence primarily according to the changes in absolute
income gaps between regional incomes and that they also reflect some other aspects of
regional dynamics in their judgements. Accordingly, Section 4 describes the data (4.1.) and
discusses different techniques to be used for the empirical analysis of regional dynamics (4.2).
In Section 5, these techniques are applied to the EU27 NUTS 2 regional data when
considering the two basic indicators of living standards in terms of real per capita GDP and
per capita household expenditures (both adjusted for international variations in purchasing
power) over the period of 1992-2006. Section 6 then ends with some concluding comments.
The results show that the answer to the central question: “Did regions of the enlarged
EU converge or diverge?” is somewhat ambiguous. Regional convergence in relative ratios
has often been concurrent to prevailing widening of absolute gaps in the standards of living.
At least from the point of view of subjective judgements, for many people, such a conclusion
can be in conflict with the notion of regional cohesion pushed forward by the EU institutions.
Beyond the aggregate trends, the analysis suggests that the distribution of regions is far from
static: significant extent of switching and mobility of individual regions has been detected.
2. Judgements and subjective assessment of regional convergence The inferences made about regional convergence are certainly not free of normative
opinions. At the same time, there are always implicit value judgements when selecting
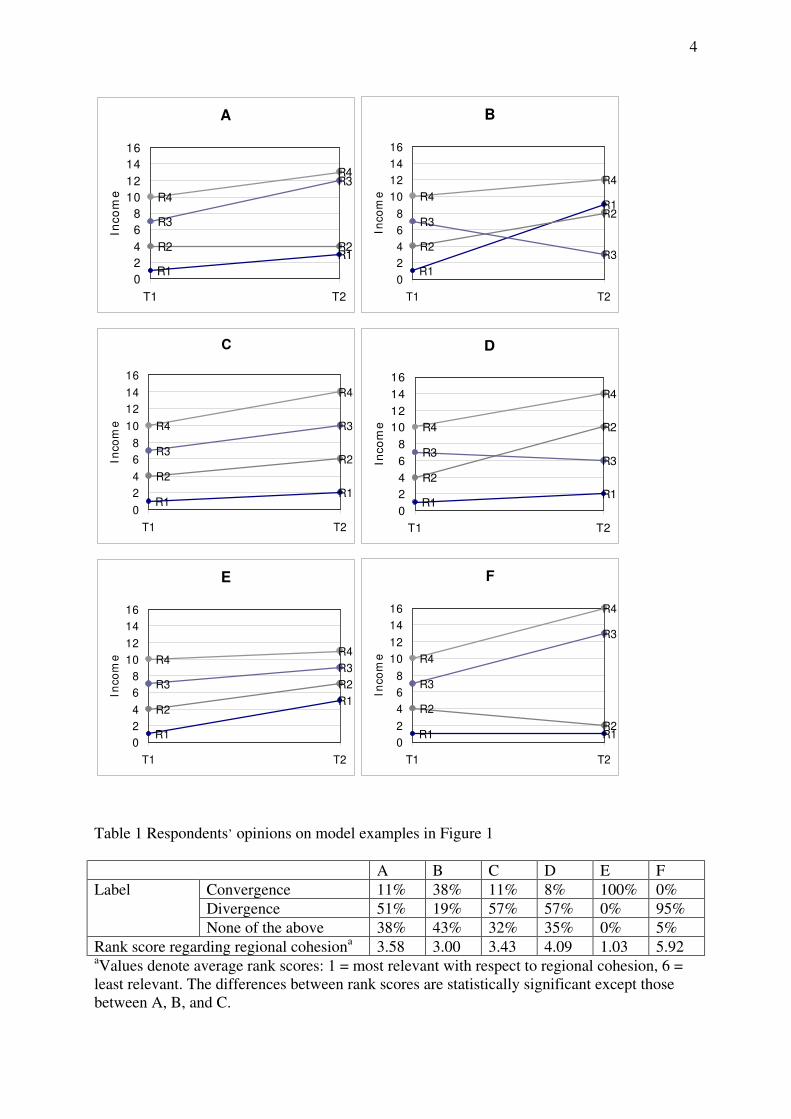
indicators for the analysis of regional convergence. Consider, for example, Figure 1 which
shows six different possibilities of regional dynamics in a hypothetical country consisting of
four regions. A simple questionnaire experiment was undertaken that, in an anecdotal but
illustrative way, addresses subjective views on these model examples.1 The respondents were
firstly instructed to assume the regions are identical in all characteristics except income and
then asked to think over each of the alternatives in Figure 1 and choose the most suitable label
from the following three options: “prevailing regional convergence;” “prevailing regional
divergence;” “neither of the two labels is suitable.” Subsequently, they were asked to order
these six examples of regional development according to their normative relevance
(desirability) with respect to the goal of regional cohesion. The results of this mini-survey are
summarized in Table 1. This evidence can be compared to basic measures of regional
convergence for particular model examples in Table 2.
Figure 1 Some model examples of regional dynamics
1 The sample consisted of 38 informed respondents including 21 final year graduate students, 9 postgraduate
researchers, and 8 post-doctoral and senior researchers working on regional issues. In addition to the graphical
plots (Figure 1), the respondents were also provided with the corresponding data in a table-form.
4
A
R1
R1R2 R2
R3
R3
R4
R4
0
2
4
6
8
10
12
14
16
T1 T2
In
co
me
B
R1
R1
R2
R2R3
R3
R4
R4
0
2
4
6
8
10
12
14
16
T1 T2
In
co
me
C
R1R1
R2
R2R3
R3R4
R4
0
2
4
6
8
10
12
14
16
T1 T2
In
co
me
D
R1R1
R2
R2
R3R3
R4
R4
0
2
4
6
8
10
12
14
16
T1 T2
In
co
me
E
R1
R1R2
R2R3
R3R4
R4
0
2
4
6
8
10
12
14
16
T1 T2
In
co
me
F
R1 R1
R2
R2
R3
R3
R4
R4
0
2
4
6
8
10
12
14
16
T1 T2
In
co
me
Table 1 Respondents’ opinions on model examples in Figure 1
A B C D E F
Label Convergence 11% 38% 11% 8% 100% 0%
Divergence 51% 19% 57% 57% 0% 95%
None of the above 38% 43% 32% 35% 0% 5%
Rank score regarding regional cohesiona 3.58 3.00 3.43 4.09 1.03 5.92
aValues denote average rank scores: 1 = most relevant with respect to regional cohesion, 6 =
least relevant. The differences between rank scores are statistically significant except those
between A, B, and C.
5
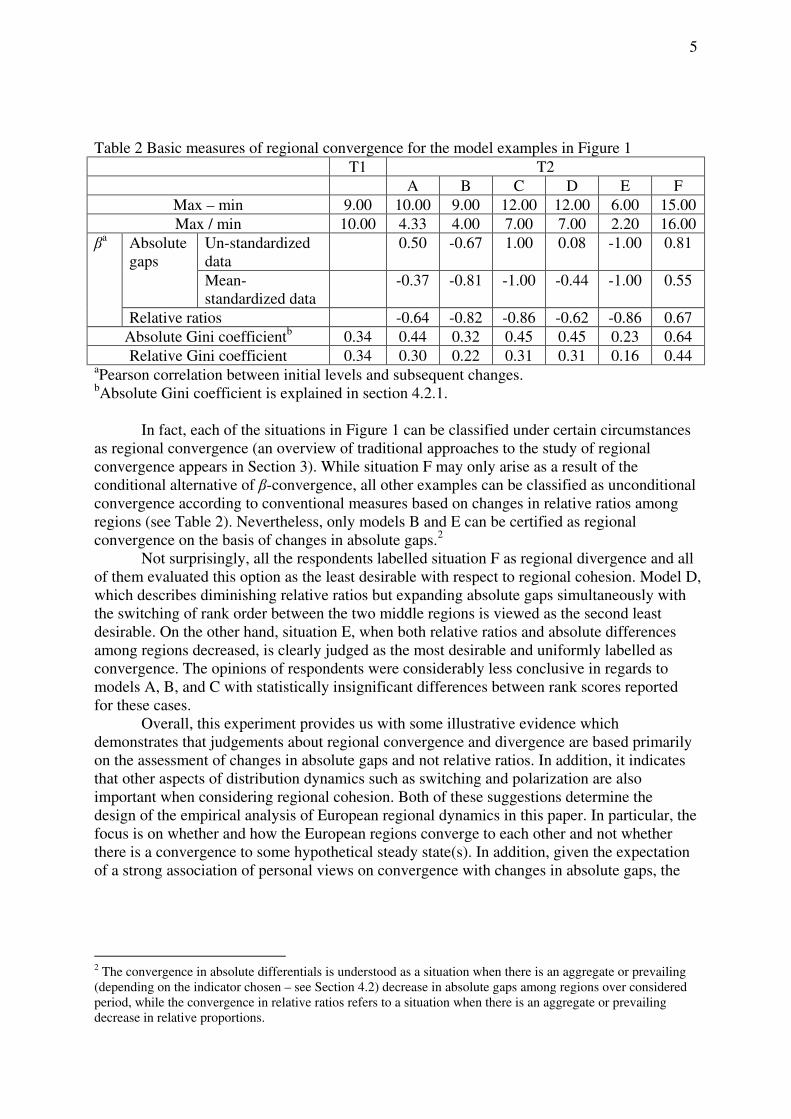
Table 2 Basic measures of regional convergence for the model examples in Figure 1
T1 T2
A B C D E F
Max – min 9.00 10.00 9.00 12.00 12.00 6.00 15.00
Max / min 10.00 4.33 4.00 7.00 7.00 2.20 16.00
βa Absolute
gaps
Un-standardized
data
0.50 -0.67 1.00 0.08 -1.00 0.81
Mean-
standardized data
-0.37 -0.81 -1.00 -0.44 -1.00 0.55
Relative ratios -0.64 -0.82 -0.86 -0.62 -0.86 0.67
Absolute Gini coefficientb 0.34 0.44 0.32 0.45 0.45 0.23 0.64
Relative Gini coefficient 0.34 0.30 0.22 0.31 0.31 0.16 0.44 aPearson correlation between initial levels and subsequent changes.
bAbsolute Gini coefficient is explained in section 4.2.1.
In fact, each of the situations in Figure 1 can be classified under certain circumstances
as regional convergence (an overview of traditional approaches to the study of regional
convergence appears in Section 3). While situation F may only arise as a result of the
conditional alternative of β-convergence, all other examples can be classified as unconditional
convergence according to conventional measures based on changes in relative ratios among
regions (see Table 2). Nevertheless, only models B and E can be certified as regional
convergence on the basis of changes in absolute gaps.2
Not surprisingly, all the respondents labelled situation F as regional divergence and all
of them evaluated this option as the least desirable with respect to regional cohesion. Model D,
which describes diminishing relative ratios but expanding absolute gaps simultaneously with
the switching of rank order between the two middle regions is viewed as the second least
desirable. On the other hand, situation E, when both relative ratios and absolute differences
among regions decreased, is clearly judged as the most desirable and uniformly labelled as
convergence. The opinions of respondents were considerably less conclusive in regards to
models A, B, and C with statistically insignificant differences between rank scores reported
for these cases.
Overall, this experiment provides us with some illustrative evidence which
demonstrates that judgements about regional convergence and divergence are based primarily
on the assessment of changes in absolute gaps and not relative ratios. In addition, it indicates
that other aspects of distribution dynamics such as switching and polarization are also
important when considering regional cohesion. Both of these suggestions determine the
design of the empirical analysis of European regional dynamics in this paper. In particular, the
focus is on whether and how the European regions converge to each other and not whether
there is a convergence to some hypothetical steady state(s). In addition, given the expectation
of a strong association of personal views on convergence with changes in absolute gaps, the
2 The convergence in absolute differentials is understood as a situation when there is an aggregate or prevailing
(depending on the indicator chosen – see Section 4.2) decrease in absolute gaps among regions over considered
period, while the convergence in relative ratios refers to a situation when there is an aggregate or prevailing
decrease in relative proportions.

6
development of both absolute differentials and relative ratios is considered,3 although the
existing empirical literature works almost exclusively with the latter.4
The results provided in this section can be linked to a representative body of evidence
obtained in the area known as the welfare approach (dating back to Dalton 1920) or the
subjective approach to inequality measurement (e.g. Amiel and Cowell 1999). In a related
vein, already Kolm (1976) and later also other authors (e.g. Ravallion 2003) have argued for
the legitimacy of the usage of “alternative” absolute inequality indices in addition to
conventional relative inequality measures. It has been shown that the conventional approaches
to inequality measurement (called “the economist’s view” by Amiel and Cowell 1999) often
don’t accord with how people themselves think about it. Recently, Kampelmann (2009, p.
692) used the example of different understandings to inequality as another case of “a
widespread conflict between accepted scientific conventions and non-scientific
representations.” In this paper we attempt to extend similar argument to the topic of the
measurement of regional convergence.
3. A brief review of conventional approaches and existing evidence Despite diverse methodologies employed in the empirical literature on regional
convergence, it can generally be divided between deductive and inductive approaches to
convergence analysis (also Novotný 2010). The two types differ in the modes of reasoning,
general goals (confirmatory versus exploratory approaches according to Rey and Janicas
2005), and methodological apparatus (regression-based techniques versus methods for
analysing distribution dynamics as indicated in Magrini 2004).
The deductive approaches typically begin with some theoretical expectations
according to which formal econometric equations are designed (some seminal papers are
Baumol 1986; Barro and Sala-i-Martin 1991, 1992). The growth rate is considered as
dependent variable in the regression, the initial value of the same indicator as explanatory
variable, while a set of control variables that affect growth rates may be included. The finding
of a negative relationship is then known as β-convergence. It is distinguished between
unconditional β-convergence (no control variables) and conditional β-convergence
(controlling for different structural fundamentals of regions). In the unconditional version
regions converge to a common steady state (independently of initial conditions) implying that
poor regions grow (on average) faster than rich regions. In the conditional version, regions
converge to different steady states for individual regions or their groups – convergence clubs.
The conditional β-convergence is thus compatible with increasing inequality and/or
polarization. In addition, the results obtained from the regression-based approaches refer
primarily to the behaviour of an average region, however, they tell us almost nothing about
what is happening with regional distribution as a whole (Magrini 2004, 2007).
Note that these structural models are suited to theory testing rather than to answering
the question of whether regions are converging or diverging. From this point of view, they
have been criticized as uninformative (Quah 1993, 1996a; Durlauf 2001; Magrini 2004, 2007;
Rey and Janikas 2005), although they can provide valuable insights into the role of individual
factors in the process of regional development. A review of empirical evidence indeed
suggests the limited informative value of these approaches. Although the majority of existing
3 Note that in this paper we are primarily concerned with the assessment of real standards of living. The
consideration of subjective views focusing on strictly economic indicators may apparently lead to considerably
different findings. 4 One exception is the paper by Webber and White (2003) analysing regional convergence in factor prices.
However, they apply the mean-standardized input data that shapes results toward those based on relative ratios
(compare results based on the un-standardized and mean-standardized data in Table 2). Note also that the
logarithmic transformations of input data (often applied for the purpose of treating non-normality) turn the
meaning of results to those obtained by ratios (logA – logB = logA/B).
7
studies support some sort of conditional β-convergence among European regions (e.g. Boldrin
and Canova 2001; Lopez-Rodriguez 2008), in other respects the results are ambiguous. For
example, the estimates of the speed of convergence differ by the order of magnitude. The
“classical” findings obtained by cross-section regressions indicate a generally low speed of
around 2% and less (Barro and Sala-i-Martin 1991; Armstrong 1995; Fingleton et al. 1996;
De la Fuente 2002). Whenever other econometric specifications – such as panel techniques
that allow controlling for unobserved heterogeneities among regions – are applied, the
estimates are typically much higher such as 8–40% (Canova and Marcet 1995; De la Fuente
2002; Lopez-Rodriguez 2008). Given these and other methodological ambivalences, together
with the abstract nature of growth theories, a growing gap between theoretical and empirical
insights into regional convergence analysis is suggested (Durlauf 2001 in Rey and Janicas
2005: 156).
If the concern is rather with whether and how regions converge to each other, the
second group of inductive or exploratory approaches is more informative. A number of
techniques have been proposed that focus on various links between convergence and
inequality, polarization, and intra-distribution mobility. A decrease in the dispersion or
inequality among regions is conventionally regarded as a sign of σ-convergence. Other
methods such as the estimates of univariate distribution densities, Markov transition matrices,
or related graphical tools for modelling transition probabilities provide additional information
about the shape of the distribution and intra-distribution dynamics. Although the exploratory
description of various aspects of unconditional σ-convergence usually represents the main part
of empirical analysis, some methods for analysing conditional σ-convergence have also been
developed (Quah 1996b; Egger and Pfaffermayr 2006; Pfaffermayr 2009).
Interestingly, results obtained by this second group of approaches are often in conflict with
the inferences about regional convergence produced by regression-based analysis (Quah 1993,
1996a). This seems to hold for the EU regions also. For example, Fischer and Stumpner
(2008) reject the catch-up hypothesis and instead suggest that there exists polarisation and
divergence among 257 NUTS 2 regions in the period 1995-2003. Moreover, other studies that
focus on σ-convergence concepts inform us about the substantial persistence of regional
disparities among European regions, especially if the concern is with regional living standards
(López-Bazo et al. 1999; Magrini 2004). By contrast, as regards earlier periods, regional σ-
convergence is more often reported (Barro and Sala-i-Martin 1991; Ezcurra et al. 2005b,
2007a). This empirical evidence shows that after a period of relative convergence among the
EU regions this process decelerated sometime around the mid of the 1970s. Another
established finding is a significant spatial dependence in the pattern of European regional
disparities. More concretely, the inter-national component in terms of between-country
inequality explains a substantial part of the story (Cuadrado-Roura 2001; Ezcurra et al. 2007a;
Fischer and Stumpner 2008). Regarding time trends, the finding of narrowing income
differences between the EU member states prevails, while the trends observed for inequalities
between regions within individual states are often contradictory (Rodríguez-Pose 1999, Puga
2002).
However, the general validity of these conclusions is substantially undermined by
different samples of regions and different variables examined. There are few recent papers
that analyse regional convergence within the enlarged EU (Ezcurra et al. 2007b; Fischer and
Stumpner 2008; European Commission 2007). In addition, the scope of the empirical work
listed above has been narrowed down to a predominant focus on variables based on economic
output (per capita or per worker GDP or GVA). Few other studies concern regional
convergence in various employment and unemployment indicators (Boldrin and Canova
2001; Marelli 2007; European Commission 2007) or regional factor price convergence
(Webber 2001; Webber and White 2003).
8
4. Methodical comments
4.1. Data The analysis considers the set of 264 NUTS 2 regions in the 27 EU countries. There is
only one region considered in seven smaller countries (Cyprus, Estonia, Latvia, Lithuania,
Luxembourg, Malta, and Slovenia). French overseas departments and Portugal’s autonomous
regions are omitted from the analysis. Although we are aware that the administrative NUTS
boundaries often do not delimit functional regions in which main socioeconomic processes
operate, the analysis is always dependent on what data are available. The data were drawn
with appropriate permissions from the Cambridge Econometrics database (as of February,
2009). The analysis considers two variables of living standards: per capita GDP adjusted for
purchasing power parity (GDP PPP) and, as a supplementary variable, per capita household
expenditures adjusted for purchasing power parity (HE PPP). The data are in real figures
(2000 Euro) and results thus refer to real convergence or divergence among European regions.
The study covers the period 1992-2006.
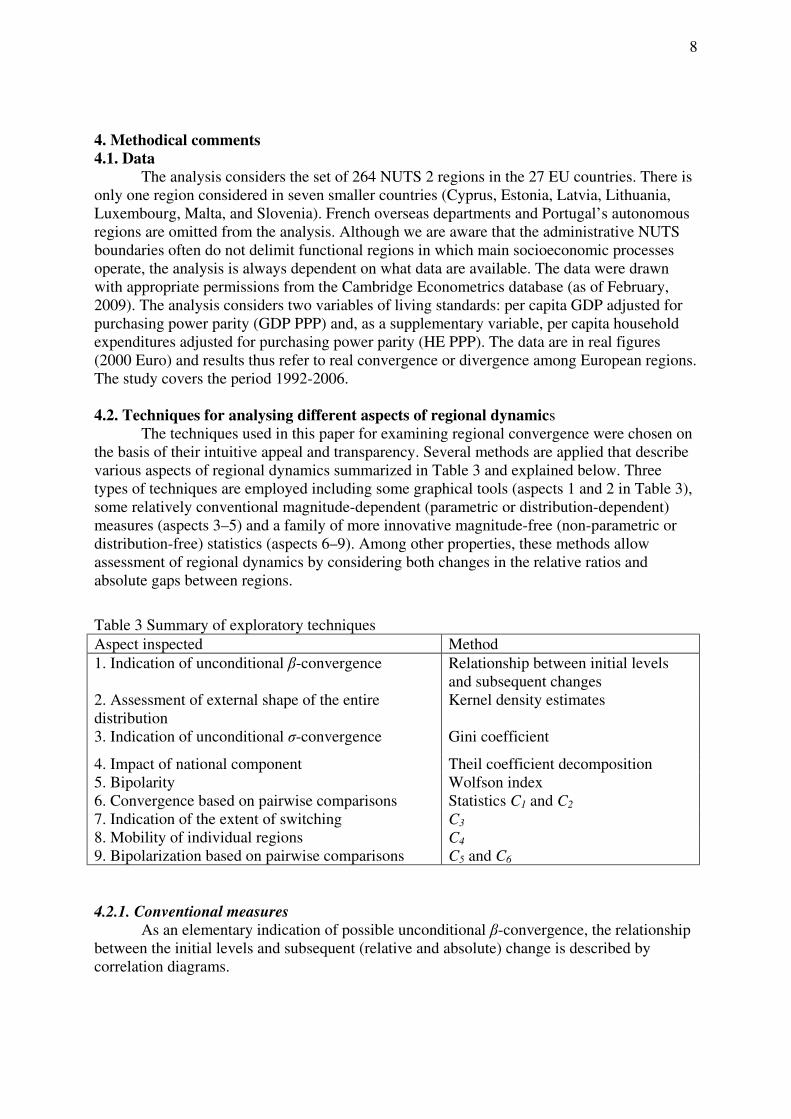
4.2. Techniques for analysing different aspects of regional dynamics
The techniques used in this paper for examining regional convergence were chosen on
the basis of their intuitive appeal and transparency. Several methods are applied that describe
various aspects of regional dynamics summarized in Table 3 and explained below. Three
types of techniques are employed including some graphical tools (aspects 1 and 2 in Table 3),
some relatively conventional magnitude-dependent (parametric or distribution-dependent)
measures (aspects 3–5) and a family of more innovative magnitude-free (non-parametric or
distribution-free) statistics (aspects 6–9). Among other properties, these methods allow
assessment of regional dynamics by considering both changes in the relative ratios and
absolute gaps between regions.
Table 3 Summary of exploratory techniques
Aspect inspected Method
1. Indication of unconditional β-convergence Relationship between initial levels
and subsequent changes
2. Assessment of external shape of the entire
distribution
Kernel density estimates
3. Indication of unconditional σ-convergence Gini coefficient
4. Impact of national component Theil coefficient decomposition
5. Bipolarity Wolfson index
6. Convergence based on pairwise comparisons Statistics C1 and C2
7. Indication of the extent of switching C3
8. Mobility of individual regions C4
9. Bipolarization based on pairwise comparisons C5 and C6
4.2.1. Conventional measures
As an elementary indication of possible unconditional β-convergence, the relationship
between the initial levels and subsequent (relative and absolute) change is described by
correlation diagrams.

9
The nonparametric kernel density estimates are applied in order to analyse the
development of the external shape of the entire cross-sectional distribution of European
regions. The kernel density estimates are derived as:
∑=
−=
r
j
j
h
yyK
rhyf
1
1)(ˆ
where K is a kernel function which integrates to one and h stands for the bandwidth. In this
paper, the Gaussian kernel function is employed and the bandwidth is determined according
to the Silverman´s “rule of thumb” (Silverman 1986: 48). Unlike most of the other papers, the
untransformed instead of mean-standardized input data are used here for the estimation of
kernel density curves. Although the usage of standardized probability densities would allow
direct comparisons of the curves with respect to relative changes, this kind of transformation
rules out the visual comparisons regarding changes in absolute differentials.
For the sake of quantitative comparability of σ-convergence trends, the Gini
coefficients are employed. The conventional relative Gini coefficient can be quantified in its
weighted form as follows:
( )∑∑= =
−=m
j
m
k
kj
kjyy
n
n
n
n
yGr
1 12
1
where y represents the overall average of the measured characteristic; yj and yk correspond to
respective averages of regions j and k; n stands for the overall population size, and nj, nk are
population sizes of regions j and k.
The Gini coefficient (which is mathematically equivalent to half of the relative mean
difference) can be interpreted in regard to the extent of relative deprivation in a society. More
concretely, Yitzhaki (1979) demonstrated that an aggregate relative deprivation in a society
corresponds to the product of the relative Gini and the distribution mean. Such a measure is
what has become known as the absolute Gini coefficient. In contrast to the relative Gini which
is scale invariant, the absolute Gini coefficient is a translation-invariant measure (i.e. invariant
to equal absolute additions). The latter property implies that the absolute Gini is not a unit-
free measure. To allow direct comparisons of its changes over time, the absolute Gini is
considered in a standardized form as follows:
Gap = (ytp / yt0) Grp
where Gap and Grp are absolute and relative Gini coefficients in the year p and yt0 and ytp
denotes the entire distribution averages in the first year and p-th year, respectively.
The Theil coefficient decomposition is used for the inspection of the inter-national
component in terms of the share of the between-country component in the overall regional
inequality. The overall Theil coefficient (T) can be decomposed into the between-country (B)
and within-country (W) component as follows:
WBy
y
y
y
y
y
n
n
y
y
y
y
n
nT
l
c
q
i c
ic
c
icccl
c
ccc +=
+
= ∑ ∑∑
= == 1 11
lnln
where nc denotes the population size of country c; yc is the country average and yic refers to
the average of the i-th region in the c-th country. The inter-national component (IC) then
corresponds to the proportion of overall Theil coefficient attributable to the between-country
inequality:

10
IC = B / T
Another interpretation of IC is that it measures the clustering of regions within
national borders (i.e. around national averages). However, the notion of polarization is more
commonly understood as the clustering around two modes (bipolarity). To address this
important aspect, the Wolfson bipolarity index is applied as it was originally proposed for a
population divided into two groups by the median value (Wolfson 1994). This index is
derived from the Lorenz curve and it corresponds to twice the area between the Lorenz curve
and the tangent line at the median point (Zhang and Kanbur 2001). It can be expressed as:
−
−= GrL
z
yW 50
2
12
2
where z corresponds to the median, L50 denotes value at the 50th percentile of Lorenz curve,
and Gr is the above explained relative Gini coefficient. All of these components are
considered in their population weighted forms. The index attains value between 0 and 1 with
higher values signifying higher bipolarity. The maximum bipolarity is reached when the upper
half accounts for all the income.
4.2.2. Distribution-free statistics
All of the aforementioned statistics depend on the magnitudes of data involved in a
sense that they are not distribution-free. As such, the results may be, on the one hand,
substantially sensitive to extreme values while, on the other hand, some small but important
changes on a practical level may not be detected. Moreover, none of the techniques above
allow quantifying mobility within the distribution of regions (the kernel plots can indicate
some aspects of intra-distribution mobility but do not allow for quantitative comparisons).
Therefore, we apply a family of magnitude-free statistics proposed in Webber and White
(2003) and Webber et al. (2005) with some own modifications. These measures are based on
the assessment of the relative frequency of concordant pairs of regions (pairs with narrowing
absolute gaps or relative proportions over some period of time) against the relative frequency
of disconcordant pairs of regions (with expanding absolute differentials or relative ratios).
For assessing convergence and divergence based on absolute differentials in the period
between t and t + m, let us define:
−<−−
−>−+
= ++
++
+
otherwise0
if1
if1
,,,,
,,,,
,,,,1 mtkmtjtktj
mtkmtjtktj
mttkj yyyy
yyyy
L
where yj,t and yk,t denote averages of measured characteristics for regions j and k at time t.
Because there is r(r – 1) possible pairs of regions in the set of r regions, a simple measure of
regional convergence based on the inspection of changes in absolute differentials in the set of
r regions corresponds to:
)1(
21 1
,,,,1
,,1 −=
∑ ∑= +=
+
+rr
L
C
r
j
r
jk
mttkj
mtt
11
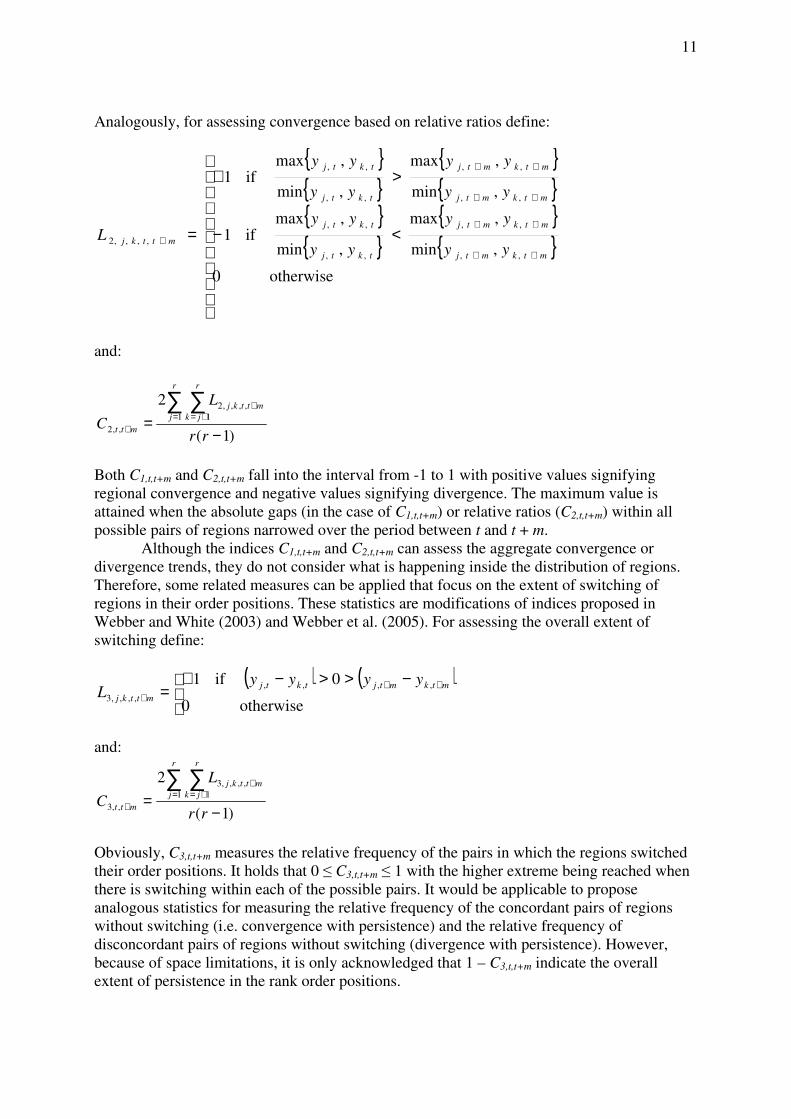
Analogously, for assessing convergence based on relative ratios define:
{ }{ }
{ }{ }
{ }{ }
{ }{ }
<−
>+
=++
++
++
++
+
otherwise0
,min
,max
,min
,maxif1
,min
,max
,min
,maxif1
,,
,,
,,
,,
,,
,,
,,
,,
,,,,2
mtkmtj
mtkmtj
tktj
tktj
mtkmtj
mtkmtj
tktj
tktj
mttkjyy
yy
yy
yy
yy
yy
yy
yy
L
and:
)1(
21 1
,,,,2
,,2 −=
∑ ∑= +=
+
+rr
L
C
r
j
r
jk
mttkj
mtt
Both C1,t,t+m and C2,t,t+m fall into the interval from -1 to 1 with positive values signifying
regional convergence and negative values signifying divergence. The maximum value is
attained when the absolute gaps (in the case of C1,t,t+m) or relative ratios (C2,t,t+m) within all
possible pairs of regions narrowed over the period between t and t + m.
Although the indices C1,t,t+m and C2,t,t+m can assess the aggregate convergence or
divergence trends, they do not consider what is happening inside the distribution of regions.
Therefore, some related measures can be applied that focus on the extent of switching of
regions in their order positions. These statistics are modifications of indices proposed in
Webber and White (2003) and Webber et al. (2005). For assessing the overall extent of
switching define:
( ) ( ) −>>−+
= +++
otherwise0
0if1 ,,,,
,,,,3
mtkmtjtktj
mttkj
yyyyL
and:
)1(
21 1
,,,,3
,,3 −=
∑ ∑= +=
+
+rr
L
C
r
j
r
jk
mttkj
mtt
Obviously, C3,t,t+m measures the relative frequency of the pairs in which the regions switched
their order positions. It holds that 0 ≤ C3,t,t+m ≤ 1 with the higher extreme being reached when
there is switching within each of the possible pairs. It would be applicable to propose
analogous statistics for measuring the relative frequency of the concordant pairs of regions
without switching (i.e. convergence with persistence) and the relative frequency of
disconcordant pairs of regions without switching (divergence with persistence). However,
because of space limitations, it is only acknowledged that 1 – C3,t,t+m indicate the overall
extent of persistence in the rank order positions.

12
In addition, a simple measure of the intra-distribution mobility can be proposed for
individual regions. For the particular region j this measure is defined as:
∑ ++ = mttkjmttj LC ,,,,4,,,4
Where mttkjL +,,,,4 stands for the number of the region’s upward steps against the number of its
downward steps in the rank order distribution (i.e. change in its rank position over the period
from t to t+m). Formally mttkjL +,,,,4 corresponds to:
( ) ( )( ) ( )
−>>−−
−<<−+
= ++
++
+
otherwise0
0if1
0if1
,,,,
,,,,
,,,,4 mtkmtjtktj
mtkmtjtktj
mttkj yyyy
yyyy
L
Finally, simple measures of bipolarization based on changes in absolute gaps and
relative proportions, respectively, can be proposed. Let yj,A,t be measured as a variable for
region j pertaining to the upper half of the distribution (i.e. values above the median) and yk,B,t
be the same variable for region k pertaining to the lower half of the distribution (values below
the median) at time t. Now, define:
( ) ( )( ) ( )
−>−−
−<−+
= ++
++
+
otherwise0
if1
if1
,,,,,,,,
,,,,,,,,
,
,,,,5 mtBkmtAjtBktAj
mtBkmtAjtBktAj
BA
mttkj yyyy
yyyy
L
and:
2
1 1
,
,,,,5
,
,,5
4
r
L
C
r
j
r
k
BA
mttkj
BA
mtt
∑∑= =
+
+ =
Analogously, by considering relative ratios instead of absolute differentials define:
( ) ( )( ) ( )
>−
<+
= ++
++
+
otherwise0
//if1
//if1
,,,,,,,,
,,,,,,,,
,
,,,,6 mtBkmtAjtBktAj
mtBkmtAjtBktAj
BA
mttkj yyyy
yyyy
L
and:
2
1 1
,
,,,,6
,
,,6
4
r
L
C
r
j
r
k
BA
mttkj
BA
mtt
∑∑= =
+
+ =
These statistics measure bipolarization by the comparison of the relative frequency of
disconcordant pairs consisting of regions below and above the median of the distribution

13
against the relative frequency of concordant pairs. The results fall into the interval between -1
and 1 and positive values indicate increase in bipolarity over the considered period.
5. Results As a simple indication of unconditional β-convergence, the relationship between the
initial levels of variables under consideration and their subsequent change over the considered
period is firstly studied. The existence of a negative relationship is an established result in
literature, although it can often be rejected after controlling for other factors (De la Fuente
2002, 23). This conclusion, nevertheless, again refers exclusively to the consideration of
changes in relative growth rates and not in the absolute gaps. Both of these options are
compared in Figure 2. It is apparent that the poorer regions, on average, have reported higher
percentage growth than the richer ones. Accounting for the absolute increments instead of
relative growth rates, the weak negative relationship is nevertheless indicated only for HE but
not for GDP. However, the linear trend lines obviously do not fit the data well. The inferences
about the unconditional β-convergence trends made for the hypothetical average region can be
thus generalized poorly. The fact that there are several outliers apparent in each of the plots
suggests that the application of the distribution free techniques described above is relevant for
the analysis of European regional dynamics. An additional finding that can be drawn from
these plots is that there is only a limited correspondence between the distributions of regions
according to individual variables. The patterns of the distributions of regions according to
GDP and HE are dissimilar and the convergence regions shown in filled marks (as of the 2007
EU classification) are more intermixed with respect to the latter variable. It may suggest that
the analysis of other variables of living standards, rather than the most frequently studied
GDP, can provide additional insights into the process of European regional convergence.
Figure 2 Initial level versus subsequent relative and absolute change

14
Units in filled grey marks are regions eligible for funding under the EU convergence objective
(as of 2007).
The correlation diagrams provide us with a first glimpse into the European regional
growth patterns. However, they are uninformative in regard to the entire distribution
dynamics and fluctuations within the considered period. Other techniques applied here are
more informative in this respect. Let us start with the examination of the kernel probability
density estimates that are shown in Figure 3. The obvious feature of the graphs (especially of
the curves for GDP) is a gradual incorporation of the left tails into the main body-masses of
the density distributions. It indicates vanishing bipolarity and convergence due to a catch-up
of some of the poorer regions (mainly Central and East European regions). Nevertheless,
some contrariwise dispositions towards polarization of a new kind as well as a prospective
divergence can also be distinguished. It is suggested by some flattening of the density curves
and also by a prolongation of their right tails.
Figure 3 Univariate kernel density estimates
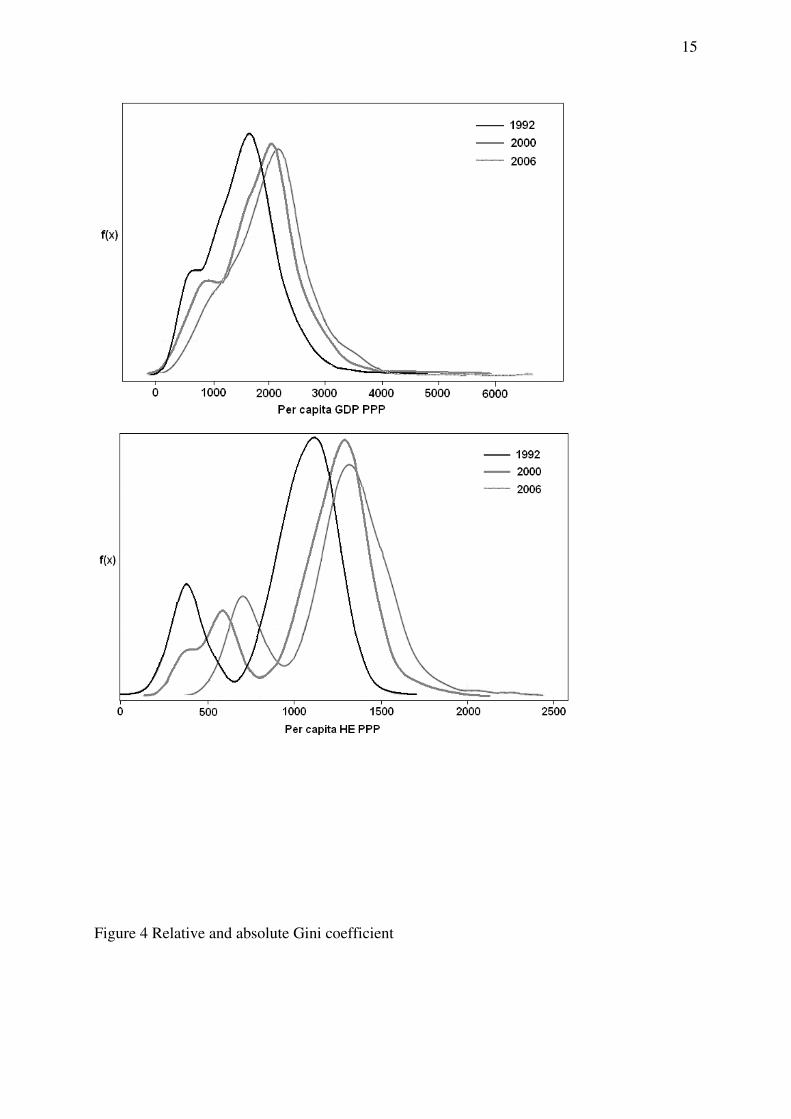
15
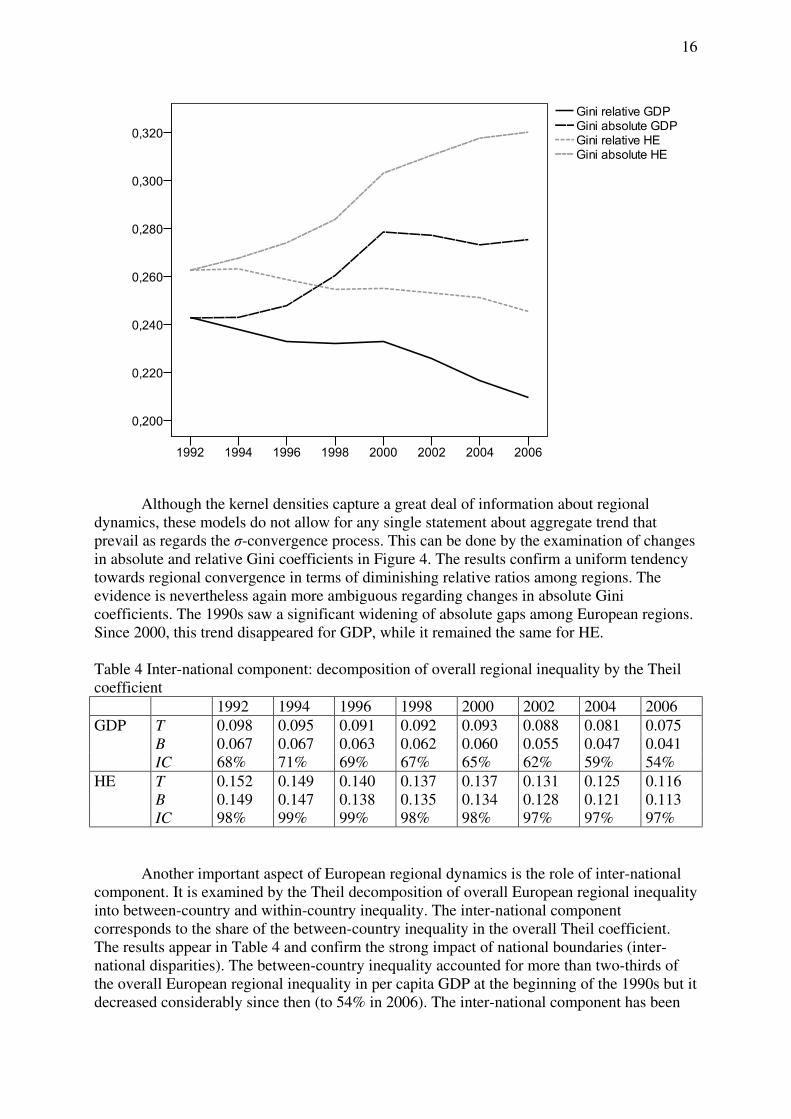
Figure 4 Relative and absolute Gini coefficient
16
Although the kernel densities capture a great deal of information about regional
dynamics, these models do not allow for any single statement about aggregate trend that
prevail as regards the σ-convergence process. This can be done by the examination of changes
in absolute and relative Gini coefficients in Figure 4. The results confirm a uniform tendency
towards regional convergence in terms of diminishing relative ratios among regions. The
evidence is nevertheless again more ambiguous regarding changes in absolute Gini
coefficients. The 1990s saw a significant widening of absolute gaps among European regions.
Since 2000, this trend disappeared for GDP, while it remained the same for HE.
Table 4 Inter-national component: decomposition of overall regional inequality by the Theil
coefficient
1992 1994 1996 1998 2000 2002 2004 2006
GDP T 0.098 0.095 0.091 0.092 0.093 0.088 0.081 0.075
B 0.067 0.067 0.063 0.062 0.060 0.055 0.047 0.041
IC 68% 71% 69% 67% 65% 62% 59% 54%
HE T 0.152 0.149 0.140 0.137 0.137 0.131 0.125 0.116
B 0.149 0.147 0.138 0.135 0.134 0.128 0.121 0.113
IC 98% 99% 99% 98% 98% 97% 97% 97%
Another important aspect of European regional dynamics is the role of inter-national
component. It is examined by the Theil decomposition of overall European regional inequality
into between-country and within-country inequality. The inter-national component
corresponds to the share of the between-country inequality in the overall Theil coefficient.
The results appear in Table 4 and confirm the strong impact of national boundaries (inter-
national disparities). The between-country inequality accounted for more than two-thirds of
the overall European regional inequality in per capita GDP at the beginning of the 1990s but it
decreased considerably since then (to 54% in 2006). The inter-national component has been
17
even more important in the case of per capita HE figures explaining almost all the European
regional inequality. Partially, this is attributable to the fact that the data on regional HE for
some of the countries (especially for the new EU members) are estimates tied to national
figures. First of all, however, the results show that the European regional convergence was
clearly driven by the convergence among national economies. By contrast, there was no
convergence between regions within individual countries.
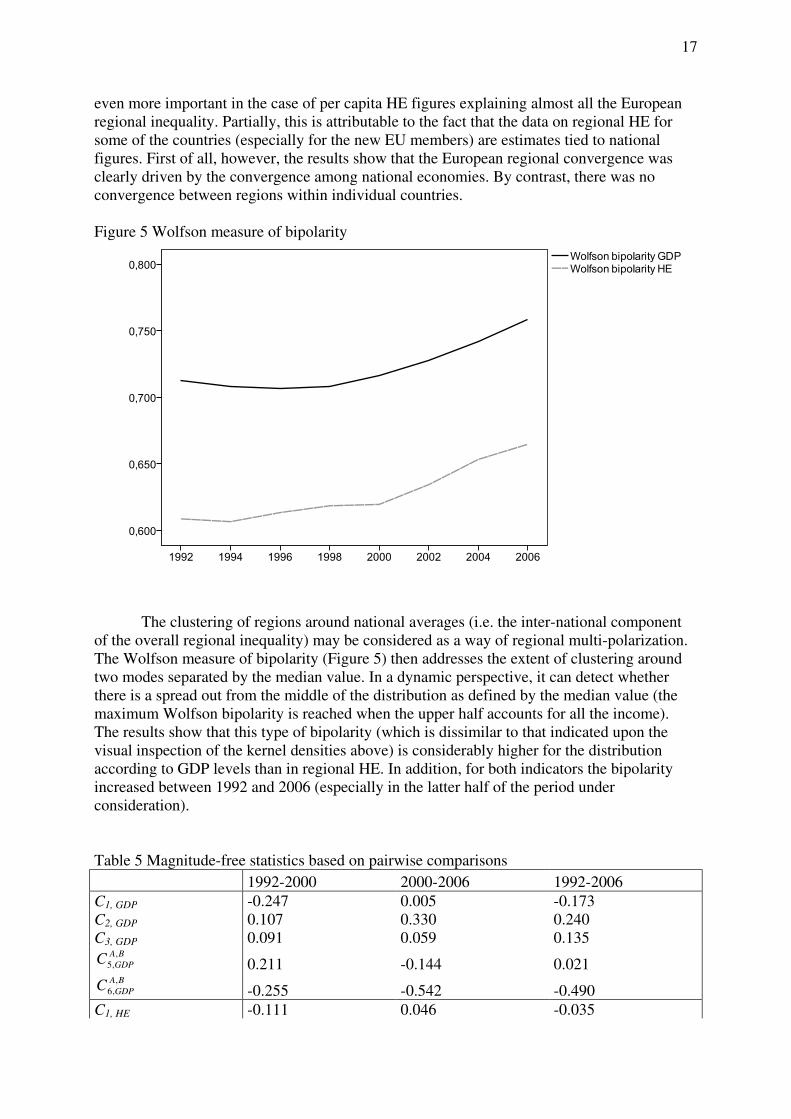
Figure 5 Wolfson measure of bipolarity
The clustering of regions around national averages (i.e. the inter-national component
of the overall regional inequality) may be considered as a way of regional multi-polarization.
The Wolfson measure of bipolarity (Figure 5) then addresses the extent of clustering around
two modes separated by the median value. In a dynamic perspective, it can detect whether
there is a spread out from the middle of the distribution as defined by the median value (the
maximum Wolfson bipolarity is reached when the upper half accounts for all the income).
The results show that this type of bipolarity (which is dissimilar to that indicated upon the
visual inspection of the kernel densities above) is considerably higher for the distribution
according to GDP levels than in regional HE. In addition, for both indicators the bipolarity
increased between 1992 and 2006 (especially in the latter half of the period under
consideration).
Table 5 Magnitude-free statistics based on pairwise comparisons
1992-2000 2000-2006 1992-2006
C1, GDP -0.247 0.005 -0.173
C2, GDP 0.107 0.330 0.240
C3, GDP 0.091 0.059 0.135 BA
GDPC,
,5 0.211 -0.144 0.021 BA
GDPC,
,6 -0.255 -0.542 -0.490
C1, HE -0.111 0.046 -0.035

18
C2, HE 0.230 0.229 0.314
C3, HE 0.160 0.129 0.236 BA
HEC,
,5 -0.110 -0.305 -0.347 BA
HEC,
,6 -0.498 -0.523 -0.675
The results obtained by the conventional techniques can now be contrasted to those
acquired by the statistics based on magnitude-free pairwise comparisons. Some additional
distribution properties such as the extent of switching and the mobility of individual regions
are also assessed using these measures. Firstly, consider statistics C1 and C2 in Table 5 that
can detect regional convergence or divergence based on absolute differentials and relative
ratios, respectively. The values of C2 clearly confirm convergence in the relative ratios both
with respect to GDP and HE. The number of pairs of regions with narrowing relative gaps
exceeded the number of pairs of regions with increasing gaps by 24% over the period 1992-
2006 regarding per capita GDP and by 31.4% when considering per capita HE figures. While
in the case of the former variable the convergence trend was more than two times weaker in
1992-2000 relative to the period 2000-2006, the strength of convergence was similar between
these two periods when accounting for the relative differentials in HE. By contrast, there was
a significant widening of absolute gaps in living standards among European regions until
2000 (i.e. negative C1,GDP,1992-2000 and C1,HE,1992-2000). These effects have been less pronounced
in more recent period since 2000. Overall, there is a relatively good correspondence between
these results and those based on Gini coefficients in Figure 4.
The extent of switching captured by C3 indicates that the rank order distribution of
European regions is far from static. For example, between 1992 and 2006 approximately 14%
of all possible pairs of regions switched their rank order positions with respect to their GDP
levels and even 24% in regard to their HE levels.
In addition, the measure of mobility of particular regions (C4) provides us with
disaggregated information about the individual shifts within the rank order distributions in
terms of the number of steps individual regions made upward or downward. Although it
would be beyond the scope of this paper to discuss individual shifts of regions in detail,
Figure 6 indicates the aggregate pattern and depicts the cases of regions exhibiting a
significant upward or downward mobility. Upon visual inspection, it is clear that the changes
in the rank distributions were considerable and that there was an apparent criss-crossing and
even leapfrogging for some of the European regions. Regarding changes in the per capita
GDP ladder, the most pronounced examples of upward mobility are the capital regions of
Slovakia (Bratislavský kraj), Czechia (Praha), Greece (Attiki), and Ireland (Southern and
Eastern) that moved more than a hundred ranks up. However, except the case of Irish regions,
these units did not record similar shifts when considering changes in the HE distribution. In
addition to the two Irish regions, the former East German territories such as Dessau, Chemnitz,
Halle, Thüringen, Dresden and also the Finnish region of Itä-Suomi changed their positions
by at least 90 steps upward in this respect. On the other hand, the most significant downward
changes in the GDP rank positions are reported for the Bulgarian regions Severozapaden and
Yiugoiztochen, for the Greek region of Sterea Ellada, and for the German administrative
territories of Berlin, Koblenz, and Trier (all of these regions fell at least 75 positions down).
Finally, the most considerable downward movements in the HE rank distribution are
uniformly observed for the former West German territories when the regions of Lüneburg,
Hannover, Braunschweig, Schleswig-Holstein, Detmold, Koblenz, and Trier are the cases
with at least 80 steps down the HE distribution.

19
Figure 6 Mobility of individual regions
Finally, the bipolarization measures C5 and C6 reported in Table 5 compares the
relative frequency of concordant and disconcordant pairs of regions below and above the
median value focusing again on the development of both absolute differences (C5) and
relative ratios (C6), respectively. These results suggest that regarding relative differentials the
lower and upper halves of European regional distribution came clearly closer together
between 1992 and 2006. Accounting for the development of absolute gaps, this holds only for
the HE figures. With respect to the GDP figures, a slight bipolarization has been found over
the considered period which is, however, attributable merely to the development before 2000.
These findings can be confronted with those on the increasing bipolarity suggested by the
Wolfson measure of bipolarity (Figure 5). An apparent inconsistence of the results may be
explained by the sensitivity of the Wolfson measure to changes in the upper tail of the
distribution.
6. Concluding remarks This paper has begun with a brief consideration of the subjective judgements of
regional convergence and divergence. A simple questionnaire experiment has been used to
show that personal judgements about regional convergence are based primarily on the
assessment of changes in absolute income gaps and not relative ratios in regional incomes. In
20
addition, it has been indicated that other aspects of distribution dynamics such as switching
and polarization are also important in regards to personal opinions on regional cohesion. From
this point of view, the conventional approaches to measuring regional convergence do not
accord well with how people think about it. As such, this topic can be seen as another
example of a conflict between accepted scientific and non-scientific representations.
In the main body of the paper we have sought to follow these arguments in our
empirical investigation of regional convergence in living standards among 264 regions
comprising the area of the enlarged European Union over the period 1992-2006. Several
exploratory techniques have been applied including some conventional methods as well as a
family of more innovative magnitude-free measures based on pairwise comparisons. Among
other properties, these techniques allow for the assessment of regional convergence by
considering changes in both relative ratios and absolute gaps as well as for the examination of
other aspects of intra-distributional dynamics such as switching, polarization, and mobility.
The overall picture provided by our analysis on the convergence among the EU
regions is somewhat ambiguous. While a significant reduction of the relative differentials has
been documented, the absolute gaps widened among the bulk of European regions over the
entire period considered. A considerable extent of switching and even leapfrogging of some
regions has also been detected. In addition, the analysis has suggested that a substantial part of
the divergence in the absolute levels of regional living standards occurred before 2000, while
the development has generally been more optimistic thereafter.
From a statistical perspective, these results are no surprise. The EU spatial disparities
increased considerably after its enlargement to the East and, at the same time, the probability
of detecting convergence in relative ratios simultaneously with uncovering divergence in
absolute gaps increases with the heterogeneity of the sample under consideration.
Nevertheless, as already discussed above, the assessment of regional convergence based on
changes in both absolute and relative differentials is legitimate, while the former becomes
increasingly important if the concern is about people´s perceptions (and perceived relative
deprivation). For example, if we wish to compare our aggregate findings on European
regional development with the six model examples shown in Figure 1, the model D (signified
by narrowing relative differences, increasing absolute gaps, and some switching in the rank
distribution) would actually be the closest. Interestingly, 57% of our respondents labelled this
scenario as regional divergence and it was also seen as the second least desirable alternative
regarding the goal of regional cohesion. From this point of view, our findings might seem to
be somewhat disappointing and in conflict with the notion of regional cohesion pushed
forward by the EU institutions.
In addition, our analysis has also focused on some other properties of European
regional dynamics. An important one is the role of the inter-national component. In this
regard, it has been confirmed that the inter-national component explains a major part of the
EU regional income inequality. In addition, it has shown that the convergence (in relative per
capita GDP levels) was clearly driven by a decrease in the share attributable to differences
between countries. By contrast, there was a lack of convergence among regions within
particular countries. The analysis has also focused on the several forms of bipolarity in the
distribution of European regions. The visual inspection of kernel density estimates has, on the
one hand, indicated a vanishing bipolarity in terms of a gradual incorporation of the left tails
into the main body-masses of the density distributions (mainly due to the catch-up of some of
the poorer Central and East European regions). On the other hand, it has also uncovered a
flattening of the density curves and prolongation of their right tails. The latter finding can be
related to the reported increases in the Wolfson bipolarity measures suggesting that there was
a spread out from the middle of the European regional distribution between the years 1992
and 2006.
21
The research focus on various aspects of European regional dynamics will surely
remain a vital topic of considerable theoretical and practical relevance. A number of
methodological and analytical advances and a rapidly growing body of empirical evidence
have recently been acquired. However, as this paper has sought to demonstrate, some other
important issues such as the subjective approach (and normative views) to regional
convergence analysis have yet to be developed.
References: Amiel, Y., F.A. Cowell (1999), Thinking About Inequality. Cambridge University Press,
Cambridge.
Armstrong, H.W. (1995), Convergence Among Regions of the European Union, 1950-90.
Papers in Regional Science, Vol. 74: pp. 143-152.
Barro, R.J., X. Sala-i-Martin (1991), Convergence Across States and Regions. Brooking
Papers on Economic Activity, Vol. 22: pp. 107-182.
Barro, R.J., X. Sala-i-Martin (1992), Convergence. Journal of Political Economy, Vol. 100:
pp. 223-251.
Baumol, W.J. (1986), Productivity Growth, Convergence, and Welfare: What the Long-Run
Data Show. American Economic Review, Vol. 76: pp. 1072-1085.
Blažek, J., D. Uhlíř (2002): Teorie regionálního rozvoje. Karolinum, Praha.
Boldrin, M., F. Canova (2001), Inequality and Convergence: Reconsidering European
Regional Policies. Economic Policy, Vol. 16: pp. 207-253.
Canova, F., A. Marcet (1995), The Poor Stay Poor: Non-Convergence Across Countries and
Regions. CEPR Discussion Paper 265. Centre for Economic Policy Research, London.
Cuadrado-Roura, J.R. (2001), Regional Convergence in the European Union: From
Hypothesis to the Actual Trend. Annals of Regional Science, Vol. 35: pp. 333-356.
Dalton, H. (1920), The Measurement of the Inequality of Incomes. Economic Journal, Vol.
30: pp. 349-361.
De la Fuente, A. (2002), Convergence Across Countries and Regions: Theory and Empirics.
UFAE and IAE Working Paper 555.02.
Durlauf, S.N. (2001), Manifesto for Growth Econometrics. Journal of Econometrics, Vol.
100: pp. 65-69.
Egger, P., M. Pfaffermayr (2006), Spatial Convergence. Papers in Regional Science, Vol. 85:
pp. 199-215.
Esposti, R., S. Bussoletti (2008), Impact of Objective 1 Funds on Regional Growth
Convergence in the European Union: a Panel-Data Approach. Regional Studies, Vol. 42:
pp. 159-173.
EUROPEAN COMMISSION (2007), Growing Regions, Growing Europe: 4th Report on
Economic and Social Cohesion. Office for Official Publications of the European
Communities, Luxembourg.
Ezcurra, R., C. Gil, P. Pascual, M. Rapún (2005a), Regional Inequality in the European
Union: Does Industry Mix Matter? Regional Studies, Vol. 39: pp. 679-697.
Ezcurra, R., C. Gil, P. Pascual, M. Rapún (2005b), Inequality, Polarisation and Regional
Mobility in the European Union. Urban Studies, Vol. 42: pp. 1057-1076.
Ezcurra, R, P. Pascual, M. Rapún (2007a), Spatial Inequality in Productivity in the European
Union: Sectoral and Regional Factors. International Regional Science Review, Vol. 30: pp.
384-407.
Ezcurra, R., P. Pascual, M. Rapún (2007b), Regional Dynamics and Convergence Profiles in
the Enlarged European Union: A Non-Parametric Approach. Tijdschrift voor economische
en sociale geografie, Vol. 98: pp. 564-584.
22
Fingleton, B., R. Lewney, D. Pinelli (1996), Single Market Review 1996: Aggregate and
Regional Impact. Regional Growth and Convergence. Study for the European Commission.
Fischer, M, P. Stumpner (2008), Income Distribution Dynamics and Cross-Region
Convergence in Europe. Journal of Geographical Systems, Vol. 10: pp. 109-139.
Kampelmann, S. (2009), Inequality Measures as Conventions: New Interpretations of a
Classic Operationalization Problem. Socio-Economic Review, Vol. 7: pp. 669–694.
Kolm, S.C. (1976), Unequal Inequalities I. Journal of Economic Theory, Vol. 12: pp. 416-442.
López-Bazo, E., E. Vayá, A.J. Mora, J. Suriñach (1999), Regional Economic Dynamics and
Convergence in the European Union. Annals of Regional Science, Vol. 33: pp. 343-370.
Lopez-Rodriguez, J. (2008), Regional Convergence in the European Union: Results From a
Panel Data Model. Economics Bulletin, Vol. 18: pp. 1-7.
Magrini, S. (2004), Regional (Di)Convergence. J.V. Henderson, J.F. Thisse (Eds.) Handbook
of regional and urban economics. pp 2741-2796, Elsevier, Amsterdam.
Magrini, S. (2007), Analysing Convergence Through the Distribution Dynamics Approach:
Why and How? DSE Working Paper 13.
Marelli, E. (2007), Specialisation and Convergence of European Regions. The European
Journal of Comparative Economics, Vol. 4: pp. 149-178.
Novotný, J. (2010), Regionální ekonomická konvergence, divergence a další aspekty
distribuční dynamiky evropských regionů v období 1992-2006. Politická ekonomie, Vol.
58: pp. 166-185.
Pfaffermayr, M. (2009), Conditional β- and σ-convergence in Space: A Maximum Likelihood
Approach. Regional Science and Urban Economics, Vol. 39: pp. 63-78.
Puga, D. (2002), European Regional Policies in Light of Recent Location Theories. Journal of
Economic Geography, Vol. 2: 373-406.
Quah, D.T. (1993), Galton’s Fallacy and Tests of the Convergence Hypothesis. Scandinavian
Journal of Economics, Vol. 95: pp. 427-443.
Quah, D.T. (1996a), Regional Convergence Clusters Across Europe. European Economic
Review, Vol. 40: pp. 951-958.
Quah, D.T. (1996b), Empirics for Economic Growth and Convergence. European Economic
Review, Vol. 40: pp. 1353-1375.
Ravallion, M. (2003), The Debate on Globalization, Poverty and Inequality: Why
Measurement Matters, International Affairs, Vol. 79: pp 739–753.
Rey, S., M. Janikas (2005), Regional Convergence, Inequality, and Space. Journal of
Economic Geography, Vol. 5: pp. 155-176.
Rodriguez-Pose, A. (1999), Convergence or Divergence? Types of Regional Responses to
Socio-Economic Change in Western Europe. Tijdschrift voor Economische en Sociale
Geografie, Vol. 90: pp. 363-378.
Rodriguez-Pose, A., U. Fratesi (2004), Between Development and Social Policies: the Impact
of European Structural Funds in Objective 1 Regions. Regional Studies, Vol. 38: pp. 97-
113.
Silverman, B.W. (1986), Density Estimation for Statistics and Data Analysis. Monographs on
Statistics and Applied Probability. Chapman and Hall, London.
Webber, D. (2001), Convergence of Labour’s Factor Reward Between Regions of the EU.
Applied Economics Letters, Vol. 8: pp. 355-357.
Webber, D., P. White (2003), Regional Factor Price Convergence Across Four Major
European Countries. Regional Studies, Vol. 37: pp. 773-782.
Webber, D., P. White, D. Allen (2005), Income Convergence Across U.S. States: An Analysis
Using Measures of Concordance and Discordance. Journal of Regional Science, Vol. 45:
pp. 565-589.

23
Wolfson, M. (1994), When Inequalities Diverge? American Economic Review, Vol. 84: pp.
353-358.
Yitzhaki, S. (1979), Relative Deprivation and the Gini Coefficient. Quarterly Journal of
Economics, Vol. 93: pp. 321-324.
Zhang, X., Kanbur, R. (2001), What Difference Do Polarisation Measures Make? An
Application To China. Journal of Development Studies, Vol. 37: pp. 85-98.