conversion of adipose tissue: an energy-yielding and ... · conversion of carbohydrate to fat in...
TRANSCRIPT

Conversion of carbohydrate to fat in adipose tissue: an energy-yielding and, therefore, self-limiting process
J. P. FLATT
Unit of Experimental Medicine, Department of Nutrition and Food Science, Massachusetts Institute of Technology, Cambridge, Massachuetts 02139
ABSTRACT A theoretical analysis of the energy metabolism associated with the conversion of glucose to fat is presented. In tissues where the pentose cycle furnishes some of the NADPH required for fatty acid synthesis, this conversion is an ATP- yielding process. In rat adipose tissue the maximal rate of glucose conversion to fat can be quant'tatively predicted on the basis of the tissue's ability to use the ATP which is generated in excess during this conversion.
The energy-generating nature of this process provides the means for a type of regulation which depends on metabolic state and which, during fasting, contributes to the sparing of carbohydrate.
Impairment of lipogenesis in the fasting state is attributed to a decrease in the activity of the malate cycle and to the presence of free fatty acids. However, rather than by inhibiting specific enzymes, it is by virtue of their quality as substrates for energy production that free fatty acids and their CoA derivatives appear to inhibit de nom lipogenesis.
The regulatory phenomena discussed here may explain the failure of the attempts made to identify the rate-limiting step for de novo lipogenesis in adipose tissue.
SUPPLEMENTARY KEY WORDS control of lipogenesis . fatty acid synthesis . insulin . energy metabolism . ATP balance . fasting state . impairment of lipogenesis
A D I P O S E TISSUE is one of the major sites for the con- version of carbohydrate to fat in mammals (1, 2). The catabolism of glucose during fat synthesis has been quantitatively evaluated in rat adipose tissue. Agree- ment between the estimated pathway flows obtained by different methods was remarkably good (3, 4).
These studies showed that the generation of reducing equivalents during the formation of acetyl CoA from glucose exceeds by far the requirement for reducing equivalents in the reductive synthesis of FA, glycero- phosphate, and lactate. This evidence, together with the decrease observed in the oxidation of endogenous sub- strates during fat synthesis from glucose (3), was inter- preted to show that the conversion of glucose to fat is an energy-yielding process f o r the cell which carries out this transformation (3, 5-7). This does not detract from the fact that f o r the whole organism conversion of carbohydrate to storage fat results in a loss of some 10% of the caloric content, because of the ATP requirement in FA synthesis
The purpose of this theoretical article is to present a quantitative analysis of the energy metabolism associated with the conversion of carbohydrate to fat. The argu- ments are based mainly on published data with some new experimental evidence presented in support.
When glucose conversion to fat is proceeding at a maximal rate, enough ATP is generated to sustain the basic metabolic activity of the fat cells. Because the energy expenditure is limited in the absence of uncou- pling of oxidative phosphorylation, synthesis of fat from glucose in intact adipose tissue appears as a self-limiting process. With this insight a new concept can be ad-
(5).
Abbreviations: Ac., acetate; FA, fatty acid(s); FFA, free fatty acid(s); G, Gluc., glucose; G-6-P, glucose-6-phosphate; Ins., insulin; Lact., lactate; Mal., malate; Mal. Cy., malate cycle; pg-at., pg-atom(s); OA, oxaloacetate; Obs., observed; Pent. Cy., pentose cycle; Pyr., pyruvate; S, substrate; Tr.-P, triose-phos- phate(s).
JOURNAL OF LIPID RESEARCH VOLUME 11, 1970 131
by guest, on June 4, 2018w
ww
.jlr.orgD
ownloaded from

CONVERSION OF GLUCOSE TO FA
A ) with Malate Cy& B ) withour Malate Cy&
G-6-P
I OA - +----
FP -1-
0
QA Citrate
FIG. 1. Production and utilization of reducing equivalents as one acetyl CoA is formed from glucose and incorporated into FA. The oxidized and reduced forms of the coenzymes which transport these re- ducing equivalents are: NAD+, o; NADH, .; NADP+, n; and NADPH, .. In Fig. l A , one reducing equivalent for FA synthesis is obtained by transfer from NADH to NADP+ through the reactions of the Mal. Cy. ; the second NADPH required for the incorporation of one acetyl CoA into FA is generated in the Pent. Cy. The stoichiometry shown here neglects ( a ) the fact that one acetyl CoA per molecule of long- chain FA synthesized requires no reducing equivalent, and (a) the requirement of one reducing equivalent for the synthesis of glycerol-P for each molecule of triglyceride formed.
vanced to explain the impairment of lipogenesis in the fasting state.
T H E NET METABOLIC ENERGY BALANCE ASSOCIATED WITH THE TRANSFORMATION
OF GLUCOSE TO TRIGLYCERIDE
The major metabolic pathways involved in the syn- thesis of fat from glucose in adipose tissue are outlined in Fig. 1, with special emphasis given to the metabolism of reducing equivalents. The figure incorporates the idea that acetyl CoA leaves the mitochondria in the form of citrate after condensation with oxaloacetate ; acetyl CoA is then formed in the cytoplasm by the citrate cleavage enzyme (8-1 0).
Fig. 1A shows oxaloacetate, the second product formed by the cleavage enzyme, converted to malate by malic dehydrogenase. Malic enzyme then decarboxylates malate to pyruvate, yielding NADPH. Finally, oxalo- acetate is regenerated in the mitochondria by pyruvate carboxylase (7), completing a metabolic cycle (double line arrows in Fig. 1A) involving oxaloacetate, malate, and pyruvate. This cycle will be designated hereafter as the “malate cycle.”’ For each revolution of the malate cycle, one reducing equivalent is transferred from NADH to NADP+, at a cost of one ATP, needed for the carboxylation of pyruvate (9). For each molecule of acetyl CoA incorporated into FA, one NADPH is
generated by the pentose cycle, and the other by the malate cycle (Fig. 1A). This provides for the reoxida- tion of the NAD+ reduced to NADH by glyceraldehyde- phosphate dehydrogenase during the production of one acetyl CoA from glucose in the Embden-Meyerhof path- way. The reducing equivalent generated by pyruvate dehydrogenase remains available for energy production ; its reoxidation takes place through oxidative phospho- rylation. This situation corresponds roughly to that en- countered in adipose tissue during active lipogenesis, al- though slightly more than half of the NADPH needed for FA synthesis is generated in the pentose cycle (3, 4).
Rat epididymal fat pads have been incubated in vitro under conditions leading to markedly different rates of flow of intermediates through the major metabolic pathways. Fig. 2 shows these flow rates (3, 6, 13-16)
The sequence of reactions from oxaloacetate to malate to pyru- vate to oxaloacetate is catalyzed by malate dehydrogenase, malic enzyme, and pyruvate carboxylase (9). This pathway will be called “malate cycle” because malate can be regarded as the most characteristic intermediate in the cycle, similar to the pentose intermediates in the “pentose cycle.” Since pyruvate is fed into various metabolic pathways, the name “pyruvate cycle” (11) is considered less desirable. The name “malatecitrate cycle” (10) includes the above reactions plus those catalyzed by citrate syn- thase and citrate cleavage enzyme which mediate the transport of acetyl CoA out of the mitochondria. The distinction between malate cycle and malate-citrate cycle appears warranted because the intermediate flows may be different in the malate and the citrate related reactions.
132 JOURNAL OF LIPID RESEARCH VOLUME 11, 1970
by guest, on June 4, 2018w
ww
.jlr.orgD
ownloaded from

ENZYME ACTIVIT IES
8 9 1 j700 4m
.I
0 0 ’F
PATHWAY FLOWS
FIG. 2. Comparison of the activities of different enzymes par- ticipating in lipogenesis and actual flow rates of intermediates through the metabolic pathways involved in converting G to fat in rat adipose tissue. Enzyme activities and intermediate flows are expressed in pmoles/100 mg of adipose tissue per hr. The numbers identify the references from which the data were taken. Circles indicate the activities reported for various enzymes in homogenates of adipose tissue; an arrow between two circles shows the effect of switching the rats from a normal (open circles) to a high carbohydrate diet (solid circles), preceded in some cases by a few days of fasting. The horizontal segments connected by thin lines show the flow of intermediates as determined during in vitro incubations and from pathway estimations performed with adipose tissue under various conditions as indicated by inserts. The vertical segment at left shows the tissue’s ability to increase its Oz consumption upon addition of epinephrine in the presence of glucose.
and data on the activity of certain enzymes in extracts of rat adipose tissue (9, 10, 17-22). The figure allows a comparison of these data with the activity of the various pathways during conversion of glucose to fat, maximally stimulated with insulin (3). One sees that all these path- ways, except the malate cycle, can operate at higher rates. Similarly, measurements of enzyme activities in tissue extracts give values much higher than those needed during the conversion of glucose to fat, except in the cases of acetyl CoA carboxylase (19, 20) and of FA synthetase (20) where special difficulties are encountered in the assay, especially with regard to the optimal acti- vation of acetyl CoA carboxylase (21). The h’ghest activities for pyruvate carboxylase have been measured in extracts from lyophilized tissue preparations (23),
using an assay system containing acetyl CoA at a con- centration (0.75 mM) much higher than would be ex- pected in the cell; also the apparent KA for acetyl CoA appears sensitive to experimental conditions (24).
Similar flows of intermediates through the malate cycle were observed under the following three different conditions of FA synthesis: from glucose (3), from glucose plus acetate (bj , and from pyruvate (13). In the presence of glucose and insulin, the further addition of acetate increased the flows through all the major pathways, except the malate cycle. This cycle contrib- uted also similar amounts of NADPH in the experi- ments with pyruvate where it is essentially the sole source of NADPH for FA synthesis (1 3) ; in the absence of glucose, the pentose cycle is negligible in adipose tissue where glycogen stores are very small (1 4).
T o explain the similarity in the flow through the malate cycle under such different conditions, one must assume that in each case its maximal capacity is reached. Apparently, the malate cycle is the first pathway to reach saturation, probably due to the low activity of pyruvate carboxylase. Reaching this saturation point does not, by itself, limit the conversion of glucose to fat. The process can proceed according to the second scheme shown in Fig. 1, as indicated by the fact that the pentose cycle produces more than half (3, 4), and in the presence of dinitrophenol most (25), of the NADPH necessary for FA synthesis from glucose.
In Fig. lB, the pentose cycle provides all the reducing equivalents for FA synthesis; for each molecule of acetyl CoA produced from glucose and converted to FA, two NADPH are generated in the pentose cycle, and two NADf become loaded with reducing equivalents generated by glyceraldehydephosphate dehydrogenase and pyruvate dehydrogenase. Their reoxidation is es- sential if conversion of glucose to FA is to proceed and must be accomplished through oxidative phosphoryla- tion (3). In Fig. 1B the reducing equivalent generated in the cytoplasm is carried to the mitochondria by malate (25), which readily penetrates into these organelles
We may now compare the number of high energy bonds necessary for FA synthesis from glucose with the number of high energy bonds generated during the process. The calculations presented in Table 1 show the production and utilization of high energy bonds relative to the incorporation of one molecule of acetyl CoA into FA. The values in Table 1 have been computed for the two stoichiometric conditions shown in Fig. 1. Table 1 also shows results of similar calculations for the synthesis of one molecule of tripalmitin with and without the participation of the malate cycle. In the first case, the malate cycle is assumed to produce 1 mole of NADPH per acetyl CoA converted to FA, the remainder being
(26).
FLAW Conversion of Carbohydrate to Fat in Adipose Tissue 133
by guest, on June 4, 2018w
ww
.jlr.orgD
ownloaded from

TABLE 1 ENERGY METABOLISM DURING CONVERSION OF CARBOHYDRATE TO FAT
ATP Reducing Equivalents
Produced Avail. Required by Reoxi-
Gluc-&Fat for Through dation of Used for Oxid. 0 2 Oxid. Excess
Malate Gluc-& Fat Phos- Consump- Generated Phos- Reduc.- Cycle Conditions C 0 2 Fat + C o t Generated Synthesis phoryl. tion Used at S Level phoryl. Equiv. Balance
Thoretical Calculations + Tripalmitin 1 . 4 0 .57 2 . 8 1 . 8 1 .o 0 . 5 4 . 1 2 . 0 2 . 1 3 . 0 0 . 9
synthesis + Fig. 1A 1 . 5 0 . 5 7 3 . 0 2 . 0 1 .o 0 . 5 4 . 0 2 . 0 2 . 0 3 . 0 1 . o - Tripalmitin 1 . 9 0 . 5 0 3 . 8 1 . 8 2 . 0 1 . o 3 . 2 2 . 0 1 . 2 6.0 4 . 8
- Fig. 1B 2 . 0 0 .50 4 . 0 2 . 0 2 . 0 1 . o 3 . 0 2 . 0 1 .o 6 . 0 5 . 0
Calculations Based on Experimental Data
synthesis
Observed 1 .56 0.56 3 . 2 1 . 9 1 . 3 0 .44* 4 . 3 2 . 2 2 . 1 3 . 9 1.8
The numbers, referring to the foremost transformations taking place during fat synthesis from glucose, are expressed in terms of moles for 1 m o l e of acetyl CoA incorporated into FA after being produced from glucose. Production and utilization of ATP, NADH, and NADPH implies production and utilization of the high energy bond or of the reducing equivalents carried by these coenzymes.
To synthesize 1 m o l e of tripalmitin, 14.1 pmoles of glucose are needed when the Mal. Cy. participates in the generation of NADPH (first line in Table) by using all the reducing equivalents produced by glyceraldehyde-P dehydrogenase, except the one required for the synthesis of glycerol-P. Thus, of the 42 reducing equivalents needed for FA synthesis, 23 are derived from NADH, and the other 19 are produced in the Pent. Cy. (determining an inflow of 9.5 pmoles of G-6-P into the Pent. Cy.). Without the Mal. Cy. (third line), an inflow into the Pent. Cy. of 21 pmoles of G-6-P is necessary, and 16 pmoles of glucose are required to synthesize 1 m o l e of tripalmitin. NADH is produced in the reactions catalyzed by glyceraldehyde-P dehydrogenase and pyruvate dehydrogenase; it is utilized in the reactions catalyzed by glycerol-P dehydrogenase and malate dehydrogenase and during oxidative phosphorylation. NADPH is produced by malic enzymes, G-6-P dehydrogenase, and 6-P gluconate dehydrogenase, and is used by FA synthetase. One ATP is expended in the reactions catalyzed by hexokinase, phosphofructokinase, citrate cleavage enzyme, pyruvate carboxylase, and acetyl CoA carboxylase, and two ATP are expended for the activation of palmitate to palmityl CoA during triglyceride assembly. One ATP is produced in the reactions cata- lyzed by phosphoglycerate kinase, by pyruvate kinase, and during oxidative phosphorylation with a P: 0 ratio of 3.0. Shown also are the results of similar calculations made on the basis of the schemes given in Fig. 1 with the participation (second line) and without the par- ticipation (fourth line) of the Mal. Cy. The “observed” values are based on the pathway estimation of Flatt and Ball (3), using the dif- ferences between the results obtained for the catabolism of glucose in the presence and absence of insulin.
* During fat synthesis the oxidation of endogenous FA decreases by an amount corresponding to 0.25 moles of COn/acetyl CoA of glucose incorporated into FA. The measured difference of 0.44 rmoles in the consumption of O2 is therefore smaller than the 0.65 pmoles of 0% required to reoxidize the 1.3 pmoles of reducing equivalents made available for oxidative phosphorylation; see text.
produced by the pentose cycle; in the second case, all the NADPH for FA synthesis is generated in the pentose cycle.
Under all the conditions described, more reducing equivalents are generated than are utilized for reducing acetyl CoA to FA. As shown in the pathway estimation of Flatt and Ball (3), the reducing equivalents produced in excess of those required for reductive biosynthesis are reoxidized by oxygen. Fisher and Ball found no un- coupling of oxidative phosphorylation even in adipose tissue of hyperthyroid rats incubated with lipolytic agents (27). Thus, the number of high energy bonds formed can be estimated by the P : O ratio.
Fisher and Ball (27) estimated this ratio in intact adipose tissue by relating consumption of oxygen to reesterification of FFA formed by lipolysis. They ob- tained a value of 2.42, considered to be low. Furtherniore it should be compared with the theoretical P: 0 ratio of 2.85, since under their conditions FA are probably the major substrates used for energy production. It therefore appears reasonable to adopt the theoretical value of 3 for the P : 0 ratio in our calculations.
Adding the high energy bonds formed by oxidative phosphorylation to those produced by phosphorylation at the substrate level gives the total number generated during the conversion of glucose to fat. The number of high energy bonds utilized, primarily by citrate cleavage enzyme, acetyl CoA carboxylase, and pyruvate carboxyl- ase, is also shown in Table 1. Finally, the net number of high energy bonds gained or expended per acetyl CoA produced from glucose and incorporated into FA, is shown in the table’s last column. The crucial feature of these calculations is that in every case the ATP balance is positive. Thus, as previously deduced from the pathway estimation data (3, 5-7), in its over-all efect for the cell, the conversion of glucose to f a t is an energy-generating process! The approximate yield is one high energy bond per molecule of acetyl CoA converted to fat when the malate cycle participates in the conversion, but five in the ab- sence of this cycle. The physiological significance of these yields for the metabolism of adipose cells can be envisioned by recalling that in glycolysis a single high energy bond is gained for each molecule of lactate which is formed from glucose.
134 JOURNAL OF LIPID RESEARCH VOLUME 11, 1970
by guest, on June 4, 2018w
ww
.jlr.orgD
ownloaded from

Table 1 shows that the two schemes presented in Fig. 1 summarize well the energy metabolism during the conversion of glucose to tripalmitin. Because the calcu- lated number of high energy bonds produced in excess during fat synthesis from carbohydrate is necessarily an estimate, the simplified stoichiometries shown in Fig. 1 provide an adequate basis for further discussion. Glyco- gen synthesis and lactate production also occur in adipose tissue but are minor in comparison to fat syn- thesis, at least under normal conditions. Furthermore, their effects on the ATP balance are opposite and tend to partially cancel each other out.
The validity of the calculations developed above can be tested against experimental data on the metabolism of adipose tissue (3). T o obtain data specific for the energy metabolism associated with the conversion of glucose to fat, one may use the differences in glucose catabolism seen with adipose tissue in which this con- version either is taking place intensively or is practically absent. Such a procedure largely eliminates metabolic transformations which are not related to this conversion (5). The flows of intermediates derived from glucose in the “control” tissue (no insulin) have, therefore, been subtracted from those determined in the tissue incubated with insulin (see Fig. 3 of reference 3). The differences obtained provided the basis for the final set of calcula- tions presented in Table 1.
The balance of the reducing equivalents in the ex- periments with insulin showed that 63% of the NADPH required for FA synthesis had been generated in the pentose cycle (3). This indicates that in adipose tissue the situation is intermediate between the two cases illustrated in Fig. 1, although clearly closer to case A than case B. Inspection of Table 1 confirms this.
As calculated from the pathway estimation data on the catabolism of glucose, 2.1 pmoles of ATP must be produced by oxidative phosphorylation per pmole of acetyl CoA converted to FA. This corresponds to an
increase in oxygen consumption of = 0.35
pmoles of 0 2 , agreeing with the observed increase of 0.44 pmoles. The high energy bonds produced in ex- cess during the transformation of glucose to fat amount to 1.8 per molecule of acetyl GOA converted to FA. This is in good agreement with the ATP balance established by Rognstad and Katz (see experiment A of reference 4) for adipose tissue incubated in the presence of glucose and insulin. For 100 pmoles of glucose catabolized, and 293 pg-atoms of glucose-C incorporated into FA, the amount of ATP produced exceeded by 163 the number of pmoles of ATP utilized. From these figures, a y’eld of 1.1 pmoles of ATP per pmole of acetyl CoA can be calculated.
2.1 3.0 X 2
Since FA synthesis in the presence of insulin resulted in the incorporation of 4.45 pg-atoms of glucose-C per 100 mg of tissue per hr (3), some 2.23 X 1.8 = 4.0 pmoles of high energy bonds were generated in the process. From the data of Katz and Rognstad (4) it can be calculated that 2.9 and 2.7 pmoles of high energy bonds were gained per 100 mg of tissue per hr from the metabolism of glucose (experiment A) or glucose plus acetate (experiment B). Thus, net ATP yields on a tissue weight basis were almost identical in the two ex- periments (4) where lipogenesis was fully induced.
The increase in high energy bond production from glucose upon addition of insulin was compensated by a decrease in production of energy by oxidation of endog- enous substrate, primarily FA (3). For each pmole of acetyl CoA generated from glucose and converted to FA, the amount of GO2 evolved from endogenous precursors was reduced by 0.25 pg-atoms. Since the RQ for FA oxidation is approximately 0.7, this is equivalent
0.25 to -- = 0.36 pmoles of 0 2 . The production of high
0.7 energy bonds by oxidation of endogenous FA was, therefore, diminished by 0.36 X 2 X 3.0 = 2.1 pmoles. This figure counterbalances very well with the estimated gain of 1.8 pmoles of ATP for each two-carbon unit of glucose converted to fat.
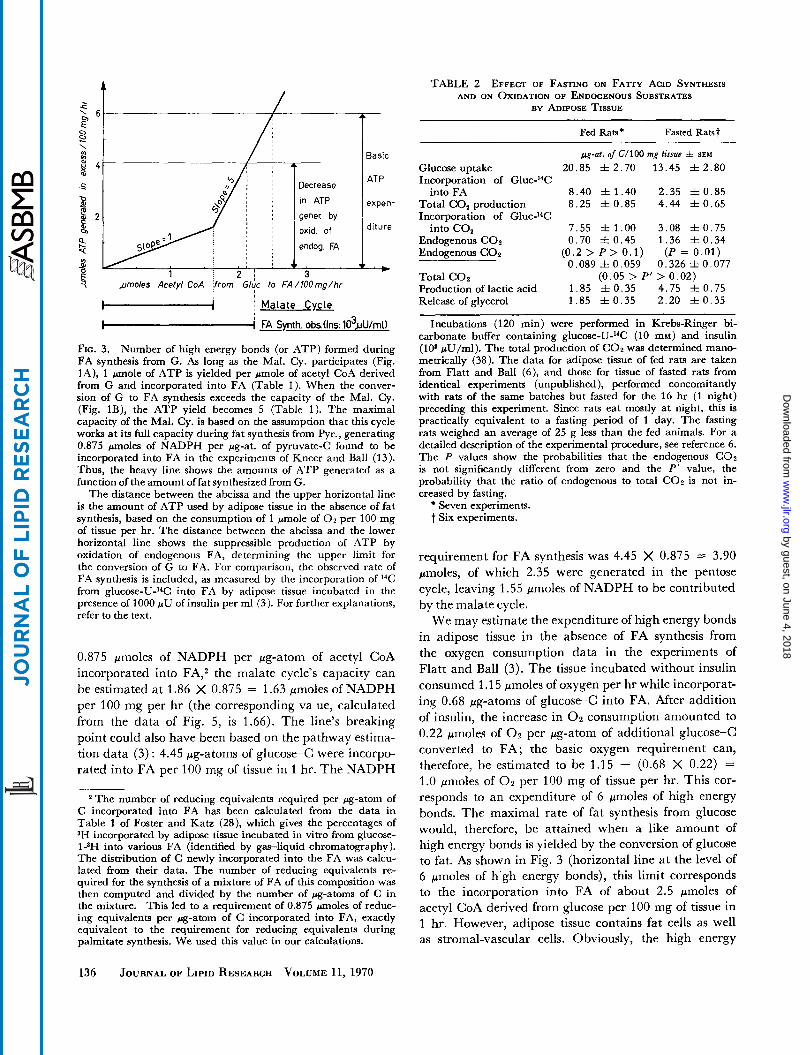
We can now analyze how the metabolism of adipose tissue may be influenced by the energy-yielding nature of this process. In the absence of uncoupling, the process must come to a limit when no more ADP is available for oxidative phosphorylation. T o evaluate the upper limit for the process, the yield in high energy bonds is graphically represented in Fig. 3 as a function of FA synthesis from glucose. The line going through the origin was constructed using a slope of 1.0, the number of high energy bonds generated in excess per acetyl CoA of glucose converted to FA (Table 2) according to scheme A of Fig. 1. In attempting to estimate the upper limit of the process the metabolic situation with the lower ATP yield must be considered first.
As we have seen earlier (Fig. 2), the malate cycle appears to be the first pathway to reach saturation. Once the full capacity of this cycle is reached, conversion can only proceed according to scheme B of Fig. 1; in this case the excess in high energy bond production (Table 1) amounts to 5 pmoles/acetyl CoA converted to FA. In Fig. 3, the line illustrating the ATP yield changes to a slope of 5 at a point determined on the basis of the rate of FA synthesis observed with pyruvate; under these conditions the malate cycle, furnishing all the NADPH for the synthesis, can be expected to operate at its full capacity (Fig. 2). Kneer and Ball (13) observed for 100 mg of tissue an incorporation of 1.86 pg-atoms of pyruvate-(= into FA per hr. Assuming a requirement of
FLATT Conversion of Carbohydrate to Fat in Adipose Tissue 135
by guest, on June 4, 2018w
ww
.jlr.orgD
ownloaded from
/
.E D
A
Basic
ATP
expen-
diture
v .
FIG. 3. Number of high energy bonds (or ATP) formed during FA synthesis from G. As long as the Mal. Cy. participates (Fig. lA), 1 m o l e of ATP is yielded per pmole of acetyl CoA derived from G and incorporated into FA (Table 1). When the conver- sion of G to FA synthesis exceeds the capacity of the Mal. Cy. (Fig. lB), the ATP yield becomes 5 (Table 1). The maximal capacity of the Mal. Cy. is based on the assumption that this cycle works at its full capacity during fat synthesis from Pyr., generating 0.875 pmoles of NADPH per fig-at. of pyruvate-<: found to be incorporated into FA in the experiments of Kneer and Ball (13). Thus, the heavy line shows the amounts of ATP generated as a function of the amount offat synthesized from G.
The distance between the abcissa and the upper horizontal line is the amount of ATP used by adipose tissue in the absence of fat synthesis, based on the consumption of 1 "ole of 0 2 per 100 mg of tissue per hr. The distance between the abcissa and the lower horizontal line shows the suppressible production of ATP by oxidation of endogenous FA, determining the upper limit for the conversion of G to FA. For comparison, the observed rate of FA synthesis is included, as measured by the incorporation of 14C from gluco~e-U-~~C into FA by adipose tissue incubated in the presence of 1000 p U of insulin per ml (3). For further explanations, refer to the text.
0.875 pmoles of NADPH per pg-atom of acetyl CoA incorporated into FA,2 the malate cycle's capacity can be estimated at 1.86 X 0.875 = 1.63 pmoles of NADPH per 100 mg per hr (the corresponding va ue, calculated from the data of Fig. 5, is 1.66). The line's breaking point could also have been based on the pathway estima- tion data (3) : 4.45 pg-atoms of glucose-C were incorpo- rated into FA per 100 mg of tissue in 1 hr. The NADPH
The number of reducing equivalents required per pg-atom of C incorporated into FA has been calculated from the data in Table 1 of Foster and Katz (28), which gives the percentages of 3H incorporated by adipose tissue incubated in vitro from glucose- 1 -3H into various FA (identified by gas-liquid chromatography). The distribution of C newly incorporated into the FA was calcu- lated from their data. The number of reducing equivalents re- quired for the synthesis of a mixture of FA of this composition was then computed and divided by the number of pg-atoms of C in the mixture. This led to a requirement of 0.875 moles of reduc- ing equivalents per rg-atom of C incorporated into FA, exactly equivalent to the requirement for reducing equivalents during palmitate synthesis. We used this value in our calculations.
TABLE 2 EFFECT OF FASTING ON FATTY ACID SYNTHESIS AND ON OXIDATION OF ENDOGENOUS SUBSTRATES
BY ADIPOSE TISSUE
Fed Rats" Fasted Ratst
pg-at. of C/100 mg tissue f SEM
Glucose uptake 20.85 f 2 . 7 0 13.45 5 2 . 8 0 Incorporation of Gluc-14C
into FA 8.40 f 1 . 4 0 2.35 f 0 . 8 5 Total COz production 8.25 f 0 . 8 5 4.44 f 0 . 6 5 Incorporation of Gluc-14C
7.55 f l . O O 3.08 & 0 . 7 5 Endogenous COZ 0.70 f 0 . 4 5 1.36 f 0 . 3 4
into CO,
Endogenous COZ (0.2 > P > 0.1) (P = 0.01) 0.089 f 0 . 0 5 9 0 . 3 2 6 f 0 . 0 7 7
(0.05 > P' > 0.02) Total COZ Production of lactic acid 1.85 f 0 . 3 5 4.75 f 0 . 7 5 Release of glycerol 1.85 f 0 . 3 5 2.20 f 0 . 3 5
Incubations (120 min) were performed in Krebs-Ringer bi- carbonate buffer containing glucose-U-14C (10 mM) and insulin (10' pU/ml). The total production of COZ was determined mano- metrically (38). The data for adipose tissue of fed rats are taken from Flatt and Ball (6), and those for tissue of fasted rats from identical experiments (unpublished), performed concomitantly with rats of the same batches but fasted for the 16 hr (1 night) preceding this experiment. Since rats eat mostly a t night, this is practically equivalent to a fasting period of 1 day. The fasting rats weighed an average of 25 g less than the fed animals. For a detailed description of the experimental procedure, see reference 6. The P values show the probabilities that the endogenous COz is not significantly different from zero and the P' value, the probability that the ratio of endogenous to total COZ is not in- creased by fasting.
" Seven experiments. t Six experiments.
requirement for FA synthesis was 4.45 X 0.875 = 3.90 pmoles, of which 2.35 were generated in the pentose cycle, leaving 1.55 pmoles of NADPH to be contributed by the malate cycle.
We may estimate the expenditure of high energy bonds in adipose tissue in the absence of FA synthesis from the oxygen consumption data in the experiments of Flatt and Ball (3). The tissue incubated without insulin consumed 1.15 pmoles of oxygen per hr while incorporat- ing 0.68 pg-atoms of glucose-C into FA. After addition of insulin, the increase in 0 2 consumption amounted to 0.22 pmoles of O2 per pg-atom of additional glucose-C converted to FA; the basic oxygen requirement can, therefore, be estimated to be 1.15 - (0.68 X 0.22) = 1.0 pnioles of 0 2 per 100 mg of tissue per hr. This cor- responds to an expenditure of 6 pmoles of high energy bonds. The maximal rate of fat synthesis from glucose would, therefore, be attained when a like amount of high energy bonds is yielded by the conversion of glucose to fat. As shown in Fig. 3 (horizontal line at the level of 6 pmoles of h'gh energy bonds), this limit corresponds to the incorporation into FA of about 2.5 pmoles of acetyl CoA derived from glucose per 100 mg of tissue in 1 hr. However, adipose tissue contains fat cells as well as stromal-vascular cells. Obviously, the high energy
136 JOURNAL OF LIPID RESEARCH VOLUME 11, 1970
by guest, on June 4, 2018w
ww
.jlr.orgD
ownloaded from

bonds generated during fat synthesis from glucose within adipose cells cannot serve to cover the energy require- ment in the stromal-vascular cells. The limit in conver- sion of glucose to fat must, therefore, be less than 2.5 pmoles of acetyl CoA.
When intensive fat synthesis from glucose is elicited by addition of insulin, there is a reduction in the COZ produced from endogenous FA (3). The observed de- crease of 0.48 pmoles of COz per 100 mg of adipose tissue
per hr corresponds to a consumption of -- = 0.68
pmoles of 02, with a concomitant production of 0.68 X 2 X 3.0 = 4.1 pmoles of high energy bonds; this latter amount is equivalent to two-thirds of the tissue’s oxygen consumption in the absence of fat synthesis. Since Rodbell (29) found that about half of the adipose tissue protein content is associated with adipocytes, the above figure probably corresponds to the energy expenditure in the fat cells themselves. Thus, in the fat cells the decrease in oxidation of endogenous FA must be much more complete than is reflected by data on the 0 2 consumption of whole adipose tissue with its mixed cell population. Evidently, at maximal stimulation by insulin, almost all the energy for maintaining the bas’c metabolic activities in the adipocytes is provided by the conversion of glucose to fat.
In the present analysis, the above value of 4.1 pmoles for the utilization of high energy bonds in 100 mg of adipose tissue per hr appears most appropriate for estimating the upper limit in conversion of glucose to fat. As shown by Fig. 3 (horizontal line at the 4.1 level), the highest possible rate now corresponds to the in- corporation into FA of 2.1 pmoles of acetyl CoA (de- rived from glucose) per 100 mg of tissue in l hr. A similar evaluation, using a P : O ratio of 2.42 (27) in- stead of 3.0, leads to an estimated maximal rate of 2.3. Our approach is, therefore, not dependent on an ac- curate knowledge of the actual P :O ratio. The close agreement of these values with that of 2.2 measured ex- perimentally by Flatt and Ball (3) leads to an important conclusion: conversion of glucose to f a t in adipose tissue is limited by the tissue’s ability to use the high energy bonds pro- duced in excess during this process. This conclusion is con- sistent with the evidence (Fig. 2) indicating that no pathway or enzyme supplying the precursors or the co- factors for FA synthesis from glucose reaches its point of saturation during this conversion.
When acetate is provided in addition to glucose and insulin, the rates of FA synthesis exceed those en- countered during conversion of glucose alone to fat (4, 6, 15, 30). This shows that acetyl CoA carboxylase does not control the conversion of glucose to fat, since the supply of acetyl CoA becomes limiting before the enzyme is saturated (6, 15). Quantitative pathway
0.48 0.7
estimations show that the availability of acetate leads to a 6040% increase in the flow of intermediates through the pentose cycle (4,6). Thus, this cycle operates far below its maximal capacity when glucose is the sole substrate available for fat synthesis. The cycle’s activity must be closely related to the amounts of NADP+ made available by removal of reducing equivalents from NADPH; Katz and Kognstad demonstrated (31) that this removal occurs exclusively through FA synthesis. However, the malate cycle also requires NADPf. The fact that the malate cycle apparently reaches its full capacity long before the pentose cycle does, implies that the malate cycle must be strongly favored in the compe- tition for NADP+. The experiments reported in Fig. 4 were performed to explore this aspect. The results indicate that malic enzyme has the highest activity and the best affinityfor NADP+. Thus, malic enzyme appears easily able to secure a large enough share of the NADP+ to account for the malate cycle’s rate of operation.
l/V
1500 f
- c/s
100 200 300 1 0. D.
.loo / I \
FIG. 4. Lineweaver-Burke plot relative to NADP for 3 NADP- linked dehydrogenases of rat adipose tissue. Three cuvettes were prepared to contain in a total volume of 2.3 ml: triethanolamine. HCI (pH 7.5; 112 moles), MgClz (17 pmoles), EDTA (4.4 pmoles), adipose tissue homogenate (supernatant 100,000 g X 30 min) equivalent to 4.8 mg of adipose tissue, and either Na malate (11 pmoles), Na 6-P-gluconate (4.4 moles), or Na 6-P- gluconate (4.4 pmoles) plus Na G-6-P (2.2 moles).
Reactions were initiated by the addition of 3.6 moles of NADP+ and changes in the optical density were recorded at 340 nm in a Gilford recording spectrophotometer (total deflection, 0.1 OD; chart speed, 2 in/min). The slopes of tangents fitted to points on the curves provided estimates of the reaction velocities a t different concentrations of NADP+. The NADP+ concentrations were de- termined from the increases in optical density which took place from these points until the reaction had gone to completion. The reaction velocities applicable to G-6-P dehydrogenase were obtained by subtracting the slope obtained with 6-P-gluconate from that obtained with G-6-P plus 6-P-gluconate, at equal concentrations of NADP+. The points are averages of two experi- ments performed under identical conditions. In the case of the malic enzyme, the intersection with the horizontal axis was pre- viously determined on an auxiliary graph with a vertical scale expanded 10 times.
- -LO -21 -22
FLATT Conversion of Carbohydrate to Fat in Adipose Tissue 137
by guest, on June 4, 2018w
ww
.jlr.orgD
ownloaded from

IMPAIRMENT O F LIPOGENESIS IN T H E FASTING STATE
Fasting leads to a marked impairment of lipogenesis, and even in the presence of large amounts of insulin (15, 32) the conversion of glucose to fat in adipose tissue cannot be restored to normal values. The results of numerous investigations have been interpreted to indicate that the reaction catalyzed by acetyl CoA carboxylase is probably the rate-limiting step in FA synthesis (33, 34). However, DelBoca and Flatt (15) recently showed that in adipose tissue of fed or fasting rats fat synthesis is greater in the presence of glucose and acetate than in the presence of glucose alone, at insulin concentrations of 60, 120, and IO4 pU/ml. These findings also support the view that FA synthesis in intact adipose tissue is limited by the tissue’s ability to form acetyl CoA from glucose (6, 15). Furthermore, the effects of acetate are greater in adipose tissue of fasting rats; the impairment of lipogenesis dur- ing fasting appears, therefore, to be due primarily to a reduced ability to produce acetyl CoA from glucose (15).
The realization that the conversion of glucose to fat is an energy-yielding process may prove particularly useful in understanding the reasons for the marked im- pairment in lipogenesis associated with fasting. Examina- tion of Fig. 3 suggests the following two changes which could reduce the ability of adipose tissue to synthesize fat from glucose: (u) a decrease of the malate cycle’s capacity, and ( b ) a reduction in the tissue’s ability to shut down the oxidation of endogenous FA.
The latter possibility is appealing because during fasting a general and extensive increase in the concentra- tion of FFA occurs in most tissues (35). Felber, Zaragoza, Grassi, Moody, and Vannotti (36) observed that add- ing FFA to the incubation medium facilitates fat synthesis from glucose. Their explanation was that the FFA, being taken up by the tissue and esterified, re- quired ATP for their activation and NADH for the synthesis of glycerophosphate ; this would facilitate the degradation of glucose to acetyl CoA and, hence, increase lipogenesis. However, FFA added to the in- cubation medium may have effects quite different from those of FFA already present throughout the cells (30), as in the tissue of fasting animals. In adipose tissue of fasting animals, lipolysis proceeds at an appreciable rate which is not decreased by insulin in the usual man- ner (37). The availability of FFA for oxidation may therefore be markedly greater in adipose tissue from fasting rats.
The experiments described in Table 2 are relevant to this point; they were performed in a Warburg ap- paratus under conditions permitting measurement of the total GOz production (38). Adipose tissue obtained from rats fed ad lib. or fasted for 16 hr was incubated in the presence of glucose and insulin (1000 pU/ml). The
considerable reduction of FA synthesis from glucose strikingly illustrates the effect of fasting. The data are especially pertinent because they show that the oxidation of endogenous substrate is 1.36 pmoles/2 hr per 100 mg of tissue taken from fasting rats, a value nearly twice the 0.70 pmoles produced by the tissue of fed rats. The production of endogenous COz was de- termined by subtracting the pmoles of 14C02 produced from glucose. UJ4C from the total COa production measured marlometrically (itself the difference between the initial and final COn + HCOs- content of the ves- sel) ; thus, the experimental variations affecting these results were relatively large, and the amounts of endog- enous COZ produced were not statistically different. One may note that with tissue from fasting rats the total COZ production was significantly larger than the 14C02 produced from glucose-U-I4C. This was not the case with fed rats (Table 2). Moreover, the ratio of endoge- nous to total COz is higher in the tissues obtained from fasting animals. The results of Table 2 thus support the idea that oxidation of endogenous FA in adipose tissue is not suppressed as efficiently in fasting rats as in fed rats, during fat synthesis from glucose.
The lack of curtailment of endogenous FA oxidation may reflect the tissue’s inability to increase sufficiently the conversion of glucose to fat to provide adequate amounts of high energy bonds. Alternatively, the in- ability to shut off endogenous FA oxidation may prevent lipogenesis from reaching a normal rate. Supporting the second explanation is the fact that when adipose tissue from fasted rats is incubated with glucose, the addition of insulin to the medium causes an abnormally large increase in the 1actate:pyruvate ratio (15). This reflects a marked increase in the cytoplasmic NADH : NAD+ ratio (39) and indicates that under these con- ditions more reducing equivalents tend to be generated than can be utilized.
Herrera, Philipps, and Renold (32) have observed that a prolonged in vitro incubation (4.5-24 hr) of adipose tissue obtained from rats fasted for 96 hr could largely restore the tissue’s ability to convert glucose to fat, but only under conditions tending to decrease lipolysis (40). In the framework of our discussion, the prolonged incubation may be considered to have depleted the endogenous FFA present in the tissue. As a result, the conversion of glucose to fat would be less hindered by the production of energy through oxidation of pre- formed FA.
The ability of adipose tissue to synthesize fat from pyruvate also decreases during fasting (41, 42; Fig. 5 ) . Unlike the situation with glucose, the conversion of pyruvate to fat obviously will not force the generation of an excess of high energy bonds. Thus, a limiting factor other than that found in the case of glucose must
138 JOURNAL OF LIPID RESEARCH VOLUME 11. 1970
by guest, on June 4, 2018w
ww
.jlr.orgD
ownloaded from

be considered. Lack of reducing equivalents in the cyto- plasm cannot be the cause of this decrease in FA syn- thesis since the proportion of pyruvate converted to lactate increases markedly during fasting (42). This attests to the tissue’s ability to supply the cytoplasm with reducing equivalents generated in the mitochondria. DelBoca and Flatt (15) reported that, in the presence of lo4 pU of insulin per ml, acetyl CoA from glucose was incorporated into FA at rates of 2.89 f 0.33 and 1.32 f 0.09 pmoles/hr per 100 mg of tissue taken from fed and 48-hr-fasted rats, respectively. These rates are ap- proximately three times higher than those shown in Fig. 5 for FA synthesis from pyruvate, obtained under similar conditions. Thus, the enzymes involved in the transfer of acetyl CoA to the cytoplasm and in the syn- thesis of FA from acetyl CoA are not challenged max - mally during FA synthesis from pyruvate. These consider- ations suggest that fasting causes a decrease in the ability of the malate cycle to furnish NADPH for FA synthesis. When plotted on a semilogarithmic scale (Fig. 5), the synthesis of FA from pyruvate appears to decrease al- most exponentially during the first days of fasting. An exponential decrease in a metabolic function could be explained by the degradation of a rate-limiting enzyme,
i? E e O 5 I 9 O 3 I
Q 2 t , I
0 24 48 72 Fasting Period ( h r )
FIG. 5. Effect of fasting on FA synthesis from pyruvate in adipose tissue. Each point represents the average of from six to eight ex- periments; the brackets show the standard errors of the mean. The data are expressed as pmoles of acetyl CoA from pyruvate incorporated into FA in 1 hr per 100 mg of wet weight (0) or per mg of N (e).
Epididymal fat pads of rats fed ad lib. and receiving G in their drinking water, or fasted during the 24, 48, or 72 hr preceding the experiments, were incubated for 150 min in Krebs-Ringer bi- carbonate buffer containing 15 mM pyruvate-2,3-14C. Small un- incubated pieces of the same fat pads were used for nitrogen de- termination by a micro-Kjeldahl procedure. The experimental animals and the procedures were similar to those described in reference 15.
in this case possibly pyruvate carboxylase, the least active of the three enzymes of the malate cycle (Fig. 2).
A decrease in the rate of operation of the malate cycle will shift the breaking point in Fig. 3 to the left. Con- sequently the overproduction of high energy bonds during conversion of glucose to fat will more rapidly satisfy the ATP requirement of the adipose cells, thus reducing their maximal capacity to convert glucose to fat.
These and some other changes caused by fasting which affect the energy metabolism ’n adipose tissue are illustrated in Fig. 6. The point where the slope of the ATP yield changes from 1 to 5 pmolej/pmole of acetyl CoA (from glucose) converted to FA is displaced to the left. From the experiments described in Fig. 5, one would expect this displacement to become more accentuated as the fasting period extends. In addition, the number of high energy bonds which can be absorbed by the basic metabolism of the fat cells is lower. This is due primarily to the greater rate of oxidation of endogenous substrate, while the effects related to changes in glycerol and lactate releases are of lesser importance and partially cancel each other out. No direct experimental data are available to show whether this second type of inter- ference with the conversion of glucose to fat assumes more importance when the fasting period becomes longer.
Jungas and Ball (43) observed that 3 days of fas ing lead to a 40% reduction in the 0 2 consumption of rat adipose tissue, incubated in vitro in the absence of glucose and insulin. However, it can be calculated from their data on glycerol and FFA formation that this reduction is almost entirely due to the reesterification of FFA. This process takes place at an appreciable rate in the tissues of the fed rats (presumably at the expense of glycogen stores), but it is practically absent in the tissues of the fasted rats. Thus, fasting does not affect the basic energy expenditure enough to significantly in- fluence our calculations.
Fig. 6 also serves to predict the rate of FA synthesis in tissue of fasted rats incubated with a high dose of insulin. In view of the number of different data em- ployed in this evaluation, the agreement between “pre- dicted” and “observed” rates of FA synthesis in the tissue of the fasting animals is reasonably close. Thus, Fig. 6 demonstrates that the alterations caused by fast- ing, when their combined effects on the energy nietabol- ism of adipose tissue are considered, provide an explana- tion for the decrease in the lipogenic capacity of adipose tissue during the early stages of fasting.
DISCUSSION
If conversion of glucose to fat is limited by the produc- tion of ATP, it should be possible to enhance this con-
FLATT Conversion of Carbohydrate to Fat in Adipose Tissue 139
by guest, on June 4, 2018w
ww
.jlr.orgD
ownloaded from

Amount of excess ATP which can be utilized I n EFFECTS OF I
~ m l e s Acetyl C{ from Gluc to FA / 100:mg/hr
I
I-{ G G i , n X T 4 p j G i )
I I I 1 Malate Cycle C I
I I
k-1 FA Synth. obs.
FIG. 6. Effect of a fasting period of 48 hr on the maximal possible rate of G conversion to fat. The figure is constructed on the same principle as Fig. 3, using the data of Fig. 5 to calculate the maxi- mal capacities of the Mal. Cy. The amount of ATP produced during fat synthesis from G is obtained from the solid line which shows ATP production as a function of the rate of FA synthesis from gluco~e-U-~~C in the presence of lo4 pU/ml of Ins. in adipose tissue of rats fed a high carbohydrate diet (15). It corresponds also to the amount of ATP which can be utilized in the tissue for sus- taining its basic energy expenditure.
The changes caused by a 48-hr fasting period (shown by arrows in the figure) were evaluated in the following manner. ( a ) The ability to curtail the oxidation of endogenous FA during fat syn- thesis was found to be decreased by 0.33 pmoles of C o t per 100 mg per hr in adipose tissue of rats fasted for 1 day (Table 2). In the absence of other data, we will use the above value to esti- mate the reduction in the amount of ATP which can be utilized
in tissue of rats fasted for 2 days: - X 2 X 2.85 = 2.7 pmoles/
100 mg per hr (where 0.7 is the RQ for F,4 oxidation, 2 is the number of reducing equivalents oxidized per pmole of 0 2 con- sumed, and 2.85 is the theoretical P:O ratio for palmitate oxida- tion [27]). (6) The increase of 0.5 Mmoles/100 mg per hr in the production of lactic acid (15), and hence of ATP, was considered to reduce the utilizable ATP by a like amount. ( c ) The increase of 0.1 woles/100 mg per hr in the release of glycerol (15) re- flects a greater ATP expenditure for reesterification (7 pmoles of ATP per 1 pmole of glycerol [27]), considered to augment the utilizable ATP by 0.7 pmoles/100 mg per hr.
The estimated amount of ATP (genrrated by conversion of G to fat) which adipose tissue of rats fasted for 48 hr is able to utilize, is shown by a horizontal line. Its intersection with the broken line, which shows the ATP production as a function of FA synthesis in tissue of fasting rats, determines the maximal pre- dicted rate of G conversion to fat. The rate observed experi- mentally, in the presence of lo4 pU/ml of Ins. (15), is shown for comparison.
0.33 0.7
version with uncoupling agents. However, these would have to be added in concentrations sufficiently low to leave ATP available in amounts adequate to drive the various reactions requiring high energy bonds. Since
uncoupling agents are lipophilic substances and since adipose tissue contains so much lipid, favorable con- centrations may not readily be achieved (25). I t is, therefore, not surprising that in experiments with dinitrophenol only decreases in the conversion of glucose to fat were observed (25).
Adipose tissue has a tendency to reesterify the FFA formed by lipolysis. Thus epinephrine, by stimulating lipolysis (44) and hence reesterification at a considerable expense of ATP (16, 27), has an effect which may be compared to that of an uncoupling agent in the con- text of this discussion. When epinephrine is added a t concentrations sufficient to elicit considerable lipolysis and high rates of ATP expenditure for reesterification, there is a marked decrease in fat synthesis (2). However, with only 0.2 bg of epinephrine per ml of incubation medium an increase in glucose conversion to fat has been observed (3) which can be predicted quantitatively from the changes in energy metabolism caused by epinephrine (see below and Fig. 7).
Using acetate as a substrate, adipose tissue may either gain or expend high energy bonds, depending on the relative proportions of acetate oxidized to COz or converted to FA. Thus, experiments (6, 15) on the effects of acetate on the conversion of glucose to fat pro- vide yet another test of our analysis. Assuming that the conversion of glucose to FA is limited by the tissue’s ability to use the generated ATP, an increased expendi- ture of 1 pmole of ATP (from utilization of acetate or through FFA reesterification triggered by epinephrine) should permit an extra 0.2 pnoles of acetyl CoA (de- rived from glucose) to be converted to FA. The changes in the rate of glucose conversion to FA due to acetate utilization or to epinephrine addition were calculated on this basis. The ratios of “predicted change” :“ob- served change” in the incorporation of glucose-C into FA are shown as a function of the rate of glucose con- version to FA in the absence of acetate (Fig. 7). A ratio of 1.0 will be obtained if the prediction is perfect. As show-n in Fig. 7 , the predictions are completely wrong at low rates of conversion of glucose to FA; this is, of course, expected since under these conditions the con- version of glucose to fat generates insignificant amounts of ATP.
With the highest rate of FA synthesis encountered in these experiments, the incorporation of glucose-C into FA was depressed by the presence of acetate, although an increase was predicted. Thus, in the experiments with glucose plus acetate (but without implying the same for the experiments with glucose alone) some factor other than ATP utilization must have been limiting. Since FA synthesis from glucose plus acetate was 20% higher than that with glucose alone, the pathway from acetyl CoA to FA was still not saturated in the absence of
140 JOURNAL OF LIPID RESEARCH VOLUME 11, 1970
by guest, on June 4, 2018w
ww
.jlr.orgD
ownloaded from

a 1 ---------
7 0 Fed
Nmoles Acetyl CoA from Gluc
a
FIG. 7. Effects of acetate or epinephrine on energy balance and on the conversion of G to FA. The figure is constructed from pub- lished data (3, 6, 15) . “Predicted effects” were calculated on the assumption that the conversion of glucose-C to FA is increased by 0.2 pmoles of acetyl-coA per pmole increase in the demand for ATP resulting from the presence of acetate (1 5 mM) or epinephrine (0.2 w/ml) in the incubation medium, in addition to G (10 mM). Solid and open symbols apply, respectively, to experiments per- formed with fed or 48-hr-fasted rats; the concentrations of insulin (pU/ml) are shown by small numbers. ( a ) Circles. The effect of acetate utilization on the ATP balance was computed from the data of DelBoca and Flatt (15 ) and Flatt and Ball (6). 4-10 ATP per molecule of acetate oxidized to COz; -3 ATP per molecule of acetate converted to FA. Allowance was made for the changes caused by acetate in the production of glycerol and lactate, con- sidering that the release of 1 m o l e of glycerol indicates an ex- penditure of 7 pmoles of ATP for FFA reesterification, and that 1 pmole of ATP is gained per pmole of lactate formed from G. (b) Triangle. The changes in pathway flow due to the addition of epinephrine in the experiments of Flatt and Ball (3) were calcu- lated (flow of intermediates with Ins. and epinephrine minus flow of intermediates with Ins.). From these values there was de- ducted the flow of intermediates due to the increase in FA syn- thesis, assuming the required NADPH to be generated in the Pent. Cy. The values so obtained served to evaluate (in the man- ner described in Table 1) the effect of epinephrine on the ATP balance. A P:O ratio of 3 was employed to convert reducing equivalents to high energy bonds.
acetate. The decrease in glucose-C conversion to FA in the presence of acetate may be related to the greatly in- creased demand for NADPH generation through the pentose cycle (4, 6). A limitation could arise in the pentose cycle or in the supply of glucose-6-phosphate, or else by saturation of the FA synthesizing pathway.
But Fig. 7 shows also that for high synthesis rates from glucose (except for the extreme case just con- sidered) the action of acetate is well explained by its effects on the energy balance.
Consideration should be given here to two alternative mechanisms which may be considered important in de- termining the upper limit for the conversion of glucose to fat. Firstly, Schmidt and Katz (45) have suggested that the a-glycerophosphate shuttle (46) does not operate in adipose tissue for the transfer of reducing equivalents
from the cytoplasm to the mitochondria. When the malate cycle becomes saturated, inability to reoxidize NADH formed by glyceraldehyde-phosphate dehydro- genase could prevent further formation of acetyl CoA from glucose. Secondly, it may be envisioned that the transfer of acetyl CoA via citrate from the mitochondria to the cytoplasm, and hence FA synthesis, is limited by the production of oxaloacetate by pyruvate carboxylase. These two mechanisms would be compatible with the increase in total FA synthesis observed upon supplying acetate in addition to glucose without change in the malate cycle flow, since acetate may be activated to acetyl CoA in the cytoplasm. They fail, however, to account for the increase in glucose-C incorporation into FA elucidated by acetate or epinephrine (Fig. 7 ; 4, 6, 15).
The discussion so far has dealt only with the maximal rate of fat synthesis from glucose, as observed in the presence of insulin concentrations above the physiological range. The proportion of glucose-C incorporated into FA in the presence of physiological concentrations of insulin (1 5) decreases in fasting tissue, largely because of an increased conversicn of pyruvate to lactate (Fig. 8). An increase in the proportion of pyruvate diverted to lactate is particularly important when the uptake of glucose is st mulated only to a limited extent by insulin. The 1actate:pyruvate ratios reflect an abnormal rise in the NAH:NAD+ ratio (35) in tissue of fasting rats when the production of reducing equivalents, through conversion of glucose to fat, is initiated by addition of insulin in vitro (15). This ratio can be lowered, par- ticularly in tissue obtained from fasting rats, by provid- ing acetate in addition to glucose in the incubation medium (1 5). This promptly reduces the proportion of pyruvate diverted to lactate and improves the conversion of glucose to FA (Fig. 8). In the fasting state, due to the presence of large amounts of FFA, the production of re- ducing equivalents tends to be excessive, as shown by a trend toward high NADH : NAD+ ratios throughout the organism (35). At the level of adipose tissue, this trend can be viewed as creating an obstacle to the conversion of glucose to fat, since this conversion is an energy- yielding process. Thus, free fatty acids may control the con- version of glucose to f a t in adipose tissue by virtue of their being excellent substrates for energy production rather than by in- hibiting spec@ enzymes. During fasting periods, the con- version of carbohydrate to fat must be minimized even though insulin release cannot be completely suppressed if mobilization of depot fat by lipolysis is to remain under control. Insulin controls the rate of FFA mobiliza- tion, not only by directly affecting the amount of cyclic AMP which activates the lipases (44, 47), but also by allowing the uptake of some glucose to produce glycero- phosphate for reesterification of FFA (2, 48).
FLATT Conversion of Carbohydrate to Fat in Adipose Tissue 141
by guest, on June 4, 2018w
ww
.jlr.orgD
ownloaded from

15
k 10 a . 0 a J
I
5
L 1 t . E“ 0 0
7 0.5 L 0
J
v) - E“ 3
A) Fasted Fed Rats / ’ \$(lo41
. 2 3
1 2 3
ymoles Acetyl CoA from Glucose to FA/100 mglhr
FIG. 8. Effect of fasting and of acetate on the relative rates of lactate and FA synthesis from G. The figure was constructed from data of DelBwa and Flatt (15) with rat adipose tissue incubated in vitro in Krebs-Ringer bicarbonate buffer. The experiments were performed with tissue from rats fed ad lib. (0, A) and from rats fasted for 48 hr (0, A), either with glucose (10 m M ) (0, 0) or with glucose plus sodium acetate (15 mM) (A, A). In each group of four paired incubations the concentrations of insulin were 0,60,120, and lo4 pU/ml.
The diagonal grid aids in showing the approximate number of pmoles of Pyr. formed from G, since in adipose tissue only very small amounts of glucose-C are oxidized to COt in the citric acid cycle (3, 4). The radial lines assist in evaluating the percentage of pyruvate diverted to lactate.
However, while the uptake of glucose by adipose tissue is controlled largely by the concentration of in- sulin, the proportion of glucose-C incorporated into FA depends on the metabolic situation. In the presence of the high NADH: NAD+ ratios which are characteristic of the fasting state (35), significant proportions of glucose are channeled into lactate (15). The latter is released by adipose tissue and can be reconverted to glucose in the liver.
Finally, it may be emphasized that the type of regula- tion discussed here is apparent only in intact cell prepara- tions. This provides an explanation for the lack of cor- relation frequently observed between the activities of specific enzymes in tissue extracts and the actual rate of de nouo lipogenesis (30, 49). Denton and Halperin (30) could not explain the control of lipogenesis in adipose tissue on the basis of changes in the concentrations of glycerol-3-phosphate, citrate, acetyl CoA, or long-chain fatty acyl CoA, the four intermediates most commonly considered important as activators or inhibitors in the control of FA synthesis. They concluded that “the con- trol of FA synthesis appears to reside in additional or alternative factors” (30). I submit that the obligatory generation of ATP which is associated with the con-
version of glucose to fat provides one or perhaps the miss- ing regulatory factor(s). Changes in the metabolic con- dition, rather than depression or inhibition of enzymes directly involved in FA synthesis, appear to be the pri- mary cause for the impairment of lipogenesis in adipose tissue during the early stages of fasting.
The author wishes to express his great appreciation to Dr. Robert L. Jungas for his assistance in the preparation of the manuscript and for a number of very valuable suggestions.
This work was supported by Grant AM 11958 of the National Institutes of Health. Manuscript received 76 July 7969; accepted 78 December 7969.
REFERENCES
1. Favarger, P. 1965. Adipose Tissue. In Handbook of Physi- ology. A. E. Renold and G. F. Cahill, Jr., editors. The American Physical Society, Washington, D. C. 19-23.
2. Jeanrenaud, B. 1968. Ergeb. Physiol. Biol. Chem. Exp. Pharmakol. 60: 57.
3. Flatt, J. P., and E. G. Ball. 1964. J . Biol. Chem. 239: 675. 4. Rognstad, R., and J. Katz. 1966. Proc. Nat. Acad. Sci.
5. Ball, E. G. 1965. Ann. N . Y . Acad. Sci. 131: 225. 6. Flatt, J. P., and E. G. Ball. 1966. J . Biol. Chem. 241: 2862. 7. Ball, E. G. 1966. Advan. Enzyme Regul. 4: 3. 8. Spencer, A. F., and J. M. Lowenstein. 1962. J. Biol. Chem.
9. Wise, E. M., Jr., and E. G. Ball. 1964. Proc. Nat. Acad. Sci.
10. Kornacker, M. S., and E. G. Ball. 1965. Proc. Nat. Acad.
11. Rognstad, R., and J. Katz. 1968. Arch. Biochem. Biophys.
12. Rognstad, R. 1969. Arch. Biochem. Biophys. 129: 13. 13. Kneer, P., and E. G. Ball. 1968. J . Biol. Chem. 243: 2863. 14. Frerichs, H., and E. G. Ball. 1962. Biochemistry. 1: 501. 15. DelBoca, J., and J. P. Flatt. 1969. Eur. J . Biochem. 11:
16. Jungas, R. L., and E. G. Ball. 1963. Biochemistry. 2: 383. 17. Ball, E. G., and R. L. Jungas. 1963. Biochemistry. 2: 586. 18. Leveille, G. A., and R. W. Hanson. 1966. J. Lipid Res. 7:
19. Dakshinamurti, K., and P. R. Desjardins. 1969. Biochim.
20. Chakrabarti, K., and G. A. Leveille. 1969. Proc. SOC. Exp.
21. Chang, H. C., I. Seidman, G. Teebor, and M. D. Lane.
22. Ballard, F. J., and R. W. Hanson. 1967. J . Lipid. Res. 8:
23. Reshef, L., R. W. Hanson, and F. J. Ballard. 1969. J. Biol.
24. Scrutton, M. C., and M. F. Utter. 1968. Annu. Rev. Bio-
25. Rognstad, R., and J. Katz. 1969. Biochem. J . 111: 431. 26. Chappell, J. B. 1968. Brit. Med. Bull. 24: 150. 27. Fisher, J. N., and E. G. Ball. 1967. Biochemistry. 6: 637. 28. Foster, D. W., and J. Katz. 1966. Biochim. Biophys. Acta.
29. Rodbell, M. 1964. J. Biol. Chem. 239: 753.
U.S.A. 55: 1148.
237: 3640.
U.S.A. 52: 1255.
Sci. U.S.A. 54: 899.
127: 437.
127.
46.
Biophys. Acta. 176: 221.
Biol. Med. 131: 1051.
1967. Biochem. Biophys. Res. Commun. 28: 682.
73.
Chem. 244: 1994.
chem. 37: 249.
125: 422.
142 JOURNAL OF LIPID RESEARCH VOLUME 11, 1970
by guest, on June 4, 2018w
ww
.jlr.orgD
ownloaded from

30. Denton, R. M., and M. L. Halperin. 1968. Biochem. J . 110:
31. Katz, J., and R. Rognstad. 1966. J . Biol. Chem. 241: 3600. 32. Herrera, M. G., G. R. Philipps, and A. E. Renold. 1965.
33. Numa, S., W. M. Bortz, and F. Lynen. 1965. Advan.
34. Wieland, 0. 1967. Symp. Deut. Ges. Endokrinol. 12: 138. 35. Krebs, H. A. 1967. Advan. Enzyme Re&. 5: 409. 36. Felber, J. P., N. Zaragoza, L. Grassi, A. J. Moody, and A.
Vannotti. 1966. Schweiz. Med. Wochenschr. 96: 1575. 37. Jungas, R. L., and E. G. Ball. 1964. Biochemistry. 3: 1696. 38. Flatt, J. P., and E. G. Ball. 1963. Biochm. Z . 338: 73. 39. Hohorst, H. J., F. H. Kreutz, and Th. Biicher. 1959.
27.
Biochim. Biophys. Acta. 106: 221.
Enzyme Regul. 3: 407.
Biochem. Z . 332: 18.
40. Philipps, G. R., M. G. Herrera, and A. E. Renold. 1965.
41. Jeanrenaud, B., and A. E. Renold. 1960. J. Biol. Chem.
42. Flatt, J. P. 1967. Helv. Physiol. Pharmacol. Acta. 25: CR 180. 43. Ball, E. G., and R. L. Jungas. 1963. Biochistry. 2:
44. Rizack, M. A. 1964. J . Biol. Chem. 239: 392. 45. Schmidt, K., and J. Katz. 1969. J . Biol. Chm. 244: 2125. 46. Bucher, Th., and M. Klingenberg. 1958. Angew. Chem.
47. Jungas, R. L. 1966. Proc. Nat. Acad. Sci. U.S.A. 56: 757. 48. Cahill, G. F., Jr., B. Leboeuf, and R. B. Flinn. 1960.
49. Masoro, E. J. 1962. J . Lipid Res. 3: 149.
Biochim. Biophys. Acta. 106: 234.
235: 2217.
586.
Int. Ed. Engl. 70: 552.
J. Biol. Chem. 235: 1246.
FLATT Conversion of Carbohydrate to Fat in Adipose Tissue 143
by guest, on June 4, 2018w
ww
.jlr.orgD
ownloaded from