conveyancing fees in a competitive marketfile/baker_conveyancing_fees_jrc_… · 2 conveyancing...
TRANSCRIPT


CONVEYANCING FEES
IN A COMPETITIVE MARKET
Joanne Baker
December 1996
JUSTICE RESEARCH CENTRE

ISBN 0 909136 60 2
©Law Foundation of New South Wales
December 1996
Published by the Law Foundation of New South Wales on behalf of the Justice Research Centre.
Any opinions expressed in this publication are the author's and do not necessarily reflect the views of the Law Foundation's Board of Governors or the Justice Research Centre's Advisory Board.
This publication is copyright. It may be reproduced in part or in whole for educational purposes as long as proper credit is given to the Justice Research Centre and its contributors.

Participants
Director Ted Wright
Researcher Joanne Baker
Research and administrative assistance
Jackie Blundell Elizabeth Brack Vivienne Dassakis Nuria Rodriguez Lucy Smink
Consultants Mark Richardson, Law Society of New South Wales Charles Cawley, Law Society of New South Wales Pat Ebener, the Institute for Civil Justice Michael Thomson, Australian Bureau of Statistics
The Justice Research Centre would like to thank all those law fums that participated in the pilot study and the main survey for the time and effort
they put into completing the questionnaires.

Contents
Participants iii
1 Introduction 1
Background 1
2 Research design 5 Objectives 5
Research methodology 5
Adjustments made to the survey data 6
Consumer Price Index (CPI) adjustments 6
Population estimates and adjustments made for differences in law firm locations 7
Limitations of the research design 8
3 Results 11
Fee disclosure and costs agreements 11
Differences between fee estimates and fees charged 12
Conveyancing fees in 1994 and 1996 13
Have conveyancing fees changed overall? 14
Respondents views on what had happened to conveyancing fees 16
Have conveyancing fees changed across different geographical areas in New South Wales? 17
Have conveyancing fees changed in those law firms that responded to both surveys? 20 Have conveyancing fees changed across different types of transactions? 21

Methods of charging in conveyancing matters in 1994 and 1996 22
Have the methods used to set conveyancing fees changed overall? 23 The use of the old scale 24
Have the methods used to set the fee for the conveyance changed across different geographical areas? 25 Have the methods used to set the fee for the conveyance changed in those law firms that responded to both surveys? 26
Other factors related to conveyancing fees 27 Characteristics of the transactions 28 The importance of conveyancing to the law firms' practice 29 What factors did respondents think were related to conveyancing fees? 31
Advertising 31
Where did law firms advertise? 32 Spending on, and perceived effectiveness of, advertising 32 The relationship between advertising and fees charged 33
4 Conclusion 35
Appendix 39

1
Introduction
Background
1 Conveyancing in New South Wales has become a highly competitive business in the 1990s. This can be attributed to a number of developments, including several legislative reforms designed to increase competition in conveyancing and in the legal services market generally.
2 The first of these legislative changes was the Law Society's decision to remove the restriction on solicitors advertising their fees at the end of 1991.1 Then, in the latter part of 1993, legislation was passed so that licensed conveyancers could provide residential conveyancing services in competition with solicitors. 2 Although the immediate effect of this reform was only to legitimise the activities of about 40 conveyancers (who were operating to that time illegally) the number of licensed conveyancers has increased since 1993 and it is set to increase further in 1997 .' Finally, important reforms to the regulation of the legal
Legal Profession Regulations 1987 new clause 20 gazetted 29 Nov 1991. Up until 1991. solicitors were prohibited from advertising that they were prepared to undertake any business at less than the maximum prices set by the Legal Fees and Costs Board. The change introduced in 1991 removed this restriction. but preserved the prohibitions of advertising which might "reasonably be expec1ed to bring the profession into disrepute" and other like restrictions which could be characterised as relatiog to good taste.
2 Conveyancer:s Licensing Act 1992 (NSW) proclaimed in force 10 September 1993. See now Cmwe}'QIICers Licensing Act1995 (NSW).
3 A small number of applicants have been licensed under the Mutual Recognition legislation, and there about 12 licensees who have graduated from conveyancing courses recogulaed under the new law. A much larger wave of graduates will complete the COUI'lle in 1996 and will qualify for practice in 1997.
2 Conveyancing fees in a competitive market
profession were introduced, effective 1 July 1994 by the Legal Profession Reform Act 1993 (the "LPRA"). These included-
• effectively abolishing fee scales4
• introducing rules requiring upfront disclosure of fees and encouraging
the use of costs agreements • simplifying the procedures for handling client fee complaints
• removing some of the remaining restrictions on advertising by
solicitors.5
3 In addition to those legislative developments, other factors are likely
to have affected competition in the conveyancing market. The
volumes of residential property transactions in New South Wales in
1991-92 and 1995-96 were sirnilar6 but the number of law firms
increased in the same period by 17%.7
4 In the lead-up to the introduction of the LPRA, the Law Society of
New South Wales asked the Justice Research Centre (JRC)8 in early
1994 to conduct a survey of the fees charged, and methods used to set
fees, by small law firms in conveyancing matters.9 Conveyancing is
the legal service most used by the public10 and is a critical area of
4 By abolishing the regulatory body responsible for setting maximum fees for various legal services. The Law Society officially suggested that solicitors might continue to use the last scale set by the Legal Fees and Costs Board "as guidelines" in the first year after the LPRA carne into force. See Costs Reform Implementation Committee, Costs Guidebook: Guidance for Practitioners on the Application of the Legal Profession Reform Act 1993 (The Law Society of New South Wales, 1994).
5 The LPRA removes all restrictions except those on "false, misleading or deceptive" conduct.
6 In 1991-92 the total number of residential transactions was 132,210 and in 1995-96 (the time covered by our second survey) the number was 133,030. The number fluctuated considerably in between, reaching a high in 1993-94 (the time covered by our first survey) of 154,323 and a low in 1992-93 of 127,452. These figures are based on Office of State Revenue data as published in Real Estate Institute of New South Wales, "Monthly market review", Timely Economic and Property News (1996) September.
7 The Law Society of New South Wales.
8 Previously the Civil Justice Research Centre.
9 See J Baker, "Conveyancing: A survey of the charging practices of solicitors in small frrms" Civil Issues No.6 (Justice Research Centre, 1995).
10 Australian Bureau of Statistics, Usage of Legal Services, NSW, October 1990, Cat No. 4510.1 (1991). See also D Worthington and T Matruglio "Access to justice: Food for thought" Civil Issues No.3 (Justice Research Centre, 1992).

Introduction 3
practice for most small law firms. Small firms make up the majority of
legal businesses in New South Wales, and the Law Society was
interested in understanding how changing market conditions were
affecting its members. The JRC decided to repeat this survey early in
1996, in an expanded form, to assess the impact of continuing
competition on conveyancing fees and charging practices.
5 The reforms of the legal services market in New South Wales are not
merely of local interest. They have been mirrored in most other states
and territories11 as part of a national movement to extend competition
policy throughout the Australian economy generally .12 This study is,
so far as we are aware, the first to demonstrate the impact of
competition on an important segment of the legal services market.
11 See eg Legal Pmctice Act 1996 (Vic). Of course, licensed conveyancers have been an established feature of the legal services market in South Australian and Western Australia since the nineteenth century. They have not yet been allowed in Tasmania or Queensland (conveyancers were not admitted to practise in the latter state unti11938).
12 Cf. Independent Committee of Inquiry, National Competition Policy (Australian Government Publishing Service, 1993); Trade Practices Commission, Study of the Professions -Legal: Final Report (Australian Government Publishing Service, 1994 ).
2
Research design
Objectives
6 The aim of this study was to examine the impact of competition on fees in conveyancing matters in small law finns in New South Wales. Specifically, we wanted to fmd out-
• how fee disclosure and costs agreements are working in practice • whether average fee levels have changed in the period between
early 1994 (immediately before the introduction of the LPRA) and early 1996
• how the methods small law firms use to set their fees have changed between 1994 and 1996
• the extent of advertising by small law fums.
Research methodology
7 This section provides an overview of the research design. Full details of the design are presented in the Appendix (Section 1 ).
8 A sample of 1000 small law firms was surveyed by mail in February 1994 before the introduction of the LPRA and again in February 1996, nineteen months after its introduction. The 1000 firms were selected randomly from a list of all small law firms in New South Wales provided by the Law Society of New South Wales. Small law firms were defined as those with five or fewer principals.

6 Conveyancing fees In a competitive market
9 We mailed one questionnaire to each law firm in the two survey periods. 13 Firms were asked to complete it for their most recently completed and final billed residential conveyancing transaction. The questionnaire sought information on fees, charging practices, details about the firm and the particular transaction. It also allowed room for respondents to provide comments.
10 Completed questionnaires were received from 341 firms in the 1994 survey and 587 firms in the 1996 survey .'4 This equated to response rates of 38% for the 1994 survey and6l% for the 1996 survey. In total
244 firms responded to both the 1994 and the 1996 survey. Full details of the sample characteristics are provided in the Appendix (Section 2).
Adjustments made to the survey data
11 The survey data have been adjusted in two ways.15 A brief description of these adjustment procedures follows. Full details are provided in the Appendix (Section 3).
Consumer Price Index (CPl) adjustments
12 In order to make our two samples comparable, dollar values were adjusted to take into account inflation between 1994 and 1996, using
13 We were seeking the law firms' response, rather than the response of individuals within the firm. In o1her words we assume that the responses reflect the practices of the firm as a whole.
14 It should also be noted that 34 of the rnattern in tile 1996 survey were begun during the twelvemonth trwition period of the LPRA between July 1994 and June 1995 where solicitors were still able to use the old scale. However, this represents only 6% of tile matters and therefore we expect that they will have had minimal impact on the results.
15 Because of the adjustments made to the data, the figures presented in this report may vary slightly from those presented in the previous report on the 1994 survey (see note 9). They will also differ because the previoos report did not include tees where tbey were "$0'', whereas this report does.

Research design 7
the Consumer Price Index for Sydney. 16 Dollar values are reported here in terms of 1996 dollars.
Population estimates and adjustments made for differences in law firm locations
13 Second, as noted in paragraph 10, 34 I and 587 small law firms responded to the first and second surveys, respectively. In the 1994 survey regional law firms 17 were over-represented relative to their proportion of all New South Wales small law firms and city and suburban law firms were under-represented. In the 1996 survey regional law firms were again over-represented and suburban law firms were onder-represented. As we found geographical variations in fee Ievels18 (we discuss these further in paragraphs 39 to 44) the survey results have been weighted to make the results representative of all New South Wales small law firms. 19 This also ensured that the data from the 1994 and 1996 surveys were comparable with each other.20
14 Generally, and where appropriate the reported results are weighted, rather than raw survey results. However, unweighted survey results are usually presented where we conduct statistical tests for differences between mean conveyancing fees, where we examine conveyancing
16 Australillll Bureau of Statistics, Consumer Price Index, March Quarter 1996, Cat No. 6401.0. (1996).
17 Finns were classified into the following groups- Sydney CBD, Sydney suburban and regional New South Wales.
18 Kruskal-Wallis tests, fees for the conveyance by fiCtll location: 1994 - ;t',=16.36, p<O.Ol, n=311; 1996 -X' 2=20.47, p<O.OI, n=S82.
19 Note that we found no variation in fees across law finn size- within the CIU!ge of 1 to 5 principals (Kruskal-Wallis test, fee for the conveyance by finn size: 1994- ;t' ,=2.46, p:>O.OS, n=3ll; one-way analysis ofvarilll!ce, fee for the conveyan<e by finn size, 1996- r .. ,=l.84, p:>0.05, n=528). Therefore we considered that there was no need to weight the sample to compensate for possible over- or under-representation of law finn sizes.
20 It should also he n01ed that no significant differences were found between the samples on other possibly important characteristics, including mesn property values. Full details of sample chanacteristics are provided in the Appendix (Section 2).

8 Conveyancing fees in a competitive market
fees and methods in different geographical areas and in the group of
law firms that responded to both surveys.
Limitations of the research design
15 Before proceeding, we note three limitations of the results of this
study.21
16 The first limitation relates to the conclusions that can be drawn about
what caused the differences of conveyancing fees and methods we
found between the two surveys. Our first survey was conducted in
early 1994, immediately before the LPRA came into force, and the
second survey nineteen months after. This "before and after" structure
makes it tempting to attribute the differences to the LPRA. However,
it is an inherent limitation of studies of real-world settings, as opposed
to controlled laboratory experiments, that we cannot make definitive
causal statements. Therefore, we cannot rule out the influence of other
factors on fees, including factors we have not identified. It is possible
that some of the differences in conveyancing fees and methods we
found between the two surveys are the combined effects of the LPRA,
the earlier legislative changes and other market conditions we have
described. We cannot separate the influence of each of these factors.
17 The second limitation results from the fact that our results are based on
a survey of a sample of small law firms rather than all small New
South Wales law firms. It is possible that the sample selected is not
representative of the whole "population" (that is, all small New South
Wales firms). This is known as "sampling error".
18 Substantial proportions of the selected samples of small law firms did
not respond to the survey (62% did not respond in 1994 and 39% in
21 A fourth, although smaller limitation, is that subtle changes to the response categories in the questionnaires may have affected responses. We expect this effect to be minimal and unlikely to have any major ramifications.

Research design 9
1996). This creates a third limitation known as "non-response bias". It is possible that the group of law firms which chose to respond to the
survey were not representative of either the sample or the population.
Moreover, the two groups of respondents may have differed from each
other.22
19 We have partly addressed the second and third limitations by
weighting the results obtained from the samples of respondents to
make them more closely reflect the geographical distribution of all
small New South Wales law ftrms. We have also analysed conveyancing
fees and charging practices separately in each geographical area.
Further, we have analysed the data provided by the 244 small law
ftrms that responded to both surveys separately and found the same
differences - these obviously cannot be attributed to differences
between the 1994 and 1996 samples.
22 Other errors may also have resulted from respondents completing the questionnaire incorrectly, errors in transcribing the data, or errors in the population listing. such that some law finns may have been included or may have been excluded from the sun-ey inappropriately. However, we expect that these errors would be relatively small.

3
Results
Fee disclosure and costs agreements
20 The LPRA introduced requirements for solicitors to disclose their legal fees to clients upfront in the form of either an amount, or the method to be used to calculate the fee together with an estimate.23
Generally this disclosure must be made at the time the solicitor is retained, unless it is not reasonably practicable to do so.24 The LPRA also encouraged solicitors to enter into written costs agreements, but this was not a requirement. 25 As part of the survey, we examined how many small law firms were disclosing fee estimates and how often written costs agreements were being used.
21 The results of the 1996 survey showed that only 43% of small law firms were entering into written costs agreements with their clients. Eighty-six percent of law firms indicated that they were disclosing fee estimates to their clients at the time of instructions. However, 14% indicated that they were not doing so.
22 Although the questionnaire did not specifically ask why fee estimates were not disclosed at the time of instructions, informal comments provided by some respondents suggested that estimates were not disclosed sometimes because the client was a family member, friend or long-standing client, or fees were disclosed after instructions were
23 See now Legal PrrifessionAct 1987 (NSW) ss 175, 177.
24 Legal Profession Act 1987 (NSW) s 178.
25 Legal Profession Act 1987 (NSW) s 1 84( 1 ). It sbould be noted that s 184(6) provides that a costs agreement may take tbe form of a written offer which may he a disclosure under s 175, accepted by the client in writing or by other conduct.
12 Conveyancing fees in a competitive market
taken, or the method of calculating fees was disclosed rather than the fee estimate, for example, according to the old scale.26
23 Of the small law firms that disclosed fee estimates, most suggested that they were disclosing professional fees and disbursements separately. Four per cent suggested that they did not disclose disbursements specifically. In some cases a range of conveyancing fees was disclosed rather than a specific dollar value.
Differences between fee estimates and fees charged
24 More than half of the responding law finns (56%) reported that the fees charged were not the same as the original fee estimate. 27
25 When asked the reasons why the fees charged differed from the fee estimate, respondents most often reported that fees differed on disbursements only. Many respondents commented that disbursements were hard to estimate upfront and others indicated that required items were sometimes overlooked (either by the solicitor or by the client) and sometimes items included in the fee estimate were not required.
26 A small number of respondents indicated that their professional fees differed from the fee estimate. The reasons most commonly given for the difference were -
• extra work was required on the matter as complications or problems had arisen
• fees were reduced or discounted due to the particular circumstances of the client
26 It should be noted that the question asked if disclosure was made "at the time of illlltructions". It may well be that some practitioners were less punctilious than others about the meaning of this plunse would have described the time of disclosure as "at the time of', when others would hnve said "before" or "after" instructions.
27 This result is difficult to interpret accurately as it was dear from responses to other questions that some respondents rated a small difference (in the vicinity of a few dollars) as a difference, while otbers reported a larger difference (in the vicinity of fifty dollm)"" 110 difference.

Results 13
• the fee estimate had not included a charge for the mortgage or discharge of mortgage, in some cases because the client had not informed the firm
• the sale price of the property differed from the anticipated price • the matter was less complicated than originally thought.
27 We did not specifically ask respondents about their views on the rules on fee disclosure and costs agreements. However, we received numerous comments from respondents on this issue. They ranged from stmng support for the new rules through to the view that the rules were an administrative burden that added time and cost to the conveyancing transaction.
Conveyancing fees in 1994 and 1996
28 The key findings appearing from the 1994 and 1996 surveys were-
• overall, the mean (arithmetic average) professional fees charged by small law firms had decreased in real terms.28
• the mean disbursements charged by small law firms had not changed in real terms.
• fee levels were found to have remained relatively constant in small Sydney CBD law fmns, but had decreased significantly in small suburban and regional law firms.
29 Conveyancing transactions involve a conveyance (the process of a transfer of land), and they may or may not involve a mortgage (or discharge of mortgage). For this reason, our analysis discusses individually -
• the "fee for the conveyance" which is the fee for the transfer of land only. It excludes the fee for the mortgage ( 01: discharge of mortgage) if there was one.
28 The mean is the arithmetic average, that is, the sum of all measurements divided by the number of measurements made.

14 Canveyancingfees in a competitive market
• the "fee for the mortgage" or "mortgage fees"29 (which it should be noted were never incurred without a fee for the conveyance).lO
• "total professional fees" (which includes the fee for the conveyance and the fee for the mortgage, if there was one).
30 We use the terrn "conveyancing fees" as a general terrn to refer to all these measures of fees.
31 Because we were interested in the influence of competition on all prices that law firrns control we included charges related to disbursements for such items as telephone calls and photocopying. In order to avoid confusion in subsequent discussion with disbursements for externally determined charges such as searches and stamp duty we will refer to the solicitors' disbursements as "internal disbursements".
Have conveyancing fees changed overall?
32 A statistically significant decrease in mean fees between 1994 and 1996 was found on each of total professional fees, tbe fee for the conveyance and the fee for the mortgage31
• No statistically significant difference was found on mean internal disbursements between 1994 and 1996.32
33 The mean fees are presented in Table l. The mean total professional fees decreased from $1097 to $923, or by 16%. The mean fee for the conveyance decreased from $974 to $863, or by 11%, and the mean fee for the mortgage decreased from $160 to $95, or 41%. Mean internal disbursements remained little changed - $57 in 1994 and $52 in 1996.
29 In this context "mortgage fees" are fees charged for either a mortgage or discharge of mortgage.
30 Note in all analyses carried out on mortgage fees, only those matte!ll that included a mortgage or discharge were included.
31 Ttests, independent samples: total profussional fuesby survey -t,,.=-4.55,p<O.OI, n=582,334; fee for the conveyanoe by survey- t,,,=-3.05, i><O.DI, n=528,311; Mann-Whitney U test, mortgage fees by survey: z=-5.26,p<O.OI, n=331,213.
32 T test independent samples, internal disbU!llements by survey: t,.,=- J, II, p>O.OS,n=511 ,330.

Results 15
TABLE 1. Mean conveyancing fe1111 charged in 1994 and 1996
Mean Mean Percemage 1994 1996 differ1111ce
($) ($) (%)
Total professional fees 1097 923 16
Fee for the conveyance 974 863 11
Fee for the mortgage 160 95 41
Internal disbursements 57 52 9
34 The figures just described, however, are survey estimates and these
have been reported in order for us to carry out the statistical tests of significance. As noted earlier (paragraph 13), firms were not
representative of the overall geographical distribution of small law
firms in New South Wales. Therefore, we adjusted the survey data to produce a better estimate of average fees charged by all small law
firms in the state. The adjusted results are provided in Table 2, which shows that the same trend is still evident -that is, mean professional fees have decreased, but internal disbursements have remained relatively constant.ll
TABLE 2. Mean conveyancing fees charged In 1994 and 1996 -population estimates
Mean MMII Percenlllge 1994 1996 difference
($) ($) (%)
Total professional fees 1116 925 17
Fee for the conveyance 913 780 15
Internal disbursements 56 52 7
33 No statistical rest has been carried out on these figures. Note that no calculation has been made of population estimates of mortgage fees as they are not applicable to tbe entire population.

16 Conveyancing fees in a competitive market
35 Figure 1 shows the distribution of total professional fees in 1994 and 1996. In 1994 the largest proportion of matters fell into the $800 to $899 range ( 16%) and in 1996 the largest proportion of matters fell into the $700 to $799 range (21%). In 1996 the proportion of matters in the lower ranges (that is $600 to $699 and less) had generally increased and the proportion of matters in the higher ranges (that is $1000 to $1099 and higher) had decreased, so fees have come down at both the higher and lower end of the market.
FIGURE 1. The distribution of total professional fees In 1994 and 1996
25
llJjll1994
20 .1996
15
%
10
5
0
~ "' "' ~ "' "' "' "' "' "' "' ~ "' !lJ "' "' 0) "' "' ~ 8l g ,._ 6 "' 0 "' 0 0 ~
~ ~ ~ ~ 0 0 ' 0 0 ~ 0 0 0 0 0 .... "' "' ,._
"' 0 0 g 0 ~
~ ~ ~ ~
$
Respondents views on what had happened to conveyancing fees
36 In the 1996 survey respondents were asked for their impressions on what had happened to conveyancing fees in the last twelve months. Overall their impressions conformed with the statistical data- most respondents felt that there had been a general decrease in fees in the previous 12 months. However, some respondents felt that fees had stabilised or even increased.

Results 17
37 The most common reasons given for the decrease all related to increased competition. Some respondents used those words, and others referred to increased discounting, advertising or that clients expected low prices and were shopping around. Some respondents suggested that a general downturn in business meant that law ftnns were reducing their fees to compete for an ever-decreasing market.
38 The respondents who suggested fees had increased felt that this was because solicitors had been unable to maintain unprofitable prices or had realised that some clients were looking for professional, reliable service, rather than cheap prices.
Have conveyancing fees changed across different geographical areas in New South Wales?
39 In this section we cousider the interesting possibility that competition has had a different impact in different geographical areas of New South Wales.34 We also examined this question for the reasons discussed in paragraph 13, that is, the disproportionate representation of small law finn locations in the samples.
40 We did find geographical differences. Statistically significant decreases were found between 1994 and 1996 in the mean total professional fees and the mean fee charged for the conveyance by small suburban and regional law finns.35 The mean fee for the mortgage had also decreased significantly in small suburban law firms, but had not changed in small regional law firms.36 Moreover, no statistically significant
34 In this section we refer to survey data rather then population estimates.
35 Suburban law ftrms only, Mann-Whirney U tests: total professional fees by survey -z=-6.24, p<O.OI, n.,a7Q,I 58; fee for the conveyon.;e by survey - z=-4.59, p<O.Ol, ""'239,142.
Regional law firms only: t test, independent samples, total professional fees by survey -!,.,"·3.17, p<O.OI, n=l82,123; Mann-Whitney U test, fee for the conveyance by survey -z=-3.20, p<O.OI, ~175,120.
36 Suburban law firms only: t test. independent samples, mortgage fees by survey - t,.,:-4. 78, p<O.OI, 11'=152,104.
Regional law firms only: t test, independent samples, mortgage fees by survey 11.,:-1.22, p>0.05, 11=105,77.
18 Conveyancing fees in a competitive marl<et
difference was found between 1994 and 1996 in small Sydney CBD law firms.37
41 Again, we did not find any statistically significant differences between 1994 and 1996 in internal disbursements in any geographical area.38
42 The mean fees charged by small law firms in each geographical area are shown in Table 3. Mean total professional fees in small city law firms were $1400 in 1994 and $1186 in 1996. As we have noted, however, the apparent decline in fees of small city law firms was not statistically significant, even though the difference in the survey means was 15%. The lack of statistical significance seems to be due to the high variation in small city law firm fees. 39
43 In small suburban law firms mean total professional fees decreased from $1144 to $881 (23%) and in small regional law firms from $904 to $800 (12%).
44 As perhaps might be expected mean fees were higher in city law firms than in suburban law firms which were in tum higher than regional law firms.40 In part this could be due to property prices (we discuss this further in paragraphs 64 to 68). But this difference and the high variability of city law firm fees may well be due to the fact that
37 City law firms only: /tests, independentsamples, total professional fees by survey - t181
;-1.42, p>0.05, n=l30,53; fee for the conveyance by survey- t161=-0.59, p>0.05, n=ll4,49; Mann· Whitney U rest, mortgage fees by survey: :o=-1.22, p>0.05, n=74,32.
38 City law flfllls only: r test, independent samples, internal disbursements by survey-11,=0.49, p>0.05, n=130,53.
Suburban law firms only: Mann-Whitney U rest, internal disbursements by survey - z=-1.61, p>0.05, n-=266,156.
Regional law f1m1s only: 1 lest, independent samples, internal disbursements by survey -t,,~L43, p>0.05, n=l81,123.
39 The statistical variation (S') in total professional fues was $863,855 in small Sydney CBD law finns, compared with $200,927 in small suburban law firms and $82,359 in small regional law flflllS. In fact tne mean fee for the conveyance decreased from $1213 to $1124 (7%) in small Sydney CBD law f1miS. This compares with a decrease from $1015 to $822 in small suburban law !inns (19%).
40 As we noted in paragmpb 13, a statistically significant difference existed in the mean fee charged for the conveyance across geographical areas.

Results 19
conveyancing tends to be a major source of income for most suburban and regional law firms whereas it is not a major source for many law firms in tbe city.41 Therefore, many city law firms may not be competing as much for conveyancing work as suburban and regional law firms. The influence of tbis factor is discussed further in paragraphs 68 to 71.
TABLES. Mean conveyancing feea charged In 1994 and 1996 by geographical area
Mean Mean Percen1age 1994 1996 difference
($) ($) (%)
City
Total professional lees 1400 1186 15
Fee for the conveyance 1213 1124 7
Fee for the mortgage 200 122 39
Internal disbursements 65 72 11
Suburban
Total professional leas 1144 881 23
Fee for lhe conveyance 1015 822 19
Fee for the mortgage 184 86 53
Internal disbursements 60 49 18
Regional
T Olaf professional fees 904 800 12
Fee for the conveyance 828 749 10
Fee for the mortgage 112 90 20
Internal disbursemants 50 43 14
41 J Baker, "Profit levels in the NSW legal profession" Justice issues No. 10 (Justice Research Centre, 1996).
20 Conveyancing fees in a competitive market
Have conveyancing fees changed in those law firms that responded to both surveys?
45 As we noted in paragraphs 13 and 18 there were differences in the
1994 and 1996 samples - the principal ones being that more law
firms responded to the second survey and the geographic distribution
of law firms was different. Testing for differences within the group of
244 law firms that responded to both the 1994 and 1996 surveys and
comparing their conveyancing fees with the overall sample allows us
to more confidently attribute the observed differences to competition,
rather than any differences among the samples of law firms responding. 42
46 The same general pattern was found in this group of small law firms as
Table 4 shows. Mean total professional fees, the mean fee for the
conveyance and the mean fee for the mortgage had decreased
significantly between 1994 and 1996.43 Internal disbursements had
remained relatively constant.44
47 These figures were also similar to the overall means presented in
Table 1 where the mean total professional fees were $1097 in 1994 and $923 in 1996. These findings suggest that the fee differences
found between the samples cannot be accounted for by differences in
the nature of the samples of law firms that responded to each survey.
42 Note that in this section we refer to survey data, not population estimates.
43 T tests, related swnples: total professional fees - t236=3.37, p<O.Ol, n=237; fee for the conveyance - S08=2.13, p<0.05, n=209; mortgage fees - t
96=3.68, p<O.O 1, n=91.
44 T test, related swnples, internal disbursements: s,.=O.l7, p>0.05, n=231.

Results 21
TABLE 4. Mean conveyancing lees charged In 1994 and 1996 by those law firms that responded to both surveys
Mean Mean Percentage 1994 1996 difference
($) ($) (%)
Total professional fees 1097 937 15
Fee for the conveyance 980 880 10
Fee for the mortgage 157 86 45
Internal disbursements 57 56 2
Have conveyancing fees changed across different types of transactions?
48 Further analysis of the two surveys revealed the same general pattern
across different types of transactions.45 In general, statistically significant
decreases in mean professional fees between 1994 and 1996 were found
in transactions for -
• a residential dwelling or strata title
• a sale or purchase.
49 The only exception to the general pattern was for matters for vacant
land where no statistically significant difference was found on mean
professional fees (total professional fees, the fee for the conveyance
and the fee for the mortgage). However, this may have been due to the
small number of transactions in the samples for vacant land.
50 No statistically significant difference was found between 1994 and
1996 on internal disbursements across all transaction types. 46
45 Note in this section we refer to survey data, not population estimates. Also because of the number of statistical tests involved the results are set out in the Appendix (Section 4). Full details of the means for each type of transactions are also provided in the Appendix (Section 4).
46 The only exception was the mean fees charged for internal disbursements for transactions for a strata title where a statistically significant decrease was found.
22 Conveyancing fees in a competitive market
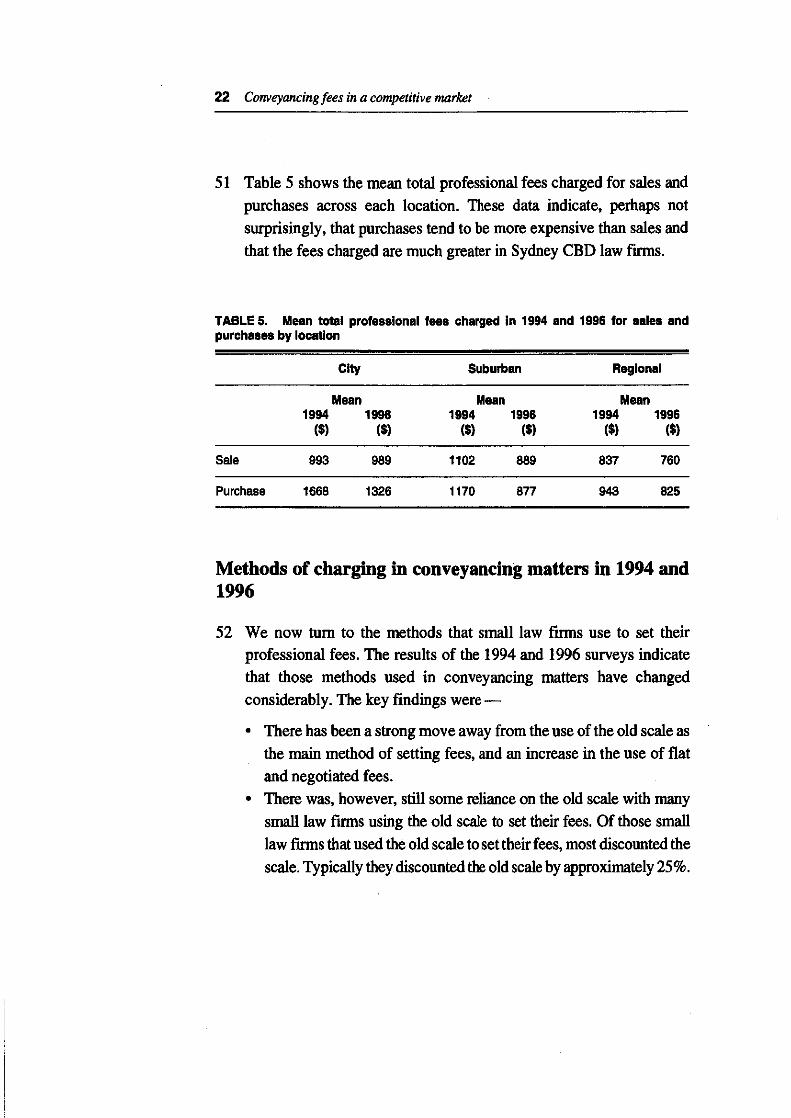
51 Table 5 shows the mean total professional fees charged for sales and
purchases across each location. These data indicate, perhaps not
surprisingly, that purchases tend to be more expensive than sales and
that the fees charged are much greater in Sydney CBD law firms.
TABLE 5. Mean total professional lees charged in 1994 and 1996 lor sales and purchases by location
City Suburban Raglonal
Mean Mean Mean 1994 1996 1994 1996 1994 1996
($) ($) ($) ($) ($) ($)
Sale 993 989 1102 889 837 760
Purchase 1668 1326 1170 877 943 825
Methods of charging in conveyancing matters in 1994 and 1996
52 We now tum to the methods that small law finns use to set their professional fees. The results of the 1994 and 1996 surveys indicate
that those methods used in conveyancing matters have changed
considerably. The key findings were-
• There has been a strong move away from the use of the old scale as
the main method of setting fees, and an increase in the use of flat
and negotiated fees.
• There was, however, still some reliance on the old scale with many
small law finns using the old scale to set their fees. Of those small
law finns that used the old scale to set their fees, most discounted the
scale. Typically they discounted the old scale by approximately 25%.

Results 23
Have the methods used to set conveyancing fees changed overall?
53 Law firms were asked what method best described the way the fees for
the conveyance and the mortgage (if there was one) were calculated.
As the findings were similar only the methods used to set the fee for
the conveyance are discussed here.47
54 A statistically significant difference was found between the methods
small law firms used to calculate the fee for the conveyance in 1994
and 1996.48 The proportions of firms using each method is shown in
Figure 2.49
55 It can be seen that the most common method of setting fees in 1994
was the old scale, while in 1996 it was flat fee or negotiation with the
client. However, there was still a considerable proportion (28%) of
small law firms using the old scale in 1996.
56 The use of time costing and other methods to set fees had increased
slightly.50 Other methods included the law firm's own scales, reference
to what the client could pay or other client circumstances, "what
seemed fair", what other firms were charging, the work involved or a
combination of methods.
47 Note that population estimates are used tluoughoutthis section.
48 Chi-square test, method of charging for the conveyance by SU!\'ey: x',=851.88,p<0.01, n=5402.
49 The 1996 questionnaire provided separate categories for flat fees and negotiation with the client. However, the two categories have been combined to enable comparison with the 1994 survey, where the tenn "costs agreement" was used to cover these two possibilities. The 61% of small law firms using flat fee or negotiation consisted of 35% flat fee and 26% negotiation with the client. Further, although we can only speculate about the proportions, it seems likely that many negotiated fees would have been a "flat fee"- solicitors who indicated that flat fee was best way of describing the method for setting fees meant they did not negotiate the level of flat fee.
50 Interestingly, more small law firms were using time records than were using time costing, and the proportion of firms using time recording had increased from 9% to 19%.

24 Conveyancing fees in a competitive market
FIGURE 2. The methods small law firms used to set the lee lor the conveyance In 1994 and 1996
100
90 Ill 1994
80 • 1996
70
60
% 50
40
30
20
10
0 old scale flat fee or time other
negotiation'
Method
The use of the old scale
57 In 1996 in addition to asking law finns the method that best described
the way the fee for the conveyance was calculated, they were also
asked whether they used the old scale to calculate their fees - 46%
said they did (compared with 28% that said this best described their
method). Of the group using the old scale, most (73%) reported that
they had discounted the old scale. Nineteen per cent reported they had
charged the old scale and 9% reported they had added an increment to
the old scale. Of those law finns that discounted the old scale, the
mean amount they reported discounting was approximately 25% and
of those law finns adding an increment, the mean amount they
reported adding was approximately 14%.51
51 Note that these figures are based on unweighted survey data because it was not possible to calculate the number of firms that discounted or added in the whole population.

Results 25
58 Although the question was not specifically asked in the questionnaire, numerous respondents commented on the abolition of the scale fee. Many clearly missed having some guideline for price setting. Many respondents also commented on the increase in the number of clients shopping around and noted a trend towards flat fees. These two things are probably related.
Have the methods used to set the fee for the conveyance changed across different geographical areas?
59 The survey results were also analysed to see what had happened to the method of calculating the fee for the conveyance in small city, suburban and regional law firms. 52 This was important as it was with fee levels because of the disproportionate representation of law firm locations in the samples (discussed in paragraph 13). Due to the smaller number of cases involved, all methods other than old scale have been classified singly as "other".
60 The results indicated that the methods small law firms used to calculate the fee for the conveyance had changed significantly between 1994 and 1996 in each location.53 The proportion of small law fmns using each method across firm locatiou is shown in Table 6. The same pattern emerged in all three locations with a strong move away from the old scale. The proportion of small regional law firms using the old scale in 1994 (83%) was higher than the proportion in suburban (61 %) and city (63%) law firms. However, while the
52 Note that we refer to survey data in this section, not population estimates.
53 City law firms only: Chi-square test, method of charging for the conveyance by survey ~ X' 1=25.45, p<O.OI, ""'187.
Suburban law firms only: Chi-square test, metbod of charging for the conveyance by survey ~ x\=69.24, p<O.Ol, n:433.
Regional law firms only: Chi-square tes~ method of charging for the conveyance by survey X',=41.75, p<O.OI, n=301.

26 Conveyancing fees in a competitive market
proportion of regional law finns using the old scale in 1996 had decreased, it remained quite high at 46%, compared to the proportions of city and suburban law firms still using them.
TABLE6. The methods used to set the fee for the conveyance by geographical area ··········-··-----.. --..
The firma usiniJ The firma using each method each method
1994 1996 (n) (%) (n) (%)
City
Old scale 34 63 32 24
Other 20 37 101 76
Suburban
Old scale 99 61 57 21
Other 64 39 213 79
Regional
Old scale 103 83 85 46
Other 21 17 98 54
Have the methods used to set the fee for the conveyance changed in those law firms that responded to both surveys?
61 As with fee levels we addressed the possibility that any differences in methods found between the two surveys were due to differences in the samples of law firms (rather than real population differences) by examining only those 244Iaw firms that responded to both surveys. 54
62 Table 7 shows the proportion of law finns in this group using each method in 1994 and 1996. It can be seen that these findings are similar
54 Note that survey data is used in this section, not population estimates.

Results 27
to the overall findings. 55 That is, the use of the old scale had decreased
and the use of flat or negotiated fees had increased. Only slight
differences were evident for time and other methods.
TABLE 7. The methods used to sat the fee for the conveyance by those law firms that responded to both surveys
The firms using The firms using each method each method
1994 1996 (n) (%) (n) (%)
Old Scale 170 70 87 36
Flat fee or negotiation· 71 29 135 55
Time 0 5 2
Other 2 1 17 7
Total 244 100 244 100
• Costs agreement in 1994 survey
Other factors related to conveyancing fees
63 We have already seen that firm location is related to conveyancing
fees (paragraph 13). In this part we examine some other factors that may
be related to conveyancing fees. 56 First we examine characteristics of
the transactions and their relationship to conveyancing fees. Next we
examine the importance of conveyancing to the law firms' practice.
Finally we consider what respondents thought affected conveyancing
feesY
55 No statistical test was carried out on this data.
56 Earlier in the report we looked at law ftnn size and found that it was not related to conveyancing fees. This may well be due to the restriction of the sample to small fll'llls of one to ftve principals. Cf. Baker, see note 41 which showed that there was a relationship between ftnn size and profitability.
57 In this section we refer to survey data, not population estimates.

28 Conveyancing fees in a competitive marlu!t
Characteristics of the transactions
64 For each survey we examined which characteristics of the transactions were related to the fee for the conveyance. 5" The characteristics examined were -property type, property price, duration, number of hours spent on the matter, and whether the transaction included a sale or purchase, a mortgage or discharge and whether the matter was rated as "typical". Only one factor was found to be consistently related to the fee for the conveyance in the two surveys- property price. 59
65 In both the 1994 and 1996 surveys there was a strong relationship between fees and the property price, that is, the fee for the conveyance increased as property price increased. This may be due to the fact that there is still some degree of reliance on the old scale. Alternatively it may he a result of what the market is prepared to bear- those that can afford higher property prices may also be prepared to pay higher legal fees.
66 In fact law firm location (which we have already found is related to the fee for the conveyance) and property price are related to each other. 60
The average property price for matters that Sydney CBD law firms deal with is higher than the average property prices for matters that other law firms deal with. This then raises an interesting question -how large an influence on fees do these two factors have, independent of the other?
67 Further analysis of the data revealed relatively strong relationships between the fee for the conveyance and property price in all three
58 The fee for the oonveyance was used to reduce variation created by whether a mortgage or discharge of mortgage was involved or not. For example, properties of a higher value may he more likely to involve a mortgage- and possibly total professional fees might be higher fur mattern involving properties of higher value be<'lluse of the mortgage fee.
59 Other factors were found to be significantly related to the foe for the coaveyance, but oaly wuhin the 1994 survey or the 1996 SU1Vey, as opposed to both. Full details of the rehrtionships between the fee for the conveyance and other factors are provided in the Appendix (Section 5).
60 Kruskal-Wallis tests, property price by location: 1994- "1.',=76.37, p<O.Ol, n=332; 1996-x',=ll3.42, p<O.OJ. n=568.

Results 29
locations in both surveys, with the exception of regional law firms in 1996 where the relationship was not statistically significant. 61 This suggests that, to some extent, property cost is important, regardless of law firm location.
68 On the other hand, when we held property price relatively constant, by examining the fee for the conveyance for only those matters involving properties costing between $150,000 and $250,000, we found that mean fees still varied across location, at least in 1996.62 This suggests that location is also important regardless of property cost, at least since the old scale is not used so widely.
The importance of conveyancing to the law firms' practice
69 In the 1996 survey respondents were asked to rate the importance of conveyancing to the revenue of the law firm. This was found to be significantly related to the fee for the conveyance. 63
70 The mean fee charged for the conveyance by small law firms that rated conveyancing as relatively unimportant to the fll"lll ($1021) were higher than the mean fees charged by small law fll"lllS that rated conveyancing as relatively important ($830).64 This finding suggests that law firms, where conveyancing is relatively unimportant, do not
61 City law firms only, correlation coefficient, property cost by lee fur !be conveyance: 1994-c=0.78,p<O.Ol, n=48; 1996 -r=0.84,p<O.Ol, n=IIO.
Subutban law fitmS only, correlation coefficient, property cost by lee fur the conveyance: 1994 - r=0.26, p<O.Ol, n:l42; 1996- r-0.46, p<O.Ol, =232.
Regional law T!rn!S only, correlation coefficient, property cost by fee for !be conveyance: 1994 -r=0.68,p<O.OI, n=ll4; 1996-r=O.OS, p>0.05, n=l70.
62 One-way analysis of variance, fee for the conveyance by locstion: 1994- 12,.=1.85, p>O.OS, n=9'7; 1996- r,,11,=3.S7,p<0.05, n=178.
63 Mann· Whitney U test, fee for the conveyance by importance of conveyancing: z=-2.97, p<O.O I, 11=129,95.
64 Note these figures are survey data, not population estimates.

30 Conveyancing fees in a competitive market
attempt to compete as strongly for that work as firms where conveyancing
is a major part of their practice.65
71 We also asked respondents in 1996 how the volume of conveyancing
work had changed in their law ftrrn in the previous twelve months in
order to see if this was a factor as well as the importance of
conveyancing to their practice.66 A large proportion (57%) of
respondents felt that the volume of conveyancing work in their law
firm had not changed or had only changed slightly in the previous
twelve months. However, 13% of respondents indicated that the
volume of conveyancing work had increased moderately or increased
greatly and 30% of respondents indicated that the volume had
decreased moderately or greatly. 67 These proportions were similar
across law firms in the city, suburbs and regions.
72 We looked at the relationship between the respondents' views on
whether the volume of conveyancing work had changed and the
difference in their fees for the conveyance between 1994 and 1996.
We were restricted to those law firms that had responded to both
surveys. A statistically significant difference was found.68 Mean fees
had increased by $182 in firms that reported an increase in the volume of their conveyancing work, and mean fees had decreased by $144 in
firms that reported no change or a decrease in the vo1ume.69 These
findings are consistent with the conclusion that declining volumes
have contributed to the competitive pressure on the conveyancing fees
of some law firms.
65 Earlier in this report we discussed the fact that the importance of conveyancing work was related to law finn location and in city fmns it tends to be a small part of their business.
66 As we noted in the introduction, the number of residential property transactions decreased between the two survey years by 14% (see note 6). The number oflaw !inns increased between the two surveys by 4%. These factors could be expected to contribute to an increase in competition.
67 Note that these figures are population estimates.
68 Ttest, independent swnples, difference between 1994 and 1996 fees for conveyance by volume of conveyancing: t,.,=-2.43, p<0.05, n=29,178.
69 Note that these figures are survey data, in order that we can carry out statistical tests of significance.

Results 31
What factors did respondents think were related to conveyancing fees?
73 The questionnaire asked respondents what factors they thought
affected fees in conveyancing matters. Some said it was the amount of
work, skill and service involved (that is, the cost of their inputs).70
However, many respondents cited competition as the outstanding
factor, which is indicative of its relative importance to fee changes in
current market conditions. The comments even of those solicitors who
cited other factors such as "client factors" and other relevant players in the conveyancing process, indicate that they were referring to
competitive pressures also. The range of comments included these
examples-
• "Competition from fellow practitioners and market conditions."
• "Solicitors advertising discount rates."
• "Flat fee conveyancing has set a minimum fee which influences all
charges."
• "Client's conception of price and value for money."
• "Pressure from clients to pay the lowest possible fee."
• "Increased market perception that fees can be negotiated and
knowledge of vastly reduced rates, flowing from increased
advertising." • "Real estate agents encouraging vendors and purchasers to demand
discounts."
• "Agents recommending cut price solicitors."
• "Requirements of certain mortgagees."
Advertising
74 In the 1996 survey we asked the law firms about their advertising
practices.71 Sixty-four percent of small law firms indicated that they
70 The fact that others did not mention this factor does not mean that they did not think it was important
71 As noted in the introduction, the 1994 survey was commissioned by tile Law Society of New South Wales. and the project specifications did not cover ad-.rtising.
32 Conveyancing fees in a competitive mar~t
had advertised their services in the previous twelve months.72 These
were predominantly suburban and regional law firms - 66% of
suburban firms and 84% of regional firms had advertised. Only 38%
of city law firms had advertised in the previous twelve months.
75 Of the small law firms that had advertised, only 38% indicated that
they had specifically advertised their conveyancing services. Again,
these were predominantly suburban (39%) and regional (41%) law
firms. Of the city law firms that did advertise, only 28% advertised their conveyancing services.
Where did law firms advertise?
76 By far the most common medium used by small law firms (73%) to
advertise was the Yellow Pages telephone directory. Local newspapers
were the second most common medium used- 41% oflaw firms that
advertised use~Lthis medium. This fmding was consistent across the three geographical areas.
77 Very few law firms indicated that they advertised in daily newspapers or on the radio. However, a wide range of other media were used,
including, for example, sponsorship of local sporting clubs and
events, real estate agents, mail drops and local directories, and
television and cinema.
Spending on, and perceived effectiveness of, advertising
78 Of those small law firms that did advertise in the previous twelve
months, the amount spent on advertising varied widely, between $0
and $100,000. The mean amount spent on advertising was $3840.
There was no difference in the mean amount spent on advertising by
city, suburban and regional law firms in those firms that did advertise.
72 Data reported in this section are based on population estimates unless otheiWise specified.

Result.! 33
79 Most of the small law firms {81%) suggested that advertising was not that effective, having no effect on the firm's volume of business, or increasing it only slightly. Only 19% of firms indicated that advertising had increased their business moderately or greatly. These findings did not vary across the three geographical areas. Interestingly, however, most law firms (69%) thought that advertising was an appropriate activity for lawyers, and the most common reasons given for this view was that advertising was a means ofinform.ing the public, promoting services and attracting business. Although these findings appear contradictory, they are explained by the view of most small law firms that advertising is a secondary strategy for attracting business.
80 When we asked the law firms how they attracted most of their clients, the majority indicated that most of their clients were from past business {60%) and referral {20%). Only one percent of the small law firms indicated that they attracted most of their clients through advertising. The remainder of firms indicated that most of their clients were from more than one source or from other methods such as "off the street", "word of mouth", and personal contacts of solicitors within the fmn. These findings were again consistent across the three geographical areas.
The relationship between advertising and fees charged
81 We examined the relationship between whether the law firms advertised or not and the of fees charged for the conveyance.73 The mean fee charged for the conveyance by frrms that advertised was $824 and by firms that did not advertise, $936, however, this difference was not statistically significant.74 We also examined the relationship within each geographical area. No significant differences
73 Note that in this section survey data is used to enable us to conduct statistical tests for differences between means.
74 Mann-Whitney U test, fee for tbe conveyance by ndvertilling: z~ 1.36, p>O.OS, n=344,184.

34 Conveyancing fees in a competitive market
were found in any geographical area between the mean fee for the
conveyance in firms that advertised and firms that did not.75
82 However, when we examined the relationship between whether the
small law firms advertised conveyancing specifically and the fee
charged for the conveyance a statistically significant difference did
emerge.76 The mean fee charged for the conveyance by small law
firms that advertised conveyancing ($761) was less than the mean fee
charged by small law firms that did not advertise conveyancing
specifically ($900). This finding indicates that advertising is an
important competitive factor in the conveyancing market.
75 City law finns only: I test, independent samples, fee for the conveyance by advertising -t
112=·0.33, p>0.05, n=41,73.
Suburban law finns only: I test, independent samples, fee for the conveyance by advertisingt,,=-0.29, p>0.05, •=155,84.
Regional law finns only: 1 test, independent samples, fee for the conveyance by advertising -tl73=1.24, p>0.05, •=148,27.
76 Mann-Whitney U test, fee for conveyance by advertising conveyancing: z=-3.55, p<O.Ol, •=136,390.

4
Conclusion
83 The New South Wales conveyancing services market has become increasingly competitive since the early 1990s. This has been the result of progressive de-regulation of the market as well as static volumes of residential property transactions and increases in the number of service providers. In 1991 restrictions on advertising prices by solicitors were relaxed, and in 1993 licensed conveyancers were permitted to compete with solicitors. In 1994, the LPRA introduced compulsory fee disclosure, did away with the old scale of fees and simplified procedures for handling client complaints about fees, and removed most of the remaining restrictions on solicitors advertising legal services.
84 This study aimed to examine the impact of competition on fee levels and charging practices in the area of conveyancing. In particular it examined-
• how fee disclosure and costs agreements were working in practice • whether average fee levels had changed between 1994 and 1996 • how the methods solicitors use to set their fees have changed over
the same period • advertising by small firms.
85 The results of the study indicate that increased competition has had a substantial impact between 1994 and 1996. The fmdings showed that charging practices of small law firms in New Sooth Wales had changed and that they had reduced their fee levels considerably between 1994 and 1996.

36 Conveyancing fees in a competitive market
86 In general most law firms (86%) indicated that they were disclosing
fee estimates to their clients at the time of instructions. But less than
half ( 43%) indicated that they were entering into costs agreements
with their clients.
87 Overall the mean total professional fees were found to have decreased
by 17% between 1994 and 1996 from $1116 to $925. Both the mean
fees for the conveyance and for the mortgage, had overall, also
decreased noticeably.
88 Interestingly, we found that the fees of city law firms had not been
greatly reduced. It appears that some city law firms may not be
competing as much for conveyancing work as suburban and regional
law firms do because it is a relatively minor part of their practice.
89 We also found that the professional fees of city law firms were higher
than suburban law firms, which were, in tum, higher than the fees of
regional law firms. To some extent this appeared to be due to the value
of the properties involved in the transactions, but not entirely so, at
least in 1996.
90 The findings also consistently showed that the methods small law
firms used to set their fees in conveyancing matters had changed from
1994 to 1996. There was a strong move away from the old scale
towards flat and negotiated fees. In 1994, 67% of small law firms
indicated that the scale best described the way they set the fee for the
conveyance and 31% indicated it was flat or negotiated fees. In 1996
the percentages had almost reversed, with 28% indicating the old scale
best described the way they set the fee for the conveyance and 61%
indicating that they had set flat fees or they negotiated fees. Similar
trends were evident in each location. However, many small law
firms were still relying on the old scale, particularly in regional New
South Wales.

Conclusion 37
91 Our survey also showed that 64% of small law finns had advertised in 1995 (the year prior to the survey). These were predominantly suburban and regional law frims. The mean fee charged for the conveyance by small law finns that had specifically advertised their conveyancing services were found to be significantly lower than the mean fee charged by finns that did not advertise conveyancing specifically. This suggests that advertising is an important competitive factor in the conveyancing market.
92 What does a 17% reduction in conveyancing fees translate to in savings to the community? It is difficult to estimate this without a current figure on the size of the conveyancing market. The most recent figures available are for 1992-93 and those indicate that the gross income generated by legal businesses in New South Wales for conveyancing work was $504.2 million.77 Using this figure the reduction in fees represents a savings to the community in the vicinity of $86 million.78
93 The questionnaire provided room for respondents to provide their comments on conveyancing, advertising and the LPRA. Many respondents to the survey volunteered their concerns about the adverse effects that the reduction in fees might be having on quality of service - as law finns attempted to cut costs they would inevitably cut corners. This, they argued, would not benefit consumers in the long run. A deterioration in the standard of professional service could be expected to become evident in an increase in the number of negligence claims and complaints about solicitors, and these are effects which could be monitored by the Law Society's insurers and
77 Auslralian Bureau of Statistics, Legal and AccoUilting Services, Australia 1992.-93, Cat No. 8678.0 (1995). See also Baker, see note 41. Tlte gross income in 1992 to 1993 w"" $457.5 million. This was converted to 1996 dollar values.
78 In fact, the size of the conveyancing market has iocreased in both volume and dollar value since 1992-93, suggesting that this savings estimate is conservative.

38 Conveyancin8 fees in a competitive market
the Legal Services Commissioner. It would not necessarily follow that the most appropriate policy response would be to reduce competitive pressures on prices.79
94 Often respondents also suggested that reducing conveyancing fees would affect both the fees for, and the availability of, other legal services, by reducing the ability of firms to "cross-subsidise" those services from conveyancing profits, and perhaps ultimately by affecting the viability of small law firms, particularly in the suburbs and regions. These are possible effects of increased competition in the legal services market which may warrant further research.80 Again, we simply note here that the policy implications are not clear-cut. 81
95 Further research on the effects of increased competition, and the LPRA reforms in particular, on other segments of the legal services market is clearly desirable. The LPRA, as we have noted, introduced new procedures for handling fee disputes, to make them more accessible to clients. It also introduced a new system for handling other complaints against solicitors, deregulated fees, and modified the structure of the profession. The effects of these reforms on the delivery of legal services to the community are largely unknown and it could be useful to evaluate these. In 1997 the Justice Research Centre will conduct research on the effect of the LPRA on litigation costs.
79 The Trade Pmctices Commission, for example, bas argued that the professional indemnity insurance premiums structure could be changed to limit the ability of "corner-cutters" to "extemali<e" the losses their shoddy work leads to. See Trade Practices Commission, Study of the Professions- Legal: Draft Report (Aostralian Government Publishing Service, 1993) pp 45&-462. Cf. also Trade Practices Commission, see note 12. p 196.
80 An appropriate survey of its members could be undertaken by the Law Society with the renewal of practising certificates, like the survey done in 1996 on solicitors' incomes,
81 The prediction that competition will necessarily mean that some law firms will withdraw from some markets can be disputed, as can the proposition thet this would result in services being no longer available to those markets. As for concern about removing the opportunity to crosssubsidise tbe cost of other services (and there is no hard evidence that cross-subsidising occurs), economists would say that cross.subsidisation of this kind is both inefficient and inequitable. If, as a matter of public policy, cross-subsidisation of legal services was thought to be deairable, it can be argued that it should be "transparent" and administered through regulatory intervention in the market by Government (as, in effect occurs to some extent through use of interest on solicitors' trust accounts to fund Legal Aid).

Appendix

40 Conveyancing fees in a competitive market
Contents
1 Survey methodology 41
The 1994 survey 41
Sample selection 41
The mail survey 41
Response rate 42
Response bias 42
Law firm location 43
Firm size 43
The 1996 survey 44
Sample selection 44
The mail survey 45
Response rate 47
Response bias 48
Firm location 49
Firm size 49
Time allotted for responses 50
2 The sample characteristics 51
Comparison of the samples resulting from the two surveys 54
Comparison of the samples for the law ftrms that responded to both surveys 55
3 Statistical and adjustment procedures 57
Statistical procedures 57
Consumer Price Index adjustments 57
Calculating population estimates and weighting for law ftrm location 58
4 Conveyancing fees for different types of conveyancing transactions 59
5 The factors related to conveyancing fees 62

Appendix 41
1 Survey methodology
1 This appendix provides full details of the methodology used on the 341 and 587 responses received from 1000 small New South Wales law firms in the 1994 and 1996 surveys respectively.
The 1994 survey
Sample selection
2 The Law Society of New South Wales provided the Justice Research Centre with a list of the names and addresses of all small law firms in New South Wales, compiled from its membership database as at February 1994, which contained approximately 2652 small law firms. A systematic sample of 1000 firms was selected from the list. Small law frrms were defined as those with five or fewer principals.
The mail survey
3 A questionnaire was designed and pilot-tested on three solicitors in the Sydney metropolitan area. The questionnaire was mailed to each of the 1000 law firms in February 1994. A letter explaining the purpose of the survey and a letter from the Law Society of New South Wales endorsing the study, accompanied the questionnaire. It was requested that law firms complete the questionnaire for their most recently completed and final billed residential conveyancing transaction. The questionnaire sought information about-
• the frrm • the nature of the conveyancing matter • the time spent on the matter • the fees charged to the client • the way in which the fees were calculated.
42 Conveyancing fees in a competitive market
4 Law firms were asked to return completed questionnaires by mail, fax or DX (Australian Document Exchange). One month was allocated for the return of questionnaires. Two weeks after the initial mail-out a reminder notice was mailed to each of the law firms that had not responded.
5 To encourage responses, an incentive prize (the chance to win an electronic diary) was offered to all those firms that responded to the survey in the first two weeks.
Response rate
6 Completed questionnaires were received from 341 of the 1000 firms, a response rate of 38%.82
Response bias
7 As the rate of non-respondents was 62% it was important to check whether the respondents differed systematically from the sample population or the New South Wales population of small law firms. The only measures that we had information on to compare was firm location and firm size. Statistical tests indicated that the firms that responded differed from those in both the sample population of 1000,
82 In 1he 1994 survey we did not collect infonnation about why law finns did not respond. Therefore to calculate 1he response rate we assumed that firms did not respond for similar reasons to those of 1he 1996 survey. In the 1996 survey 133, or 11%, of the total sample finns were ineligible (ie, 1hey were oo longer practising, !hey did not practise in the area of conveyancing. or they were duplicated on tbe list of finns) to participate in tbe survey. Note that this fJgUre excludes the firms not locatW in the 1996 survey, as we would bave been able to locate most finns in 1he 1994 survey. Tberefore assuming tbe proportion of finns that were ineligible was similar in 1994, tbe number of ineligible finns is 11% ofiOOO=llO.
Response rate=Number of respondents/(Total number in sarupJe..Number ineligible)=341/ (I 00()..110)=38%.

Appendix 43
and the New South Wales population on both finn location and finn size. ~3
Law firm location
8 The distribution of firm location is shown in Table A.l. More suburban and regional law firms and fewer city law firms responded to the survey compared with the sample population. More regional law firms and fewer suburban and city law firms responded to the survey compared with the New South Wales population of small law firms.
TABLE A.1 The cflltrlbution of law firm location in 1994
Firm location Reepondent& Sample population NSW population (May1994)
(n) (%) (n) (%) (n) (%)
Sydney 54 16 288 29 606 23
Suburban 163 48 445 44 1373 52
Regional 124 36 267 27 673 25
Total 341 100 1000 100 2652 100
Firm size
9 The distribution of firm size is shown in Table A.2. No information was available on finn size for the sample population.84 More two-and
33 Finn location: Chi-square test, sample by sample populatioo-x',=25.51, p<O.OI, n=l34l; Chisquare test, sample by New South Wales population- X',=21.37, p<O.Ol, n=2993.
Firm size: Chi-square test, sample by New South Wales population- X',=11.87, p<O.OS, n=2993.
84 Note that we did not ask for this infnrmation from the Law Society of New South Wales in 1994, whereas we did in 1996.

44 Conveyancing fees in a competitive market
three-partner firms and fewer sole practitioners responded to the
survey compared with the New South Wales population of small law
firms.
TABLEA.2 The distribution of law firm size In 1994
No. of principals Respondents NSW population (May 1994)
(n) ('lo) (n) (%)
224 66 1957 74
2 69 20 422 16
3 29 9 157 6
4 11 3 82 3
5 8 2 34
Total 341 100 2652 100
The 1996 survey
I 0 It was critical to keep the methodology of the second survey as similar
as possible to the first, so that the results of the two surveys were
comparable. However, there were two important issues that needed to
be addressed -
• it was vital to increase the response rate to the survey
• it was necessary to modify the questionnaire to incorporate the
changes brought in by the LPRA and to address new areas of interest.
Sample selection
II The Law Society of New South Wales again provided the Justice
Research Centre with a list of all small law firms (ie, five or fewer
principals) in New South Wales, compiled from its membership

Appendix 45
database, as at August 1995, which contained 2744 small firms. As
well as including the firms' names and addresses, the list also included the firms' telephone numbers and the principals' names.
12 Law finns were matched with the 1000 firms selected for the first survey. Any finn that was not located on the list was replaced by a further randomly selected firm with the criteria that the finn had similar characteristics (ie, the firm was the same size and came from the same geographical area).
13 We contacted finns85 by telephone before to the survey to-
• inform firms of the survey and to encourage response • check that the fum practised in the area of conveyancing • check that the address was still current • identify the most appropriate person within the finn to whom to
mail the survey.
14 Any finn that was found to be ineligible (eg because it was no longer in practice, it did not practise in the area of conveyancing, or that was duplicated on the list) or that was not going to participate in the survey for any other reason (eg the firm's principals refused to participate) was also replaced with a randomly selected firm with similar characteristics. These firms were, in tum, contacted before the survey as just described. This process was repeated until we had a final sample of 1000 small firms.
The mail survey
15 The questionnaire was re-designed to incorporate changes brought in by the LPRA and to address new areas of interest. It was pilot-tested on a random sample of 50 law finns in New South Wales in October
85 Where we already had all the relevant information which, in mosl cases, was the flrms that had responde<! to the fusl survey we considered it unnecessary to contact the firm.

46 Conveyancing fees in a competitive market
1995, so that any changes made to the questionnaire were clear and
unambiguous and also to gauge whether we would be successful in increasing the response rate.
16 As with the f1rst survey, the questionnaire was mailed to each of the I 000 firms in February 1996. A letter explaining the study and a letter of endorsement from the Law Society of New South Wales, accompanied the questionnaire. In addition a reply-paid envelope was enclosed to encourage response. The survey was addressed to the person identified in the finn and they were asked to complete the questionnaire for the most recently completed and final billed residential conveyancing transaction.
17 The questionnaire sought similar information as the 1994 survey, that is, information about-
• the finn • the nature of the conveyancing matter • the time spent on the matter • the fees charged to the client • the way in which the fees were calculated.
18 In addition it sought information about-
• the finn's advertising practices • the respondent's views on fees and the LPRA.
19 Firms were asked to return the completed questionnaire by mail (in the reply-paid envelope), fax or DX. Ten weeks were allotted for the return of questionnaires.
20 An intensive follow-up strategy was adopted in the 1996 survey to encourage responses. Two weeks after the initial mail-out a reminder notice was sent out to all the participating firms.86 Two weeks after this a reminder and a second questionnaire were sent out to all those
86 This also served as a "thank you" for those who had aheady responded.

Appendix 47
firms that had not responded. A further two weeks after that telephone calls were made to each firm that had not responded.
21 To encourage responses, an incentive prize (the chance to win a gift voucher from a legal publishing company worth $100) was offered to all those firms that responded.
Response rate
22 Completed questionnaires were received from 592 firms, a response rate of 61%.87 Five questionnaires had to be excluded from aspects of the analysis as they were pre-! July 1994 matters. Table A.3 shows the completion rates. Of the 587 cases 34 were begun during the twelve month transition period of the LPRA between July 1994 and June 1995 where solicitors were still able to use the scale. However this represents only 6% of the matters and therefore should have minimal impact on the results.
87 Response rate=Number of respondentsi(Total number in sample-Number ineligible)= 592/(1237-272)=61%.
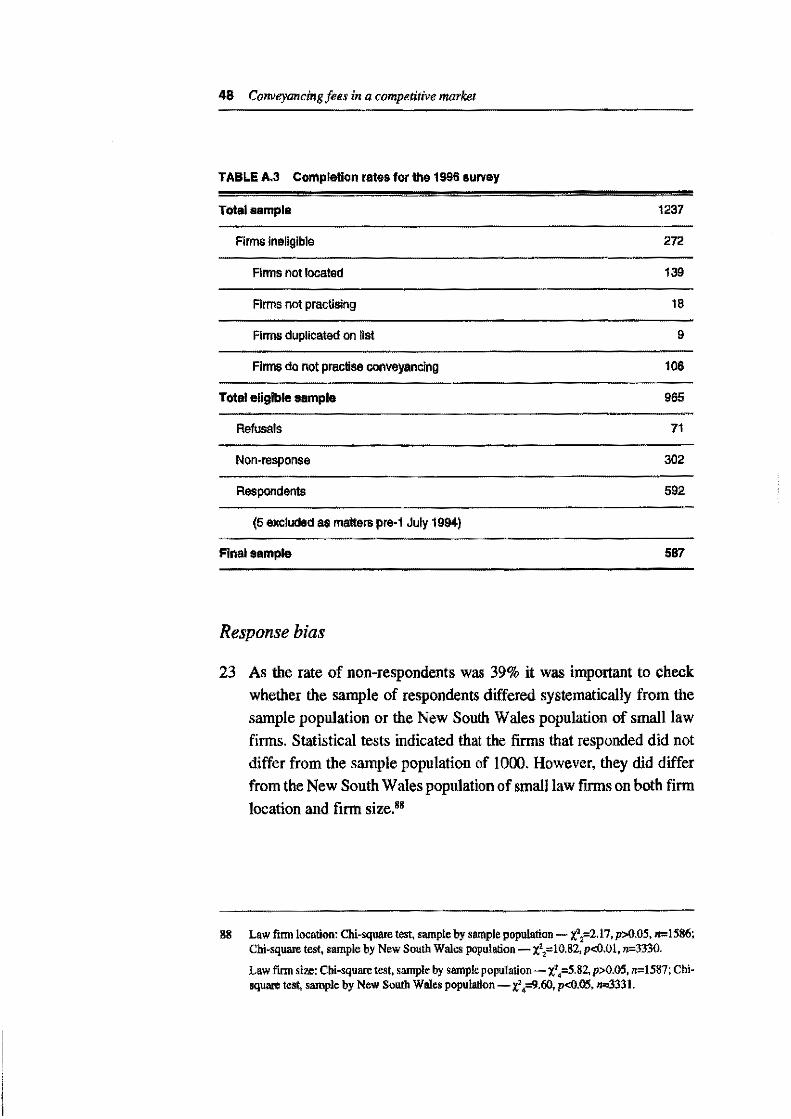
48 Conveyancing fees in a competitive market
TABLE A.3 Complllllon rates for the 1996 survey
Total sample 1237
Firms Ineligible 272
Firms not located 139
Firms not practising 18
Firms duplicated on Hst 9
Firms do not practise conveyancing 106
Total eligible sample 965
Refusals 71
Non· response 302
Respondents 592
(5 excluded as matters pte·1 July 1994)
Final eample 587
Response bias
23 As the rate of non-respondents was 39% it was important to check whether the sample of respondents differed systematically from the sample population or the New South Wales population of small law firms. Statistical tests indicated that the firms that responded did not differ from the sample population of 1000. However, they did differ from the New South Wales population of small law firms on both firm location and firm size. 88
88 Law firm location: Chi-square test, sample by sample population -X' 2=2.17, p>0.05, n= 1586: Chi-square test, sample by New South Wales population- x',=10.82, p<O.OI, n=3330.
Law flmlsize: Chi-square test, sasople by sample population- x',=5.82. p>0.05, n= 1587; Chi· square test, sample by New South Wales population -t4=9.60, p<0.05, n=3331.
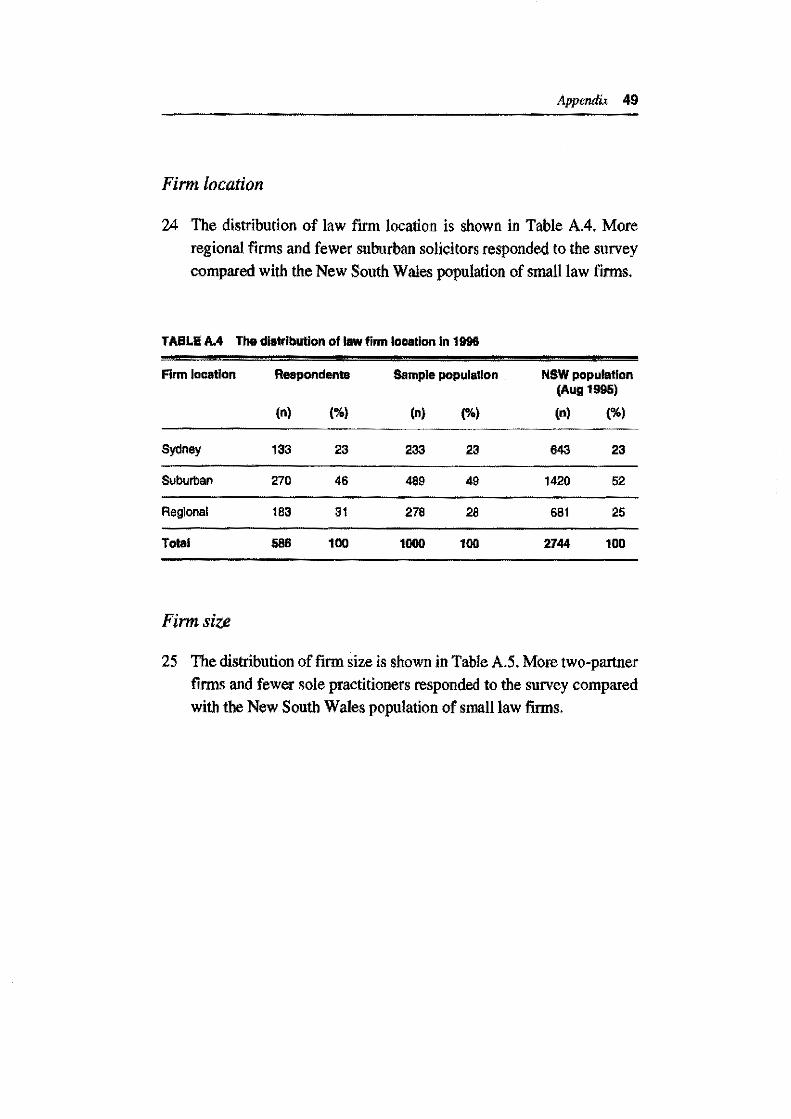
Appendix 49
Firm location
24 The distribution of law firm location is shown in Table A.4. More regional firms and fewer suburban solicitors responded to the survey compared with the New South Wales population of small law firms.
TABLI!AA The distribution of law firm location In 1996
Firm location Respondents Sample population NSW population (Aug 1!195)
(n) (%) (n) (%) (n) (%)
Sydney 133 23 233 23 643 23
Suburban 270 46 489 49 1420 52
Regional 183 31 278 28 681 25
Total 586 100 1000 100 2744 100
Firm size
25 The distribution of firm size is shown in Table A.5. More two-partner firms and fewer sole practitioners responded to the survey compared with the New South Wales population of small law firms.

50 Conveyancing fees in a competitive market
TABLEA.S The distribution of law firm size in 1996
No. of Respondents Sample population NSW population principals (Aug 1995)
(n) (%) (n) (%) (n) (%)
416 71 758 76 2099 76
2 109 19 145 15 383 14
3 37 6 53 5 151 6
4 18 3 30 3 79 3
5 7 1 14 32 1
Total 587 100 1000 100 2744 100
Time allotted for responses
26 As ten weeks were allotted for the return of questionnaires in 1996, it
was also important to check whether this may have biased the results.
The results of a statistical test indicated that the mean fee charged for
the conveyance by firms that responded in the first five weeks were no
different to the mean fee charged for the conveyance by those firms
that responded in the second five weeks. 89 This suggests that the
increased time allotted for the return of questionnaires did not greatly
affect the results.
89 T test, independent samples, fee for conveyance by period of response: 1996- t,26=-0.90, p>0.05, n=251,277.

Appendix 51
2 The sample characteristics
27 Details of the characteristics of the samples involved in the 1994 and 1996 surveys are given here including characteristics of the law firms (firm size and firm location) and characteristics of the matters (whether the matter was rated as typical or not, the property type involved, whether a sale or purchase was involved, whether a mortgage or discharge of mortgage was involved, the duration of the matter- from instructions to settlement, and the property cost). We also compared the characteristics of the two samples, using survey data, rather than population estimates.
28 Figures A.l and A.2 and Tables A.6 and A.7 show the characteristics of the law firms and the matters in the 1994 and 1996 samples of respondents.
FIGURE A.1 Distribution of law firm size in the 1994 and 1996 samples
100
90 +--~··---···----.....-.,
80
70
60
% 50
40
30
20
10
0 1 2 3 4
Number of Principals
[ill 1994
• 1996
5

52 Conveyancing fees in a competitive market
FIGURE A.2 Distribution of firm location in the 1994 and 1996 samples
100
90 1994
80 .1996
70
60
% 50
40
30
20
10
0 Sydney Suburban Regional
Geographical Location

Appendix 53
TABLEA.6 Charactariatice of the conveyancing matters in the IIBillplea
Characteristic 1994 1996 (n) (%) (n) (%)
Property type
Residential dwemng 223 66 385 66
Strata tiUe 83 25 143 24
Vacant land 29 9 59 10
Transacticn type
Sale 128 38 228 39
Purchase 21S 62 356 61
Mortgage/discharge Involved
Mortgage 169 50 275 47
Discharge 72 21 112 19
No mortgage or discharge 99 29 200 34
Matter rated as typical
Yes 241 71 400 69
No 100 29 1!!3 31
TABLE A.7 Mean dura11on and property price"' In the 1994 and 1996 samples
1994 1996
Mean duration 90days 89 days
Mean property price $219,$89 $222,507
90 Property prices are reported in 1996 dollm. The mean property price in 1994 was $200,937 in 1994 doUars,

54 Conveyancing fees in a competitive market
Comparison of the samples resulting from the two surveys
29 The characteristics of the two samples from the two surveys were compared so that valid fee comparisons could be made between the two samples.
30 The samples were compared both for of the characteristics of the law firms that responded and the nature of the matters involved, based on the information available to us. Table A.8 summarises the results of the statistical test~,"' carried out on survey data not population estimates.
Table A.8 Comparison of the samples
Characteristic Similar across the Results of the two surveys or not stslilltlcal tests
Firm
Size ./ z-1.77, p;>O.OS, n=567, 341
Location /( x' ,=6.88, p<:O.os, n=927
Mat\1i!r.il
Property type ./ x',=0.48, p;>0.05, n=922
Sale/purchase ./ x',=0.17, p;>o.os. n=927
Mortgage/discharge ./ x',=2.42, p;>0.05, n=927
Typical ./ x',=0.43, p;>O.os. n=924
Duration ./ t,,~o.os. p;>o.os. n=573,336
Property price ./ t,.,.=O. 19, p;>0.05, n=569,332
91 Cbi-sqoare tests were used for categorical variables. T tests, independent samples and Mann· Wbilney U tests were used fur continuous variables, depending on whether the assumption of equal vnriance was met or not.

Appendix 55
31 The two samples were alike. In particular property price was not different between the two samples. The only characteristic that the samples varied on was law firm location. The distributions of firm location for each survey were shown in Section 1 of the Appendix and in Tables A.l and A.4. More city firms and fewer suburban and regional firms responded to the 1996 survey compared with the 1994 survey.
32 As the characteristics of the samples were so similar we can be reasonably satisfied that valid fee comparisons can be made. We should say, however, that we have only compared the samples on the measures that were available to us. We cannot rule out the possibility that the samples vary on other characteristics that we did not measure.
Comparison of the samples for the law finns that responded to both surveys
33 It was also necessary to compare the characteristics of the matters of the two samples resulting from the law firms that responded to both surveys for reasons similar to those mentioned A.2.1 to ensure that valid fee comparisons could be made between the two samples. The firms have the same characteristics, subject to possible small changes in the number of principals. Again, this section is based on survey data, not population estimates.
34 Table A.9 shows the characteristics of the matters in the sample of law firms that responded to both surveys.92 From the table it can be seen that the characteristics of the matters were similar. The proportions of matters that involved different types of properties, transactions, mortgages and were rated as typical or not were all similar in 1994 and 1996. No statistically significant differences were found between the two samples on duration of the matter, from instructions to settlement,
92 No statistical tests were carried out on the categorical vnriables.

56 Conveyancing fees in a competitive market
or property cost.93 Table A.9 demonstrates that the mean duration and property price were alike.
TABLE A.9 Comparison of the samples for law flrmsthllt responded to both suNeys
Charactsristlca of 1994 1996 the matters (n) (%) (n) (%)
Property type
Residential dwelling 158 68 168 69
Strata tille 58 24 50 20
Vacant land 23 10 26 11
Transaction typa
Sale 95 39 95 39
Purchase 149 61 149 81
Mongaga/dlscharge Involved
Mortgage 116 46 113 46
Discharge 56 23 48 20
Nil 71 29 63 34
Metter rated as tJplcsl
Yes 170 70 169 70
No 74 30 74 30
Mean Mean
Duration 89 days 93days
Property price" $228,147 $224,033
93 Ttest, relared samples:durnlion- t,=0.64, p~.05, n=238; prope!!y COS!- t,,=0.16, p>().05, n=233.
94 Property pri<:es are reported in 1996 dollars. The mean property price in 1994 was $208,964 in 1994 dollars.
Appendix 57
3 Statistical and adjustment procedures
35 Here the statistical and adjustment procedures used on the survey data are described.
Statistical procedures
36 Statistical tests were used to detennine whether there was a difference in means between groups. In general t tests and one-way analysis of variance (ANOV A} were used, depending on the number of groups. These statistical tests are considered to be robust to vio I at ion of the nonnality assumption in large samples, but violations of the equal variance assumption are more of a problem. Thus, where the assumption of equal variance was not met nonparametric tests were used- the Mann-Whitney U test in place of the t ~1 and the KruskaiW allis test in place of the one-way ANOV A.
Consumer Price Index adjustments
37 The data was adjusted to take into account CPI increases between 1994 and 1996 using the Sydney CPI.95 All data measured in dollar values were converted to dollar values as at March quarter 1996 as the second survey was conducted at this time. This was achieved by multiplying dollar values by a CPI factor. The CPI factor was equivalent to the index for the March quarter 1996 divided by the index for the quarter in which a given transaction was finalised.
95 Austmlian Bureau of Statistics, see not11l6. Indices are published for capital cities ooly. No sWewide or regional figures are produced. The national index is an averuge of tbe capital city indices.

58 Conveyancing fees in a competitive market
Calculating population estimates and weighting for law firm location
38 The distributions of law firm location in the survey samples differed from the New South Wales populations of small law firms in 1994 and 1996 and also from each other, as was discussed earlier in this report. The distributions were shown in Tables A.l and A.4.
39 In order to calculate estimates of the variables of interest that reflected all small New South Wales firms, and to make the 1994 and 1996 survey data comparable, we multiplied the relevant survey data by a weighting factor, as shown in Table A.lO.
TABLE A.1 0 Weighting factors
1994 survey 1996 survey
Matters involving city law firms 606/54=11.22 643/133=4.83
Matters involving suburban law firms 1373/163=8.42 1420/270=5.26
Matters involving regional law firms 673/124=5.43 681/183=3.72

Appendix 59
4 Conveyancing fees for different types of conveyancing transactions
40 We examined whether conveyancing fees had changed across different types of transactions, that is, according to the type of property involved and whether a sale or purchase was involved in the transaction.
41 Table A.ll shows the means and the results of the statistical tests for transactions involving different types of properties.96 Table A.l2 provides the same information for transa1.iions involving sales or purchases. Note that survey estimates are provided, rather than population estimates.
42 Table A.ll shows that a statistically significant decrease was found between 1994 and 19% in mean total professional fees and the mean fee charged for the conveyance for transactions for a residential dwelling or strata title. A statistically significant decrease was also found in mortgage fees for transactions for a residential dwelling. No statistically significant difference was found between 1994 and 19% in the mean total professional fees and the mean fee charged for the conveyance for transactions for vacant land.
43 In general no statistically significant difference was found between the 1994 and 1996 surveys in the mean internal disbursements charged. The only exception was for transactions for a strata title where a statistically significant decrease was found. The mean internal disbursements had decreased from $69 in 1994 to $41 in 19%.
44 Table A.12 shows that statistically significant decreases were found between the 1994 and 1996 surveys in mean conveyancing fees for
96 T tests, independent samples and Mann-Wbi!oey U tests were used, depending on whether the assumption of equal variance WliS met or not.

60 Conveyancing fees In a competitive market
both sales and purchases. Mean fees had decreased from 1994 to 1996 on all three rnea.~s of conveyancing fees.
45 Again no statistically significant differences were found between 1994 and 1996 in mean internal disbursements charged for sales or purchases.
TABLE A.11 Conveyancing fees charged In 1994 and 1999 for different typaa of propertiaa - mean fees and raaulta of atatiatical laata
Survey Survey Results of estimate estimate atellslica! testa
1994 mean 1996 mean ($) ($)
Realdentlel dwelling
Total professional fees 1153 954 t..,,=·3.86, 1)<0.01, n-384,219
Fee for the conveyance 1022 694 t...=·2.58, p<:0.05, n-353,203
Fee for the mortgage 170 97 z-4.70, p<:0.01, n-227,138
lntemal disbursements 53 58 1..,=0.97, p:>0.05, n=378,217
Strata title
Total professional fees 1054 897 1,.,=·2.74, p<:0.01, n-141 ,82
Fee for the conveyance 958 827 t,,.=-2.27, p<:0.05, n-122,76
Fee for the mortgage 133 100 t, .. =-1.19, p:>0.05, 11=73,53
Internal disbursements 69 41 z-·2.04, 1)<0.05, n-141,81
Vaeantland
Total professional fses 800 786 f,=-0.14, p:>0.05, 11=57,27
Fee for the conveyance 682 742 t,=O.SO, p:>0.05, n=53,26
Fee for the mortgage 188 75 •• ,=-1.90, p:>0.05, 11=31.16
Internal disbursements 49 43 1,=·0.53, p:>0.05, n=58,26

Appendix 61
TABLE A.12 Conveyancing,_ charged in 1994 and 1996 for salee and purchasaa - mean feu and results ol etatiatical taets
Survey Survey Raaultsof aatimets estimate atatiatlcal teats
1994mean 199Bmean ($) ($)
Sale
T otaJ professional fees 988 871 t,.,.-2.54, !)<0.05.11=226,125
Fee lor the conveyance 918 825 ~ .. ~2.09, !)<0.05, n=212,121
Fee for the mortgage 136 !10 t,.,~.17, p<:0.01, n-97,66
Internal disbursements 61 60 1,..=·0.21, !)>0.05, 11=224.121
Purchase
Total professional fees 1162 957 t.,.=-3. 77' !)<0.01' n=355,209
Fee for the conveyance 1010 889 1,•·2.30, p<:0.05, n-315,190
Fee for the mortgage 171 102 Z=·4.02, p<:0.01, llo<234, 147
Internal disbursements 54 48 ~,. ... 1.47, p;>0.05, /lo<352,209
62 Conveyancing fees in a competitive market
5 The factors related to conveyancing fees
46 The relationship between the characteristics of the transactions and
conveyancing fees were examined in each survey. The measure used
for conveyancing fees in this context was the fee for the conveyance.
This was to reduce the variation created by whether a mortgage or a
discharge was involved or not. For example, properties of higher value
may be more likely to involve a mortgage - and possibly total
professional fees may be higher for matters for properties of higher
value because of the mortgage fee.
47 Table A.l3 summarises the results of the statistical tests.97 Note that
statistical tests were carried out on survey data, not population
estimates.
48 Only one factor was found to be consistently related to the fee for the
conveyance in both the 1994 and 1996 surveys- property price. This
relationship was discussed in paragraphs 64 to 68 of this report.
49 Other factors were found to be related to the fee for the conveyance in
either the 1994 survey or the 1996 survey, but not in both.
50 In the 1994 survey, whether the matter was "typical" or not and the
property type were found to be related to the fee for the conveyance.
51 The mean fee charged for the conveyance for matters rated as "not
typical" ($1117) were found to be higher than the mean fee charged
for the conveyance for matters rated as "typical" ($918).
52 The mean fees charged for the conveyance for matters for a residential
dwelling ($1 022) or strata title ($958) were found to be higher than the
mean fee charged for matters for vacant land ($682).
97 One· way analysis of varianoe, t tests, independent samples, and Mann· Whitney U tests were used, depending on the number of groups and whether the assumption of equal varianoe was met or not. Correlation coefficients were used in the case of two continuous variables.

Appendix 63
53 In the 1996 survey duration of the matter and the number of hours
spent on the matter were found to be related to the fee for the
conveyance. Fees were found to increase as the duration of the matter
increased. This relationship was statistically significant, but it was a
weak relationship. The fee for the conveyance was also found to
increase as the number of hours spent on the matter increased. It may
not have been possible to detect this relationship in the 1994 survey as
information on the number of hours spent was available in very few
matters. Alternatively no relationship may have existed due to the extensive use of scales and the consequent rarity of time recording in
this area of practice.
54 Other factors were not found to be related to the fee for the conveyance
in either survey.
TABLE A.13 Summary of statistical testa of relationships between the fee for the conveyanca and tha characteristics of the transactions
Characteristic 1994 of transactions survey
Property type ,/
Sale/purchase lC
Mortgage/discharge involved lC
Typical
Duration of matter lC
Property price
Hours spent on matter
1996 survey
lC
lC
lC
lC
Results of the statistical tasta
1994: 1,,,.,,=5.45, p<0.01,1!=305
1996: 1,,,.,=2.40, P>0.05, 11=528
1994: ~,.=1.57, P>0.05,n=190,121
1996: ~.=1.39, P>0.05,n=315,212
1994: ~,.=·0.94, p:>O.OS, 11=212,98
1996: ~ •• =0.34, p:>0.05, n=331,197
1994: Z=-2.60, p<0.01, 11=311
1996: Z=-1.58, P>0.05, n=524
1994: r=-0.02, p:>0.05, 1!=307
1996: r=0.10, p<0.05, n=516
1994: r=0.43, p<0.01, n=304
1996: r=0.72, p<0.01, n=512
1994: r=0.22, p:>O.OS, n=46
1996: r=0.53, p<0.01, 1!=500
Other publications in this series
TW Beed, RW Fitzgerald and D Worthington The Role of Conciliation ( 1990)
TW Beed and R1 McEwin Lawyers in Civil litigation (1990)
D Worthington The Pace of Litigation in New South Wales (1991)
E Rasink Demands on the Compensation Court: Preliminary TluJughts and
Suggestions for Empirical Research (1993)
E Rasink Investigation into the Resources of the Dust Diseases Tribunal (1993)
T Matruglio So W1w Does Use the Court? (1993)
D Worthington and J Baker The Costs of Civil Litigation (1993)
J Baker Who Settles And Why? (1994)
T Matruglio Plaintiffs and the Process of Litigation - and Technical Appendices (1994)
D Worthington Compensation in an Atmosphere of Reduced Legalism (1994)
D Worthington and M Delaney Awards made under the Motor Accidents Act 1988(1995)
T Matruglio and J Baker An Implementation Evaluation of Differential Case Management (1995)
C Guest and T Murphy Economic Evaluation of Differential Case Management (1995)
T Matruglio Case Management- Rolling Lists in the Family Court: Sydney Registry (1996)
M Cunningham and T Wright The Prototype Queensland Access to Justice Monitor (1996)
M Delaney and T Wright Plaintiffs' Satisfaction with Dispute Resolution Processes ( 1997)

The Justice Research Centre
The Justice Research Centre was founded by the Law Foundation of New South Wales in 1989, as the Civil Justice Research Centre. The Centre acquired its new name in 1996, when the Board of Governors of the Foundation decided that its work should be expanded from civil to justice system issues more generally.
Our mission is to support effective justice system reform, through high quality research. Today, the Centre is recognised nationally and internationally for influential research characterised by an interdisciplinary, empirical approach to public policy issues, and rigorous standards of quality, objectivity and independence.
The Centre's research program is broadly focussed, examining issues such as the delivery of legal services and the operation of the legal services market, court processes and dispute resolution, accident compensation, and court and justice system performance.
The Justice Research Centre receives core funding from the Law Foundation of New South Wales. The additional revenue it needs for its operations comes from grants and donations from government and private sector organisations.
Advisory Board
The Hon Justice Ronald Sackville Federal Court of Australia
The Hon Justice Margaret Beazley New South Wales Court of Appeal

David Bowen Assistant Director, Policy and Legislation, NSW Attorney-General's Department
The Hon Justice Sally Brown Family Court of Australia
Dr Janet Chan Associate Professor, School of Social Science and Policy, UNSW
Professor Hilary Charlesworth Faculty of Law, University of Adelaide
David Fairlie Governor, Law Foundation of NSW and Partner, Mallesons Stephen Jaques
Isobel Holthouse Senior Counsel, NRMA Insurance
Professor Marcia Neave Faculty <if Law, Monash University
Clare Petre Assistant Commonwealth Ombudsman
Bret Walker S.C. Governor, Law Foundation of NSW and President-elect, Law Council of Australia
Dr Don W eatherburn Director, NSW Bureau of Crime Statistics and Research
Professor David Weisbrot Dean, Faculty of Law, University of Sydney

Staff
Director Professor Ted Wright BSc LLB MA
Research Joanne Baker BSc (Hons) Mary Cunningham BA LLB (Hons} Marie Delaney BA MA Tania Matruglio BA MA
Administration Nuria Rodriguez Lucy Smink LLB (Amsterdam)