cooked mid-day meal (cmdm) - planning commission evaluation of cooked mid-day meal (cmdm) programme...
TRANSCRIPT

Performance Evaluation
Of
Cooked Mid-Day Meal (CMDM)
Programme Evaluation Organisation
Planning Commission Government of India New Delhi – 110001
May 2010
Social Development Intervention

Table of Contents
I. Preface II. Summary and Findings III. Highlights
EVALUATION STUDY ON COOKED MID DAY MEAL (CMDM)
CHAPTER PLAN
S.no Chapter Page no.
I. Introduction……………………………………………………………………………..1 1) National Programme for Nutrition Support to Primary Education 2) Objectives of the Scheme 3) Implementation Mechanism as per guidelines 4) Norms for allocation of funds & foodgrain as per guidelines 5) Need for the Evaluation study
II. Objectives and Methodology……………………….............................................8
1) Objectives of the study 2) Sampling Framework 3) Selection of States 4) Selection of Districts 5) Selection of Blocks 6) Selection of Schools 7) Selection of Villages 8) Selection of Beneficiary Students 9) Selection of Parents/Guardians of Sample Students 10) Selection of Drop outs 11) Selection of Out of School Children 12) Selection of Focus groups 13) Qualitative Notes 14) Reference period 15) Data Collection 16) Data Processing

III. Beneficiary, Dropouts and Out of School children…………………………….13
1) Beneficiary Children 2) Dropout Children 3) Out of School Children
IV. Coverage, Implementation Mechanism and Infrastructure……………………22
1) Coverage of CMDM 2) Flow of Funds and Flow of Foodgrain 3) Implementation Mechanism across states 4) Steering-cum-Monitoring Committees 5) Utilisation of Funds 6) Utilisation of Foodgrain 7) Role played by Panchayati Raj Institutions 8) Linkages with other Departments 9) Infrastructure 10) Manpower
V. Impact of the Cooked Mid Day Meal Scheme……………………………………51
1) Classroom Hunger 2) Fresh Enrolments 3) Social Equity 4) Attendance 5) Retention 6) Dispossession time of teachers 7) Dispossession time of students
VI. Suggestions and Recommendations……………………………………………...62
Bibliography……………………………………………………………………..……..67
Annexures I, II

Preface
The National Programme of Nutritional Support to Primary Education which is
popularly known as the Mid-day Meal Scheme was launched by the Government of India
in 1995 with the objective of giving a boost to universalisation of primary education by
increasing enrolment, attendance and retention and simultaneously improving the
nutritional status of students in primary classes. Accordingly, many of the states started
distributing foodgrains (dry rations) @ 3 kg. / per month/ per child with 80% attendance in
class. The Cooked mid-day meal (CMDM) scheme was introduced in all Government and
Government-assisted primary schools in the form of a country-wide “Day of action on
mid-day meals” in April 2002 by a landmark direction of the Supreme Court. In 2004, the
Union Ministry of HRD, Department of Elementary Education and Literacy revised the
guidelines for the scheme prescribing supply of meal with 300 calories and 8-12 grams of
protein. The Ministry again revised the scheme in September 2006 to provide cooked
mid-day meal with 450 calories and 12 grams of protein content to all children in primary
classes (I-V) in the country.
The main objectives of the evaluation study were to assess the coverage of
children under CMDM, availability of infrastructure for implementation of CMDM,
improvement in attendance, retention and nutritional status of children and to assess the
extent to which CMDM has succeeded in achieving the objectives. The study tried to find
out the impact of CMDM on teaching and learning activities in schools, involvement of
various agencies and constraints in implementation of the scheme at various levels.
However, information on nutritional status could not be captured from the available data.
To assess the process and outcome indicators underlying the objectives of the
study, both primary and secondary data were collected through schedules structured for
9 different levels (State, District, Block, Village, School, Parent, Beneficiary, Out- of-
school and Drop out children) of sample units by adopting a multistage random sampling
method. A total of 48 districts and 480 schools across 17 states were covered. In addition
to the primary data collected from various levels, Focus group discussions were also held
and qualitative notes prepared to analyze the qualitative aspects of the scheme at the
grassroot level.

Summary and Findings
The National Programme for Nutrition Support to Primary Education (NP-NSPE) was
launched as a Centrally Sponsored Scheme on 15th August 1995 and extended to all
blocks of the country by the year 1997-98. The Cooked Mid-Day Meal (CMDM) was
introduced in all government and government-aided primary schools in April 2002.
CMDM scheme proposed to supply meal containing 300 calories and 8-12 grams of
proteins to all children studying in classes I to V in government and government
aided schools and Education Guarantee Scheme (EGS) / Alternative and Innovative
Education (AIE) centres w.e.f. September, 2004 (revised to 450 calories and 12
grams of protein with adequate quantities of micronutrients like iron, folic acid, and
vitamin-A etc. w.e.f. June, 2006). It aspires to boost the universalisation to primary
education by increasing enrolment, attendance and retention and simultaneously
boost the nutritional status of students in primary classes.
Evaluation Issues
The evaluation study was designed to reflect on the following issues:-
• to assess the extent of coverage of CMDM;
• to understand and examine the supply chain and processes that are
involved in implementation of CMDM;
• to assess the availability and adequacy of infrastructural facilities including
manpower for implementation of cooked mid-day meal scheme and also for
providing universal education to the children at primary stage;
• to assess the extent to which CMDM has succeeded in achieving its
objectives of making a positive impact on enrolment, attendance, retention
and nutritional status of children of primary stage;
• to assess if CMDM has had any adverse effect on teaching/ learning
activities in the schools;
• to assess the extent to which CMDM is relevant to the target group;
• to assess the extent to which community participation and social equity are
achieved;

• to study the intervention means and strategy adopted for the implementation
of CMDM, and
• to understand the constraints faced in implementation of the scheme and
suggest remedial measures to overcome such constraints.
Study Design
The study covered 17 states and 48 districts. Two blocks from each district were
selected. Five schools from each block was selected. A village where the sample
school was located stood selected as sample village for canvassing the schedules.
From each school/centre 10 beneficiary students (5 boys and 5 girls) and their
respective parents were selected. Further a dropout and three out of school children
from the village were also selected randomly. From a block, a minimum of two and a
maximum of three, main focus groups were chosen. Qualitative notes were taken to
fill in the gaps.
Findings
• The study shows almost universal coverage of the scheme in states like
Andhra Pradesh, Madhya Pradesh etc. (Table 4.1)
• About 40 percent parents of the beneficiary children belong to the OBC
category, 23 percent come from the SC category, 12 percent come from ST
category and 24 percent belongs to the Other’s category, which indicates an
achievement of social equity (para 3.1.2).
• 33 percent of the parents of the beneficiary children are illiterates and 17
percent have studied till matric and above (para 3.1.3).
• A majority of sample schools in Bihar, Jharkhand, Meghalaya, Andhra
Pradesh, Arunachal Pradesh and Karnataka denied involvement of Gram
Panchayats in the scheme. (para 4.7.2)

• In all the sample states, except Andhra Pradesh and Karnataka, no
established linkage was observed with the Health Department (para 4.8)
• Although Steering –cum – Monitoring Committees have been constituted at
all levels, they are not holding any regular meetings to co-ordinate and
monitor the programme at the block/village level. (para 4.4)
• All the sample schools in the states of Arunachal Pradesh, Bihar, Haryana,
Karnataka, Kerala, Meghalaya and Tamilnadu have their own buildings. (para
4.9.1)
• In a majority of sample states, except for Bihar and West Bengal, more than
80 percent of sample schools had pucca buildings. (para 4.9.1)
• On average, 72% of the sample schools were reported to have toilet facility
(para 4.9.1)
• Except for Tamilnadu and Kerala, in rest of the states a majority of sample
schools, on an average, suffer from the unavailability and poor functional
condition of kitchen sheds. (para 4.9.2)
• All the states suffer from the unavailability and poor functional condition of
store rooms. The condition is marginally better in Tamilnadu. (para 4.9.3)
• All the states, except for Bihar and Rajasthan, have reported poor availability
of tumblers. Except for Rajasthan, all the states have reported a poor
availability of plates. (para 4.9.4)
• In the states of Andhra Pradesh, Arunachal Pradesh, Jammu & Kashmir,
Jharkhand, Maharashtra, Meghalaya and West Bengal less than 75 percent
of the sample schools have access to drinking water. (para 4.9.5)
• Except for Kerala and Andhra Pradesh, there is a serious shortage of cooks
for CMDM in the sample schools across the country (para 4.10).

• It has been observed that most of the states do not follow the guidelines of
Government of India to deliver the foodgrain at the school point by PDS
dealer resulting in leakage in the supply of foodgrain (para 4. 2).
• Selected districts in Uttar Pradesh, Tamilnadu and Meghalaya have utilized
all the funds allotted to them. In contrast, some of the sample districts in
Haryana, Jharkhand and Himachal Pradesh have utilized less than half the
funds allocated to them. (para 4.5.1).
• The scheme has been successful in eliminating classroom hunger as a
majority of sample beneficiaries have reported that the meal available at
school is adequate (para 5.1).
• A large proportion of children (in sample schools) in Andhra Pradesh,
Arunachal Pradesh, Himachal Pradesh, Jammu & Kashmir, Maharashtra and
Tamil Nadu were of the opinion that the meals provided were of good quality.
A large proportion of children (in sample schools) in Karnataka and Bihar
were of the opinion that food served was of average and bad quality,
respectively. (para 5.1.1)
• It has been observed that CMDM was able to bring together children from
different communities in almost all the states and was thus able to achieve
the objective of social equity to a considerable extent. (para 5.2)
• In most of the states teachers spend about one to two hours daily on activities
related to CMDM thereby reducing precious teaching time (para 5.6.2)
• Out of the 17 sample states where the data was collected, students in 9
states reported that they were involved in washing utensils. (para 5.5.1).

HIGHLIGHTS
The Cooked Mid Day Meal Program has been successful in
addressing classroom hunger in sample schools.
Cooked Mid Day Meal is reported to have created a platform for
children of all social and economic backgrounds to take meals
together, thereby facilitating achieving the objective of social equity.
It has also been observed that the programme has resulted in the
diversion of the attention of teachers and students on activities related
to it, rather than towards teaching and learning activities, which results
in loss of studies.
In general, visible shortage of basic infrastructural facilities and
manpower (that are crucial for the success of the Cooked Mid Day
Meal programme) were noted.
Most of the states, it was observed, did not follow the guidelines of
Government of India to deliver foodgrains at the school point by PDS
dealer, thereby resulting in the leakage of foodgrain. There have been
instances where due to long supply chain, foodgrain supplied got
adulterated and pilfered.
While Cooked Mid-Day Meal Scheme seems to have contributed to an
increase in the attendance in schools across the country, it does not
seem to have any significant impact on fresh enrolments in sample
schools.
******************

Chapter 1
INTRODUCTION
National Programme for Nutrition Support to Primary Education1
1.1.1 The National Programme of Nutritional Support to Primary Education (NP-
NSPE) was launched as a Centrally Sponsored Scheme on 15th August 1995,
initially in 2408 blocks in the country. By 1997-98 it was introduced in all blocks of
the country. It was further extended in 2002 to cover children studying in EGS
and AIE centres. Central Assistance under the scheme consisted of free supply
of food grains @ 100 grams per child per school day, and subsidy for
transportation of food grains up to a maximum of Rs 50 per quintal.
1.1.2 In September 2004 the scheme was revised to provide cooked mid day
meal with 300 calories and 8-12 grams of protein to all children studying in
classes I – V in Government and aided schools and EGS/ AIE centres. In
addition to free supply of food grains, the revised scheme provided Central
Assistance for (a) Cooking cost @ Re 1 per child per school day, (b) Transport
subsidy was raised from the earlier maximum of Rs 50 per quintal to Rs. 100 per
quintal for special category states, and Rs 75 per quintal for other states, (c)
Management, monitoring and evaluation costs @ 2% of the cost of foodgrains,
transport subsidy and cooking assistance, (d) Provision of mid day meal during
summer vacation in drought affected areas.
1.1.3 In July 2006 the scheme was further revised to provide assistance for
cooking cost at the rate of (a) Rs 1.80 per child/school day for States in the North
Eastern Region, provided the NER States contribute Rs 0.20 per child/school
day, and (b) Rs 1.50 per child/ school day for other States and UTs, provided that
these States and UTs contribute Rs 0.50 per child/school day.
1.1.4 In October 2007, the scheme has been further revised to cover children in
upper primary (classes VI to VIII) initially in 3479 Educationally Backwards
1 Ministry of Human Resource and Development, Government of India
1

Blocks (EBBs). Around 1.7 crore upper primary children were included by this
expansion of the scheme.
Objectives of the Scheme2 1.2 Cooked mid day meal is the popular name for the school meal programme
which involves provision of lunch –free of cost to school children on all school
days. The scheme was launched with the following objectives in mind:
• To address hunger in schools by serving hot cooked meal.
• To improve nutritional status of children.
• To encourage poor children, belonging to disadvantaged sections,
to attend school more regularly and help them concentrate on
classroom activities, thereby increasing the enrolment, retention
and attendance rates
Launch of the Mid Day Meal Scheme across states
1.3 Prior to the formal launch of the Cooked Mid Day Meal programme, the
practice of providing meals in schools was present in several states. The table
no. 1.1 below summarizes in chronological order the launch of mid day meal in
different states:
Table No. 1.1
Name of States
Year of launching of MDM
Glimpses
Tamil Nadu 1923 Started in Madras City by Madras Municipal Corporation & extended to full State in 1982.
West Bengal
1928 Started in Calcutta city by Keshav Academy of Calcutta as compulsory Mid-day Tiffin on payment basis at the rate of four annas per child per month.
Maharashtra 1942 Started free mid day meal in Bombay. It was launched in 1995-96 as a centrally sponsored scheme.
Karnataka 1946 Started in Bangalore city to provide cooked rice and yoghurt. There was provision of giving 3 kg of rice/wheat per month /per child who had 80% or more attendance in 1995. Cooked meal was started in 7 north eastern districts during 2002-03.
2 Ministry of Human Resource and Development, Government of India
2

Uttar Pradesh
1953 It introduced a scheme on voluntary basis to give boiled gram, ground-nut, puffed rice and seasonal fruits.
Kerala 1960 Scheme had been funded by CARE (Cooperate American Relief Everywhere) under US Assistance during the period 1960-1983 (in a pilot manner).
Bihar 1995 Started with dry ration of 3 kg /per student /per month and started providing cooked meal in 30 blocks of 10 districts in 2003-04
Andhra Pradesh
1995 There was provision of giving 3 kg of rice/wheat per month per child with 80% or more attendance in school.
Madhya Pradesh
1995 Initially dry rations or Dalia was provided.
Rajasthan 1995 Students of Government Primary schools were provided wheat at the rate of 3 kg/ per student /per month
Arunachal Pradesh
1995 Initially only dry ration was provided in five districts of the state, extended to all schools since 2004.
Punjab 1995 Students of Government Primary schools were provided wheat at the rate of 3 kg per student/ per month and switched over to cooked meal in one block of every district in 2002-03.
Haryana 1995 Initially implemented in 17 blocks of 6 districts & extended to 44 blocks where female literacy rate was lower than the national level in 1996-97.
Himachal Pradesh
1995 Initially dry ration was provided
Jammu & Kashmir
1995 Initially dry ration was provided
Meghalaya 1995 Started with dry ration of 3 kg per student /per month.
Jharkhand 2003 It was taken up on a pilot basis in 3140 government primary schools in 19 districts initially.
Implementation Mechanism as per guidelines
1.4 The programme guidelines prescribe the following implementation mechanism:-
i. A National Steering-cum-Monitoring Committee (SMC) to be set up at the
national level to monitor the programme, assess its impact, coordinate among
concerned departments and agencies and to provide policy advice to Central
and State Governments. After submission of their Annual work plan by
States/UTs, the Programme Approval Board releases central assistance bi-
annually.
ii. States and UTs are also required to set up Steering-cum-Monitoring
Committees (SMC) at the State/District/Block levels to monitor
implementation of the programme. Every State Government/UTs has to
authorize one of its departments as the nodal department to take overall
3

responsibility for implementation of the programme and Implementation cells
are required to be set up by nodal department to watch over the
implementation of the programme at the school level.
iii. One nodal officer to be appointed at the district and block level is to be
assigned the overall responsibility of effective implementation of the
programme at the district/block level.
iv. The Panchayats/ Urban Local Bodies to be in charge of the implementation of
the programme in states where primary education is entrusted to them.
v. Gram Panchayat/ Municipality to be accountable for implementation and day
to day supervision of the programme at the local level.
vi. Gram Panchayat/ Municipality may assign the supervision of the programme
at school level to the Village Education Committee (VEC)/School
Management and Development Committee (SMDC) or Parent Teacher
Association (PTA), as the case may be, to be accountable to the Gram
Panchayat / Municipality.
vii. Cooking and supply of meal is to be entrusted to Local women’s/Self Help
Groups/ Local youth clubs affiliated to the Nehru Yuvak Kendras/ Voluntary
Organizations or personnel engaged by VEC/SMDC/PTA/Gram
Panchayat/Municipality.
viii. In Urban areas where a centralized kitchen exists for a group of schools,
cooking may be undertaken in that centralized kitchen and cooked hot meal
transported to various schools.
Chart 1.1 Implementation Mechanism as per Guidelines
4

Government of India, Ministry
of Human Resource Development National SMC
State Government
Nodal Department
State Level SMC
Programme Approval Board
District Level SMC
District
Nodal Officer
Block
Nodal Officer
Generally District Magistrate
SMC
Gram Panchayats/ULB
VEC / SMP / PTA
Engaged by VEC Centralized Kitchen
School
5

Norms for allocation of funds & foodgrain as per guidelines 1.5 Guidelines for the programme have been revised on various occasions.
Table 1.2 contains the norms for allocation of funds and foodgrain as per the
guidelines.
Table 1.2 Norms for allocation of funds and food grains
Items CMDM, 2002 CMDM, 2004 CMDM, 2006Nutritional Contents
Calories Not Prescribed 300 450 Proteins Not Prescribed 8-12 grams 12 grams Micronutrients Not Prescribed Not Prescribed Adequate quantities
of iron, folic acid, Vitamin-A etc.
Transport Subsidy
Rs. 50 per quintal with Hill Transport Subsidy
Rs. 100 per quintal for N-E States & Rs. 75 per quintal for other States & UTs
Rs. 100 per quintal for N-E States & Rs. 75 per quintal for other States & UTs
Subsidy against cooking cost
Not Provided Re. 1.00 per child per school day
Rs. 1.80 per child per school day for N-E States & Rs. 1.50 per child per school day for other States and UTs
Subsidy for Management, Monitoring and Evaluation(MME)
Not Provided 1.8 % of total Assistance (Free food, transport cost & cooking cost)
1.8 % of total Assistance (Free food, transport cost & cooking cost )
Infrastructural Assistance
Construction of Kitchen-cum-Store
Not Provided Convergent with SGRY, NSDP & UWEP programmes
Maximum of Rs. 60,000 per unit in addition with other programmes
Drinking water facility
Convergent with SSA, ARWSP & Swajaldhara programmes
Convergent with SSA, ARWSP & Swajaldhara programmes
Kitchen Devices Rs. 2000/- under SSA Prorgrammes
Rs. 5000/- per school per annum
Need for Evaluation study
6

1.5 In July 2006, the Department of Elementary Education and Literacy,
Ministry of HRD referred to the Planning Commission a direction of the Cabinet
Committee on Economic Affairs (CCEA) for evaluation of this centrally sponsored
programme with the view to further improving performance and meeting the
nutritional requirements of the beneficiary children. Accordingly, its evaluation
was put on the prioritized list of evaluation studies to be done by the PEO. This
study has tried to examine the implementation process and the impact of the
cooked mid day meal consequent to revisions of the scheme over a period of
time. Further, its implementation has undergone various changes over the years.
Studies taken up by other organizations/ agencies mainly focused on the
quantitative aspects while this evaluation study has tried to give a direction to
guide the policy makers and implementers not only in the quantitative aspects,
but also on the qualitative aspects of impact of the scheme i.e. nutritional
improvement and social equity among the beneficiaries.
7
CHAPTER II
OBJECTIVES AND METHODOLOGY
Objectives of the evaluation study 2.1 The following objectives were kept in mind while designing the evaluation
study:
• to assess the extent of coverage of CMDM;
• to understand and examine the supply chain and processes that are
involved in implementation of CMDM;
• to assess the availability and adequacy of infrastructural facilities including
manpower for implementation of cooked mid-day meal scheme and also for
providing universal education to the children at primary stage;
• to assess the extent to which CMDM has succeeded in achieving its
objectives of making a positive impact on enrolment, attendance, retention
and nutritional status of children of primary stage;
• to assess if CMDM has had any adverse effect on teaching/ learning
activities in the schools;
• to assess the extent to which CMDM is relevant to the target group;
• to assess the extent to which community participation and social equity are
achieved;
• to study the intervention means and strategy adopted for the implementation
of CMDM and
• to understand the constraints faced in implementation of the scheme and
suggest remedial measures to overcome such constraints.
Sampling Frame 2.2 Primary and secondary information was collected to test the various
parameters inherent in the objectives. The sampling frame consists of States,
Districts, Tehsils /Blocks, Villages, Schools and Households and each unit of
sampling frame is selected by using a multistage stratified sampling method.
8

Selection of States 2.2.1 Seventeen states viz; Bihar, Jharkhand, Uttar Pradesh, Rajasthan, Andhra
Pradesh, Madhya Pradesh, Karnataka, West Bengal, Tamil Nadu. Himachal
Pradesh, Maharashtra, Kerala, Punjab, Haryana, Jammu & Kashmir,
Meghalaya and Arunachal Pradesh were selected through stratified random
sampling.
Selection of Districts
2.2.2 While selecting the districts from each State the criteria provided in Table
2.1 was adopted: Following the stratified sampling method and using literacy rate
as the stratifying parameter, 48 districts were selected. The list of the selected
districts is provided in Table 2.2
Table 2.1 Method for Selection of districts
State with number of districts No. of Districts selected <15 2
16 to 30 3 > 30 4
Table 2.2 List of Selected States and Districts:
S.No. State Selected Districts 1. Andhra Pradesh Adilabad, Srikakulam, Anantapur and West
Godavari 2. Arunachal Pradesh Lohit and Tirap 3. Bihar Madhubani, Pashchim Champaran, Rohtas and
Madhepura 4. Himachal Pradesh Kangra and Kullu 5. Haryana Hissar and Jhajjar 6. Jammu & Kashmir Udhampur 7. Jharkhand Ranchi, Dumka and Bokaro 8. Karnataka Tumkur, Bijapur and Bidar 9. Kerala Thiruvananthapuram and Kannur 10. Madhya Pradesh Sagar, Shahdol, Vidisha and Indore 11 Maharashtra Solapur, Sangli, Nagpur and Washim 12 Meghalaya East Khasi Hills and Jaintia Hills 13. Punjab Kapurthala and Firozepur 14 Rajasthan Churu, Jhunjhunu, Bikaner and Jaisalmer 15. Tamil Nadu Dharmpuri, Tirunelveli and Virudhnagar 16. Uttar Pradesh Sitapur, Badaun, and Jalaun 17. West Bengal East Medinipur, North 24 Parganas and Birbhum
9

Selection of Blocks 2.2.3 Two blocks from each district were selected. In total 96 blocks were
selected. Average literacy rate of the sample district was taken as the stratifying
parameter for dividing the total number of blocks of the sample district into two
strata i.e. (a) blocks with literacy rate equal to or above average district literacy
rate and (b) blocks with literacy rate below the average district literacy rate. Care
was taken to arrange the blocks in each stratum alphabetically so that one block
from each stratum is selected randomly.
Selection of Schools 2.2.4 From a list of all types of schools and centres which were maintained in a
sample (selected) block, 5 schools/centres were selected by selecting one
school/centre from each type of schools/centres. However, in the case of non-
availability of any other category of schools/centres (Government aided, EGS
and A&IE centre) other than Government or local body schools/centres, the
shortfall in the required sample of 5 schools/centres was made up from the
remaining other available types of the schools/centres by giving appropriate
representation in proportion to their respective numbers in the total. Thus 480 sample schools were selected. This is illustrated in the following table:
Table 2.3
Selection procedure for sample schools/centres No. Likely situation of different categories
of schools/centres with total Nos. Proportionate selection of sample schools/centres
Total
Govt. School
Aided School
Local body
A&IE EGS Govt. School
Aided School
Local body
A&IE EGS
1. 100 75 25 NA NA 2 2 1 0 0 5 2. 100 NA NA 50 50 3 0 0 1 1 5 3. 100 NA 25 25 25 2 0 1 1 1 5 4. 100 25 NA NA 25 3 1 0 0 1 5 5. 100 100 100 100 100 1 1 1 1 1 5 6. 100 75 50 25 10 1 1 1 1 1 5
Selection of Villages 2.2.5 The village where the sample school was located stood selected as
sample village for canvassing the schedules.
10
Selection of Beneficiary Students 2.2.6 From each school/centre, 10 beneficiary students (5 boys and 5 girls)
were selected randomly by giving a minimum representation to one boy and one
girl beneficiary from each standard i.e. 1st to 5th. In case of non-availability of a
girl student in any of the classes in a co-educational school/centre, the shortfall
was made up from boys. Thus 4800 beneficiary students were selected. Selection of Parents/Guardians of Sample Students 2.2.7 From the same sample school/centre, parents/guardians of ten sample
beneficiary students were selected for canvassing the parent/guardian
schedules.
Selection of Drop outs
2.2.8 From each village where the sample school/centre was located, two drop-
outs preferably one boy and one girl were selected. In case of non-availability of
a girl child, substitution was done from boys, subject to his being a drop out of
the school/centre from any one of the standards (1st to 5th) and having left the
school/centre after the relevant years of implementation of the scheme.
Selection of Out of School Child 2.2.9 From each sample village, 3 out of school children were selected
randomly.
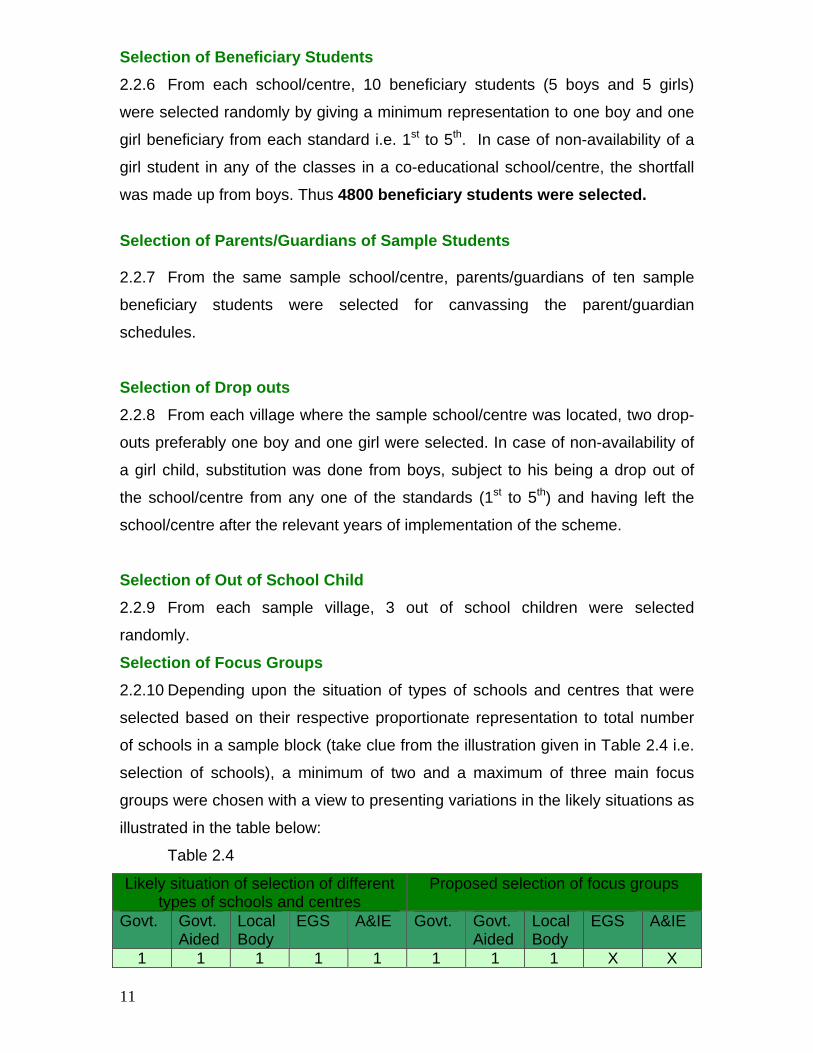
Selection of Focus Groups
2.2.10 Depending upon the situation of types of schools and centres that were
selected based on their respective proportionate representation to total number
of schools in a sample block (take clue from the illustration given in Table 2.4 i.e.
selection of schools), a minimum of two and a maximum of three main focus
groups were chosen with a view to presenting variations in the likely situations as
illustrated in the table below:
Table 2.4
Likely situation of selection of different types of schools and centres
Proposed selection of focus groups
Govt. Govt. Aided
Local Body
EGS A&IE Govt. Govt. Aided
Local Body
EGS A&IE
1 1 1 1 1 1 1 1 X X
11

2 1 2 NA NA 1 1 1 X X 5 NA NA NA NA 2 X X X X
NA NA 5 NA NA X X 2 X X 1 NA 1 2 1 1 X 1 1 X
NA 1 1 1 2 X 1 1 X 1 From each sample village, three groups of parents (9-10 persons) each
belonging to (a) SC and/or ST (depending upon their availability and
concentration), (b) Non-SC/ST and (c) Mothers were chosen as focus groups for
eliciting the required information through group discussions. Qualitative Notes
2.2.11 The questionnaires prepared for making field notes at different levels
and observed by the Regional Evaluation Offices (REOs) and Project
Evaluation Offices (PEOs) of the Programme Evaluation Organisation (PEO)
were useful in elucidating the trends shown by the quantitative data extracted
through structured questionnaires. The notes contained details of
implementation mechanism at various levels and their efficacy, nutrition related,
economic and time-consumption aspects of cooking meal, manpower,
infrastructure, monitoring & supervision at different levels.
Reference Period 2.2.12 The reference period for the study was from 2000 to 2006 and covered
both the erstwhile mid day meal and the cooked mid day meal programmes.
Data Collection 2.2.13 The orientation programme for field staff was held at PEO Headquarters,
Planning Commission, New Delhi in October 2006 after pre-testing the
schedules. The field work was carried out by the REOs and PEOs located in
various states from November 2006 to March 2007.
Data Processing 2.2.14 The filled-in schedules received from REOs and PEOs were scrutinized
and coded before being handed over to NIC for data entry and processing. The
analytical tables have been generated as per the objectives of the evaluation
study.
12

Chapter 3
Beneficiaries, Drop Outs and Out of School Children
Beneficiary Children 3.1 These are the children who are availing the benefits of the Cooked Mid Day
Meal Scheme. In the next few sections, their socio-economic profile and dietary
habits are examined.
Economic Status 3.1.1 As a consequence of low income of the parents, children are expected to
work to supplement the household incomes. In such a scenario, Table 3.1
captures the comparison between the average annual incomes of the beneficiary
children’s parents; drop out children’s parents and out of school’s parents. As per
the table the income of the beneficiary’s children is higher in comparison to drop
out children’s parents and out of school’s parents. It should also be noted that out
of 4580 beneficiary children’s parents, five reported that they do not have any
income. In comparison out of 122 drop out children’s parents, 11 said that they
do not have any income. 7 out of 94 parents of Out of school children indicate
that they donot have any income. Table 3.2 gives the state-wise, the Annual
Income of the households for the beneficiary children as reported by the
beneficiaries’ parents.
Table 3.1
Average Annual Income (Median Values)
Average Annual Income (Mean values)
Parents of beneficiary Children
Rs. 20,000
Rs. 26,613.29
Parents of Out of School children
Rs. 12000
Rs. 17767.77
Parents of Drop Out children
Rs. 12000
Rs. 18278.72
13

Table 3.2: Average Annual Income of the Households for the Beneficiary children.
Social Status 3.1.2 As per the data collected, 40 percent of the beneficiaries across the
country are from the Other Backward Classes category, 23 percent from SC
category, 13 percent from ST category and 24 percent from the “Other”
categories. Table 3.3 below presents a state-wise social category distribution of
beneficiary children.
Table 3.3 Social Status of Beneficiary Children
State
SC ST OBC Other
(in percent) (in percent) (in percent) (in percent) Andhra Pradesh 19.26 9.58 63.74 7.37 Arunachal Pradesh 0.00 62.66 0.00 36.94 Bihar 18.50 0.50 68.00 13.00 Haryana 41.12 0.00 31.47 27.41 Himachal Pradesh 32.84 3.48 20.90 42.79
States
Annual Income of the Household (in Rs.)
(A) Andhra Pradesh 16672.7 Arunachal Pradesh 18290.5 Bihar 23530.2 Haryana 27229.0 Himachal Pradesh 37097.5 J&K 31536.0 Jharkhand 22210.7 Karnataka 20028.6 Kerala 35021.1 Madhya Pradesh 23112.7 Maharashtra 38917.7 Meghalaya 26882.4 Punjab 35671.6 Rajasthan 28821.1 Tamilnadu 24986.9 UP 23400.7 West Bengal 33082.2
14

Jammu &Kashmir 36.00 29.00 1.00 34.00 Jharkhand 11.19 30.69 50.17 7.12 Karnataka 30.74 6.01 0.00 63.25 Kerala 16.15 0.62 75.78 7.45 Madhya Pradesh 18.55 21.25 43.11 17.04 Maharashtra 21.41 7.57 29.00 42.01 Meghalaya 1.96 94.77 0.00 3.27 Punjab 51.00 0.00 46.00 3.00 Rajasthan 24.36 4.87 53.59 17.18 Tamilnadu 31.00 2.33 62.33 4.33 Uttar Pradesh 18.81 0.26 50.26 30.67 West Bengal 16.96 10.39 2.17 70.43 Sample Average 22.49 12.86 40.19 24.41
Educational Status of Sample Parents 3.1.3 The educational background of the parents is an important factor for
enabling children to continue education. About 33 percent of the parents of
beneficiary children selected in the study were found to be illiterates. 28 percent
had studied till the primary level and 21 percent had studied till the middle level.
Table 3.4: Educational Status of Beneficiary children’s Parents State Name Illiterates Primary Middle Matric & above (in percent) (in percent) (in percent) (in percent) Andhra Pradesh 44.79 28.45 11.83 14.93 Arunachal Pradesh 49.32 25.68 20.27 4.73 Bihar 31.49 30.48 18.64 19.40 Haryana 41.21 21.11 13.57 24.12 Himachal Pradesh 24.00 29.00 21.00 26.00 Jammu and Kashmir 31.82 24.55 34.55 9.09 Jharkhand 38.93 32.21 14.09 14.77 Karnataka 35.34 31.80 16.61 16.25 Kerala 0.59 13.02 44.38 42.01 Madhya Pradesh 31.75 31.75 22.25 14.25 Maharashtra 26.94 18.06 28.33 26.67 Meghalaya 6.58 50.00 34.21 9.21 Punjab 50.51 23.74 15.66 10.10 Rajasthan 40.75 28.75 15.50 15.00 Tamilnadu 16.73 42.70 29.89 10.68 Uttar Pradesh 40.77 23.33 18.21 17.69 West Bengal 29.26 29.26 28.38 13.10 All States 33.03 28.52 21.30 17.16
15

Occupation Status of Sample Parents 3.1.4 The occupations of parents have been grouped into four categories for
statistical convenience. Parents engaged in Cultivation or Allied agricultural
activities have been clubbed under one group. Parents who are engaged as
labor, whether agricultural or other activities have been clubbed in other group.
These groups of laborers do not have any land or major assets. Those engaged
in Household Industry, trade and business have been put together. The last
group includes parents engaged in service and other occupations. About 43
percent of the parents are engaged as laborers in agricultural and other activities.
About 31 percent are engaged in agricultural and allied activities. 11 percent are
engaged in household industry, trade and businesses and the rest 14.90 percent
are engaged in service and other occupations.
Table 3.5: Occupation of beneficiary children’s parents
State Name
Cultivation/Allied Agricultural Activity
Agricultural/Other Labour
Household Industry/trade/Business Service/Others
(in percent) (in percent) (in percent) (in percent) Andhra Pradesh 22.26 60.24 5.93 11.57Arunachal Pradesh 77.70 9.46 7.43 5.41Bihar 22.67 50.13 21.41 5.79Haryana 24.00 52.50 12.50 11.00Himachal Pradesh 38.00 28.00 11.50 22.50Jammu and Kashmir 58.00 18.00 10.00 14.00Jharkhand 13.42 55.37 17.11 14.09Karnataka 13.68 54.74 10.18 21.40Kerala 65.12 20.35 1.16 13.37Madhya Pradesh 37.50 42.25 7.50 12.75Maharashtra 27.57 32.97 8.38 31.08Meghalaya 59.48 15.03 16.99 8.50Punjab 14.67 70.65 9.78 4.89Rajasthan 29.75 39.25 10.75 20.25Tamil Nadu 17.79 71.53 6.05 4.63Uttar Pradesh 49.74 29.74 11.03 9.49West Bengal 17.83 36.09 10.87 35.22All States 31.40 42.95 10.76 14.90
Adequacy of meals at Home (beneficiary children)
16

3.1.5 To assess the dietary habits of the sample beneficiaries, they were asked
about the frequencies with which they take milk, fruits, pulses and vegetables.
They were given four options. These are daily, sometimes in a week, sometimes
in a month/year and Never.
Milk 3.1.5.1 About 33 percent of the sample beneficiaries across the country
responded that they get milk daily. 22 percent said that they get milk sometimes
in a week. About 39 percent said that they never get milk. Table 3.6 gives the
state-wise figures. About 75 percent of the selected children in Andhra Pradesh
said they do not get milk at home.
Table 3.6 Frequency of Milk Intake of beneficiary children at home
State Daily Sometimes in a week
Sometimes in month/year Never
(in percent) (in percent) (in percent)
(in percent)
Andhra Pradesh 16.43 7.93 0.57 75.07Arunachal Pradesh 1.90 45.57 46.20 6.33Bihar 7.75 32.50 3.50 56.25Haryana 67.84 17.59 0.50 14.07Himachal Pradesh 61.69 23.88 1.00 13.43Jammu &Kashmir 30.00 32.00 0.00 38.00Jharkhand 3.63 9.57 15.51 71.29Karnataka 63.60 8.13 0.00 28.27Kerala 20.99 46.30 1.85 30.86Madhya Pradesh 27.25 6.75 0.00 66.00Maharashtra 47.55 7.07 0.54 44.84Meghalaya 0.65 99.35 0.00 0.00Punjab 51.50 25.00 2.50 21.00Rajasthan 65.90 13.08 2.05 18.97Tamilnadu 17.73 34.45 16.72 31.10Uttar Pradesh 40.00 16.92 0.26 42.82West Bengal 15.15 35.50 9.96 39.39Sample Average 32.57 22.42 5.03 39.98
Fruits 3.1.5.2 About 13 percent of the sample beneficiaries across the country
responded that they get fruits daily. 8 percent said that they get fruits sometimes
17

in a week. About 59 percent said that they get fruits sometimes in a month/year.
18 percent said that they never get fruits at home. Table 3.7 gives the state-wise
figures.
Table 3.7 Frequency of Fruits Intake of beneficiary children at home
State Daily Sometimes in a week
Sometimes in month/year Never
(in percent) (in percent) (in percent)
(in percent)
Andhra Pradesh 6.52 2.83 73.09 17.56Arunachal Pradesh 0.00 0.63 60.76 38.61Bihar 12.75 0.00 44.75 42.50Haryana 3.02 14.07 81.41 1.51Himachal Pradesh 3.98 7.96 86.57 1.49Jammu &Kashmir 4.00 6.00 71.00 19.00Jharkhand 20.13 0.00 40.92 38.94Karnataka 18.37 12.01 62.19 7.42Kerala 2.47 14.81 74.07 8.64Madhya Pradesh 3.00 2.00 88.50 6.50Maharashtra 3.53 9.51 82.07 4.89Meghalaya 0.00 100.00 0.00 0.00Punjab 17.00 5.00 64.50 13.50Rajasthan 45.64 7.44 27.95 18.97Tamilnadu 6.35 5.35 62.88 25.42Uttar Pradesh 17.69 4.36 50.00 27.95West Bengal 25.11 4.33 46.75 23.81Sample Average 12.90 8.65 59.80 18.65
Pulses 3.1.5.3 About 45 percent of the sample beneficiaries across the country
responded that they get pulses daily. About 49 percent said that they get pulses
sometimes in a week. Table 3.8 gives the state-wise figures.
Table 3.8 Frequency of Pulses Intake of beneficiary children at home
State Daily Sometimes in a week
Sometimes in month/year Never
(in percent) (in percent) (in percent)
(in percent)
Andhra Pradesh 12.18 87.25 0.28 0.28Arunachal Pradesh 96.84 3.16 0.00 0.00
18

Bihar 58.25 40.50 0.00 1.25Haryana 21.11 78.89 0.00 0.00Himachal Pradesh 31.34 68.16 0.00 0.50Jammu &Kashmir 1.00 98.00 1.00 0.00Jharkhand 39.93 34.32 17.49 8.25Karnataka 96.47 3.53 0.00 0.00Kerala 83.33 8.64 8.02 0.00Madhya Pradesh 39.25 59.00 1.75 0.00Maharashtra 26.63 61.41 7.34 4.62Meghalaya 99.35 0.65 0.00 0.00Punjab 25.00 74.50 0.50 0.00Rajasthan 47.69 42.56 5.38 4.36Tamilnadu 17.39 72.58 9.70 0.33Uttar Pradesh 33.33 64.36 1.54 0.77West Bengal 85.28 12.12 1.30 1.30Sample Average 45.45 49.43 3.53 1.59
Vegetables 3.1.5.4 About 60 percent of the sample beneficiaries across the country
responded that they get vegetables daily. About 40 percent said that they get
vegetables sometimes in a week. Table 3.9 gives the state-wise figures.
Table 3.9 Frequency of Vegetable Intake of beneficiary children at home
State Daily Sometimes in a week
Sometimes in a month/year Never
(in percent) (in percent) (in percent)
(in percent)
Andhra Pradesh 16.43 81.59 1.70 0.28Arunachal Pradesh 99.37 0.63 0.00 0.00Bihar 40.00 59.75 0.25 0.00Haryana 49.25 50.75 0.00 0.00Himachal Pradesh 62.69 37.31 0.00 0.00Jammu &Kashmir 1.00 99.00 0.00 0.00Jharkhand 36.63 58.42 4.29 0.66Karnataka 53.36 44.52 0.35 1.77Kerala 50.62 46.91 1.23 1.23Madhya Pradesh 77.50 22.00 0.00 0.50Maharashtra 66.30 33.70 0.00 0.00Meghalaya 100.00 0.00 0.00 0.00
19

Punjab 37.50 62.00 0.00 0.50Rajasthan 97.44 2.05 0.00 0.51Tamilnadu 36.79 57.53 5.02 0.67Uttar Pradesh 75.64 23.85 0.26 0.26West Bengal 89.61 9.96 0.00 0.43Sample Average 59.22 39.52 0.85 0.41
Dropout Children (DoC) 3.2 120 dropouts were selected across the country. 44 percent, 22 percent, 6
percent and 28 percent respectively belonged to the SC, OBC, ST and Others
categories. About 70 percent of the dropout children’s parents were found to be
agricultural/other laborers. About 62 percent of the parents were illiterates, and
25 percent had studied till the primary level. As per table, economic compulsions
were a major reason for dropping out. Lack of awareness towards the benefits
accruing from education and lack of proper guidance was another major reason
for dropping out.
Table 3.10 Economic
Reasons Social Causes
School related difficulties
Lack of Awareness towards education
Health Related Problems
Total
Primary Reason
59 7 18 27 1 112
Secondary Reason
36 1 3 26 66
Out of School Children (OoSC) 3.3 94 Out of school children were selected across the country. 43 percent, 4
percent, 23 percent and 29 percent respectively belonged to the SC, OBC, ST
and Others categories. About 68 percent of the dropout children’s parents were
found to be agricultural/other laborers. About 68 percent of the parents were
illiterates and 18 percent had studied till primary level. Poor economic condition
and lack of awareness towards the benefits accruing from education and lack of
proper guidance was another major reason for not attending school.
Conclusions
20

3.4.1 A large proportion of the sample beneficiaries come from the socially
deprived sections i.e. the SC, ST and OBC categories (3.3). Thus the scheme
has been successful in achieving the objective of social equity. Nevertheless,
there is a large proportion of SCs in DoCs and OoSCs.
3.4.2 About 33 percent of the sample beneficiaries’ parents are illiterates,
indicating a satisfactory targeting of the scheme. Nevertheless, about 62 percent
and 68 percent of the parents of the DoC and OoSC are illiterates respectively.
3.4.3 About 40 percent of the beneficiaries’ parents are labourers who don’t own
any land/property. Thus again indicating a satisfactory targeting of the scheme.
But when compared to DoC and OoSC parents (about 70 percent are laborers
without property/land ownership), a need for further improvement is felt.
3.4.4 A large majority of DoC and OoSC gave poor economic condition as the
major reason for either dropping out or not going to school. Hence, the scheme
has not been able to dispense the “economic reason” which prevents children
from coming to school.
21

CHAPTER-IV
Coverage, Implementation Mechanism and Infrastructure Coverage of CMDM 4.1 In the 17 selected states, with some exceptions, all the Government,
Government-aided, local body run schools, EGS centres and A&IE schools are
covered under cooked mid day meal programme. The Kapurthala and Firozpur
districts of Punjab were observed to be not covered, even though eligible as per
guidelines of Government of India. In West Bengal, some schools are still
operated under MDM instead of CMDM. In Mednipur district, all schools run by
local bodies are still being operated under MDM programme. As per the district
level schedules, in West Bengal’s Birbhum district, out of 2734 Government
aided schools, 365 are operating under the MDM scheme while in North 24
Pargana district, 434 out of 3652 Government aided schools are under MDM
scheme. Neither any of the 314 A&IE schools in Haryana’s Hissar district nor are
any of the 24 schools in Jhajjar district covered either by CMDM or MDM
programmes. Table 4.1 shows the coverage of the CMDM scheme in schools. It
shows, state-wise, the total number of schools, number of schools covered under
CMDM, the number of schools covered under MDM, and the number of
uncovered schools. The table highlights that in all the sample states, a large
proportion of schools have been covered under the CMDM scheme
Table 4.1 Schools covered under CMDM, MDM and Uncovered schools in the selected sample states*.
State Total Schools Enrolment
Schools covered under CMDM
Schools covered under MDM
No. of uncovered schools
Enrollment in the uncovered schools
Andhra Pradesh 60780 6033039 60780 0 0 0 Arunachal Pradesh 4593 218905 4593 0 0 0
Bihar 69204 12858653 69204 0 0 0
Haryana 16589 2549331 12744 1702289 3845 847042 Himachal Pradesh 10982 529843 10982 0 0 0 Jammu & Kashmir 26648 1484887 23091 0 3557 391270
22

Jharkhand 38524 5048908 37923 0 601 82768
Kerala 10913 2160354 10913 0 0 0 Madhya Pradesh 94905 8891737 94905 0 0 0
Maharashtra 85821 9014434 79918 8187366 5903 827068
Meghalaya 7640 627596 7640 0 0 0
Punjab 20494 1767825 0 0 4506 280000
Rajasthan 74690 6960000 74690 0 0 0
Tamilnadu 34710 4826835 34710 0 0 0
Uttar Pradesh 107377 18917189 107377 0 0 0
West Bengal 74993 10206608 69814 0 5179 1011227
*as per the state level schedules
Flow of Funds and Flow of Foodgrain 4.2 The Ministry of Human Resource Development is the nodal agency for
sanctioning the funds and supply of food grains (central assistance) to the states
on behalf of Government of India. The flow chart 4.1 shows the mechanism of
flow of funds from Central Government to school level. The flow chart 4.2 shows
the general mechanism of flow of food grains (central assistance) from Central
Government to school level. Some states have issued guidelines which are
different from Central guidelines. It is also observed by the field teams that FPS
dealer at times gives inferior quality of food grain for CMDM which has an
adverse effect on the quality of food prepared which could lead to health
problems in children
Chart 4.1 Flow of Funds:
23

State Planning Department Makes provision in the State Budget
State Finance Department Place funds for education Department
District Commissioner/District Panchayat Send the funds to Block Elementary education department
Block Elementary Education Department/Block Panchayat Settles the bills of expenditure incurred by schools
Gram Panchayat/Urban Local Body Fund is credited in account by cheque or demand draft
Implementing Authority at school Fund is credited in account of IA by cheque or demand draft
State Education Department Director Elementary Education
draws funds from State Treasury
Ministry of Human Resource Development
Chart 4.2 Flow of foodgrain
24

M/o HRD (GOI) makes district-wise allotment and informs State
Governments & Food Corporation of India
Nodal Agency of State Governments informs District nodal authority about allotment
Food Corporation of India informs State Units
District nodal authorities in turn allot foodgrain to blocks & inform State Food Corporations
State Units inform FCI district in-charge about CMDM allotment
State Food Corporations lift allotted food grains from FCI godown and supply to blocks
PDS Dealers lifts food grains from SFC godowns
PDS Dealers expected to deliver to schools
Foodgrain used in cooking meal under CMDM in-charge
Implementation Mechanism across states
25

4.3 This section captures diversions in Implementation mechanism from the
prescribed guidelines, observations of our field team and some state-specific
unique practices that have been implemented and are of policy importance.
Andhra Pradesh
4.3.1 Foodgrain for the programme is released by the dealer of the Fair Price
Shop. The responsibility of lifting and transportation of stock from Fair Price Shop
(FPS) has been entrusted to the implementing agencies (IA) by the state
government although Government of India has mandated the delivering of stocks
at school to the Fair Price Shop. As a way out, in West Godavari district, the Joint
Collector has ordered to make special sealed cover and separate color to the rice
bags marked especially for CMDM. It has been reported by our field team that
there is usually a pilferage of foodgrain ranging from 2 to 5 kg per almost every
50 kg bag due to non supply of foodgrain directly to school by the Fair Price
Shop dealer.
Arunachal Pradesh 4.3.2 The supply of food grain from Fair Price shop is received by the teacher.
Meals are provided under the supervision of the Head Master assisted by
teachers of the concerned school.
Bihar & Jharkhand 4.3.3.1 Funds are released from the state level to all Deputy
Commissioners/District Superintendents of Education who, in turn, issue
cheques in the name of Saraswati Vahini (SV), which is a group of mothers and
funds can be withdrawn with the joint signatures of President of the Village
Education Committee (VEC) and Saraswati Vahini. At school level, the scheme is
implemented by (SV) which is governed by SV Sanchalan Samiti (SVSS), a sub
committee of the Village Education Committee. SVSS elects one Sanyojika and
two Up-Sanyojikas from amongst its members for implementing CMDM at the
school level. Cooks are deployed by Saraswati Vahini from mothers of children
studying in that particular school.
4.3.3.2 The Head Master/ Sanyojika of SV brings foodgrain from the PDS
shop. Expenditure and record maintenance is to be carried out by the SV but all
26

purchasing and record maintenance was being done by the headmaster himself.
Funds are to be granted by the concerned Deputy Commissioner/District
Superintendent of Education, who is required to issue cheques in the name of SV
but, in many cases, it was found that the school gets funds through the Block
Education Extension Officer. Thus, in actual practice the system functions
differently from that prescribed under the Scheme. The following flowchart shows
the general procedure of flow of allocation of foodgrain/fund from state to school.
Overall, In Bihar lack of proper planning and absence of proper coordination
between Bihar State Food Corporation and district level officers has resulted in
erratic supply of funds and foodgrain. Schools generally do not receive quota of
foodgrain in a planned manner on a monthly basis, as a result of which a few
schools were overstocked resulting in breeding of insects. In Madhepura district,
cooked mid day meal was not provided in eight out of ten selected schools on the
date of visit by our team although district level officers informed that the scheme
is monitored on a monthly basis.
Haryana
4.3.4 The programme is being implemented by the Head Teacher of the
concerned school. The PRIs/ VECs are responsible for monitoring and
supervision at school level. Foodgrain is supplied by CONFED at the doorsteps
of the school. Ingredients such as pulses, nutri-nuggets, oil, salt etc are being
purchased by the district level authority through tenders and supplied to the
schools.
Himachal Pradesh
4.3.5 Himachal Pradesh State Civil Supplies Corporation lifts foodgrain from the
Food Corporation of India godown, upon authorization from the respective
Deputy Commissioner and transports it to the schools through the FPS. The
Center Head Teacher (CHT) is in-charge of the programme at the school level.
He maintains the records and makes all necessary arrangements for providing
CMDM in the school. The Village Education Committee (VEC) along with Mother
Teacher Association (MTA) is responsible for implementation at school level. Our
field team observed that monitoring and supervision by the Block Education
Officer/Deputy Director is negligible.
27

Jammu & Kashmir
4.3.6 The Consumer Affairs and Public Distribution Department has been
nominated as the transporting agency for lifting foodgrain from FCI godown and
supplying it to the Fair Price Shops. The Head Teacher of the school is in
charge of the cooked mid day meal at the school level. The school teacher lifts
the foodgrain from Fair Price Shops. The headmaster purchases the other
ingredients required for cooking from the local market. It has been observed by
our field team that public distribution centre is at a far distance from school. The
monitoring and supervision by the zonal education officer and chief education
officer was reported to be negligible. No funds were made available to ZEO/CEO
for monitoring the programme due to which they found it difficult to visit schools
which are in remote/inaccessible areas.
Karnataka
4.3.7 School Development and Management Committee (SDMC) implements
the scheme with the help of Parent Teacher Association (PTA)/ Village Education
Committee (VEC) at the school level. Foodgrain is transported from Karnataka
Food and Civil Supply Corporation (KFCSC) godown to the school by an
approved transport contractor.
Kerala
4.3.8 The Kerala State Civil Supplies Corporation is responsible for lifting
foodgrain from the FCI godown and distributing it to stores located in each taluk.
The Headmaster is the implementing functionary in schools. Meals are prepared
by the cook under the supervision of Headmaster and are served to students with
the help of teachers. Our field team observed that the monitoring /supervision of
the programme is weak. Transfer of funds from the state level to Gram
Panchayat takes a long time so teacher-in-charge experience a delay of six
months to one year for reimbursement of contingency charges.
Madhya Pradesh
28

4.3.9 The programme is implemented by Parent Teacher Association
(PTA). Parent of a meritorious student is the Chairman of PTA. Foodgrain is
supplied by government agency to Fair Price Shops. Our field team observed
that the members of PTA rarely attend the PTA meetings. Teachers are
involved in purchasing / arranging cooking items, spices etc. from the local
market. The foodgrain is stored in gunny bags at the residence of the cook.
Maharashtra
4.3.10 VEC/Gram Panchayat is the implementation agency at the school
level. At village level, the Village Education Committee (VEC) is the appointing
authority for Self Help Groups/ Cooks. In urban areas, Mahanagar Palika/ Ward
Samitis are involved in appointing SHGs/cooks. Our field team observed that
Steering-cum-monitoring committees have been formed at district level but they
are not effective as meetings are not held regularly. In some sample districts,
they are yet to be constituted.
Meghalaya
4.3.11 The Village Education Committee has been constituted to look after
the smooth functioning of the cooked mid day meal at school level.
Punjab
4.3.12.1 While going through the records of the Punjab Government, it was
observed that funds are generally released by Government of India to the states
in the months of August-October. While State allocates its own share to
district/blocks in April itself as the State Government starts implementing the
scheme from April itself. The allocation/releases from state to
districts/blocks/school level takes around two months in view of the process
involved. The delay in releasing fund from centre and the paucity of funds at
state and block level adversely affect the implementation of the scheme.
4.3.12.2 The Head Teacher of the school is in charge of cooked mid day
meal at school level. The Village Education Committee (VEC) along with
Mothers’ Self Help Group (MSHG) monitors and supervises the implementation
at the school. Food grain is supplied through Punjab State Civil Supplies
Corporation Limited (PUNSUP) at the school doorsteps. Funds are provided by
29

Block Education Officers in favour of Head of Mothers’ Self Help Group (MSHG).
The Head Teacher purchases the required ingredients needed for cooking the
meal from the local market and also maintains the records. It has been observed
by our field team that monitoring and supervision by the DEO/BEO is negligible.
Rajasthan 4.3.13 CMDM is implemented by the School Development and Management
Committee (SDMC) constituted at school level. The Head Teacher of the
concerned school is the chairman of the committee. Foodgrains supplied by the
government transport agency is received by the Head Teacher. Our field team
observed that members of Parents Teacher Association (PTA) and PRIs rarely
attend the meetings of the DMC. The foodgrains in gunny bags was found to be
stored in a corner of the classroom and damaged by rats or pilfered. Teachers
were found to be actively engaged in implementation of the scheme which was
found to be adversely affecting teaching.
Tamilnadu
4.3.14 The Noon Meal Organizer (NMO) works at the school/centre level,
coordinating the work with block level officials. The NMO is assisted by cook
and a helper at the school level. Every school with less than 500 students has
been provided an organizer, a cook and a helper while schools with more than
500 students are provided with an organizer, two cooks and two helpers.
Records are maintained by the NMO. The foodgrain is supplied by the Tamil
Nadu Civil Supplies Corporation (TNCSC) from the block godown directly to the
centers. Tamil Nadu was found to have the least number of intermediaries in the
procedure of flow of foodgrain from State nodal agency to school
Uttar Pradesh
4.3.15 The responsibility of provision of cooked meal in schools is
entrusted with the Gram Pradhan in rural areas and the municipal ward member/
NGO in urban areas. Funds for the cooked meal are deposited in the Gramnidhi
and can be withdrawn with the joint signatures of the Gram Pradhan and the
Panchayat Secretary. Gram Pradhan receives food grain from the control
shop/FPS. Village Education Committee (VEC) consisting of Gram Pradhan, 30

mothers of two students of the school, Principal of the school and fathers of two
children of the school monitors the implementation of cooked mid day meal at
school level. The Gram Pradhan can employ a cook, preferably female,
belonging to SC/ST/widow/ weaker section of society. No records were found at
the Gram Pradhan/ Panchayat Secretary level showing utilization /expenditure on
foodgrain or reg. conversion cost funds. The Gram Pradhan, being an elected
representative, is not accountable to the district authority or to the nodal
department. When Gram Pradhans change hands due to elections, a lot of
funds/foodgrain gets stuck as no record has been kept and the actual utilization
and expenditure can not be ascertained.
West Bengal
4.3.16 CMDM is implemented in schools by the Management Committee (MC)
which consists of 10 members, of which 3 are from SC community. The
allotment of foodgrain to school is done by the PDS’s Fair Price Shops. As per
decision taken at MC level, one Self Help Group (SHG) is given the responsibility
of cooking, serving the meals and washing the utensils. The SHG is given a lump
sum remuneration of Rs.600/- p.m., which is distributed proportionately among
the members involved. Flow of fund from block level is done in two ways. In
some blocks the teacher-in-charge comes to block office and collects the allotted
money after submitting utilization certificate. In other blocks, money is allocated
to Gram Pradhan and teacher-in-charge collects the money from Gram
Panchayat. This channel of flow of fund was found to be a time consuming one.
Steering-cum-Monitoring Committees 4.4 The CMDM guidelines envisage the constitution of Steering-cum-
Monitoring Committees at State/District/Block/Village levels to advise, monitor,
coordinate and take remedial measures for improving the implementation of the
scheme. However, it has been observed by our field teams that though SMCs
have been constituted at all the levels, they are not holding any regular meetings
to coordinate and monitor the programme at the block/village level. Details are
provided in Annexure I.
31

Utilisation of Funds 4.5.1 The table no. 4.2 shows an illustration of requirement, allotment and
utilization of funds for the period 2004-05 to 2006-07 in the selected districts of
the sample states. A graphical analysis of the table can be found in Annexure II. In Kapurthala district of Punjab, funds had not been allocated for the complete
year 2005-06 by the district nodal agency resulting in discontinuation of cooked
mid day meal for about one year. Unspent funds were carried forward to the next
year.
Table: 4.2
Utilisation of Funds during the period 2004-05 to 2006-07
Rs. in lakh
S.No
State District Requirement
Allot-ment
% of Allotment
to Requireme
nt
Utilisation
% of Utilization
to Allotment
1 Andhra Pradesh Adilabad 2869.76 2708.68 94.39 2450.49 90.47
2 Andhra Pradesh Anantapur 2799 2758 98.54 2744 99.49
3 Andhra Pradesh Srikakulam 3378.34 2249.01 66.57 2227.91 99.06
4 Andhra Pradesh
West Godavari 1895.6 2428.32 128.1 1895.6 78.06
5 Arunachal Pradesh Lohit 0 126.44 - 95.36 75.42
6 Arunachal Pradesh Tirap 150.07 97.28 64.82 94.61 97.26
7 Bihar Madhepura 1400.34 846.6 60.46 596.24 70.43 8 Bihar Madhubani 2363.43 2363.43 100 2227.75 94.26
9 Bihar Pashchim Champaran 0 1421 - 1421 100
10 Bihar Rohtas 1090.01 1090.01 100 476.96 43.76 11 Haryana Hisar 1113 733.25 65.88 719.24 98.09 12 Haryana Jhajjar 536.37 484.32 90.3 247.35 51.07
13 Himachal Pradesh Kangra 960.57 936.56 97.5 672.04 71.76
14 Himachal Pradesh Kullu 555.58 402.04 72.36 346.51 86.19
15 Jammu and Kashmir Udhampur 504.92 297.22 58.86 275.53 92.7
16 Jharkhand Bokaro 3125 1866.68 59.73 1507.92 80.78 17 Jharkhand Dumka 3624.08 1588.99 43.85 949.63 59.76 18 Jharkhand Ranchi 0 1932.17 - 643.71 33.32 19 Karnataka Bidar 2192.14 2192.14 100 1437.83 65.59 20 Karnataka Bijapur 962.72 2560.7 265.99 2009.54 78.48
32

21 Karnataka Tumkur 4094.55 3259 79.59 2998.59 92.01 22 Kerala Kannur 615.83 573.35 93.1 443.31 77.32
23 Kerala Thiruvananthapuram 403.74 403.74 100 403.74 100
24 Madhya Pradesh Indore 876.5 653.51 74.56 587.02 89.83
25 Madhya Pradesh Sagar 1357.2 1227.62 90.45 1130.53 92.09
26 Madhya Pradesh Shahdol 811.89 628.34 77.39 564.47 89.84
27 Madhya Pradesh Vidisha 1162.99 1105.98 95.1 870.46 78.7
28 Maharashtra Nagpur 2322.54 1760 75.78 1554.04 88.3
29 Maharashtra Sangli 1437.1 1312.65 91.34 1171.86 89.27
30 Maharashtra Solapur 2095.47 2084.4 99.47 1829.44 87.77
31 Maharashtra Washim 621.85 621.85 100 569.15 91.53
32 Meghalaya East Khasi Hills 0 394.82 - 394.82 100
33 Meghalaya Jaintia Hills 359.41 207.88 57.84 207.88 100 34 Punjab Firozpur 1321 466 35.28 282 60.52 35 Punjab Kapurthala 297.91 126.18 42.36 117.81 93.37 36 Rajasthan Bikaner 0 1524.18 - 1003.72 65.85 37 Rajasthan Churu 0 1424.86 - 998.89 70.1 38 Rajasthan Jaisalmer 0 580.4 - 351.29 60.53 39 Rajasthan Jhunjhunu 0 590.72 - 590.72 100 40 Tamil Nadu Dharmapuri 1492.58 1492.58 100 1492.58 100 41 Tamil Nadu Tirunelveli 2051.27 2051.27 100 2051.27 100
42 Tamil Nadu Virudhu-nagar 1546.05 1546.05 100 1546.08 100
43 Uttar Pradesh Badaun 1715.59 1517.73 88.47 0 -
44 Uttar Pradesh Jalaun 749.09 742.93 99.18 736.68 99.16
45 Uttar Pradesh Sitapur 2137.59 1863.69 87.19 1831.28 98.26
46 West Bengal Birbhum 3631.26 3329.82 91.7 2775.83 83.36
47 West Bengal Medinipur 4196.76 4175.02 99.48 3960.8 94.87
48 West Bengal
North 24 Pargana 0 4164.77 - 3273.56 78.6
Sample Average
64,819
68,912.18
56,777.04
82.39
4.5.2 The chart given below shows the percentage utilization of funds allocated
to all the sample districts in respective states during the year 2004-05 to 2006-
33

07. Except for Tamilnadu and Meghalaya where all the allotted funds have been
utilized, all other states have unutilized funds. It is suggested that these unspent
funds be utilized to provide the micronutrients and de-worming tablets to children
as specified in the CMDM guidelines, 2006. Chart 4.3 Percentage of Utilization to Allotment
Percentage of Utilisation to allotment
020406080
100120
Andhra
Prades
h
Arunac
hal P
rades
hBiha
r
Haryan
a
Himac
hal P
rades
h
Jammu a
nd Kas
hmir
Jhark
hand
Karnata
ka
Kerala
Madhya
Prad
esh
Maharas
htra
Meghala
ya
Punjab
Rajasth
an
Tamil N
adu
Uttar P
rades
h
West Be
States
Perc
enta
ge o
f Util
isat
ion
to
Allo
tmen
t
ngal
Percentage of Utilisation to allotment
Utilisation of Foodgrain 4.6.1 The Table no. 4.3 shows the percentage of utilisation to allotment of
foodgrain (wheat and rice) for the period 2004-05 to 2006-07 in the selected
districts of the sample states. In Madhepura district of Bihar, the utilization of
food grains has been as low as 7.14% in 2004-05 and 40% in 2005-06. No
reason for low utilization of foodgrain was specified but it seems that it was due
to non-submission of utilization certificate by the Implementation authority at
school level to the district nodal authority. In some cases, stock of foodgrain
meant for a particular year is carried forward to the next year resulting in total
utilization of foodgrain for the next year going above 100 percent.
Table: 4.3 Utilisation of Foodgrains during 2004-05 to 2006-07
S.No State District
% of Utilization to Allotment
Wheat Rice Total
34

1 Andhra Pradesh Adilabad - 16.96 16.96
2 Andhra Pradesh Anantapur - 100 100
3 Andhra Pradesh Srikakulam - 99.19 99.19
4 Andhra Pradesh West Godavari - 100 100
5 Arunachal Pradesh Lohit - 57.09 57.09
6 Arunachal Pradesh Tirap - 100 100
7 Bihar Madhepura - 7.02 7.02
8 Bihar Madhubani 100 80.28 84.3
9 Bihar Pashchim Champaran - 100 100
10 Bihar Rohtas - 41.76 41.76
11 Haryana Hisar 62.41 63.91 63.16
12 Haryana Jhajjar 53.75 43.65 48.7
13 Himachal Pradesh Kangra - 31.07 31.07
14 Himachal Pradesh Kullu - 92.47 92.47
15 Jammu and Kashmir Udhampur - 96.99 96.99
16 Jharkhand Bokaro - 75.1 75.1
17 Jharkhand Dumka - 95.57 95.57
18 Jharkhand Ranchi - 42.3 42.3
19 Karnataka Bidar - 100 100
20 Karnataka Bijapur 779.78 1024.7 926.7
21 Karnataka Tumkur - 41.66 41.66
22 Kerala Kannur - 100 100
23 Kerala Thiruvananthapuram - 100 100
24 Madhya Pradesh Indore 93.59 - 93.59
25 Madhya Pradesh Sagar 91.06 - 91.06
26 Madhya Pradesh Shahdol - 97.3 97.3
27 Madhya Pradesh Vidisha 94.12 - 94.12
28 Maharashtra Nagpur - 71.38 71.38
29 Maharashtra Sangli - 73.89 73.89
30 Maharashtra Solapur - 94.89 94.89
35

31 Maharashtra Washim - 69.35 69.35
32 Meghalaya East Khasi Hills - 100 100
33 Meghalaya Jaintia Hills - 90.65 90.65
34 Punjab Firozpur 59.53 63 60.5
35 Punjab Kapurthala 63.57 11.05 46.17
36 Rajasthan Bikaner 63.5 60.89 63.01
37 Rajasthan Churu 56.35 42.26 53.57
38 Rajasthan Jaisalmer 43.03 67.61 47.92
39 Rajasthan Jhunjhunu 66.67 50 63.64
40 Tamil Nadu Dharmapuri - 100 100
41 Tamil Nadu Tirunelveli - 78.05 78.05
42 Tamil Nadu Virudhunagar - 100 100
43 Uttar Pradesh Budaun - - -
44 Uttar Pradesh Jalaun 100 100 100
45 Uttar Pradesh Sitapur 85.51 83.6 84.69
46 West Bengal Birbhum - 73.93 73.93
47 West Bengal East Medinipur - 95.91 95.91
48 West Bengal
North Twenty Four Pargana - 80 80
Sample Avg. 76.06
4.6.2 The chart given below shows the percentage utilization of foodgrain
allocated to all the sample districts in respective states during the year 2004-05
to 2006-07. Andhra Pradesh, Kerala, M.P and Meghalaya show a high
percentage of utiolization of foodgrain. Utilisation of foodgrain can be an
important indicator of the attendence of children in schools.
Chart 4.4 : Percentage of Utilization to Allotment of foodgrain
36

Percentage of utilization to allotment
020406080
100120
Andhra
Prades
h
Arunac
hal P
rades
hBiha
r
Haryan
a
Himac
hal P
rades
h
Jammu a
nd Kas
hmir
Jhark
hand
Karnata
ka
Kerala
Madhya
Prad
esh
Maharas
htra
Meghala
ya
Punjab
Rajasth
an
Tamil N
adu
Uttar P
ra
W
States
Perc
enta
ge o
f Util
isat
ion
to A
llotm
ent
desh
est Beng
al
Percentage of utilization to allotment
Timely Supply of Foodgrain: Based on the observation of the Field Team
Unspent money and foodgrain are on account of delay in allotting/delivering
fund/foodgrain from the district nodal authority to the implementing authority at
school level. Such delay hampers the supply chain of funds/foodgrain and
adversely affects the provision/quantity of meal to children. District nodal
authority should get utilization certificates from the implementing authority at
school level regularly so that further funds/foodgrain is allotted /delivered timely.
The foodgrain should be supplied at the door steps of the schools by the fair
price shop dealer. It is suggested that funds may be earmarked for meeting
transport costs from the fair price shop to the schools as there is no separate
provision for the same in the state budget and this cost is met from the cooking
cost.
A small amount of cash / no cash is being given as an advance to incur
expenditure on day to day basis to school authorities. The bills submitted by
schools against such advances are settled by block level nodal authority in 2-3
months. As a result, they are either supposed to spend from their pockets or
make purchase on credit. It is suggested that all block level nodal authorities
may be issued directions for giving cash advance to schools.
Role played by Panchayati Raj Institutions
37

4.7.1 According to guidelines of cooked mid day meal, the implementing agency
at school level shall be responsible to Gram Panchayats. The chart no. 4.5 has
been prepared to assess the year-wise impact of involvement of PRI on
enrolment of students in selected states. The aggregate number of students
enrolled (state-wise) was grouped under the response categories (affirmative and
non- affirmative) of the teacher in charge of the sample school in regard to the
involvement of PRIs in the functioning of the school. The chart suggests a
positive impact of the involvement of PRIs in schools which resulted in
enhancement in the enrolment rates.
Chart 4.5 Year wise Impact of PRI involvement on Enrolment
The Y-axis denotes the number of students enrolled, which is shown in Class 1 in the year 2000 who keep on advancing
to higher classes in consequent years over a span of 5 years for a few sample states’s districts. The Y and N in the X-axis
denote the involvement and non involvement of PRIs.
4.7.2 The Table 4.4 given below shows state wise involvement of Panchayati
Raj Institutions (PRI) and Urban Local Bodies (ULB) in schools. The data
provided in the table suggests that in some states like Haryana, Himachal
Pradesh, Kerala, Jammu & Kashmir, Punjab, Rajasthan and Uttar Pradesh, the
involvement of PRIs/ ULBs is high. But in states like Bihar, Jharkhand and
Meghalaya, the PRIs/ ULBs have not shown any involvement in schools and
therefore in CMDM also. It has been noticed that lack of involvement of Gram
Panchayats at monitoring stage gives undue freedom to implementing agency at
the school level.
Table: 4.4
38

Involvement of PRIs/ULBs
Sl. No.
State No. of Schools
Involvement of PRI/ULB % of
Involvement (Rural+Urban) Yes No NA
1 Andhra Pradesh 40 11 29 0 27
2 Arunachal Pradesh 17 5 12 0 29
3 Bihar 40 0 40 0 0 4 Haryana 20 20 0 0 100 5 Himachal Pradesh 20 20 0 0 100
6 Jammu and Kashmir 5 5 0 0 100
7 Jharkhand 30 0 30 0 0 8 Karnataka 28 10 18 0 35 9 Kerala 20 20 0 0 100 10 Madhya Pradesh 40 38 2 0 95 11 Maharashtra 40 28 12 0 70 12 Meghalaya 20 0 20 0 0 13 Punjab 20 20 0 0 100 14 Rajasthan 40 40 0 0 100 15 Tamil Nadu 30 29 0 1 96 16 Uttar Pradesh 40 40 0 0 100 17 West Bengal 30 27 1 2 90 Sample Average 480 313 164 3 65.20
Linkages with other Departments 4.8 Table 4.5 shows the states in which there has been a convergence with
other schemes for infrastructure and capacity building has been reported as per
the following table. Rest of the sample states have shown no convergence with
the other schemes or departments in health, infrastructure and capacity building.
In Maharashtra, Vitamin, Folic Acid, Iron and de-worming tablets have to be
provided to school children as per the resolution of the State Government. But it
was reported that deworming tablets and/or micro nutrients are not being
provided.
Table: 4.5
39

States Health Infrastructure development
Capacity building
Maharashtra Routine check up done once in a year by the nearest PHC doctor
-
-
Haryana -
-
Food & nutrition board, GOI for training
West Bengal - SGRY, BRGF & SDP for the construction of kitchen sheds
-
Madhaya Pradesh
-
PHED for water supply SSA for training to PTA
Karnataka Supply of Vitamin A, Iron tablets & de worming tab-lets
-
-
Tamil Nadu -
SGRY, Slum Development for Urban areas, SSA
-
Himachal Pradesh
-
SSA for construction of kitchen sheds
Training through DIET
Bihar -
B.E.P for hut construction
UNICEF for training of officials and resource persons
Andhra Pradesh
Routine health check up done once in two months/free necessary
medicines/D.T.P/TT injections in some districts
-
-
Infrastructure 4.9 As per central government norms, kitchen-cum-store; adequate water
supply for drinking, cooking and washing utensils; cooking devices/utensils; and
containers for storage of food grains and other ingredients are to be provided to
schools for serving cooked meal to the students.
Availability cum status of School Buildings
4.9.1 The table 4.6 suggests that a high proportion of sample schools have their
own buildings. Further a large majority of sample schools operate in pucca
schools. Exceptions are Bihar and West Bengal where 52.5% and 33.33% of the
sample schools have kutcha buildings. In tribal states like Arunachal Pradesh
40

and Meghalaya 88.24% and 95% of the sample schools had pucca buildings. On
an average, across the country, 28% of the sample schools did not have toilets
facility. In Andhra Pradesh only 17 percent of the schools have toilet facility.
Chart 4.6 depicts the percentage wise condition of pucca school building in the
sample states. As per the observations of our field teams, many EGS schools
were found without buildings, running under sheds/ tree shade.
Table 4.6
States Schools having own building (%age)
Schools having Pucca building (%age)
Condition of rooms in Pucca building (%age)
Avail- ability of toilets (%age)
Good
Aver-age
Poor
Andhra Pradesh 97.5 82.05 90.62 9.38 0 57.5 Arunachal Pradesh 100 88.24 60 33.33 6.67 17.64 Bihar
100 47.5 26.32 52.63 21.0
5 90 Haryana 100 100 45 55 0 100 Himachal Pradesh 85 94.44 64.71 35.29 0 75 Jammu & Kashmir 80 100 25 75 0 80 Jharkhand 86.67 76.92 65 35 0 56.66 Karnataka 100 100 82.14 14.29 3.57 67.85 Kerala 100 95 21.05 73.68 5.26 95 Madhya Pradesh 97.5 97.5 38.46 46.15
15.38 67.5
Maharashtra 95 89.47 67.65 23.53 8.82 55 Meghalaya 100 95 78.95 21.05 0 50 Punjab 90 88.89 56.25 31.25 12.5 75 Rajasthan 97.5 100 66.67 30.77 2.56 90 Tamil Nadu 100 83.33 50 50 0 93.33 Uttar Pradesh 97.5 100 76.32 15.79 7.89 67.5 West Bengal 80 66.67 37.5 62.5 0 76.66 Sample Average 95.41 87.17 54.80 36.89 8.29 71.96
Chart 4.6: Condition of School Buildings
41

4.2.3 Availability and Functionality of Kitchen sheds 4.9.2 Table 4.7 suggests that on an average across the country, only 44%
schools have kitchen sheds. In the schools where kitchen sheds are available,
only 48 % are in good condition, 37 % in average condition and 16 percent in
poor condition. In Kerala and Tamilnadu, all the schools have kitchen sheds
while in Haryana, J&K and Punjab; none of the schools have kitchen sheds.
Column 6 shows the proportion of schools where kitchen sheds are functional out
of total schools where kitchen sheds are available. It is interesting to note that in
spite of the poor condition, most of the kitchen sheds are still being in use
(Column 6) which highlights the importance of the kitchen sheds. In the absence
of kitchen sheds, food is being cooked in the open space /verandas. During
summer and rainy season, food was cooked in class rooms creating
disturbances in the learning process. Some EGS schools in West Bengal were
running under temporary sheds / tree shades. In these schools, dry ration system
was still preferred due to non-availability of school building and kitchen sheds.
Table: 4.7 States Availability of
kitchen sheds in the school (% age)
Condition of kitchen shed (%age)
Functional (%age)
Good Average Poor
(1) (2) (3) (4) (5) (6) Andhra Pradesh 37.50 73.33 20 6.67 76.00 Arunachal Pradesh 11.76 50.00 0 50 100.00 Bihar 42.50 38.89 11.11 50 72.00 Haryana 0 - - - - Himachal 5.00 100 0 0 50.00
56%
39%
5%
0%
10%
20%
30%
40%
50%
60%
Good Average Poor
42

Pradesh Jammu & Kashmir 0 - - - - Jharkhand 33.33 45.45 27.27 27.27 100.00 Karnataka 75.00 47.62 33.33 19.05 95.23 Kerala 100 30 40 30 95.00 Madhya Pradesh 42.50 76.47 23.53 0 100.00 Maharashtra 20.00 62.5 25 12.5 100.00 Meghalaya 20.00 75 25 0 100.00 Punjab 0.00 - - - - Rajasthan 60.00 66.67 33.33 0 79.16 Tamil Nadu 100.00 13.33 66.67 20 96.67 Uttar Pradesh 47.50 94.74 5.26 0 94.73 West Bengal 80.00 16.67 62.5 20.83 95.83 Sample Average 44.58 48.59 34.57 16.82 90.69
Best Practices II Public Private Partnerships in Andhra Pradesh
Best Practices I Centralized Kitchen System: Churu District of Rajasthan
It was found by our field team that cooked mid day meal was being
provided to the children through a centralized kitchen system in the Churu block
of Churu district of Rajasthan. Its implementing process was found to be very
good. This system of centralized kitchen is implemented by a Non Government
Organisation through a central kitchen established at the block headquarters of
Churu. The meal is prepared in the central kitchen as per weekly menu
prescribed by the State Government and supplied to schools. Five road map
works have been prepared by the NGO to cover all the schools of Churu block.
School-wise meal containers are maintained by the NGO to supply meals daily.
The teacher in-charge of CMDM was responsible to receive delivery of prepared
meal at the school from the vehicle of central kitchen daily as per presence of
students. The manager of the central kitchen of Churu had prepared school-wise
delivery register as per the route-map. Records are maintained by the manager
of the central kitchen. The Centralized kitchen system would be feasible only in
towns and urban areas where the schools are in a cluster. But in rural areas
where the schools are spread out far and at times located in remote and hilly
areas, this system would not be feasible. Secondly, the number of students
attending on a particular day cannot be informed to kitchen located far away.
43

Pubic Private Partnership (PPP) can be the way in which the Cooked Mid
Day Meal can be provided in schools. PPP involves a contract between the
Government agencies and a private institution where the onus of providing a
public service is on the private institution. Under the PPP mode, the quality of
service being provided is expected to improve which can result in an improved
performance of the cooked mid day meal scheme.
In Andhra Pradesh, the involvement of a number of private bodies in the
implementation of CMDM in the state has resulted in visibly better performance.
In rural areas Self Help Groups/SEC/ Temples/NGOs, charitable Trusts/Group of
Parents are identified by the Mandal Revenue Officers (MRO) as the
implementing agencies. In Urban areas Community Development Societies
/NGOs/SHGs/ DWCRA/School Education Committees and other Agencies like
Temples/NGOs of proven track record/ charitable trusts/Group of Parents are
identified as implementing agencies by a committee headed by the MRO.
Naandi Foundation has taken up the programme in the districts of
Vishakhapatnam and Hyderabad. The Naandi Foundation has established a
central kitchen at Hyderabad from which mid day meal is supplied to 1, 01,394
children in 891 schools in the twin cities of Hyderabad and Secunderabad.
Similarly the centralized kitchen established in Vishakhapatnam city by the same
NGO covers 35,734 children in 111 schools. In Tirupathi district, ISKCON
(International Society for Krishna Consciousness) is meeting the Midday Meal
requirement of about 8500 children in 65 schools.
Availability of Store room in schools
4.9.3 Table 4.8 suggests that on an average across the country, only 24% of the
schools have storerooms. Of the sample schools that had storerooms only half
were found in good condition. 13 percent of the store rooms are not functional
because they are in poor condition and ineffective against rodents. In the
absence of store rooms, the foodgrains is kept in the class rooms depriving
children of space needed for learning. In some places, due to unavailability of
store rooms, the gunny bags containing foodgrain are kept in the house of one of
44

the members of the VEC. Existing store rooms need to be provided with window
iron mesh to avoid problems of rodents.
Table: 4.8
States Availability of Store rooms in schools (% age)
Condition of Store rooms (%age)
Functionality (%age)
Good
Average
Poor
Andhra Pradesh 27.5 90.91 9.09 0 61.53 Arunachal Pradesh 5.88 100 0 0 100 Bihar 50 52.63 31.58 15.79 84.21 Haryana 0 - - - - Himachal Pradesh 10 50 50 0 100 Jammu & Kashmir 0 - - - 0 Jharkhand 33.33 30 60 10 100 Karnataka 42.86 61.54 23.08 15.38 100 Kerala 25 40 20 40 50 Madhya Pradesh 17.5 71.43 28.57 0 100 Maharashtra 2.56 100 0 0 100 Meghalaya 10 66.67 33.33 0 66.67 Punjab 0 - - - - Rajasthan 37.5 60 33.33 6.67 100 Tamil Nadu 73.33 30.43 69.57 0 95.45 Uttar Pradesh 5 0 50 50 100 West Bengal 6.67 100 0 0 66.67 Sample Average 24.29 53.50 37.71 8.7 87.17
Availability & Adequacy of “utensils for cooking” and Availability of plates & tumblers 4.9.4 Table 4.9 suggests that on an average across the country, 94 % of the
schools have availability of utensils for cooking. Almost 33% of the sample
schools which have utensils for cooking, report that utensils are inadequate. In
some states like Bihar, Jharkhand, West Bengal, Arunachal Pradesh about three
fourths of the sample schools reported that they do not have adequate utensils
for cooking. Availability of plates and tumblers is also low but this is not a major
cause of concern because most of the children bring plates and tumblers from
home. The field teams noticed that in some places children keep these utensils
with themselves thereby creating lot of noise in the class room as well as causing
diversion of attention of children from learning.
Table 4.9
45
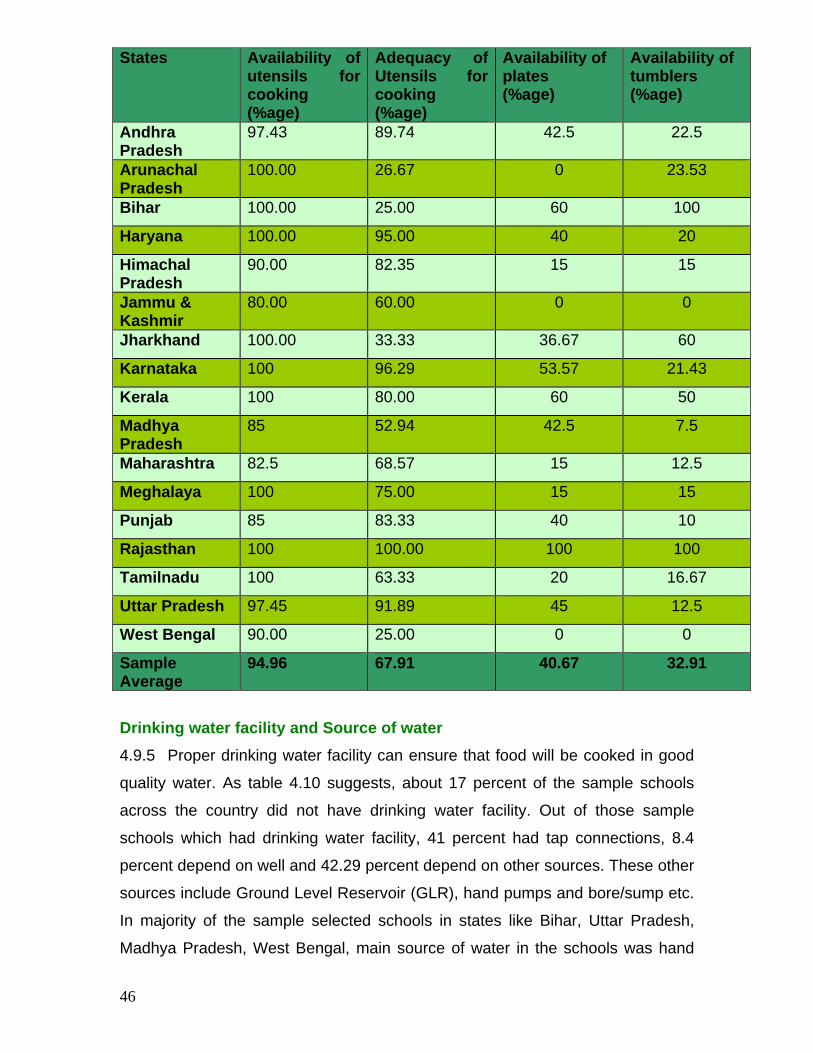
States Availability of utensils for cooking (%age)
Adequacy of Utensils for cooking (%age)
Availability of plates (%age)
Availability of tumblers (%age)
Andhra Pradesh
97.43 89.74 42.5 22.5
Arunachal Pradesh
100.00 26.67 0 23.53
Bihar 100.00 25.00 60 100
Haryana 100.00 95.00 40 20
Himachal Pradesh
90.00 82.35 15 15
Jammu & Kashmir
80.00 60.00 0 0
Jharkhand 100.00 33.33 36.67 60
Karnataka 100 96.29 53.57 21.43
Kerala 100 80.00 60 50
Madhya Pradesh
85 52.94 42.5 7.5
Maharashtra 82.5 68.57 15 12.5
Meghalaya 100 75.00 15 15
Punjab 85 83.33 40 10
Rajasthan 100 100.00 100 100
Tamilnadu 100 63.33 20 16.67
Uttar Pradesh 97.45 91.89 45 12.5
West Bengal 90.00 25.00 0 0
Sample Average
94.96 67.91 40.67 32.91
Drinking water facility and Source of water 4.9.5 Proper drinking water facility can ensure that food will be cooked in good
quality water. As table 4.10 suggests, about 17 percent of the sample schools
across the country did not have drinking water facility. Out of those sample
schools which had drinking water facility, 41 percent had tap connections, 8.4
percent depend on well and 42.29 percent depend on other sources. These other
sources include Ground Level Reservoir (GLR), hand pumps and bore/sump etc.
In majority of the sample selected schools in states like Bihar, Uttar Pradesh,
Madhya Pradesh, West Bengal, main source of water in the schools was hand
46
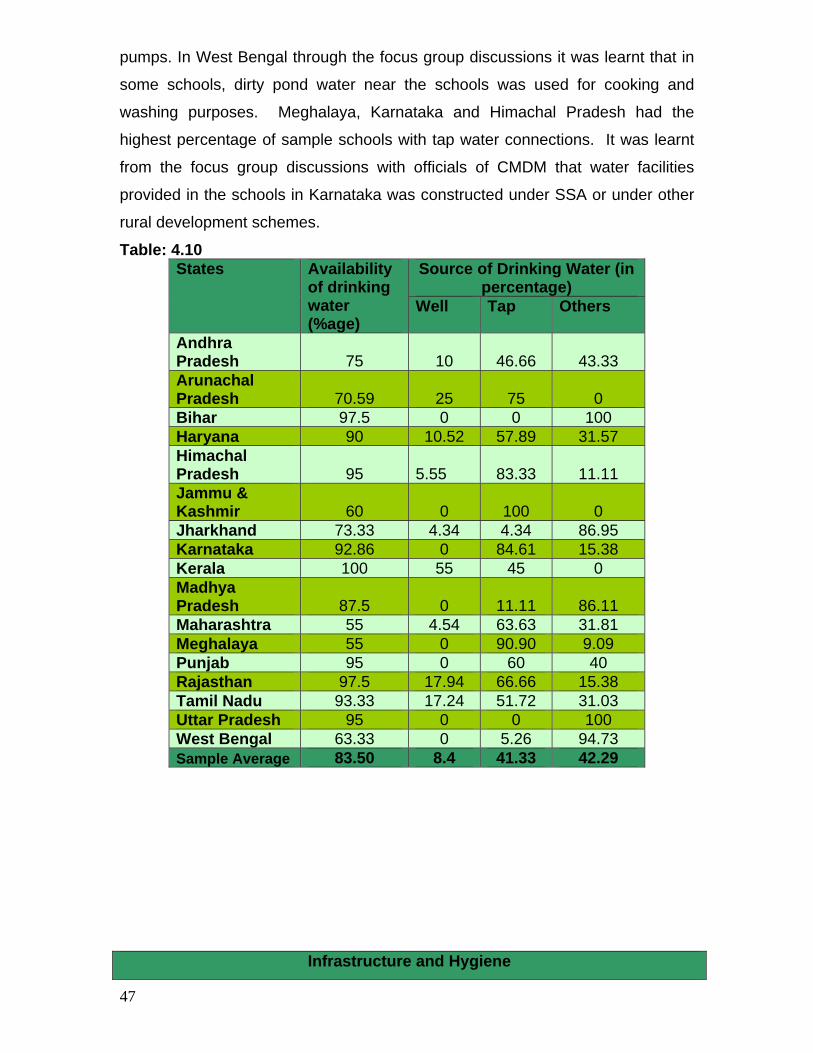
pumps. In West Bengal through the focus group discussions it was learnt that in
some schools, dirty pond water near the schools was used for cooking and
washing purposes. Meghalaya, Karnataka and Himachal Pradesh had the
highest percentage of sample schools with tap water connections. It was learnt
from the focus group discussions with officials of CMDM that water facilities
provided in the schools in Karnataka was constructed under SSA or under other
rural development schemes.
Table: 4.10 States Availability
of drinking water (%age)
Source of Drinking Water (in percentage)
Well Tap Others
Andhra Pradesh 75 10 46.66 43.33 Arunachal Pradesh 70.59 25 75 0 Bihar 97.5 0 0 100 Haryana 90 10.52 57.89 31.57 Himachal Pradesh 95 5.55 83.33 11.11 Jammu & Kashmir 60 0 100 0 Jharkhand 73.33 4.34 4.34 86.95 Karnataka 92.86 0 84.61 15.38 Kerala 100 55 45 0 Madhya Pradesh 87.5 0 11.11 86.11 Maharashtra 55 4.54 63.63 31.81 Meghalaya 55 0 90.90 9.09 Punjab 95 0 60 40 Rajasthan 97.5 17.94 66.66 15.38 Tamil Nadu 93.33 17.24 51.72 31.03 Uttar Pradesh 95 0 0 100 West Bengal 63.33 0 5.26 94.73 Sample Average 83.50 8.4 41.33 42.29
Infrastructure and Hygiene
47
Adequate and appropriate infrastructure is crucial to ensure hygiene. Most of the sample schools in all the surveyed states reported inadequate
infrastructure like lack of kitchen sheds, absence of separate space for cooking
and serving meals, no storage facilities and no clean source of water. Even where
kitchens were available, they were not in good condition and had poor ventilation.
In many sample schools, cooking was done in open space or under shade of
trees.
In West Bengal, none of 30 sample schools covered under the study had
the required infrastructure according to prescribed specification and norms. In
some sample schools, though thatched kitchens were available, they were not
clean and spacious enough to facilitate preparation of the meal hygienically.
Most sample schools in Andhra Pradesh reported taking precautions for
cooking and serving the meals hygienically. Even though all the sample schools
in Tamilnadu have indicated an availability of kitchen sheds, in most of the
selected schools, cooking was done outside the kitchen under the shade of trees
due to improper condition of sheds, making it difficult for the organiser to enforce
safety and hygiene in cooking. Many sample schools do not have proper and
adequate space for taking the meal, forcing students to take meals under trees.
In Maharashtra, separate cooking sheds are not available in most of the
sample schools. Parents reported dissatisfaction due to non-availability of plates
and closed spaces for eating meals as meals are often served in the corridors of
schools or in open spaces amidst dust and flies.
In Jharkhand, due to unavailability of proper kitchen sheds, cooking
activities are carried out in open fields adversely affecting the cooking &
classroom processes besides resulting in unhygienic conditions.
In a few sample schools in Bihar, due to lack of water sources, meal is
being cooked, using water from ponds, again making it difficult to maintain
hygiene.
Availability of Manpower for CMDM
48

4.10 Under CMDM, teachers have the responsibility to monitor and supervise
at the school level. Cooking and serving is entrusted to women’s SHGs/NGOs
etc. However, teachers are also found to be involved in arranging provisions and
serving meals. In case of EGS centers, the problem is more acute, because, no
provision for cook has been made. At the state level, the average wage for
cooking, per child, per school day comes in the range of Rs. 0.40 to Rs. 0.50
only. It has been observed that in schools where student strength is less than 50,
it becomes difficult to hire a cook at such a small honorarium. Also, in schools
where student strength is more than 100, it becomes difficult for one cook to cook
the meal in time. Hence there is need to enhance the amount of honorarium to
cooks/helpers. Table 4.11 suggests that there is a shortage of cooks and helpers
in schools.
Table 4.11
States Cooks per school Helper per school Andhra Pradesh 1.07 0.07Arunachal Pradesh 0.58 0.83Bihar 0.44 0Haryana 0.23 0Himachal Pradesh 0.11 0.13Jammu and Kashmir 0.19 0Jharkhand 0.30 0.09Karnataka 0.33 0.11Kerala 2.42 0Madhya Pradesh 0.37 0.01Maharashtra 0.20 0Meghalaya 0.22 0.11Punjab 0.20 0Rajasthan 0.26 0.06Tamil Nadu 0.065 0.06Uttar Pradesh 0.45 0.03West Bengal 0.40 0.05Total 0.40 0.05
Maintenance of Records/Cashbooks 4.11 It has been observed that maintenance of records needs improvement at
all levels. At school level, maintenance of records is very poor. It has been
observed that cash books are written once/twice in a month. There is no common
format for maintenance of cash accounts and stock of foodgrain. In most of the
states, teachers are found to be responsible for maintaining accounts while they
49

do not have any training for such type of jobs. The situation is worse in EGS
centers. Their estimates are erratic without proper maintenance of records. In the
absence of item-wise utilization of various ingredients used in preparation of
cooked mid day meal, it was difficult for the field team to estimate the nutritious
content of the food supplied to children. Also in the absence of proper records, a
lot of scope is left for manipulation of actual expenditure and utilization of the
foodgrain/funds provided under the programme. The following table shows the
classification of states in four slabs of percentages according to maintenance of
cash books in schools.
Grouping of states according to maintenance of cash book in schools Table: 4.12
Very Good (more than 75%)
Good (50%-75%)
Low (25%-50%)
• Kerala • Andhra
Pradesh, • Karnataka • Madhya
Pradesh • Tamilnadu • Rajasthan
• Maharashtra • Meghalaya • Bihar, • Haryana, • Himachal
Pradesh, • Jharkhand, • Jammu &
Kashmir • Punjab, • Uttar Pradesh • West Bengal
• Arunachal Pradesh
***************************************
Chapter 5 50

Impact of Cooked Mid Day Meal Scheme
CLASSROOM HUNGER
5.1 Eliminating hunger at school is an important objective of CMDM. As table 5.1
suggests, the success of the scheme on this parameter has varied across states.
About one fifth of the beneficiaries in Bihar, Rajasthan and West Bengal reported
that they do not get adequate meals at school.
Table 5.1
State
Percent of beneficiaries reporting inadequate food served.
Andhra Pradesh 0.29Arunachal Pradesh 0.00Bihar 21.59Haryana 0.51HP 0.00J&K 0.00Jharkhand 9.93Karnataka 3.15Kerala 0.00Madhya Pradesh 6.51Maharashtra 0.28Meghalaya 0.00Punjab 1.02Rajasthan 17.99Tamilnadu 0.00Uttar Pradesh 11.29West Bengal 20.10
5.1.1 To gauge the comfort levels of the beneficiaries and their parents with
cooked mid day meal served at school, their opinions were sought on the quality
of meals and whether they were satisfied with the meals served. The opinions of
children have been captured in Table 5.2. In Bihar, where students rarely bring
51

lunch to school, about 72 percent of the beneficiaries have responded that the
quality of food is poor and 77 percent say that they are not satisfied.
Table 5.2
State Opinion of Children
Quality of Meal (in percent)
Satisfaction (in percent)
Good Average
Poor Yes No
Andhra Pradesh 88.41 9.92 1.68 93.85 6.15 Arunachal Pradesh
99.37 0.63 0 100 -
Bihar 5.64 22.06 72.3 22.11 77.89 Haryana 55.0 44.5 0.5 99.5 0.5 Himachal Pradesh
90.0 9.55 0.45 99.54 0.46
Jammu & Kashmir
97.0 3.0 - 98.0 2.00
Jharkhand 32.56 53.16 14.29 66.78 33.22 Karnataka 4.61 89.72 5.67 76.24 23.76 Kerala 77.39 21.66 0.96 98.73 1.27 Madhya Pradesh 80.75 16.0 3.25 89.72 10.28 Maharashtra 96.63 2.81 0.56 97.34 2.66 Meghalaya 100 0 0 100 0 Punjab 77.61 21.39 1.0 94.03 5.97 Rajasthan 80.21 7.29 12.5 77.34 22.66 Tamilnadu 85.07 13.56 1.37 87.59 12.41 Uttar Pradesh 55.85 42.29 1.86 92.31 7.69 West Bengal 71.61 16.95 11.44 78.39 21.61
5.1.2 The opinion of parents on the quality of meals is captured in Table 5.3. As
suggested by the beneficiaries in Bihar, about 69 percent parents also believe
that the food offered is poor in quality. Both the sample beneficiaries and their
parents in Maharashtra are satisfied with the quality of food being served in
schools under CMDM.
Table: 5.3
State Opinion of Parents Quality of Meal (in percent)
Good Average Poor Andhra Pradesh 71.22 23.84 4.94 Arunachal Pradesh 100 0 0
Bihar 2.53 28.35 69.11 Haryana 44.72 51.76 3.52
52

Himachal Pradesh 70.35 29.65 0
Jammu & Kashmir 72.0 28.0 0 Jharkhand 20.34 65.76 13.9 Karnataka 4.29 90.36 5.36 Kerala 70.41 26.63 2.96 Madhya Pradesh 24.25 70.75 5 Maharashtra 90.71 9.02 0.27 Meghalaya 100 0 0 Punjab 69.19 29.29 1.52 Rajasthan 80.56 6.57 12.88 Tamilnadu 65.23 32.26 2.51 Uttar Pradesh 41.58 55.78 2.64 West Bengal 68.78 26.7 4.52 FRESH ENROLMENTS 5.2.1 The fresh enrolments are number of new enrolments in primary school. To
calculate the fresh enrolments only those sample schools were selected which
had maintained enrolment figures for all the years in the reference period (2000
to 2006). CMDM was introduced in different years in different states during the
reference period. This is captured in Table 5.4. Table 5.5 is crucial to
understanding the impact of CMDM on fresh enrolments.
Table 5. 4
State Code 2000 2001 2002 2003 2004 2005 2006Andhra Pradesh 683 589 611 492 493 512 457Arunachal Pradesh 445 455 456 437 512 611 542Bihar 3020 4110 5377 5464 4659 4289 4469Haryana 588 624 794 625 548 537 588Himachal Pradesh 350 320 346 439 396 305 271Jammu & Kashmir 61 66 41 50 42 39 41Jharkhand 1438 1518 1499 1585 1301 1460 1404Karnataka 628 722 678 567 622 739 521Kerala 723 724 786 788 732 736 724Madhya Pradesh 932 1016 948 971 1089 1038 939Maharashtra 1130 1133 1189 1198 1110 1117 1095Meghalaya 302 282 347 371 373 350 353Punjab 443 471 512 460 455 398 498Rajasthan 1231 1237 1348 1184 1117 1103 901Tamilnadu 850 836 813 780 761 774 688Uttar Pradesh 2756 2776 3478 3363 3216 3318 3017West Bengal 1014 1158 876 776 755 689 638
53

5.2.2 In the states like J&K, Himachal Pradesh, Haryana and Punjab where
sample beneficiaries were found to be bringing their own lunch often, CMDM is
not a major attraction. In Tamilnadu, Kerala and Andhra Pradesh Cooked Mid
Day Meal system is in place prior to the reference period, therefore the impact of
CMDM on enrolment cannot be ascertained. In Jharkhand, the scheme was
launched towards the end of the reference period. In the remaining states, Bihar,
Uttar Pradesh, Meghalaya, Arunachal Pradesh have reported an increase in
fresh enrolments. In Jharkhand and Madhya Pradesh the enrolments have
stayed constant. In West Bengal, Rajasthan and Karnataka fresh enrolments
have dipped.
Table 5.53 Year in which CMDM started in various states States Years when Cooked Meal started in schools Andhra Pradesh 2001 Arunachal Pradesh 1st September, 2004 Bihar 1 January 2005 Haryana 15th August, 2004 Himachal Pradesh
22ndMay, 2003 (Tribal Areas) 01-09-2004 (Non Tribal Areas)
Jammu & Kashmir 1st September 2004 Jharkhand
In 2004-05, extended to all Government Primary/ Middle schools In 2005-06 this programme was extended to cover all Government Aided Primary Schools (including minority E.G.S & A.I.E Centers including all Government Primary/ Middle schools)
Karnataka 7 backward North Eastern districts of the State during 2002-03 the scheme of providing hot cooked meal to the children of 6 & 7 standards during 2004-05
Kerala Prior to the reference period Madhya Pradesh 2004-05 Maharashtra January 2003 Meghalaya 29-11-2002 Punjab July 2006 Rajasthan July, 2002 Tamilnadu Prior to the reference period Uttar Pradesh 1st September 2004 West Bengal January 2003 (six districts), March 2005 (nineteen districts)
5.2.3 The opinion of teachers on the impact of CMDM on enrolment rates was
sought. Their responses have been tabulated in Table 5.6. In Bihar, Uttar
Pradesh, Jharkhand, Rajasthan, Maharashtra, Haryana, Himachal Pradesh
where a majority of sample schools have reported an increase in enrolment
rates, a large majority have attributed it to factors like Sarva Siksha Abhiyaan,
awareness towards education and other factors. Even in the eastern states, and
Kerala where students bring their own lunch rarely, teachers have attributed an 3 http://education.nic.in/Elementary/mdm/Programme_Approval_Board.htm
54
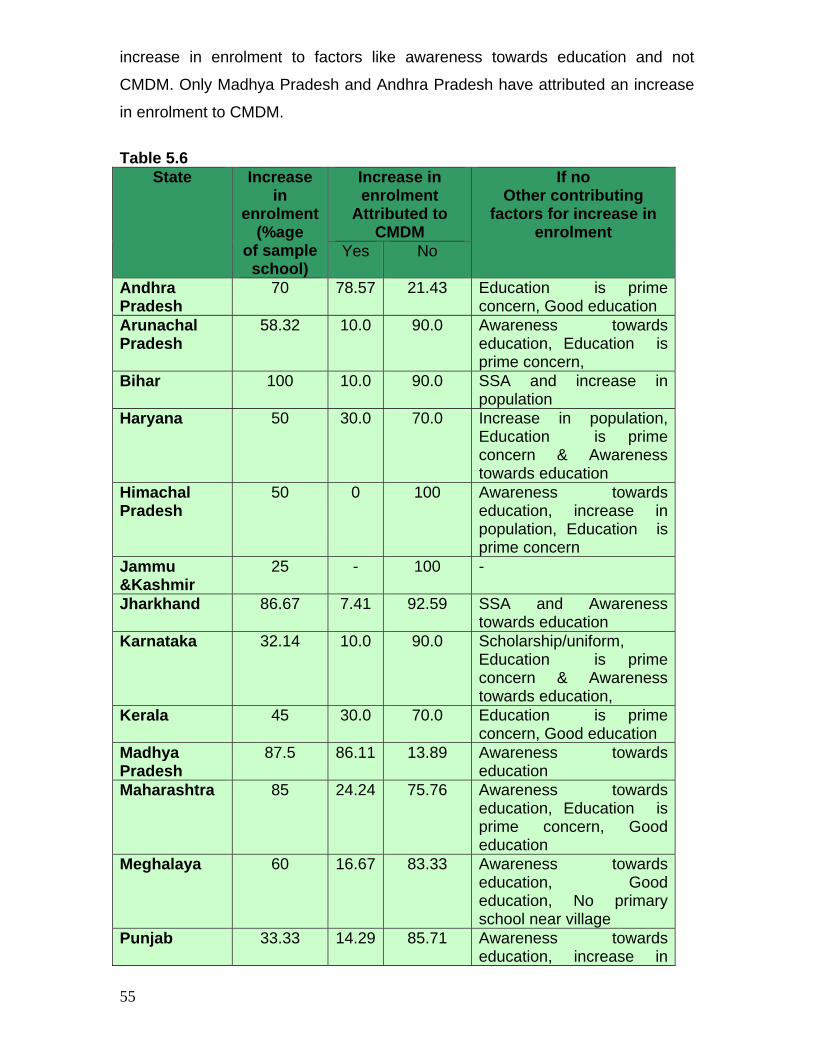
increase in enrolment to factors like awareness towards education and not
CMDM. Only Madhya Pradesh and Andhra Pradesh have attributed an increase
in enrolment to CMDM.
Table 5.6
State Increase in
enrolment (%age
of sample school)
Increase in enrolment
Attributed to CMDM
If no Other contributing
factors for increase in enrolment
Yes No
Andhra Pradesh
70 78.57 21.43 Education is prime concern, Good education
Arunachal Pradesh
58.32 10.0 90.0 Awareness towards education, Education is prime concern,
Bihar 100 10.0 90.0 SSA and increase in population
Haryana 50 30.0 70.0 Increase in population, Education is prime concern & Awareness towards education
Himachal Pradesh
50 0 100 Awareness towards education, increase in population, Education is prime concern
Jammu &Kashmir
25 - 100 -
Jharkhand 86.67 7.41 92.59 SSA and Awareness towards education
Karnataka 32.14 10.0 90.0 Scholarship/uniform, Education is prime concern & Awareness towards education,
Kerala 45 30.0 70.0 Education is prime concern, Good education
Madhya Pradesh
87.5 86.11 13.89 Awareness towards education
Maharashtra 85 24.24 75.76 Awareness towards education, Education is prime concern, Good education
Meghalaya 60 16.67 83.33 Awareness towards education, Good education, No primary school near village
Punjab 33.33 14.29 85.71 Awareness towards education, increase in
55

population & Education is prime concern
Rajasthan 60 14.81 85.91 Education is prime concern
Tamilnadu 23.33 55.56 44.44 Education is prime concern,
Uttar Pradesh 100 2.56 97.44 Scholarship/uniform West Bengal 20.69 66.67 33.33 No primary school near
village, Scholarship/uniform
5.2.4 From 5.2.1, 5.2.2 and 5.2.3, it can be concluded that Cooked Mid Day
Meal does not have any significant impact on the fresh enrolments in a majority
of sample schools in most of the states (except Andhra Pradesh and Madhya
Pradesh). Impact of factors like Sarva Siksha Abhiyaan, Awareness towards
education etc is more visible.
SOCIAL EQUITY 5.3 To capture any discrimination while providing cooked mid day meals,
students were asked whether they eat at school. Their responses were tabulated
social category-wise. As the table suggests there has been no evidence at an all
India level to suggest that a particular social group has not been allowed to eat
meals at schools. This suggests that the children in selected schools eat their
meals together, thereby promoting social harmony.
Chart 5.3
Percentage of SC, ST, OBC and Others who do noteat meal at school
0.001.002.003.00
4.005.006.00
SC ST OBC Others
56

ATTENDANCE
5.4. As table 5.7 suggests, a majority of schools in all the sample states
reported an increase in attendance like Andhra Pradesh (100%), Arunachal
Pradesh (93.75%), Madhya Pradesh (91.18%), Meghalaya (86.67%), Tamilnadu
(81.82%), Uttar Pradesh (100%), Maharashtra (50.0%) and Karnataka (50.0%).
In Bihar, Jharkhand, Kerala, Jammu & Kashmir, Haryana, H.P., Punjab and
Rajasthan a majority of sample schools have suggested that the increase in
attendance is due to Sarva Siksha Abhiyaan and increase in awareness towards
education.
Table 5.7 Factors responsible for Increase in Attendance – State-wise
State Increase in
attendance
(%age of
sample school)
Increase in attendance
Attributed to CMDM
If no Other contributing
factors for increase in attendance
Yes No
Andhra Pradesh 95.0 100 0 Arunachal Pradesh
100 93.75 6.25 Awareness towards education,
Bihar 66.67 10.71 89.29 SSA and Awareness towards education
Haryana 50.0 30.0 70.0 Education is prime concern & Awareness towards education
Himachal Pradesh
80.0 37.5 62.5 Awareness towards education, & Education is prime concern
Jammu &Kashmir
100 - 100 Awareness towards education
Jharkhand 86.67 7.69 92.31 SSA Karnataka 100 50.0 50.0 Awareness towards
education, Scholarship/uniform & increase in population
Kerala 95.0 31.58 68.42 Education is prime concern.
Madhya Pradesh 82.5 91.18 8.82 Awareness towards
57

education Maharashtra 97.5 50.0 50.0 Awareness towards
education, Good education
Meghalaya 75.0 86.67 13.33 Awareness towards education, Education is prime concern
Punjab 50.0 44.44 55.56 Education is prime concern, Awareness towards education Good education & Scholarship/uniform
Rajasthan 62.5 14.81 85.19 Education is prime concern
Tamilnadu 40 81.82 18.18 Awareness towards education, Education is prime concern,
Uttar Pradesh 100 100 - - West Bengal 66.67 85.0 15.0 Good education,
Education is prime concern & Awareness towards education
RETENTION
5.5. All the sample schools in states like Bihar, Madhya Pradesh, Maharashtra
and Meghalaya indicated that there has been an increase in the retention rates.
Most of the sample schools in M.P., Andhra Pradesh, Arunachal Pradesh, and
Uttar Pradesh have attributed an increase in retention rates to CMDM. Most of
the sample schools have attributed an increase in retention to Sarva Siksha
Abhiyaan. The following table shows the opinion of teachers on cooked mid day
meal scheme as a factor in increasing the retention of children in the sample
schools.
Table 5.8 Factors responsible for Increase in Retention –State-wise
State Increase in
retention(%age of sample
schools)
Increase in retention
Attributed to CMDM
If no Other contributing
factors for increase in retention
Yes No
Andhra Pradesh 97.5 100 0
58

Arunachal Pradesh
5.88 100 0
Bihar 100 7.5 92.5 SSA and increase in population
Haryana 50 30 70 Education is prime concern Awareness towards education & Increase in population,
Himachal Pradesh
80 37.5 62.5 Awareness towards education, Education is prime concern
Jammu &Kashmir
100 100 -
Jharkhand 90 18.52 81.48 SSA Karnataka 55.56 33.33 66.67 Scholarship/uniform,
Awareness towards education,
Kerala 85 82.35 17.65 Education is prime concern, Good education
Madhya Pradesh
100 100 0 -
Maharashtra 100 66.67 33.33 Education is prime concern, Good education, Awareness towards education
Meghalaya 100 100 - Punjab 50 55.56 44.44 Education is prime
concern, Awareness towards education & increase in population
Rajasthan 95 76.32 23.68 Education is prime concern
Tamilnadu 33.33 77.78 22.22 Education is prime concern,
Uttar Pradesh 97.5 100 0 Scholarship/Uniform West Bengal 63.33 89.47 10.53 Good education Diversion from learning time of children 5.6.1 In some sample states it was reported by the beneficiaries that they were
involved in activities like washing utensils. With regard to washing of the
utensils, out of 17 states where the data was collected, students in 9 states
reported they were involved in washing utensils. Nearly 50% of the sample
students from selected schools in Rajasthan (48.81%) were involved in washing
59

utensils. This was closely followed by students in West Bengal (45.1%) and
Arunachal Pradesh (38.14%). Where students were associated with these
activities, average time spent by students in washing utensils was 15 minutes to
9.83 hrs in a week in the sample selected states. The following table shows the
involvement of children in washing utensils. In Rajasthan, students were
spending an average of 9.83 hrs in a week on washing utensils which is the
highest reported among all the states. This was adversely affecting the learning
of children.
Table 5.9: Diversion from learning time of Children
State Children involvement and Time spent (Hrs/Week) Washing utensils
Involvement % Average time spent Andhra Pradesh - - Arunachal Pradesh
38.14 2.2
Bihar - - Haryana - - Himachal Pradesh
- -
Jammu &Kashmir
16.67 0.15
Jharkhand - - Karnataka - - Kerala - - Madhya Pradesh
28.48 1.69
Maharashtra 8.11 1.32 Meghalaya 33.33 0.60 Punjab 2.83 3.0 Rajasthan 48.81 9.83 Tamilnadu - - Uttar Pradesh 8.48 6.0 West Bengal 45.1 8.57 Diversion from teaching time of teachers 5.6.2 In the sample schools of Tamilnadu, Kerala and Andhra Pradesh teachers
are not involved in the arrangement of provisions and supervision of cooking and
serving of meals. Tamilnadu has separate staff for CMDM. Every school has an
60

organizer, cook and a helper. Data pertaining to the selected schools in the
remaining states revealed the involvement of teachers in arrangement of
provisions, cooking and serving. The following table shows the diversion time of
teachers for arrangement of provision, cooking and serving.
Table: 5.10 Diversion from teaching time of Teachers States Average Hours
spent per day per teacher engaged in the arrangement of provisions
Average Hours spent per day per teacher engaged in cooking
Average Hours spent per day per teacher engaged in serving
Andhra Pradesh - - - Arunachal Pradesh 0.33 1.35 0.37 Bihar 1.22 - 1.01 Haryana 0.58 - 0.21 Himachal Pradesh 0.55 - 0.28 Jammu & Kashmir
0.37 - 0.15
Jharkhand 1.00 - 1.00 Karnataka - 2 - Kerala - - - Madhya Pradesh 0.41 - 0.26 Maharashtra 0.90 1.00 0.46 Meghalaya 1.00 1.15 0.35 Punjab 0.37 0.45 0.22 Rajasthan 0.23 0.29 0.43 Tamilnadu - - - Uttar Pradesh - - 1.00 West Bengal 0.57 - 0.43
5.7 Various organizations and researchers have conducted studies to
evaluate the performance and impact of the Cooked Mid Day Meal Scheme.
Some of these are National Institute of Public Cooperation & Child Development
(2005-06 and 2007), University of Rajasthan and UNICEF (2005), National
Council of Educational Research & Training (2005), Professor Amartya Sen’s
Pratichi Research Team (2005). Besides, various articles on CMDM have also
been published in leading journals. There has been a consensus among all the
studies that CMDM has resulted in an increase in the attendance rates, besides
promoting social equity.
61

Chapter 6
Suggestions and Recommendations
Recommendations The study has identified some factors or potential factors, adversely affecting
the implementation of the CMDM. These factors, given below, deserve
attention from the implementers of the scheme.
1. It is the responsibility of the nodal ministry to review the infrastructure
development meant for mid day meal scheme in the meetings of SMC and
representatives of other nodal ministries which run the infrastructure
development schemes should be invited to these meetings.
2. There is a scope for convergence with schemes like National Rural
Employment Guarantee Scheme for construction of kitchen sheds and
honorarium of cooks cum helpers, Drinking water / toilet through Rajiv
Gandhi Drinking Water Mission and health checkup and micronutrients
through school heath programme under National Rural health Mission.
3. District level SMCs should be made effective - their meetings should be
held regularly so that monitoring and supervision by the Block education
officer/District education officer is ensured through these meeting.
4. Guidelines issued by Government of India regarding the delivery of food
grains by PDS dealer to school directly should be implemented as this will
help in :
i. averting the leakage of food grains from the delivery point and
reduce the supply channel.
ii. taking off pressure from Head Master or implementing authority.
5. A copy of release orders of food grains should be provided to head master
of the school for cross checking the supply made by the fair price shop
dealer every month.
62

6. Steering-cum-monitoring committees should be made functional and
active at district/block levels for effective implementation, convergence
and monitoring of the scheme
7. With prior information to block level committee and Gram Panchayat
Municipality, the funds should be electronically transferred to the account
of Implementing Authority (IA).
8. One member of block level committee should attend the meetings of
school development and management committee so that participation of
member of Parent Teacher Association and PRIs can be ensured.
9. The IA agency should be made responsible for cooking, serving and
cleaning of the utensils and plates and the school staff should be confined
only to supervision of the serving
10. District nodal authority should be strict in getting utilization certificates
from the implementing authority at school level, in time, so that funds/ food
grains are delivered timely.
11. As frequent changes in prices of ingredients especially the prices of oil
and pulses are fluctuating frequently, it is becoming difficult for the IA to
meet the costs. Therefore there must be a regular review of the charges
being paid to IA at least once in 6 months.
12. The earmarked bags need to be stored with the village PRI Head or any
place available in the village for which a nominal rent can be paid.
13. As an implementing agency, local women self help groups or mothers of
children studying in the schools, may be preferred. This would not only
ensure a means of employment and income for the SHGs, but also they
would cook as per the locally prevalent tastes.
14. PPP mode which has been successful in Andhra Pradesh can be
implemented in other states which will ensure a better delivery of service
and therefore a better performance of the scheme.
15. As per the CMDM guidelines, 2006, it is mandatory for the State
Governments/UTs to provide essential micronutrients and de-worming
medicines, and for periodic health check-up. Although most of the states
63

Suggestions
1. Steering-cum-monitoring committees from State to Block level should be
constituted and concerned head at each level should be made responsible
for holding the meetings regularly.
2. PDS suppliers should be mandated in the guidelines of public distribution
system scheme while allocating the food grains for cooked mid day meal.
3. District nodal agency may issue directives to the civil supplies department
to set apart good quality food grains supplied by Food Corporation of India
and mark these bags with special identification marks. Only these
specially earmarked bags should be supplied to the concerned FPS
dealers and the implementing agency should be instructed to accept only
the bags specially earmarked either with distinct color or marks. This
would help to a great extent in ensuring quality and quantity of the cooked
mid day meal.
4. Funds may be earmarked for meeting transport costs from the fair price
shop to the schools as there is no separate provision for the same in the
state budget and this cost is being met from the cooking cost.
5. Village education committees should be invited by the block level officer in
their regular meetings so that their role in managing cooked mid day meal
scheme is specified and their responsibility are incorporated in the
guidelines.
6. For proper monitoring, meetings of steering-cum-monitoring committee at
block level should be held on regular basis. The minutes of the meetings
should be sent to the central, state and district nodal authorities.
7. Orders of the government giving powers to Block level nodal agency to
sanction the conversion charges to the implementing agency on
64

production of utilization certificate should be implemented to ensure
regular payment of conversion charges to implementing agency.
8. All block level nodal authorities may be issued directions for making cash
advances. The bills submitted by implementing authorities at school level
may be settled within a fortnight. The district authorities may release the
first quarter funds without the requirement of expenditure statements.
9. Utilization certificates of food grains/funds from the school should be taken
by the block level officer on priority basis and should be sent to the district
authority so that release of funds is expedited.
65

Abbreviations
CMDM Cooked Mid Day Meal MDM Mid Day Meal NP-NSPE National Programme for Nutritional Support to Primary Education EGS Education Guarantee Scheme AIE Alternative and Innovative Education FCI Food Corporation of India HTS Hill Transport Subsidy PDC Principal Distribution Centre PPP Public Private Partnership SMC Steering –cum- Monitoring Committee VEC Village Education Committee PTA Parent Teacher Association SGRY Sampoorna Grameen Rozgar Yojana NSDP National Slum Development Programme UWEP Urban Wage Employment Programme SSA Sarva Shiksha Abhiyan ARWSP Accelerated Rural Water Supply Programme UT Union Territory MME Management, Monitoring and Evaluation PEO Programme Evaluation Organisation REO Regional Evaluation Officer PEO Project Evaluation Organisation NIC National Informatics centre SDMC School Management and Development Committee BEEO Block Elementary Education Officer PDS Public Distribution System SVSS Saraswati Vahini Sanchalan Samiti NMO Noon Meal Organizer BDO Block Development Officer SHG Self Help Group PRI Panchayti Raj Institutions FPS Fair Price Shop MSHG Mother’s Self Help Group CEO Chief Education Officer ZEO Zonal Education Officer DEO District Education Officer NGO Non-government Organisation CHT Center Head Teacher UC Utilization Certificate PHED Public Health Engineering Department UNICEF United Nations International Children Emergency Fund BEP Bihar Education Project GLR Ground Level Reservoir AWP&B Annual Work Plan and Budgeting
66

Bibliography
1. Khera R., “Mid day meals in Primary Schools: Achievements and Challenges”. Economic and Political Weekly 2006; 41: 4742-4750.
2. Ministry of Human Resource Development. “National Program of Nutritional Support to Primary Education”Guidelines. New Delhi : GOI; 2006. p. 37-39.
3. Dreze J., Goyal A., “Future of mid day meals”, Economic and Political Weekly 2003; 38: 4673-4683.
4. Jain J., Shah M., “Antyodaya Anna Yojana and Mid day meals in MP”, Economic and Political Weekly 2005; 40: 5076-5088.
5. De A., Samson M., Noronha C., “Towards more benefits from Delhi’s Mid-Day Meal scheme” 2005; 1: 1-23.
6. National Nutrition Monitoring Bureau. Diet and Nutritional Status of Rural Populations. Hyderabad: National Institute of Nutrition, Indian Council of Medical Research; 2002.
7. Thorat S., Lee J., “Caste Discrimination and Food Security Programmes”, Economic and Political Weekly 2005; 40: 4198-4201.
8. Gopalan C., “Farms to Pharmacies: Beginnings of a sad decline”. Economic and Political Weekly 2007; 42: 3535-3536.
9. Mitra Deshpande, Rajiv Dasgupta, Ram Baru & Aparna, “The case for cooked mid day meal: Concern regarding the proposed policy shifts in the mid day meal programs” 10. Bedi, Dealjit Singh and Pattnaik, Satyanarayan, “Universalisation of Primary Education-A Myth or Reality”, Kurukshetra, vol. XLV, No.12, September 1997. 11. The Probe Team in association with Centre for Development Economics: “Public Report on Basic Education in India”, Oxford University Press, New Delhi, 1999 12. Dr. Mishra S.N., Dr. Behera, M, “A comparative study of nutritional support to primary education (Mid-day meals scheme) in Orissa and Tamil Nadu”, April, 2000
67

68
13. Theivamani R. (1986) “A study of the impact of the mid day meal schemes on enrolment and retention in the primary and middle schools in Trichirapalli”, India. 14. Yazali Josephine, “Impact of mid day meals programmes on enrolment and retention of girls in primary schools of West Garo Hills in Meghalaya” 15. Jha, Jyotsna and Dhir Jhingran, : Elementary Education for the Poorest and other Deprived Groups, Centre for Policy Research, New Delhi 2002. 16. A report of Government of NCT of Delhi regarding cooked mid day meal-2007 17. Brinda Viswanathan (Feb. 2003) Household food security and Integrated Child Development Services in India 18. Girija S., “Noon Meal schemes in Tamilnadu: An analysis of some issues”, 2002. 19. “Diet and Nutrition status of rural population”, 2002, Technical report 21, Hyderabad. 20. Basu R.V., Dasgupta R., Despande M., Mohanty A., “Full meal or Package deal?” Economic and Political Weekly, June 14, 2008 21. Government of Tamilnadu, 2002a, “Tamilnadu State Policy on Nutrition 2002-03, Department of Social Welfare and Noon Meal Programme”, Chennai.

Annexure-I Chart 1: Number of State-level SMC meetings held per year
State Level SMC Meetings
0 1 2 3 4 5
Jammu & Kashmir
Himachal Pradesh
Punjab
Haryana
Rajasthan
Uttar Pradesh
Bihar
Arunachal Pradesh
Meghalaya
West Bengal
Jharkhand
Madhya Pradesh
Maharashtra
Andhra Pradesh
Karnataka
Kerala
Tamilnadu
Stat
es
Number of SMC Meetings held in a year
(Note: as per the state level schedules)

Table 1: District-wise Nodal Agency and Number of District level SMC Meetings held per year
State Districts Nodal Agency
No. of SMC Meetings held per
year Jammu &Kashmir Udhampur Education Department J & K 8
Himachal Pradesh
Kangra Deputy Director Elem. Education Office 5
Kullu Deputy Commissioner (Nodal officer) 13
Punjab Kapurthala Elementry Education Deptt. Punjab 22 Firozpur Education Dept. Firozpur 16
Haryana Hisar DEEO 0 Jhajjar Dept. of Elementry Education 6
Rajasthan
Bikaner Rural Development Depa. Zila parishad 8
Churu Zila parishad 9 Jhunjhunun Zila Parishad 4 Jaisalmer Zila Parishad Jaisalmer 2
Uttar Pradesh
Budaun District Magistrate 8 Sitapur District Magistrate 13 Jalaun District Magistrate 2
Bihar
Pashchim Champaran M.H.R.D., Govt of Bihar 3 Madhubani District Primary Edu.Dept 10 Madhepura Education Deptt. 3 Rohtas Deptt. of Primary Education 3
Arunachal Pradesh
Lohit School Education Department 0 Tirap Deputy Director School Education 0
Meghalaya
East Khasi Hills Education Deptt.(Elementary & Mass) 4
Jaintia Hills Education Deptt. (Elementary & Mass) 4
West Bengal
Birbhum Office of District Magistrate 29 North 24 Pargana MDM cell 1 Medinipur School Education Department 1
Jharkhand
Dumka Deptt. of primary education 14 Bokaro Dy. Commissioner, Bokaro 2 Ranchi DRDA 1
Madhya Pradesh
Sagar Zila Panchayat, Sagar 3 Shahdol (D R D A) Zila Panchayat Shahdol 4 Indore Zila Panchayat Indor (DRDA) 14 Vidisha Zila panchayat, Vidisha 5
Maharashtra
Washim Zila Parishad, Washim 2 Nagpur District Education, officer 0 Solapur District Education officer (primary) z.p 3 Sangli District Edu. office(primary) 3
Andhra Pradesh
Adilabad School Education Deptt 0 Srikakulam School Education Department 10 West Godavari 0 Anantapur School Education Department 4
Karnataka Bijapur Zila panchayath Bijapur 2

Bidar Zila Panchayat, Bidar 0
Tumkur Zila Panchayat, Tumkur 0
Kerala Kannur General Education Department 2 Thiruvananthapuram General Education Department 0
Tamilnadu
Dharmapuri District Collector 2
Virudhunagar The district collector 0
Tirunelveli Collectorate 0 (Note: as per the state level schedes) Chart 3 Constitution of SMCs at District level
Constitution of SMCs at District level
14
12
20
20
70
38
16
7
19
22
48
35
23
27
14
30
14
12
5
22
0
32
32
38
70
30
14
27
23
48
7
16
20
20
Jammu & Kashmir
Himachal Pradesh
Punjab
Haryana
Rajasthan
Uttar Pradesh
Bihar
Arunachal Pradesh
Meghalaya
West Bengal
Jharkhand
Madhya Pradesh
Maharashtra
Andhra Pradesh
Karnataka
Kerala
Tamilnadu
Stat
es
Number of Districts
Total Districts Districts in which SMCs constituted
(Note: as per the state level schedules)

Chart 4: Constitution of SMCs at Block level
Constitution of SMCs at Block Level
121
51
141
119
237
820
533
84
39
341
212
313
353
1131
177
152
00
0
80
0
0
141
1771131
313
212
39
84
533
820
237
119
51
Jammu & Kashmir Himachal Pradesh
Punjab Haryana
Rajasthan Uttar Pradesh
Bihar
Arunachal Pradesh
Meghalaya
West Bengal
Jharkhand Madhya Pradesh
Maharashtra
Andhra Pradesh Karnataka
Kerala
Tamilnadu
States
Number of Blocks
Total Blocks Blocks in which SMCs constituted
(Note: as per the state level schedules)

Chart 5: Constitution of SMCs at Village Level
Constitution of SMCs at village level
Total No. of SMCs formedVillages in which Primary/EGS/AIE centres openedTotal Villages
(Note: as per the information collected from the state level schedules; information for states of Tamil Nadu, Karnataka and West Bengal could not be captured)
Uttar Pradesh
Rajasthan
Punjab
Meghalaya
Maharashtra
Madhya Pradesh
Kerala
Jharkhand
Jammu & Kashmi
r
Himachal Pradesh
Haryana
Bihar
Arunachal Pradesh
Andhra Pradesh
Stat
es

Annexure-II
Chart 1 (Box Diagram): Distribution/ Spread of the requirement, allotment and utilization of funds
01,
000
2,00
03,
000
4,00
0
Requirement Allot-mentUtilisation
Note: The Y axis shows the funds in figures (in Rs. lakhs)
The chart illustrates the variations in the amount of funds required, allotted and utilized
by the sample districts. The shaded boxes indicate district-wise values of requirement,
allotment and utilization of funds that lie between 25th percentile and 75th percentile (ie.
the amount of data that are without any statistical outliers). Dots lying outside the range,
indicate outliers. The range indicates the minimum and maximum values. The dark line
in the boxes indicates the median values of the variable. As we can see, the boxes which
are not bisected by the median line indicate skewed distribution of data within it. All in
all, this figure juxtaposes and summarises the district level data on requirement, allotment
and utilisation of funds. The points that emerge from the box plots are:
• The requirement for funds, on an average, show a high degree of variability,
which is not matched by the corresponding data on allocation and utilisation of
funds. As can be seen by comparing the spread of the boxed area (shaded area):
the more spread a box, the more variable the data.
• A look at the related levels of the layout of median lines reveals that on an
average utilisation of funds is lower than the stated requirement or allocation.
• Also, we can see that the funds made available were sufficient as can be seen
from a higher median allocation value than those of the median values of
utilisation and requirement.

Chart 2: Correlation between the requirement, allotment and utilisation of funds
Requirement
Allot-ment
Utilisation
0 2000 4000
0
2000
4000
0 2000 40000
2000
4000
Note: The figures on the x-axis and y-axis are funds (in Rs. lakhs) The graph illustrates the degree of correlation between Requirement, Allotment and
Utilisation of funds. The following points emerge:
There has been a high degree of correlation between “allotment and utilisation of
funds” as compared to “requirement and utilisation of funds”.
There has been a fairly high degree of correlation between the “requirement and
allotment of funds”. This indicates that the funds have been allotted in accordance
with the specific requirement of districts.