coordinated oscillations in cortical actin and ca2+ correlate with cycles of vesicle secretion
TRANSCRIPT
ART I C L E S
Coordinated oscillations in cortical actin and Ca2+
correlate with cycles of vesicle secretionR. Wollman1,2 and T. Meyer1,3
The actin cortex both facilitates and hinders the exocytosis of secretory granules. How cells consolidate these two opposing roleswas not well understood. Here we show that antigen activation of mast cells induces oscillations in Ca2+ and PtdIns(4,5)P2 lipidlevels that in turn drive cyclic recruitment of N-WASP and cortical actin level oscillations. Experimental and computationalanalysis argues that vesicle fusion correlates with the observed actin and Ca2+ level oscillations. A vesicle secretion cycle startswith the capture of vesicles by actin when cortical F-actin levels are high, followed by vesicle passage through the cortex whenF-actin levels are low, and vesicle fusion with the plasma membrane when Ca2+ levels subsequently increase. Thus, cells employoscillating levels of Ca2+, PtdIns(4,5)P2 and cortical F-actin to increase secretion efficiency, explaining how the actin cortex canfunction as a carrier as well as barrier for vesicle secretion.
The regulated exocytosis of secretory granules is a fundamental processin all eukaryotic cells1. Successful secretion requires the delivery ofvesicles from inside the cell to the plasma membrane before fusioncan occur. Forty years ago, it was realized that cells have a peripheralmicrofilament web, later identified as the actin cortex, that acts asa mechanical barrier preventing dense-core secretory vesicles fromdocking to the plasma membrane in unstimulated cells2–8. Thisobservation contrasted with the previously studied synaptic vesiclesthat were pre-docked at the plasma membrane and ready to rapidlyfuse. These dense-core vesicles are ubiquitously present in cells and arecharacterized by slower regulated secretion kinetics when comparedwith synaptic vesicles. However, in addition to having a barrier functionfor vesicles, the actin cortex also acts as a carrier that has to bindmyosin V actin motors to capture and transport vesicles to the plasmamembrane to mediate vesicle fusion9–15. This simultaneous functionas a barrier for vesicles and as a matrix required for vesicle transport tothe plasmamembrane raises the question of how cells consolidate theseopposing barrier and carrier roles of the actin cortex.
RESULTSCortical actin acts to facilitate and hinder secretionWe investigated the role of the actin cortex in secretion by focusingon mast-cell-receptor (FcεRI)-triggered granule exocytosis in ratbasophilic leukaemia (RBL) cells, a model for studying antigen-triggeredmast-cell activation and allergic responses16. Consistent with a
1Department of Chemical and Systems Biology, Stanford University, Stanford, California 94305, USA. 2Present address: Department of Chemistry and Biochemistry,University of California San Diego, 92093, San Diego, California, USA.3Correspondence should be addressed to T.M. (e-mail: [email protected])
Received 10 August 2012; accepted 4 October 2012; published online 11 November 2012; DOI: 10.1038/ncb2614
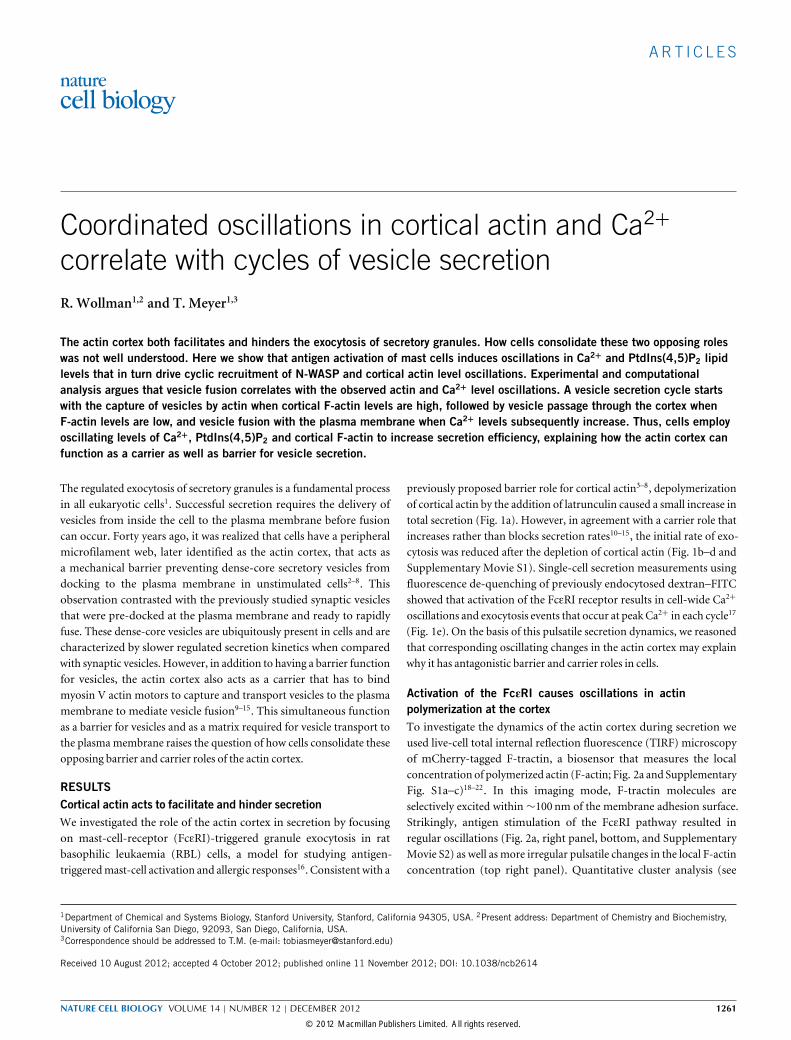
previously proposed barrier role for cortical actin3–8, depolymerizationof cortical actin by the addition of latrunculin caused a small increase intotal secretion (Fig. 1a). However, in agreement with a carrier role thatincreases rather than blocks secretion rates10–15, the initial rate of exo-cytosis was reduced after the depletion of cortical actin (Fig. 1b–d andSupplementary Movie S1). Single-cell secretion measurements usingfluorescence de-quenching of previously endocytosed dextran–FITCshowed that activation of the FcεRI receptor results in cell-wide Ca2+
oscillations and exocytosis events that occur at peak Ca2+ in each cycle17
(Fig. 1e). On the basis of this pulsatile secretion dynamics, we reasonedthat corresponding oscillating changes in the actin cortex may explainwhy it has antagonistic barrier and carrier roles in cells.
Activation of the FcεRI causes oscillations in actinpolymerization at the cortexTo investigate the dynamics of the actin cortex during secretion weused live-cell total internal reflection fluorescence (TIRF) microscopyof mCherry-tagged F-tractin, a biosensor that measures the localconcentration of polymerized actin (F-actin; Fig. 2a and SupplementaryFig. S1a–c)18–22. In this imaging mode, F-tractin molecules areselectively excited within∼100 nm of the membrane adhesion surface.Strikingly, antigen stimulation of the FcεRI pathway resulted inregular oscillations (Fig. 2a, right panel, bottom, and SupplementaryMovie S2) as well as more irregular pulsatile changes in the local F-actinconcentration (top right panel). Quantitative cluster analysis (see
NATURE CELL BIOLOGY VOLUME 14 | NUMBER 12 | DECEMBER 2012 1261
© 2012 Macmillan Publishers Limited. All rights reserved.
ART I C L E S
Time (s)
Inte
nsity (a.u
.)
Lyso
Tra
cker
+Ionomycin and PdbU
Time post-ionomycin and -PdbU (s)
SG
lo
ss (a.u
.)
Time post-antigen (s)
Ca
2+ (a.u
.)
Dextr
an
–F
ITC
(a.u
.)
0
15β-
hexo
am
idase
activity (a.u
.)
DMSO Latrunculin
0
0.1
0.2
0.3
0 20–20 40 60 800
0.5
1.0
0 150 300 450 600 750 900
0.10 100 200 300 400 500 600 700
0.2
0.3
0.4
0.5
LysoTracker Red
VAMP7–pHluorin
VA
MP
7–p
Hlu
orin
0.6
52 s 100 s 151 s 202 s 502 s
a
c
d
b e
Figure 1 Depolymerization of cortical F-actin increases the total amount ofsecreted enzyme but with slower initial kinetics. (a) Population measurementof total secreted β-hexoamidase 30-min post pharmacological activationwith ionomycin (1 µM) and PdbU (100ngml−1) addition to cells pre-treatedwith 4 µM latrunculin (green) or dimethylsulphoxide (DMSO) control(blue). (P <0.001, two-sample t -test, error bars s.e.m., n =64). (b) Timecourse of initial loss of secretory granules (SG) monitored with LysoTracker.Loss of secretory granules is defined as the relative drop in fluorescenceintensity from the intensity before antigen addition. Cells were stimulatedwith ionomycin (1 µM) and PdbU (100ngml−1); control- (DMSO) andlatrunculin-A- (4 µM) pre-treated (5min before drug addition) cells areshown in blue and green, respectively. The error bars show the 95%
confidence intervals (n = 1,258 and 2,623). (c,d) The disappearance ofthe secretory granule marker LysoTracker corresponds to an increase in theexocytosis marker VAMP7–pHlourin. (c) Time series of the secretory granulemarker and pH-sensitive VAMP7–pHlourin. The black vertical line marks theaddition of 1 µM ionomycin and 100ngml−1 PdBU. The dashed lines showthe time points of the snapshots shown in d. Scale bar, 5 µm. Note thatboth a and c are based on LysoTracker marking of secretory granules, with ashowing their loss and c showing the remaining secretory granule intensitycorresponding to the images in d. (e) Time series of Ca2+ (orange) signalsand dextran–FITC (red) release following activation of the mast-cell receptorFcεRI. The increase in pH during vesicle fusion results in de-quenching ofFITC, causing a transient fluorescent secretion signal.
Methods) identified two distinct power spectrum patterns (Fig. 2b, left,and Supplementary Fig. S2). Regular oscillations mapped to the centreregion of the adhesion surface whereas more irregular fluctuationsmapped to the peripheral region (Fig. 2b, right). Furthermore, theperipheral F-actin fluctuations operated locally with a characteristiclength scale of∼1 µm similar to the spatial range of previously observedlamellipodium dynamics23,24, whereas the oscillatory region in thecentre operated globally with a length scale of >5 µm (Fig. 2c; see
Methods). The relative change in cortical F-actin concentration duringthe oscillations was∼15%, as estimated from calibrationmeasurementsusing phalloidin staining (Supplementary Fig. S1).Integration of the spatial location of individual vesicle fusion
events (Fig. 3a, left and middle panels) showed that exocytosis occursexclusively in the centre and not in the peripheral region (Fig. 3a,right, SupplementaryMovie S3). We therefore focused our mechanisticstudies on the centre region.
1262 NATURE CELL BIOLOGY VOLUME 14 | NUMBER 12 | DECEMBER 2012
© 2012 Macmillan Publishers Limited. All rights reserved.

ART I C L E S
Po
wer
sp
ectr
a
of
sin
gle
-pix
el tim
e s
eries
Majo
r perio
d (s
)
Period (s)
0
0.5
1.0
1.5
2.0
2.5
(dB
)
0 2 4 6 8 10 12 14
Distance (µm)
Co
rrela
tio
n
0
Leng
th s
cale
(µm
)
2
4
6
1,000 1,500 2,000 2,500 3,000
Time post-antigen (s)
0.08
0.12
F-t
ractin
in
ten
sity (a.u
.)
0.16
0.1
0.2
0.3
0.4
900 67 34 22
20
0
40
60
80
0
0.5
1.0
a
bc
Figure 2 Receptor-stimulated cell-wide and local F-actin oscillations.(a) Live measurements of local cortical F-actin oscillations using aF-tractin biosensor and TIRF optical sectioning (left). Distinct localcortical F-actin concentration changes are observed at different sites;two representative regions of interest are shown in the periphery (blue)and in the cell centre (green; right). (b) Two types of F-actin oscillationwith distinct power spectra. The amplitudes of the power spectra(decibels, dB) were converted to a colour code (left panel, x axis; periodtime labels) for each pixel in a cell (y axis), and clustered into two
groups. The two subtypes of oscillation map to centre and peripheralcell adhesion regions, respectively. The map (right) shows the projectionof the major period of each local F-tractin power spectrum onto thecell image. (c) Oscillations are synchronized between pixels across theentire centre region but not in the peripheral region. The left panelshows single-site examples with exponential fits to the spatial correlationfunction for pixels in the centre and peripheral regions, respectively. Theimage on the right shows a map of the fitted spatial correlation lengthfor each pixel. Scale bars, 5 µm.
Time post-antigen (s)
Tim
e (s)
X (μm)
F-t
ractin a
nd
PH
-PLCδ (a.u
)
Time post-antigen (s)
0 50–50–100
Lag (s)
Tubby PH-PLCδ
Lag
fro
m C
a2
+ (s)
0
2
4
6
8
Ca
2+ a
nd
Tub
by (a.u
)
123456789
0 1 2
300 400 500 600 700 800 900 1,000 1,100 1,2000
0.2
0.4
0.6
0.8
1.0
900 950 1,000 1,050 1,100 1,150 1,2000
0.2
0.4
0.6
0.8
1.0
0
0.4
Cro
ss-c
orr
ela
tio
n
–0.4
0.8
a
b
c
d e
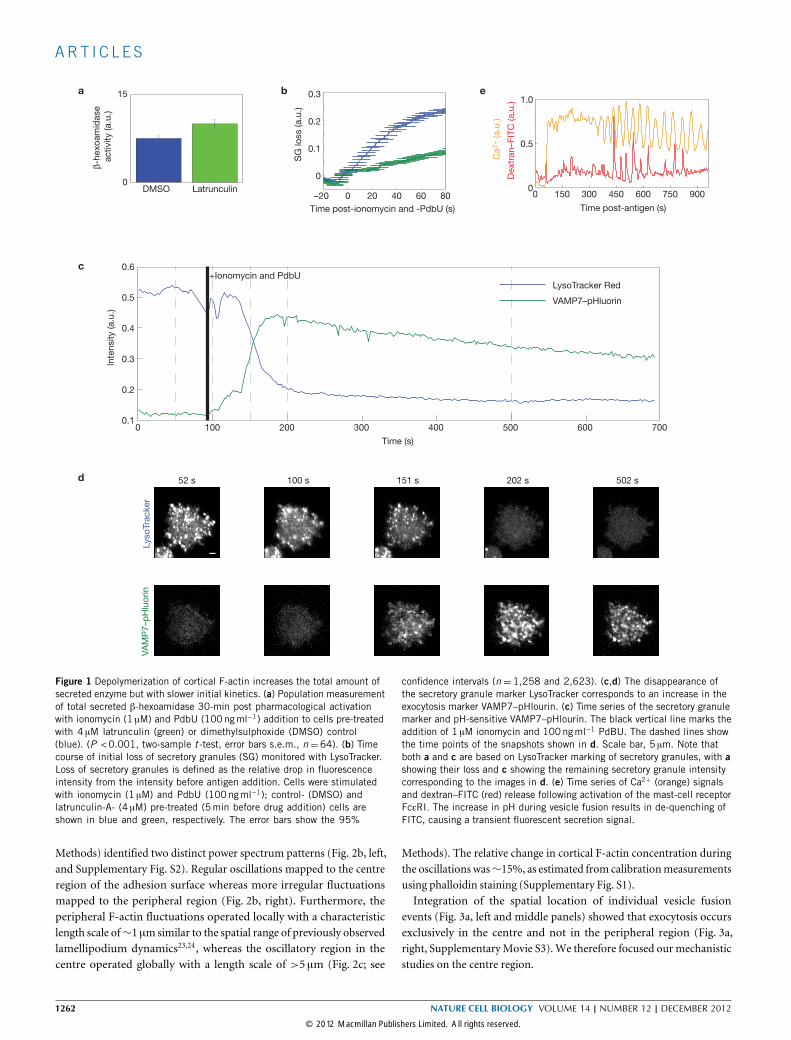
Figure 3 Oscillations in the PtdIns(4,5)P2 lipid precede F-actin oscillations.(a) Secretion occurs exclusively in the centre and not in the peripheralregion. The two micrographs show a cell loaded with the secretory markerdextran–FITC before (left) and 1 s after (right) an exocytosis event. Scalebar, 5 µm. The yellow square marks an exocytosis event. The kymograph inthe middle is taken through the centre of the yellow square. The right panelshows a map projecting 155 exocytosis events from 12 cells according totheir distance from the periphery (monitored in the first 20min after antigenaddition). The red line marks the normalized area where central F-actinoscillations are observed. (b) Synchronized phase-shifted oscillations in
PtdIns(4,5)P2 (monitored with PH-PLCδ) and cortical F-actin. (c) Exampleof a time series of signals measured with epi-fluorescence of Fura-2 (orange;Ca2+ signals) and a second PtdIns(4,5)P2 biosensor, the Tubby domain fromthe Tubby protein tagged with YFP and imaged in TIRF (cyan). Raw data forb,c are presented in Supplementary Table S1. (d) Cross-correlation betweenthe time series shown in c was used to estimate the lag and significanceof the correlation between the two time series. (e) Comparison of the lagbetween Ca2+ and PH-PLCδ with that between Ca2+ and the Tubby domain.The bars show the median lag and the error bars represent the medianabsolute deviation. P =0.57, Wilcoxon rank sum test, n=15.
NATURE CELL BIOLOGY VOLUME 14 | NUMBER 12 | DECEMBER 2012 1263© 2012 Macmillan Publishers Limited. All rights reserved.
ART I C L E S
Lag
to
F-t
ractin
(s)
Time post-antigen (s)
Time post-antigen (s)
F-t
ractin a
nd
N-W
AS
P (a.u
.)
0
0.5
1.0
900 1,000 1,100 1,200 1,3000
5
10
15
N-WASP
N-W
AS
P
PH-PLCδ
PH
-PL
Cδ
FK
BP
–In
p5
4p
0
0
0
1
1
1
350 400 450 500 550 600 650 700 750
a
c
b
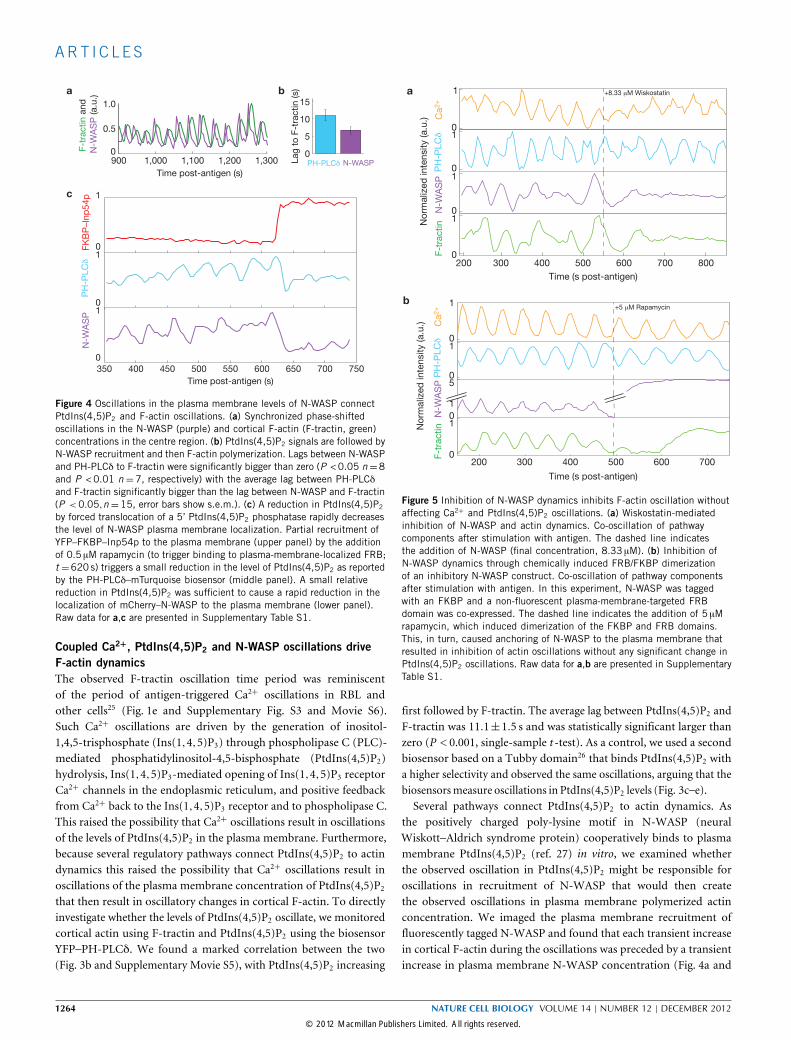
Figure 4 Oscillations in the plasma membrane levels of N-WASP connectPtdIns(4,5)P2 and F-actin oscillations. (a) Synchronized phase-shiftedoscillations in the N-WASP (purple) and cortical F-actin (F-tractin, green)concentrations in the centre region. (b) PtdIns(4,5)P2 signals are followed byN-WASP recruitment and then F-actin polymerization. Lags between N-WASPand PH-PLCδ to F-tractin were significantly bigger than zero (P <0.05 n=8and P <0.01 n =7, respectively) with the average lag between PH-PLCδand F-tractin significantly bigger than the lag between N-WASP and F-tractin(P <0.05,n=15, error bars show s.e.m.). (c) A reduction in PtdIns(4,5)P2
by forced translocation of a 5’ PtdIns(4,5)P2 phosphatase rapidly decreasesthe level of N-WASP plasma membrane localization. Partial recruitment ofYFP–FKBP–Inp54p to the plasma membrane (upper panel) by the additionof 0.5 µM rapamycin (to trigger binding to plasma-membrane-localized FRB;t =620 s) triggers a small reduction in the level of PtdIns(4,5)P2 as reportedby the PH-PLCδ–mTurquoise biosensor (middle panel). A small relativereduction in PtdIns(4,5)P2 was sufficient to cause a rapid reduction in thelocalization of mCherry–N-WASP to the plasma membrane (lower panel).Raw data for a,c are presented in Supplementary Table S1.
Coupled Ca2+, PtdIns(4,5)P2 and N-WASP oscillations driveF-actin dynamicsThe observed F-tractin oscillation time period was reminiscentof the period of antigen-triggered Ca2+ oscillations in RBL andother cells25 (Fig. 1e and Supplementary Fig. S3 and Movie S6).Such Ca2+ oscillations are driven by the generation of inositol-1,4,5-trisphosphate (Ins(1,4,5)P3) through phospholipase C (PLC)-mediated phosphatidylinositol-4,5-bisphosphate (PtdIns(4,5)P2)hydrolysis, Ins(1,4,5)P3-mediated opening of Ins(1,4,5)P3 receptorCa2+ channels in the endoplasmic reticulum, and positive feedbackfrom Ca2+ back to the Ins(1,4,5)P3 receptor and to phospholipase C.This raised the possibility that Ca2+ oscillations result in oscillationsof the levels of PtdIns(4,5)P2 in the plasma membrane. Furthermore,because several regulatory pathways connect PtdIns(4,5)P2 to actindynamics this raised the possibility that Ca2+ oscillations result inoscillations of the plasma membrane concentration of PtdIns(4,5)P2
that then result in oscillatory changes in cortical F-actin. To directlyinvestigate whether the levels of PtdIns(4,5)P2 oscillate, we monitoredcortical actin using F-tractin and PtdIns(4,5)P2 using the biosensorYFP–PH-PLCδ. We found a marked correlation between the two(Fig. 3b and Supplementary Movie S5), with PtdIns(4,5)P2 increasing
0
1+5 μM Rapamycin
+8.33 μM Wiskostatin
0
1
5
0
1
200 300 400 500 600 700 8000
1
Time (s post-antigen)
Time (s post-antigen)
0
10
10
1
0
1
No
rmaliz
ed
in
ten
sity (a.u
.)N
orm
aliz
ed
in
ten
sity (a.u
.)
200 300 400 500 600 700
a
b
F-t
ractin
N-W
AS
PP
H-P
LCδ
Ca
2+
F-t
ractin
N-W
AS
PP
H-P
LCδ
Ca
2+
Figure 5 Inhibition of N-WASP dynamics inhibits F-actin oscillation withoutaffecting Ca2+ and PtdIns(4,5)P2 oscillations. (a) Wiskostatin-mediatedinhibition of N-WASP and actin dynamics. Co-oscillation of pathwaycomponents after stimulation with antigen. The dashed line indicatesthe addition of N-WASP (final concentration, 8.33 µM). (b) Inhibition ofN-WASP dynamics through chemically induced FRB/FKBP dimerizationof an inhibitory N-WASP construct. Co-oscillation of pathway componentsafter stimulation with antigen. In this experiment, N-WASP was taggedwith an FKBP and a non-fluorescent plasma-membrane-targeted FRBdomain was co-expressed. The dashed line indicates the addition of 5 µMrapamycin, which induced dimerization of the FKBP and FRB domains.This, in turn, caused anchoring of N-WASP to the plasma membrane thatresulted in inhibition of actin oscillations without any significant change inPtdIns(4,5)P2 oscillations. Raw data for a,b are presented in SupplementaryTable S1.
first followed by F-tractin. The average lag between PtdIns(4,5)P2 andF-tractin was 11.1±1.5 s and was statistically significant larger thanzero (P < 0.001, single-sample t -test). As a control, we used a secondbiosensor based on a Tubby domain26 that binds PtdIns(4,5)P2 witha higher selectivity and observed the same oscillations, arguing that thebiosensorsmeasure oscillations in PtdIns(4,5)P2 levels (Fig. 3c–e).Several pathways connect PtdIns(4,5)P2 to actin dynamics. As
the positively charged poly-lysine motif in N-WASP (neuralWiskott–Aldrich syndrome protein) cooperatively binds to plasmamembrane PtdIns(4,5)P2 (ref. 27) in vitro, we examined whetherthe observed oscillation in PtdIns(4,5)P2 might be responsible foroscillations in recruitment of N-WASP that would then createthe observed oscillations in plasma membrane polymerized actinconcentration. We imaged the plasma membrane recruitment offluorescently tagged N-WASP and found that each transient increasein cortical F-actin during the oscillations was preceded by a transientincrease in plasma membrane N-WASP concentration (Fig. 4a and
1264 NATURE CELL BIOLOGY VOLUME 14 | NUMBER 12 | DECEMBER 2012
© 2012 Macmillan Publishers Limited. All rights reserved.

ART I C L E S
0
1
Cycle (rad)
Inte
nsity (a.u
.)
−
Ca2+
PI(4,5)P2
N-WASP
F-actin
P < 0.0001
P < 0.05
0
1
100 150 200 250 300 350 400 450 500
0
1
0
1
0
1
500 1000 1500
0
1
0
1
500
0
1
500 1,000 1,500 2,000 2,500 3,0000
1
Time post-antigen (s)
Time post-antigen (s)
+2.5 μM Cytochalasin D
0
1
0
1
0
0
1
400 600 800 1,000 1,2000
1
Time post-antigen (s)
+4 μM Latrunculin +1 μM Thapsigargin
F-t
ractin
N-W
AS
PP
H-P
LCδ
No
rmaliz
ed
in
ten
sity (a.u
.)
No
rmaliz
ed
in
ten
sity (a.u
.)C
a2
+
F-t
ractin
N-W
AS
PP
H-P
LCδ
No
rmaliz
ed
in
ten
sity (a.u
.)
Ca
2+
F-t
ractin
N-W
AS
PP
H-P
LCδ
Ca
2+
a
c
d
e
b
2π
2π
23π
2π2
5π0 π
Figure 6 Synchronized phase-shifted oscillations of Ca2+, PtdIns(4,5)P2,N-WASP and F-actin. Ca2+ oscillations drive cortical F-actin oscillations.(a) Example of a live-cell 5-channel analysis of Ca2+ (Fura2), PtdIns(4,5)P2,N-WASP and F-actin signals showing synchronized oscillations. StoppingCa2+ oscillations using the sarcoplasmic/endoplasmic reticulum Ca2+
pump inhibitor thapsigargin blocks all oscillations. (b) Changes in theintensity of the four biosensors in a representative cell. The time atwhich actin oscillations were inhibited using 4 µM latrunculin is indicated.
(c) Suppressing actin polymerization using cytocholasin D blocked F-actinoscillations but not the other oscillations. Raw data for a–c are presented inSupplementary Table S1. (d) Schematic representation of the Ca2+ pathwaythat generates coordinated cortical F-actin oscillations. P indicates theprobability that the lag between sequential biosensors is bigger than zero onthe basis of cross-correlation analysis of 83 cycles in 4 cells. (e) Averagenormalized cycle intensities of all cycles. The colour codes are the sameacross all panels. The dashed lines in a–c indicate the time of drug addition.
Supplementary Movie S4). The average lag between N-WASPand F-actin was 6.7 ± 1.1 s (P <0.01 for lag bigger than zero).Figure 4b shows a quantitative analysis of a longer delay from thePtdIns(4,5)P2 increase to the F-tractin peak when compared withthe delay from the N-WASP to the F-tractin peak, consistent withthe interpretation that the changes in PtdIns(4,5)P2 drive N-WASPrecruitment (P <0.05, two-sample t -test). Furthermore, partiallowering of the levels of PtdIns(4,5)P2 by recruiting the PtdIns(4,5)P2
phosphatase Inp54p to the plasma membrane (using a FRB/FKBPdimerization method23) reduced the plasma membrane concentration
of N-WASP (Fig. 4c). Thus, although other PtdIns(4,5)P2-sensitiveF-actin regulators are probably involved28, these results suggest thatN-WASP is a link between PtdIns(4,5)P2 and F-actin oscillations inthe centre region of cells.Together, these data suggest a mechanism for the observed actin
oscillations. The positive-feedback-based Ca2+ oscillations causeoscillations in the plasma membrane concentration of PtdIns(4,5)P2
that then result in oscillatory recruitment of N-WASP to theplasma membrane. N-WASP oscillatory recruitment to the membranethen causes oscillations in cortical actin polymerization. To further
NATURE CELL BIOLOGY VOLUME 14 | NUMBER 12 | DECEMBER 2012 1265
© 2012 Macmillan Publishers Limited. All rights reserved.

ART I C L E S
∗∗∗
NS
Lyn MyoVa
Fo
ld c
han
ge
SG
SG
SG
0 1Actin
Cap
ture
Fu
sio
n
0 1
0 1
Actin
Passag
e
0 0.15
Secretion rate (a.u.)
Time (s)
0 0
1
0
1
Ca
2+
Actin
Vp
m
Secre
tio
n
Vcortex
Vco
rtex
Vpm
2 × 10⁻³
GFP–myosin Va
before antigen
GFP–myosin Va
after antigen
Model inputs:
Model output:
0
0.1
0
0.001
0
1
0.25
0.50
0.75
0246
0 30 60 90
Constant optimal
Constant average
Oscillatory
0
1
2
Ca2+
a
c d
b
Figure 7 Mathematical model of how phase-shifted oscillations incortical F-actin and Ca2+ correlate with a repetitive cycle of vesiclecapture, passage and fusion to enhance secretion rates. (a) Scheme ofthe mathematical model. Inset: The F-actin and Ca2+ dependencies ofthe three vesicle-state transitions: capture, passage and fusion. Vcortexand Vpm are the respective concentrations of vesicles bound to the actincortex and plasma membrane. SG, secretory granule. (b) Simulationoutput of the model. The upper panel shows the model input: Ca2+
and F-actin oscillations. The middle panel shows the changes in theconcentration of actin-bound (blue) and plasma-membrane-bound(green) vesicles. The lower panel shows the output, the secretion rate.(c) Comparison of model predictions of secretion rates for oscillatoryand constant F-actin and Ca2+ input levels. Two levels of constant Ca2+
and F-actin are shown: average, where the F-actin and Ca2+ levels arethe mean of the oscillatory inputs, and optimal, where the levels werechosen to maximize the total secretion. (d) Monitoring antigen-triggeredrecruitment of myosin Va, a motor protein that binds vesicles to F-actinand transports them. The left micrographs show that recruitment ofmyosin Va occurs in the centre where fusion occurs (maximum projectionbefore and 2min after antigen addition; scale bars, 5 µm). The rightbar graph shows that, during F-actin oscillation cycles, the recruitmentpreferentially occurs when the F-actin levels are high. As a control, theaverage intensity of a GFP membrane marker (Lyn) is compared withGFP–myosin Va (MyoVa) during low-actin (light green) and high-actin(dark green) phases during oscillations. Error bars are s.e.m., n =83,∗∗∗P <0.001, Student’s t -test; NS, not significant.
test this mechanism we developed an assay that allowed us tovisualize this entire pathway live in a single cell by performingsimultaneous 5-channel live-cell monitoring of cytoplasmic Ca2+
levels using Fura-2 by epi-fluorescence imaging and N-WASP,F-tractin and PH-PLCδ by TIRF imaging. As predicted by thismodel, all four signals oscillated with the same frequency butshifted phases (Figs 5 and 6). Pharmacological agents were thenused to further examine this model by inhibiting the oscillationsat different levels in the pathway. Inhibition of N-WASP dynamicsusing the small-molecule inhibitor wiskostatin (Fig. 5a) dissociatedN-WASP from the plasma membrane, blocked F-actin oscillations andreduced total cortical F-actin without affecting Ca2+ or PtdIns(4,5)P2.Similarly, rapamycin-mediated plasma membrane recruitment ofan inhibitory N-WASP–FKBP12 fusion construct29 suppressed actinoscillations without affecting Ca2+ or PtdIns(4,5)P2 oscillations(Fig. 5b). The addition of the endoplasmic reticulum Ca2+ pumpinhibitor thapsigargin rapidly stopped all four oscillations (Fig. 6a).This argued that the observed PtdIns(4,5)P2 oscillations are probablya result of Ca2+ oscillations periodically activating Ca2+-sensitive PLC.Finally, blocking the most downstream oscillation of F-actin by theaddition of latrunculin B (Fig. 6b) or cytochalasin D (Fig. 6c) showedthat oscillations in Ca2+, PtdIns(4,5)P2 and N-WASP continuedafter the inhibition of actin oscillations as predicted by the linearpathway mechanism. Thus, linked Ca2+ and PtdIns(4,5)P2 oscillations
function as drivers of cortical F-actin oscillations in the centreadhesion surface (Fig. 6d).To map the sequence of events during each of the oscillation cycles,
we averaged the signals from different cycles using the peak Ca2+
level as an anchor (Fig. 6e). This analysis showed that a Ca2+ increase(orange) and concomitant PtdIns(4,5)P2 reduction (cyan) precedethe drop in plasma-membrane-localized N-WASP (purple), whichin turn precedes a drop in F-actin polymerization (green). As theCa2+ levels decrease and the PtdIns(4,5)P2 levels increase, N-WASP isagain recruited to the plasma membrane, followed by an increase inF-actin polymerization.
Computational model linking oscillating cortical actin toenhanced secretion efficiencyWe next considered the possibility that coupled Ca2+ and actinoscillations may explain the antagonistic barrier and carrier functionof the actin cortex. We reasoned that oscillatory actin dynamicswould allow cytoplasmic vesicles to be captured when actin iselevated, pass to the plasma membrane when cortical actin is loweredand fuse with the plasma membrane when Ca2+ is subsequentlyincreased. To evaluate how such a system may work, we constructeda simplified mathematical model (Fig. 7a–b and Supplementary Note).The scheme in Fig. 7a shows how the model defines the F-actinand Ca2+ dependencies of the vesicle capture, passage and fusion
1266 NATURE CELL BIOLOGY VOLUME 14 | NUMBER 12 | DECEMBER 2012
© 2012 Macmillan Publishers Limited. All rights reserved.
ART I C L E S
Passage
Tim
e
SG
Cytoplasm
PM
SG
N-WASP
Myosin Va
F-actin
SG
SG
SG
SG
SG
SG
SG
SG
SG
SG
Fusion
SG
Capture
200 300 400 500 600 700 800 900 1,000
+Thapsigargin
Time post-antigen (s)
+Jasplakinolide
0 100 200 300 400 500 600 700 800 900
Time post-antigen (s)
Exo
cyto
sis
Non-osc:
DMSO:
∗∗∗
NS
NS NS NS ∗
n.a.∗ ∗∗∗ ∗∗∗
0
1.4
Antigen
Thaps DMSOFollowed by: CytoD Jasplak
Before drug: n.a. ∗∗∗ ∗∗∗ ∗∗∗ NS
0
0.2
0.4
0.6
0.8
1
0
0.2
0.4
0.6
0.8
1
a d
b
c
Ca
2+ (a.u
.)
Dextr
an
–F
ITC
(a.u
.)
Ca
2+ (a.u
.)
Dextr
an
–F
ITC
(a.u
.)
PtdIns(4,5)P2
Ca2+
Capture
Fusion
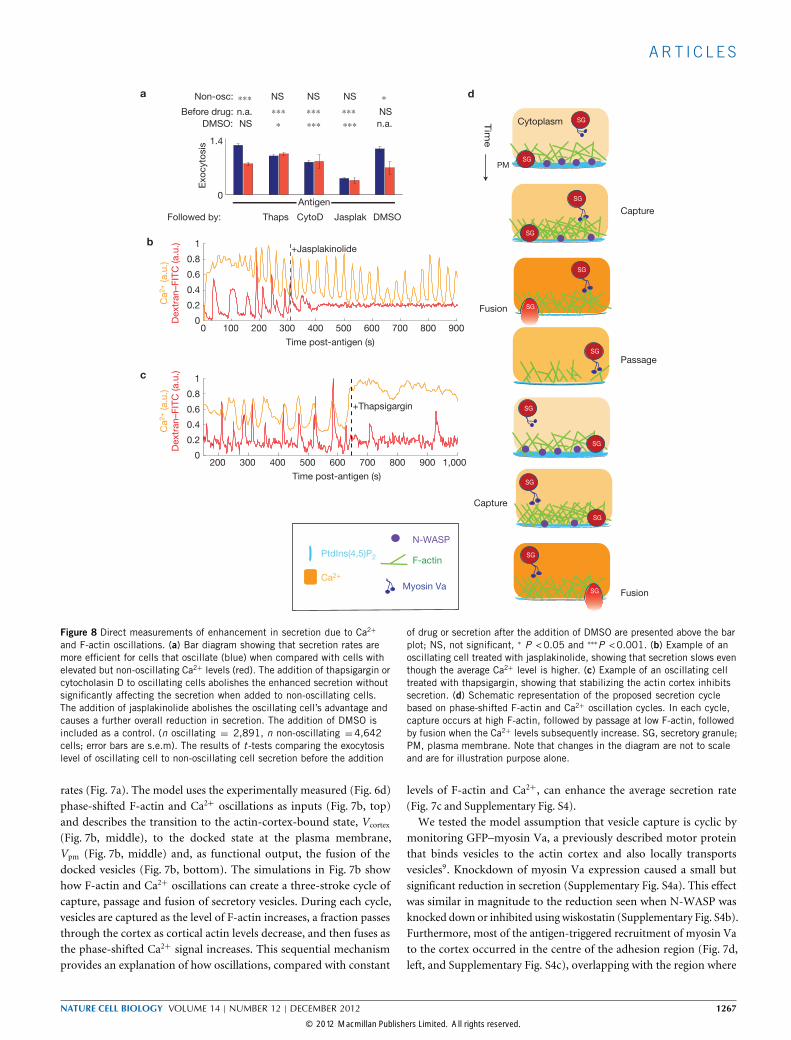
Figure 8 Direct measurements of enhancement in secretion due to Ca2+
and F-actin oscillations. (a) Bar diagram showing that secretion rates aremore efficient for cells that oscillate (blue) when compared with cells withelevated but non-oscillating Ca2+ levels (red). The addition of thapsigargin orcytocholasin D to oscillating cells abolishes the enhanced secretion withoutsignificantly affecting the secretion when added to non-oscillating cells.The addition of jasplakinolide abolishes the oscillating cell’s advantage andcauses a further overall reduction in secretion. The addition of DMSO isincluded as a control. (n oscillating = 2,891, n non-oscillating =4,642cells; error bars are s.e.m). The results of t -tests comparing the exocytosislevel of oscillating cell to non-oscillating cell secretion before the addition
of drug or secretion after the addition of DMSO are presented above the barplot; NS, not significant, ∗ P <0.05 and ∗∗∗P <0.001. (b) Example of anoscillating cell treated with jasplakinolide, showing that secretion slows eventhough the average Ca2+ level is higher. (c) Example of an oscillating celltreated with thapsigargin, showing that stabilizing the actin cortex inhibitssecretion. (d) Schematic representation of the proposed secretion cyclebased on phase-shifted F-actin and Ca2+ oscillation cycles. In each cycle,capture occurs at high F-actin, followed by passage at low F-actin, followedby fusion when the Ca2+ levels subsequently increase. SG, secretory granule;PM, plasma membrane. Note that changes in the diagram are not to scaleand are for illustration purpose alone.
rates (Fig. 7a). The model uses the experimentally measured (Fig. 6d)phase-shifted F-actin and Ca2+ oscillations as inputs (Fig. 7b, top)and describes the transition to the actin-cortex-bound state, Vcortex
(Fig. 7b, middle), to the docked state at the plasma membrane,Vpm (Fig. 7b, middle) and, as functional output, the fusion of thedocked vesicles (Fig. 7b, bottom). The simulations in Fig. 7b showhow F-actin and Ca2+ oscillations can create a three-stroke cycle ofcapture, passage and fusion of secretory vesicles. During each cycle,vesicles are captured as the level of F-actin increases, a fraction passesthrough the cortex as cortical actin levels decrease, and then fuses asthe phase-shifted Ca2+ signal increases. This sequential mechanismprovides an explanation of how oscillations, compared with constant
levels of F-actin and Ca2+, can enhance the average secretion rate(Fig. 7c and Supplementary Fig. S4).We tested the model assumption that vesicle capture is cyclic by
monitoring GFP–myosin Va, a previously described motor proteinthat binds vesicles to the actin cortex and also locally transportsvesicles9. Knockdown of myosin Va expression caused a small butsignificant reduction in secretion (Supplementary Fig. S4a). This effectwas similar in magnitude to the reduction seen when N-WASP wasknocked down or inhibited using wiskostatin (Supplementary Fig. S4b).Furthermore, most of the antigen-triggered recruitment of myosin Vato the cortex occurred in the centre of the adhesion region (Fig. 7d,left, and Supplementary Fig. S4c), overlapping with the region where
NATURE CELL BIOLOGY VOLUME 14 | NUMBER 12 | DECEMBER 2012 1267
© 2012 Macmillan Publishers Limited. All rights reserved.

ART I C L E S
most of the vesicle fusion occurs (Fig. 3a). Finally, a statistical analysisshowed that myosin Va recruitment occurs preferentially during peakcompared with trough F-actin levels during oscillations (Fig. 8d, right),supporting the model assumption of a cyclic capture of vesicles atpeak levels of F-actin.We then tested the prediction that oscillations make secretion more
effective by comparing secretion rates in cells exhibiting oscillatingCa2+ levels with cells exhibiting persistently elevated Ca2+ levels.Both types of cell can be found in response to the same antigenstimulus. Indeed, oscillating cells (blue, Fig. 8a and SupplementaryFig. S5) show ∼30% higher secretory rates when compared withcells with persistently elevated Ca2+ levels (red). To directly comparesecretion during oscillatory Ca2+/F-actin changes versus persistentCa2+ elevation, we added the endoplasmic reticulum Ca2+ pumpblocker thapsigargin that increases Ca2+ levels and found that cells withoscillations before the addition of thapsigargin subsequently reducedexocytosis rates to levels comparable to those of non-oscillating cells(Supplementary Movie S7). An example trace is shown in Fig. 8b,where the addition of thapsigargin keeps Ca2+ at a persistently highlevel while reducing the rate of secretion (Fig. 8c). We further testedwhether the advantage of oscillating cells is eliminated when weblock actin oscillations with either an actin polymerization inhibitorcytochalasin D, or an actin filament stabilizer jasplakinolide (Fig. 8b).Both inhibitors reduced the secretion rates of oscillating cells byapproximately ∼30%, to the same rate as those of non-oscillatingcells (Fig. 4a). In agreement with a barrier role for the actin cortex,jasplakinolide, which stabilizes cortical actin, reduced the level ofsecretion in both cases even further (Fig. 8a,c).
DISCUSSIONThe evolution of biological control systems such as the one of regulatedsecretion involves optimization between conflicting requirements. Ourstudy suggests that an oscillating system design can be employed bycells to optimize the reliability and efficiency of dense-core vesiclesecretion. The challenge for regulated secretion is that the actin cortexis critically required for cells to maintain cell shape and prevent theformation of membrane blebs30. Yet, as appreciated 40 years ago2, thesame cortical actin that is critical for a cell’s integrity prevents the accessof secretory granules to the plasma membrane. This barrier effect ofthe actin cortex is probably important in many cell types to minimizeinadvertent secretion in response to short stimuli that are too short orweak to lower the barrier. At the same time, secretory granules needto be transported from the cell interior to the vicinity of the plasmamembrane in a process requiring microtubules to get the vesiclescloser to the periphery and actin-motor-mediated transport to getthem docked to the plasma membrane1. This apparent barrier–carrierparadox therefore provides an excellent example of the evolution ofdynamic regulatory strategies to optimize cell function given multipleconstraints on the system.Our study introduces a dynamic secretory system design that uses
oscillations in cortical actin to temporally partition the opposingfunctions of the actin cortex. We show that cells employ phase-shiftedoscillations of Ca2+, PtdIns(4,5)P2, N-WASP and F-actin to enhancesecretion. The coupled Ca2+ and F-actin oscillations correlate witha vesicle secretion recruitment and fusion engine that repeatedlytransitions between three strokes: capture at high F-actin levels,
passage through the actin cortex at low F-actin levels, followed byCa2+-triggered fusion (Fig. 8d). Thus, cells can consolidate opposingroles of a control element by oscillating its concentration andtemporally partition the associated regulatory processes. Given theubiquitous presence of oscillating systems in biology, it is possiblethat many of them evolved to resolve similar opposing constraints. Asin the case of dense-core vesicle secretion, such optimized oscillatorysystems probably have a general role in enhancing the effectiveness androbustness of different cellular outputs. �
METHODSMethods and any associated references are available in the onlineversion of the paper.
Note: Supplementary Information is available in the online version of the paper
ACKNOWLEDGEMENTSThis work was supported by NIH grants MH064801 and GM030179 to T.M.
AUTHOR CONTRIBUTIONST.M. and R.W. designed experiments and wrote the manuscript. R.W. performed allexperiments and data analysis.
COMPETING FINANCIAL INTERESTSThe authors declare no competing financial interests.
Published online at www.nature.com/doifinder/10.1038/ncb2614Reprints and permissions information is available online at www.nature.com/reprints
1. Morgan, A. & Burgoyne, R. D. Secretory granule exocytosis. Phys. Rev. 82,581–632 (2003).
2. Orci, L., Gabbay, K. H. & Malaisse, W. J. Pancreatic β-cell web: its possible role ininsulin secretion. Science 175, 1128–1130 (1972).
3. Cheek, T. R. & Burgoyne, R. D. Nicotine-evoked disassembly of cortical actinfilaments in adrenal chromaffin cells. FEBS Lett. 207, 110–114 (1986).
4. Koffer, A., Tatham, P. E. & Gomperts, B. D. Changes in the state of actinduring the exocytotic reaction of permeabilized rat mast cells. J. Cell Biol. 111,919–927 (1990).
5. Chowdhury, H. H., Popoff, M. R. & Zorec, R. Actin cytoskeleton depolymerizationwith Clostridium spiroforme toxin enhances the secretory activity of rat melanotrophs.J. Physiol. 521, 389–395 (1999).
6. Frigeri, L. & Apgar, J. R. The role of actin microfilaments in the down-regulationof the degranulation response in RBL-2H3 mast cells. J. Immunol. 162,2243–2250 (1999).
7. Becker, K. A. & Hart, N. H. Reorganization of filamentous actin and myosin-II inzebrafish eggs correlates temporally and spatially with cortical granule exocytosis.J. Cell Sci. 112, 97–110 (1999).
8. Nishida, K. et al. FcεRI-mediated mast cell degranulation requires calcium-independent microtubule-dependent translocation of granules to the plasmamembrane. J. Cell Biol. 170, 115–126 (2005).
9. Eichler, T. W., Kögel, T., Bukoreshtliev, N. V. & Gerdes, H-H. The role of myosinVa in secretory granule trafficking and exocytosis. Biochem. Soc. Trans. 34,671–674 (2006).
10. Narasimhan, V., Holowka, D. & Baird, B. Microfilaments regulate the rate ofexocytosis in rat basophilic leukemia cells. Biochem. Biophys. Res. Commun. 171,222–229 (1990).
11. Li, G. et al. Effect of disruption of actin filaments by Clostridium botulinum C2toxin on insulin secretion in HIT-T15 cells and pancreatic islets. Mol. Biol. Cell 5,1199–1213 (1994).
12. Oheim, M. & Stühmer, W. Tracking chromaffin granules on their way through theactin cortex. Eur. Biophys. Journal 29, 67–89 (2000).
13. Lang, T. et al. Role of actin cortex in the subplasmalemmal transport of secretorygranules in PC-12 cells. Biophys. J. 78, 2863–2877 (2000).
14. Nightingale, T. D. et al. Actomyosin II contractility expels von Willebrand factor fromWeibel-Palade bodies during exocytosis. J. Cell Biol. 194, 613–629 (2011).
15. Masedunskas, A. et al. Role for the actomyosin complex in regulatedexocytosis revealed by intravital microscopy. Proc. Natl Acad. Sci. USA 108,13552–13557 (2011).
16. Rivera, J., Fierro, N. A., Olivera, A. & Suzuki, R. New insights on mast cell activationvia the high affinity receptor for IgE. Adv. Immunol. 98, 85–120 (2008).
17. Kim, T. D., Eddlestone, G. T., Mahmoud, S. F., Kuchtey, J. & Fewtrell, C. CorrelatingCa2+ responses and secretion in individual RBL-2H3 mucosal mast cells. J. Biol.Chem. 272, 31225–31229 (1997).
1268 NATURE CELL BIOLOGY VOLUME 14 | NUMBER 12 | DECEMBER 2012
© 2012 Macmillan Publishers Limited. All rights reserved.

ART I C L E S
18. Johnson, H. W. & Schell, M. J. Neuronal IP3 3-kinase is an F-actin-bundling protein:role in dendritic targeting and regulation of spine morphology. Mol. Biol. Cell 20,5166–5180 (2009).
19. Rak, G. D., Mace, E. M., Banerjee, P. P., Svitkina, T. & Orange, J. S. Natural killercell lytic granule secretion occurs through a pervasive actin network at the immunesynapse. PLoS Biol. 9, e1001151 (2011).
20. Lazarides, E. & Weber, K. Actin antibody: the specific visualization of actin filamentsin non-muscle cells. Proc. Natl Acad. Sci. USA 71, 2268–2272 (1974).
21. Edelstein, A., Amodaj, N., Hoover, K., Vale, R. & Stuurman, N. Computercontrol of microscopes using microManager. Curr. Protoc. Mol. Biol. Unit14 20,10.1002/0471142727.mb1420s92(2010).
22. Snapper, S. B. & Rosen, F. S. The Wiskott-Aldrich syndrome protein (WASP): roles insignaling and cytoskeletal organization. Annu. Rev. Immunol. 17, 905–929 (1999).
23. Ponti, A., Machacek, M., Gupton, S. L., Waterman-Storer, C. M. & Danuser, G.Two distinct actin networks drive the protrusion of migrating cells. Science 305,1782–1786 (2004).
24. Giannone, G. et al. Periodic lamellipodial contractions correlate with rearward actinwaves. Cell 116, 431–443 (2004).
25. Meyer, T. & Stryer, L. Calcium spiking. Annu. Rev. Biophys. Biophys. Chem. 20,153–174 (1991).
26. Chapman, E. R. Synaptotagmin: a Ca(2+) sensor that triggers exocytosis?. Nat. Rev.Mol. Cell Biol. 3, 498–508 (2002).
27. Papayannopoulos, V. et al. A polybasic motif allows N-WASP to act as a sensor ofPIP(2) density. Mol. Cell 17, 181–191 (2005).
28. Janmey, P. A. & Lindberg, U. Cytoskeletal regulation: rich in lipids. Nat. Rev. Mol.Cell Biol. 5, 658–666 (2004).
29. Suh, B. C., Inoue, T., Meyer, T. & Hille, B. Rapid chemically inducedchanges of PtdIns(4,5)P2 gate KCNQ ion channels. Science 314,1454–1457 (2006).
30. Sheetz, M. P., Sable, J. E. & Dobereiner, H. G. Continuous membrane-cytoskeletonadhesion requires continuous accommodation to lipid and cytoskeleton dynamics.Ann. Rev. Biophys. Biomol. Struct. 35, 417–434 (2006).
NATURE CELL BIOLOGY VOLUME 14 | NUMBER 12 | DECEMBER 2012 1269
© 2012 Macmillan Publishers Limited. All rights reserved.

METHODS DOI: 10.1038/ncb2614
METHODSNucleic acid reagents. mTurquoise–NWASP, mCitrine–NWASP, mCitrine–PH-PLCδ and mTurquoise–PH-PLCδ were cloned into Clontech-C1-like mTurquoiseand mCitrine vectors. F-tractin–GFP was a gift from M. Schell (Departmentof Pharmacology, Uniformed Services University, USA) and was sub-clonedto replace the fluorescent protein with mCerulean, mCherry and tdTomato.GFP–myosin Va was a gift from J. Spudich (Department of Biochemistry,Stanford University, USA). siRNA reagents for N-WASP were purchased fromSigma Aldrich (cat. no. SASI_Rn02_00251193, 5′-GGAACAAGAGCTATACAAT-3′
and SASI_Rn02_00251194, 5′-GGGAACAAGAGCTATACAA-3′). siRNA againstmyosin Va were purchased from Dharmacon (cat. no. MQ-094195-00-0005,5′-GAUUAGAGGUGCUGAACUG-3′, 5′-GAUCAGCGCAGCAGGGUUU-3′, 5′-CCAAACUCAUUUAUACGUA-3′, 5′-GCACAAGCAUAUAUUGGUU-3′). Con-trol non-targeting siRNA was purchased from Dharmacon (cat. no. D-001206-14-05, 5′-UGGUUUACAUGUCGACUAA-3′).
Chemicals. The Fura-2 and Flou-4Ca2+ dyes were used at 1–4 µMand thapsigarginwas used at 1 µM. (Invitrogen). The N-WASP inhibitor wiskostatin (Sigma) wasused at 8.33 µM. Latrunculin B (used at 4 µM), cytochalasin D (used at 2.5 µM) andjasplakinolide (used at 2 µM) were purchased from EMD Chemicals.
Cell culture and electroporation. RBL-2H3 cells (ATCC) were cultured inDMEM supplemented with 10% FBS (Invitrogen). In all experiments withthe exception of that in Fig. 1, cells were sensitized overnight with anti-TNP IgE (BD Biosciences) and stimulated by the addition of 10–100 ngml−1
multivalent BSA–TNP with loading of 26 TNPs per BSA (Biosearch Technologies).Pharmacological activation in Fig. 1was donewith 1 µMionomycin and 100 ngml−1
PdbU (Sigma). For all fluorescent reporter experiments and siRNA knockdowns,cells were electroporated using Amaxa nucleufactor following the manufacturer’sinstructions (kit T, program X001).
Microscopy. Cells were imaged using a custom-built prism TIRF microscopewith 5 laser lines (442, 473, 514, 532 and 650). The microscope was equippedwith a Lambda Sutter LS arclamp with an internal filter wheel and anotheremission filter wheel controlled using a Lambda Sutter 10-2. Images were capturedusing a QuantEM electron-multiplying CCD (charge-coupled device) camerafrom Photometrics. A schematic of the light path is shown in SupplementaryFig. S6. Estimation of channel bleed-through on this microscope is provided inSupplementary Fig. S7. Lasers were combined on an optical table using SemrockLaserMUX single-edge dichroic mirrors. Each laser was controlled by a Vincentshutter controlled using D122 or D1 control boxes. As the communication speedwith the D122 is relatively slow (maximum baud rate of 300 char s−1), all lasershutters were controlled using the through-the-lens signal generated using anArduino control board. To combine epi-fluorescence we added a 10/90 broadspectrum beam splitter configured such that 10% of the epi-fluorescence excitationlight passed to the sample and 90% of the emission light passed to the camera. Theemission filters are shown in Supplementary Fig. S6b. The exposure times were100–500ms using gain values of 250–500. The duration between two consecutiveframes was less than 5 s. A histogram of the actual frame difference time for arepresentative experiment is shown in Supplementary Fig S6c.
The microscope was controlled using a custom Matlab interface to the open-sourceMicro-manager software21. During acquisition, immediately after each framewas transferred from the camera to the computer RAM, a time stamp was recorded.Imaging was done using water dipping ×60 and ×10 objectives for the high- andlow-resolution imaging respectively. Cells were labelled withWGA-647 (Invitrogen)that was used with a 650 nm laser line for image-based autofocus. During time-lapseacquisition, an image-based autofocus correction was employed by performing an8 µm Z sweep to identify the Z point of maximal contrast. Autofocus was performedevery ∼30–60 s automatically during acquisition only in high-resolution (×60)imaging.
Secretion assays. Total secretion experiments were performed using an enzymaticassay to measure total secretion of β-hexoamidase. Secretion was measured using2.5 µMof 4-methylumbelliferylN -acetyl-β-d-glucosaminide (Sigma), a compoundthat changes its fluorescence properties after it is processed by the secreted enzymeβ-hexoamidase. The fluorescence signal was measured using a Victor3 plate readerfromPerkinElmer. In each well, the secretion level after the stimulus was normalizedto the total β-hexoamidase after cell permeabilization using 1% Triton. Secretionrate experiments were carried out by measuring the disappearance rate of thesecretory granule marker LysoTracker Red (Invitrogen) using low-resolution (×10)TIRF microscopy. LysoTracker marks all low-pH organelles in the cells, whenimaged in TIRF, owing to the thin optical section, and it predominantly markssecretory granules. Time-lapse stacks were segmented to identify single cells and thetotal loss of initial secretory granule intensity was quantified over time.
Exocytosis assays. Dextran–FITC (Sigma) exocytosis assays were carried out afterincubating cells with 1mgml−1 dextran–FITC for 48 h using a protocol provided byD. Holowka, Cornell University, USA. Time-lapse stacks were segmented to identifysingle cells and the intensity of dextran–FITC was measured using continuousTIRF imaging of the green channel that was interrupted every 3–5 s to acquirethe Fura-340 and Fura-380 epi-fluorescence channels. Exocytosis was quantifiedby first identifying peaks in each cells’ dextran–FITC intensity time series. Peakswere defined as local maxima above a threshold to eliminate noise. To correct fordifferences in the loading of dextran–FITC between experiments, the number ofpeaks in each cell was divided by the average number of peaks per cell in a movie.Oscillatory cells were identified on the basis of the Fura-2 ratio time series usingspectrogram analysis with a frequency window of 1/15 to 1/60 s.
Image analysis and initial data processing. All images were corrected for unevenillumination and photobleaching as a first step before any further analysis wasperformed. Uneven illumination was corrected using a background-subtractionprocedure. To estimate the background, a non-parametric model for the unevenillumination that is based on thin-plate two-dimensional splines was estimatedand subtracted from all frames. Photobleaching correction of TIRF stacks wascarried out using epi-fluorescence images of the same channel. Epifluorescenceimages were collected once every 30 TIRF images. Interpolation of the loss offluorescence in the epifluorescence images was used to correct the TIRF stacks.Further analysis was performed on each cell separately. Cell masks were estimatedfor each frame using a combination of user-specified boundaries and segmentationof one of the channels using a Gaussian mixture model (GMM) segmentationalgorithm. GMM segmentation was able to accurately separate a cell from thebackground, but is unable to separate touching cells. Touching cells were separatedusing a polygonal region of interest. The final cell mask was defined as all ofthe foreground pixels identified by the GMM algorithm that are within theuser-specified polygon. In cases in which x–y drift was a concern, images wereregistered using a sequential normalized cross-correlation algorithm. All analysiswas done using custom Matlab programs using the image analysis and signalprocessing toolboxes.
Time-series processing. Time-series data were estimated either per pixel or fora user-defined region of interest. The pixel intensity data per frame and the timestamp for that frame were used to interpolate the data to a uniform grid (Tgrid). Anequal spacing time grid was chosen (Tgrid) such that the time difference betweentwo interpolation points in the grid is the average time difference between channels.Then a linear interpolation procedure was employed for each channel time seriesseparately to estimate the channel intensities on the time grid Tgrid. This procedureresulted in a matrix where all intensities are from the same time point. Thisinterpolatedmatrix was then used for further analysis. This analysis proceduremadethe analysis independent of the order of channel acquisition. An example of a timeseries of acquisition times and the gridified matrix is shown in Supplementary Fig.S14d. For the cross-correlation analysis, a high-pass filter was applied to the timeseries and the output was normalized to a maximal autocorrelation value of 1. Toaid visualization of the oscillatory dynamics all time-series data were filtered usinga high-pass filter with a width >300 s. An example of the analysis routine withintermediate results is provided in Supplementary Fig. S8.
Cluster analysis of fluctuating actin regions. Time-lapse images were firstcorrected for uneven illumination and photobleaching and registered in x–y asdescribed above. The aligned stack was used to create ∼12,000 time series forintensity changes for the biosensor F-tractin. Frequency power spectrum analysiswas used to identify the regularity of the oscillations and their major period. Inaddition, the range (1–99% percentile interval) was calculated for all of the timeseries. These three dimensions (regularity, major period and range) were used asinputs to GMM clustering analysis for two populations. The boundary between thetwo populations was the two-dimensionalmanifold where the posterior distributionfor each of the two populations was 0.5. Supplementary Fig. S3 shows an example ofa scatter plot used for clustering.
Spatial correlation analysis. The correlation coefficient between every two timeseries in the cells as well as their Euclidean distance was measured (∼80,000,000pairs per cell). The data were binned (single-pixel width; 0.26 µm) and fitted withan exponentially decaying function (Fig. 2c). The length scale was defined as thedistance over which the correlation decays.
Measurement of F-actin levels after thapsigargin and EGTA treatment. Cellswere sensitized with IgE overnight and stimulated with TNP-BSA similar to live-cellanalysis. At 10min after TNP stimulation, thapsigargin (1 µM) with and without10mM EGTA or buffer control were added to cells. At 5min after drug addition,the cells were fixed and stained with DAPI and phalloidin Alexa-594 according
NATURE CELL BIOLOGY
© 2012 Macmillan Publishers Limited. All rights reserved.

DOI: 10.1038/ncb2614 METHODS
to the manufacturer’s protocol. Several hundred cells (743 for the control, 895for thapsigargin+EGTA and 1,559 for thapsigargin) were imaged per treatment.Binary masks were generated using Otsu thresholding on the DAPI intensity andthe phalloidin intensity within each mask per cell was quantified.
Statistical analysis. The following statistical tests were used throughout the paper.To test for the existence of a lag, cross-correlation analysis on two time series was
performed (as explained above) for multiple cells. In each cell, the cross-correlationanalysis provided a single value of lag where cross-correlation is maximal. Using thispopulation of lags, a single-sample t -test was used to estimate whether the lag valuewas significantly different from zero. The P values in Fig. 4b are the values for whichthe lags between N-WASP and F-actin and between PtdIns(4,5)P2 and N-WASPwere significantly different from zero.
To test the difference between lags of different biosensors, first a populationof lags for each marker was estimated as described above and a statistical test tocompare the two populations was performed. In Fig. 4d we show average lag valuesand therefore use a parametric two-sample t -test. In Supplementary Fig. S5c, owingto the existence of a few outliers, themedian value is presented and a non-parametricWilcoxon rank-sum test was performed.
To test the significance of different treatments on β-hexoamidase secretion(Supplementary Figs S1 and S10), multiple wells were measured and a two-samplet -test was performed comparing each of the treatment against controls.
To test the significance of the change in cortical F-actin after treatment withthapsigargin (Supplementary Fig. S4a) and thapsigargin + EGTA, cells were treatedas described above and two sample t -tests were performed comparing them tocontrol cells.
NATURE CELL BIOLOGY
© 2012 Macmillan Publishers Limited. All rights reserved.

S U P P L E M E N TA RY I N F O R M AT I O N
WWW.NATURE.COM/NATURECELLBIOLOGY 1
DOI: 10.1038/ncb2614
300 400 500 600 700 800 900 10000.85
0.9
0.95
1
1.05
1.1
Time past Ag [sec]
YFP-ActinF-Tractin-CFPWGA-647 0.9 0.95 1 1.05 1.1
0.9
0.95
1
1.05
1.1
YFP-Actin
F-Tr
actin
-CFP
F-Tractin provides 46% increase S2N
0 200 400 600 800 1000 12000
0.2
0.4
0.6
0.8
1
Time [sec]
F-Tr
actin
[AU
]
a b
d
100 200 300 400 5000.385
0.39
0.395
0.4
0.405
0.41
0.415
Time post Ag [sec]
Calc
ium
100 200 300 400 5000.115
0.12
0.125
0.13
0.135
0.14
0.145
F-Tr
actin
Time post Ag [sec]Osc Thaps
0
0.2
0.4
0.6
0.8
1
F-Tr
actin
fold
cha
nge
Control Thaps Thaps+EGTA
0
0.5
1
1.5
Phal
loid
in In
tens
ity [A
U]
f
c
e f g
Figure S1 Changes in the intensity of the biosensor F-Tractin reflect changes in total actin concentration. a Co-oscillation of YFP-actin and F-Tractin-mCerulean measured in a 12mm x 12mm ROI in the center of the cell. F-Tractin and YFP actin has the identical phase with F-Tractin oscillations. F-Tractin has higher relative amplitude of oscillations due to an improved signal to noise compared to yfp-actin that reports filamentous actin compared to soluble monomers plus filamentous actin. These oscillations are not seen when monitoring a plasma membrane marker WGA-647 (Wheat Germ Agglutnin conjugated to alexa 647). This shows that actin oscillations are not a result of changes in the Z-position of the cell. b Quantification of the improved signal to nose of F-Tractin compared to actin. Time series of F-Tractin-mCerulean and YFP-Actin where normalized to show % change from average and plotted in a scatter plot against each other. The slope of the linear regression line (1.46) shows that F-Tractin has a ~46% improved signal to noise over directly measuring Actin in our TIRF imaging set-up. c Time series of F-Tractin, showing the base line actin fluctuation levels (T=0 to T=200) compared to the oscillations post oscillations (T>200). d-g
Estimation of the change in relative F-actin concentration from peak to trough in an oscillatory cycle. d To capture cells at either peak or trough we used the addition of either Thapsigargin alone or Thapsigargin with EGTA to antigen stimulated cells. The levels of actin cortex after these drug manipulations was estimated using TIRF imaging of phallodin-alexa 594 stained cells. Cells with low calcium (Thaps + EGTA) had a 14% increase in their actin cortex compared to control whereas cell with high calcium (Thaps) had 50% reduction in their actin cortex (P-value <0.005 for both treatments, N=743, 895 and 1559 for Control, Thaps and Thaps+EGTA. Errorbars show s.e.m.). (e,f,g) Measurements of calcium (e) and F-Tractin (f) during oscillations and after the addition of Thapsigargin. g The magnitude of F-Tractin change during oscillation (Osc) was 23% of the level of F-tractin change seen after the addition of Thapsigargin. At the same time, addition of Thapsigargin (as shown in panel a), the actin levels were reduced by 64% from their peak levels without calcium. Therefore it can be estimated that the approximate change of cortical F-actin during oscillation is ~15% (=23% * 64%).
© 2012 Macmillan Publishers Limited. All rights reserved.

S U P P L E M E N TA RY I N F O R M AT I O N
2 WWW.NATURE.COM/NATURECELLBIOLOGY
1 1.5 2 2.5 3 3.5 40
0.05
0.1
0.15
0.2
0.25
0.3
0.35
Maximal regular oscillatory component [d B
Rang
e of
osc
illat
ion
[AU
]
a
b
e
0
1
Range [AU]
Major Period [sec]
20
40
60
80
c
d
Figure S2 Cluster analysis of the F-Tractin timeseries. a Maximum projection of F-Tractin-mCherry timelapse data shows higher levels of polymerized actin in the periphery of cells. b An intensity based Gaussian mixture model clusters the pixels in the cells into two regions. c Map of the range of actin oscillations defined as the 1% to 99% of the intensities in the F-Tractin timeseries. d For each pixel, a major period was identified in the power-spectral analysis and converted to a color coded amplitude. The center pixels all have identical major periods. e Scatter plot representing the
three dimensional data used for the cluster analysis: the range of intensity during oscillations the magnitude of the maximal regular oscillation and the period (color coded). The dashed line shows the 2D projection of the identified clusters boundary. f Color matrix shows the obtained secretion rates from simulation with various levels of constant Calcium and Actin. The bottom panel shows the product of the Capture and Passage transitions as a function of Actin. The right panel shows the fusion transition as a function of Calcium. Scale-bar 5 μm.
© 2012 Macmillan Publishers Limited. All rights reserved.

S U P P L E M E N TA RY I N F O R M AT I O N
WWW.NATURE.COM/NATURECELLBIOLOGY 3
0 100 200 300 400 500 600 7000
0.01
0.02
0.03
0.04
0.05
Time post Ag [sec]
TIRF
Flo
u4 [A
U]
20
30
40
50
60
70
80
90
0
5
10
15
20
25
30
35
Major Period [sec]
Length Scale [µm]
a
bc
d e
Period [sec]
69 46 35 28 23 20 17 150
1
2
Power spectra [dB]
Actin
Ca
0 0.2 0.4 0.6 0.8 1
0
0.1
0.2
0.3
0.4
0.5
0.6
0.7
0.8
0.9
1
0
0.005
0.01
0.015
0.02
0Capt
ure
*Pa
ssag
e
00.
20.
40.
60.
81
01 Fusion
Secretion [AU]
f
Figure S3 Control analysis of the spatial and temporal scale of calcium oscillations and results of the mathematical model when Calcium and Actin are kept constant. a Example of a time series of Ca2+ at the bottom of the cell as imaged by TIRF microscopy of a flou4 calcium sensitive dye showing uniform Ca2+ oscillations. b and c. A period map analysis of Ca2+ oscillation on a pixel basis identical to the actin analysis shown in Fig 1 and S3. Analysis routine used is in panels b,c is identical to the one
used figure 1c. This analysis showed that Ca2+ oscillations have the same frequency everywhere in the cell. d Analysis of the spatial scale of calcium oscillations shows that oscillations are synchronized across the entire cell (after occasionally observed wave propagations in the first few oscillations). Analysis routine used is identical to the one used in figure 1d. e Maximal projection of the Flou4 intensity, cell was segmented manually to separate it from neighboring cells. Scale-bar 5 μm.
© 2012 Macmillan Publishers Limited. All rights reserved.

S U P P L E M E N TA RY I N F O R M AT I O N
4 WWW.NATURE.COM/NATURECELLBIOLOGY
Myo
sin
Va
inte
nsity
[AU
]
0 0.5 10.8
11.21.41.61.8
distance from cell center
a
b
0 100 200 300 400 500 600 700 800 9000.02
0.04
0.06
0.08
0.1
0.12
0.14
0.16
0.18
Time post Ag [sec]
F−Tr
actin
[AU
]
c
+ 1.5 mM Jasplakinolide
Actin
N-WASP
siCon
trol
siNW
ASP-
#1siN
WAS
P-#2
β-he
xoam
idas
e se
cret
ion
(% o
f con
trol
)
d
siNWASP−#1
siNWASP−#2
Control
Wiskosta
tin
[8.33 mM]
00.20.40.60.8
11.2
** *** **
Actin
MyoVa
siCon
trol
siMyo
VasiControl siMyoVa
0
0.2
0.4
0.6
0.8
1
1.2
***
β-he
xoam
idas
e se
cret
ion
(% o
f con
trol
)37 kDa
50 kDa
37 kDa
200 kDa
Figure S4 Control experiments on the role of GFP-Myosin Va and N-WASP in secretion. a-b Total secretion using b-hexoamidase assay after siRNA knockdown of non targeting control and knockdown of MyosinVa (a) and N-WASP (b). Western blots confirm knockdown levels and boxplot show total secretion. (** P-value < 0.01, *** P-value < 0.001, two sample t-test comparing with control wells, N=8 per treatment). Panel b also shows that pharmacological inhibition of N-WASP with Wiskostatin reduces secretion to
similar levels as the siRNA treatment (two sample t-test, p-value>0.15, N=8 per treatment). c Quantification of levels of GFP-Myosin Va in cells after antigen stimulation. Red line shows the average distance of the boundary between the pulsatile and oscillatory regions from cluster analysis that was performed on F-Tractin time series from 45 cells. A total of 9 cells where used to estimate MyosinVa recruitment, errorbars are s.e.m. d Control experiments, showing that addition of 2 mM Jasplakinolide completely stops actin oscillations.
© 2012 Macmillan Publishers Limited. All rights reserved.

S U P P L E M E N TA RY I N F O R M AT I O N
WWW.NATURE.COM/NATURECELLBIOLOGY 5
200 400 600 8000
0.5
1
Time after Ag [sec]200 400 600 800
0
0.5
1
Time after Ag [sec]
200 400 600 8000
0.5
1
Time after Ag [sec]200 400 600 800
0
0.5
1
Time after Ag [sec]
200 400 600 8000
0.5
1
Time after Ag [sec]200 400 600 800
0
0.5
1
Time after Ag [sec]
200 400 600 8000
0.5
1
Time after Ag [sec]200 400 600 800
0
0.5
1
Time after Ag [sec]
Calci
um [A
U]Ex
ocyt
osis
Freq
uenc
y
−15 −7.5 0 7.5 150
1
Time [sec]
a
b
Figure S5 Additional examples of calcium and dextran-FITC time series. a Additional examples are shown of time series of calcium (orange) and dextran FITC (red) in cells activated with antigen. b Histogram of timing of exocytosis peaks in relation to the average calcium cycle.
© 2012 Macmillan Publishers Limited. All rights reserved.

S U P P L E M E N TA RY I N F O R M AT I O N
6 WWW.NATURE.COM/NATURECELLBIOLOGY
505 nm edge dichro
ic
552 nm edge dichro
ic
613 nm edge dichro
ic
mirror
10/90 dich
roic Arclamp
QuantEMEM-CCD
594
514
442
Dove-tail prism
650
Shutters, TTL controledvia an Arduino borard
a
Imaging chamber
Immersion oil
Excitation �lter wheel & shutter
60x1.00 NA
water
b
506.99 551.54 596.09 640.64 685.200.11
0.12
0.13
0.14Ca
lciu
m
Time [sec]
506.99 551.54 596.09 640.64 685.200.18
0.19
0.2
0.21
0.22
0.23
PHpl
cδ
Time [sec]
506.99 551.54 596.09 640.64 685.20
0.150.160.170.180.19
0.2
N−W
ASP
Time [sec]
506.99 551.54 596.09 640.64 685.20
0.150.160.170.180.19
0.2
F-Tr
actin
Time [sec]
Fura
-2CF
P ( m
Turq
uise
/ m
Ceru
lean
)YF
P ( m
Citr
ine
/ Ve
nus)
mCh
erry
200 300 400 500 600 700 8000
0.5
1
Wavelength [nm ]
200 300 400 500 600 700 8000
0.5
1
Wavelength [nm ]
200 300 400 500 600 700 8000
0.5
1
Wavelength [nm ]
200 300 400 500 600 700 8000
0.5
1
Wavelength [nm ]
d
c
0 5 10 150
500
1000
1500
2000
2500
Time between timepoints (same channel) [Sec]
Freq
uenc
y
4 4. 5 50
200
400
600
800
dt [sec]
Freq
uenc
y
466 nm edge dichro
ic
473
Emision �lter wheel
Figure S6 Description of microscopy set-up and time series analysis. a Schematic of the light path on the prism-based TIRF used in this study. 5 laser lines were combined on an optical table using single edge dichroics where each laser has its own shutter. The combined laser line was targeted to a prism such that it will pass through the immersion oil and reflect from the water-coverslip interface at a shallow angle. The reflection at shallow angle results from a evanescent wave that penetrates ~100 nm into the sample. Epi illumination was performed through a 10/90 beamsplitter and a Sutter arclamp. b Spectral map of the main fluorescent proteins and dyes used in this work overlaid on the excitation (for Fura-2) laser lines
(dotted-dashed lines) and emission (rectangles) used. c Example of the distribution of time between frames of same channel. The small population with dt > 10 sec is the frames where autofocus routine was employed. Inset shows a zoom of the region between 4-5 seconds where majority of time intervals were. d Demonstration of the interpolation routine used to “gridify” timeseries to the same grid. Raw measurements for all channels are shown with blue x marker and interpolated values are shown in red points. Note that all red points have the same time values, allowing for comparisons of delays between channels independent of the order of acquisition and duration of exposures.
© 2012 Macmillan Publishers Limited. All rights reserved.

S U P P L E M E N TA RY I N F O R M AT I O N
WWW.NATURE.COM/NATURECELLBIOLOGY 7
Fura-2 to CFP:
CFP Fura-2 (380) Epi
Cherry to YFP:
Cherry YFP
YFP to Cherry:
Cherry YFP
CFP to YFP:
YFP CFP YFP CFP
YFP to CFP:
Fura2C Y2C C2 Y Y2R R2 Y0
1
2
3
4
5
6
7
8
9
10
% B
leed
thro
ug
h (i
ncl
ud
ing
au
toflu
ore
scen
ce)
Figure S7 Quantification of level of bleed-through and auto-fluorescent signals in the TIRF setup used in this study. Bar plot show the % signal seen in the “bleed-through” channel for all pairs of channels that are close to each other within the spectra. Arrows are used to point to cells transfected with only one color of fluorescent protein (eg CFP and not YFP). Note that cellular auto-fluorescent will also contribute to apparent
bleed-through and was not corrected in the images. All images show pairs of channels with potential bleed-through between channels. In all cases the intensity of the correct marker could be seen but not any signal in the cells not expressing that marker. This demonstrates that channel bleed-through makes only a minimal contribution to the measured signals. Scale-bar 5 μm.
© 2012 Macmillan Publishers Limited. All rights reserved.

S U P P L E M E N TA RY I N F O R M AT I O N
8 WWW.NATURE.COM/NATURECELLBIOLOGY
0 500 10000.4
0.6
0.8
Background & photobleaching correction
0 500 10000.5
0.6
0.7High pass data − required for reliable xcorr
0 500 10000
0.5
1Final rescaled result
0 500 1000
0.95
1
1.05
Alternative normalization
900 1000 1100 12000
0.5
1
Zoomed (=main fig 2)
a
b
c
d
e
f
g
0 200 400 600 800 1000 1200350
400
450
500
550
600
650
700Raw data
Figure S8 Step-by-step tracking of the time series analysis. a PH-plcd (top left) and F-Tractin (top right) images compared to the result of the actin dynamics cluster analysis (bottom left) and an overlay of PH-plcd and F-Tractin (bottom right). scale-bar 5 mm. b The raw intensity time series averages in the central oscillatory region (shown as white pixels in panel a bottom left). c Time series after correction for photo-bleaching, background subtraction and rescaling. d Removal of trends
in the time series. Frequencies at least an order of magnitude lower than the measured main oscillation frequency are removed, allowing for a reliable cross-correlation analysis. e Rescaling of the result. f Alternative normalization by rescaling to the average signal. g Zoomed view of panel f that is also shown in main Fig. 2c. In panels b-g: x-axis shows the time of antigen additions in seconds and the y-axis shows corrected fluorescence intensity.
© 2012 Macmillan Publishers Limited. All rights reserved.

S U P P L E M E N TA RY I N F O R M AT I O N
WWW.NATURE.COM/NATURECELLBIOLOGY 9
Supplemtary Movies
Movie S1 Secretion after pharmacological activation. Low resolution (10x) TIRF timelapse of SG marker after the addition of Ionomycin and PdbU. Movie is sped up x25 times (7fps imaging dt = ~3.5 sec), scale bar 20 mm.
Movie S2 F-Tractin Oscillations. High resolution (60x) TIRF timelapse of F-Tractin (left) and the temporal derivative (dF-Tractin/dt) on the right. Movie is sped up x60 times (15 fps imaging dt = ~4 sec), scale bar 5 mm.
Movie S3 High resolution imaging of exocytosis after physiological activation. Exocytosis of dextran-FITC after stimulation with antigen. Movie is sped up x7 times (7 fps imaging dt = ~1 sec), scale bar 5 mm.
Movie S4 F-Tractin and N-WASP oscillations. High resolution (60x) TIRF timelapse of F-Tractin (left), N-WASP (middle) and membrane marker Lyn. Bottom row shows the temporal derivative. Movie is sped up x35 times (10 fps imaging dt = ~3.5 sec), scale bar 5 mm.
Movie S5 F-Tractin and PH-plcd oscillations. High resolution (60x) TIRF timelapse of F-Tractin (left), and PH-plcd (right) Bottom row shows the temporal derivative. Movie is sped up x60 times (15 fps imaging dt = ~4 sec), scale bar 5 mm.
Movie S6 Calcium oscillation. TIRF imaging of calcium dynamics at the bottom of cells using Flou-4 calcium sensitive dye.
Movie S7 Exocytosis after physiological stimulation. Low resolution (10x) TIRF/Epi imaging of Fura-2 (left, pseudo-colored) and dextran-FITC (right). Scale bar 32 mm.
Supplementary Note. Mathematical model. Description of the mathematical model that analyzes the effect of oscillatory Ca2+ and F-actin dynamic on secretory granule secretion.
Supplementary Data. Code implementing the mathematical model. Matlab code that implements the model described in the Supp. Note.
Supplementary Table 1. Raw data for all TRIF time series presented in figures 3,4,5,6. Raw data is shown after correction for photo bleaching.
© 2012 Macmillan Publishers Limited. All rights reserved.