coordination in a discrete multi-articular movement from a
TRANSCRIPT

Movement coordination in a discrete multi-
articular action from a dynamical systems
perspective
Robert Rein
A thesis submitted for the degree of
Doctor of Philosophy
at the University of Otago, Dunedin
New Zealand
May 2007

ii
Abstract Dynamical systems theory represents a prominent theoretical framework for the investigation of movement coordination and control in complex neurobiological systems. Central to this theory is the investigation of pattern formation in biological movement through application of tools from nonlinear dynamics. Movement patterns are regarded as attractors and changes in movement coordination can be described as phase transitions. Phase transitions typically exhibit certain key indicators like critical fluctuations, critical slowing down and hysteresis, which enable the formulation of hypotheses and experimental testing. An extensive body of literature exists which tested these characteristics and robustly supports the tenets of dynamical systems theory in the movement sciences. However, the majority of studies have tended to use a limited range of movement models for experimentation, mainly bimanual rhythmical movements, and at present it is not clear to what extent the results can be transferred to other domains such as discrete movements and/or multi-articular actions. The present work investigated coordination and control of discrete, multi-articular actions as exemplified by a movement model from the sports domain: the basketball hook shot. Accordingly, the aims of the research programme were three-fold. First, identification of an appropriate movement model. Second, development of an analytical apparatus to enable the application of dynamical systems theory to new movement models. Third, to relate key principles of dynamical systems theory to investigations of this new movement model. A summary of four related studies that were undertaken is as follows:
1. Based on a biomechanical analysis, the kinematics of the basketball hook shot in four participants of different skill levels were investigated. Participants were asked to throw from different shooting distances, which were varied in a systematic manner between 2m and 9m in two different conditions (with and without a defender present). There was a common significant trend for increasing throwing velocity paired with increasing wrist trajectory radii as shooting distance increased. Continuous angle kinematics showed high levels of inter- and intra-individual variability particularly related to throwing distance. Comparison of the kinematics when throwing with and without a defender present indicated differences for a novice performer, but not for more skilled individuals. In summary, the basketball hook shot is a suitable movement model for investigating the application of dynamical systems theory to a discrete, multi-articular movement model where throwing distance resembles a candidate control parameter.
2. Experimentation under the dynamical systems theoretical paradigm usually entails the systematic variation of a candidate control parameter in a scaling procedure. However there is no consensus regarding a suitable analysis procedure for discrete, multi-articular actions. Extending upon previous approaches, a cluster analysis method was developed which made the systematic identification of different movement patterns possible. The validity of the analysis method was demonstrated using distinct movement models: 1) bimanual, wrist movement, 2) three different basketball shots, 3) a basketball hook shot scaling experiment. In study 1, the results obtained from the cluster analysis approach matched results obtained by a traditional analysis using discrete relative phase. In study 2, the results from the method matched the a-priori known distinction into three different basketball techniques. Study 3 was designed specifically to facilitate a bimodal throwing pattern due to laboratory restrictions in throwing height. The cluster analysis again was able to identify the a-priori known distribution. Additionally, a hysteresis effect for throwing distance was identified further strengthening the validity of the chosen movement model.
3. Using eight participants, hook shot throwing distance was varied between 2m and 9m in both directions. Some distinct inter-individual differences were found in regards to movement patterning. For two subjects clear transitions between qualitatively distinct

iii
different patterns could be established. However, no qualitative differences were apparent for the remaining participants where it was suggested that a single movement pattern was continually scaled according to the throwing distance. The data supported the concept of degeneracy in that once additional movement degrees of freedom are made available these can be exploited by actors. The underlying attractor dynamics for the basketball hook shot were quite distinct from the bistable regime typically observed in rhythmical bimanual movement models.
4. To provide further evidence in support of the view that observed changes in movement patterning during a hook shot represented a phase transition, a perturbation experiment with five participants was performed. Throwing distance was once again varied in a scaling manner between 2m and 9m. The participants wore a wristband which could be attached to a weight which served as a mechanical perturbation to the throwing movement. Investigation of relaxation time-scales did not provide any evidence for critical slowing down. The movements showed high variation between all subsequent trials and no systematic variation in relation to either the mechanical perturbation or the successive jumps in throwing distance was indicated by the data.
In summary, the results of the research programme highlighted some important differences between discrete multi-articular and bimanual rhythmical movement models. Based on these differences many of the findings ubiquitous in the domain of rhythmical movements may be specific to these and accordingly may not be readily generalized to movement models from other domains. This highlights the need for more research focussing on various movement models in order to broaden the scope of the dynamical systems framework and enhance further insight into movement coordination and control in complex neurobiological systems.

iv
Acknowledgments First, I would like to thank my parents Heinz and Ljubica Rein, who never put any pressure on me and not only let me do my own thing but always were highly supportive. Next, I would like to thank both my supervisors, Chris Button and Keith Davids. Both who were always highly supportive of my ideas, providing me with the necessary guidance and piece of advise when I started to take off into some nebulous realms without really knowing what I am supposed to do there. I also have to thank all the people from the Otago PE Motor control and Biomechanics group, which includes Jia Yi Chow, Stuart Moyle, Matt Dicks, Peter Lamb, Nick Flyger, Shigetada Kudo, and Rick Shuttleworth without whom I would not have been able to complete my PhD. An especially big thank you to Jia Yi, who helped me quite a bit during all stages of my PhD and helped me keeping my sanity during those somewhat strange PhD years. Thanks to Allan Carman I was able to use the Motion Analysis system from the Otago School of Physiotherapy. Another, thanks goes to Greg Anson and the dark side who always tried to tempt me by “constructively” challenging my work and my understating of motor control. Equally, Jim Cotter with whom I started to interact far too late, unfortunately. In general, I am thankful to the whole PE staff for solving all the little problems I had. Cheers Nick Beharrell for letting me sleep in the Smithells Gym. Warm greetings also to Mark and Katie Falcous who were quite influential in integrating a German into New Zealand. I also have to pay tribute to the Pacific Ocean. Of all the places to work on a PhD there possibly cannot be a better place than that one next to the ocean throwing all these wonderful waves at the shores of New Zealand. Last but definitively not least, I am grateful to my partner Claudia who helped and supported me all the way, especially when I was starting to struggle once again. Thank you so much.

v
Table of Content
1 CHAPTER ONE : INTRODUCTION............................................................................1
2 CHAPTER TWO : LITERATURE REVIEW ..............................................................3 PART ONE - THEORETICAL OVERVIEW OF LITERATURE ...................................................................................... 3
Bernstein’s Legacy: Defining coordination ................................................................................................... 3 The Dynamical Systems Theory (DST) and Movement coordination ............................................................ 6 Conclusion – Part One................................................................................................................................. 41 Prerequisites for a different movement model ............................................................................................. 42
PART TWO - LITERATURE OF BASKETBALL HOOK SHOT ..................................................................................... 44 Defining the Hook Shot................................................................................................................................ 44 Research on basketball throwing actions .................................................................................................... 45 Conclusion: Part Two.................................................................................................................................. 49
3 CHAPTER THREE: ANALYSING THE BASKETBALL HOOK SHOT ..............52 INTRODUCTION.................................................................................................................................................. 52 METHOD............................................................................................................................................................ 53
Participants.................................................................................................................................................. 53 Procedures ................................................................................................................................................... 54 Data Analysis............................................................................................................................................... 54
RESULTS............................................................................................................................................................ 58 Mixed-modelling of ball release data .......................................................................................................... 58 Movement time............................................................................................................................................. 64 Performance scores ..................................................................................................................................... 64 Temporal joint lag ....................................................................................................................................... 65 Joint lag variation........................................................................................................................................ 68 Angle-angle plots ......................................................................................................................................... 69
DISCUSSION....................................................................................................................................................... 73 CONCLUSION ..................................................................................................................................................... 78
4 CHAPTER FOUR: ANALYZING DISCRETE MULTI-ARTICULAR ACTIONS 79
PREREQUISITES FOR A MEASUREMENT TOOL ..................................................................................................... 79 EXISTING ANALYSIS METHODS .......................................................................................................................... 80
Relative phase .............................................................................................................................................. 80 Principal Component Analysis..................................................................................................................... 81 Self-organizing maps ................................................................................................................................... 83 Root mean square approaches..................................................................................................................... 86 Cluster analysis............................................................................................................................................ 89
CONCLUSION ..................................................................................................................................................... 92 5 CHAPTER FIVE: ANALYZING MOVEMENT THROUGH A NOVEL CLUSTER ANALYSIS APPROACH ..................................................................................94
CLUSTER ANALYSIS BASICS ............................................................................................................................... 94 Pre-processing ............................................................................................................................................. 94 Cluster analysis............................................................................................................................................ 95 Cluster validation ........................................................................................................................................ 98
CLUSTER ANALYSIS AND SCALING EXPERIMENTS .............................................................................................. 99 PROPOSED CLUSTER ANALYSIS METHOD.......................................................................................................... 100
Error influences ......................................................................................................................................... 103 METHOD EVALUATION.................................................................................................................................... 104
Experiment 1 .............................................................................................................................................. 105 Experiment 2 .............................................................................................................................................. 110 Experiment 3 .............................................................................................................................................. 113
CONCLUSION ................................................................................................................................................... 118

vi
6 CHAPTER SIX: PHASE TRANSITIONS IN A DISCRETE MULTI-ARTICULAR ACTION ................................................................................................................................120
INTRODUCTION................................................................................................................................................ 120 MATERIALS AND METHODS............................................................................................................................. 124
Participants................................................................................................................................................ 124 Apparatus................................................................................................................................................... 124 Procedure .................................................................................................................................................. 125 Data processing ......................................................................................................................................... 126 Data analysis ............................................................................................................................................. 127
RESULTS.......................................................................................................................................................... 128 Performance scores ................................................................................................................................... 129 Mixed-effects modelling ............................................................................................................................. 131 Intra-individual time-continuous results.................................................................................................... 137 Changes in kinematics due to performance scores .................................................................................... 159
DISCUSSION..................................................................................................................................................... 160 CONCLUSION ................................................................................................................................................... 167
7 CHAPTER SEVEN: INVESTIGATION OF CRITICAL SLOWING DOWN IN A DISCRETE MULTI-ARTICULAR ACTION...................................................................168
INTRODUCTION................................................................................................................................................ 168 Materials and Methods .............................................................................................................................. 171 Participants................................................................................................................................................ 171 Apparatus................................................................................................................................................... 171 Procedure .................................................................................................................................................. 172 Data processing ......................................................................................................................................... 172 Data analysis ............................................................................................................................................. 173
RESULTS.......................................................................................................................................................... 173 Performance scores ................................................................................................................................... 174 Critical slowing down................................................................................................................................ 175 Mixed-effect modelling............................................................................................................................... 178
DISCUSSION..................................................................................................................................................... 184 CONCLUSION ................................................................................................................................................... 189
8 CHAPTER EIGHT : EPILOGUE ..............................................................................190 INTRODUCTION................................................................................................................................................ 190 DISCRETE, MULTI-ARTICULAR ACTIONS .......................................................................................................... 190 THE BASKETBALL HOOK SHOT, A SUITABLE MOVEMENT MODEL ..................................................................... 193 ANALYSIS OF DISCRETE, MULTI-ARTICULAR ACTIONS ..................................................................................... 196 SCALING AND PERTURBATION OF THE BASKETBALL HOOK SHOT..................................................................... 197 IMPLICATIONS ................................................................................................................................................. 199 LIMITATIONS AND FUTURE DIRECTIONS .......................................................................................................... 204
9 REFERENCES .............................................................................................................208
10 APPENDIX A – INDIVIDUAL RESULTS OF CLUSTER ANALYSIS FROM CHAPTER 7..........................................................................................................................224
11 APPENDIX B – MATLAB CODE..........................................................................239
12 APPENDIX C – DETAILED CLUSTER ANALYSIS RESULTS ......................240

vii
List of Tables Table 2-1: Summary table of reported studies indicating type of motion capturing (2D/3D),
number of participants (N), number of throws (No. Throws), and whether only successful shots were investigated. ..................................................................................50
Table 3-1: Results of significance test for fixed-effects for distance, squared distance and direction. See equation 3.2 for details. * = significant, ** = highly significant...............59
Table 3-2 : Estimated standard deviations for model parameter. Participant intercept = σs, participant by distance = σsl, condition by distance within participants = σcd, residual = σ...........................................................................................................................................59
Table 3-3 : Estimated heteroscedasticity parameters for each participant compared to the residual variance of participant JA and the Ratio between the maximum and the minimum estimate. ...........................................................................................................62
Table 3-4 : Ranking of heteroscedasticity parameter for each participant. 4 = smallest variation, 1 = highest variation. ........................................................................................63
Table 5-1: Properties of different cluster algorithms according to Everitt et al. (2001, p.62) .97 Table 6-1. Basketball hook shot scoring system (adapted from Landin et al., 1993) ............126 Table 6-2: Wald-tests for fixed-effects structure for each joint angle. See equation 6.2 for
details..............................................................................................................................131 Table 6-3: Sample standard deviations of random effects for each joint angle. σs = sample
standard deviation of participant-specific intercepts, σsl = sample standard deviation of participant-specific slopes, σcd = sample standard deviation of slopes between condition, σ = sample standard deviations of residuals...................................................................132
Table 6-4: Ranking of estimated heteroscedasticity values for each participants for each joint angle and ratio of highest residuals divided by smallest residuals for each joint...........135
Table 6-5: Results of multi-scale bootstrapping procedure (p-values) for each cluster for each participant and number (no.) of trials contained in each cluster. ...................................138
Table 7-1: Wald-tests for fixed-effects structure for each joint angle....................................179 Table 7-2: Sample standard deviations of random effects for each joint angle. σs = sample
standard deviation of participant-specific intercepts, σsl = sample standard deviation of participant-specific slopes, σcd = sample standard deviation of slopes between condition, σ = sample standard deviations of residuals...................................................................180
Table 7-3: Ranking of estimated heteroscedasticity values for each participants for each joint angle and the ratio of highest residuals divided by smallest residuals for each joint angle.........................................................................................................................................182
Table 10-1: Results of multi-scale bootstrapping procedure (p-values) for each cluster for each participant and number (no.) of trials contained in each cluster. ...........................224

viii
List of Figures Figure 2-1: Topological class of letters A. Adapted from Bernstein (1967, p.43).....................5 Figure 2-2: Anti-phase and in-phase finger movement. Adapted from Kelso and Schöner
(1988, p.32) ......................................................................................................................10 Figure 2-3: HKB-model as a function of the ratio b/a for different values of Δω. Adapted from
Kelso (1994, p. 396) .........................................................................................................12 Figure 2-4: Ankle, knee, and hip kinematics during a complete trial of cyclic lifting and
lowering. Adapted from Limerick et al. (2001, p.55).......................................................26 Figure 2-5: Model plot of fluctuations after a perturbation in a discrete movement................30 Figure 2-6: Types of movement tasks used in bimanual coordination studies. Adapted from
Obhi (2004, p. 113) ..........................................................................................................38 Figure 3-1: Best linear unbiased estimates of individual random coefficients for each
participant for the right shoulder, left elbow, left shoulder, right ankle, left knee, left ankle. ................................................................................................................................61
Figure 3-2: Estimates of wrist trajectory radii for each participants for each condition with superimposed model fit. ...................................................................................................64
Figure 3-3: Individual mean performance scores for each throwing distance for each condition with standard deviations. ..................................................................................................65
Figure 3-4: Individual mean joint lags at each throwing distance for each condition for (a) wrist lag, (b) elbow lag, (d) shoulder lag, (d) knee lag, (e) hip lag. (■) JA, (●) DA, (▲) MA, (♦) PA.......................................................................................................................66
Figure 3-5: Joint lag coefficient of variation for each participant for each throwing distance for both condition. (a) wrist lag, (b) elbow lag, (c) shoulder lag, (d) knee lag, (e) hip lag. (■) JA, (●) DA, (▲) MA, (♦) PA.....................................................................................68
Figure 3-6 : Angle-angle plot of right shoulder and right elbow joint kinematics for each participant (horizontal) grouped for 2-3m, 4-5m, 6-7m, and 8-9m (vertical). .................69
Figure 3-7: Angle-angle plot of left shoulder and left elbow joint kinematics for each participant (horizontal) grouped for 2-3m, 4-5m, 6-7m, and 8-9m (vertical). .................71
Figure 3-8: Angle-angle plot of left hip and left knee joint kinematics for each participant (horizontal) grouped for 2-3m, 4-5m, 6-7m, and 8-9m (vertical). ...................................73
Figure 5-1: Dendrogram obtained by cluster analysis on GDP and percentage of working population of 12 different countries (see text for details). ...............................................96
Figure 5-2: Mean discrete relative phase and standard deviations from one trial. .................106 Figure 5-3: (a) Results of cluster analysis approach for bimanual movements. P-values of
boostrap procedure are plotted next to the according clusters. (b) Results of Hubert-Γ scores against different number of clusters. ...................................................................107
Figure 5-4: Percentage of identified clusters against movement frequency with results from mean discrete relative phase superimposed....................................................................108
Figure 5-5: Plot of deviations scores obtained from the cluster analysis approach (left y-axis) plotted against the movement frequency and standard deviations obtained from discrete relative phase analysis (right y-axis). .............................................................................109
Figure 5-6: Individual dendrogram obtained from the results of the cluster analysis approach. P-values for each cluster are plotted underneath the according cluster..........................111
Figure 5-7: Plot of Hubert-Γ scores for each participant against number of clusters.............112 Figure 5-8: (a) Dendrogram of participant 1 based the results from the cluster analysis
approach. P-values of bootstrap procedure are plotted above according clusters. (b) Plot of Hubert-Γ scores for participant 1 against number of clusters. ...................................114
Figure 5-9: (a) Plot of obtained clusters for participants 1 against trials grouped by throwing distance for increasing throwing distance (■) and decreasing throwing distance (▲). (b)
ix
Plot of dissimilarity scores for participant 1 against throwing distance for increasing (■) and decreasing (▲) throwing distance. ..........................................................................115
Figure 5-10: (a) Dendrogram of participant 2 based the results from the cluster analysis approach. P-values of bootstrap procedure are plotted above according clusters. (b) Plot of Hubert-Γ scores for participant 2 against number of clusters. ...................................116
Figure 5-11: (a) Plot of obtained clusters for participants 2 against trials grouped by throwing distance for increasing throwing distance (■) and decreasing throwing distance (▲). (b) Plot of dissimilarity scores for participant 2 against throwing distance for increasing (■) and decreasing (▲) throwing distance. ..........................................................................117
Figure 6-1: Mean performance and standard deviation for each participant..........................129 Figure 6-2: Mean performance scores and standard deviation for each participant at each
throwing distance for increasing (■) and decreasing (♦) throwing distance. .................130 Figure 6-3: Best linear unbiased estimates of model coefficients for each participant for the
right elbow joint, right shoulder joint flexion angle, left shoulder joint linear and quadratic coefficient, right knee joint, and the left knee joint.......................................134
Figure 6-4: Estimates of wrist trajectory radii for each participant for each condition with superimposed model fit as estimated by the mixed-model.............................................137
Figure 6-5: Angle-angle plots for all movement clusters of participant KE. (a) Angle-angle plot of right shoulder joint abduction angles against right elbow joint flexion angles. (b) Angle-angle plot of left included shoulder joint angle against left elbow joint flexion angle. (c) Angle-angle plot of left knee joint flexion angle against left hip join flexion angle. ..............................................................................................................................140
Figure 6-6: Distribution of movement clusters (●) against trials grouped by distance in ordering of actual occurrence for participant KE. Mean dissimilarity scores at each according throwing distance by direction are superimposed (-●-)................................141
Figure 6-7: Angle-angle plots for all movement clusters of participant CA. (a) Angle-angle plot of right shoulder joint abduction angles against right elbow joint flexion angles. (b) Angle-angle plot of left included shoulder joint angle against left elbow joint flexion angle. (c) Angle-angle plot of left knee joint flexion angle against left hip join flexion angle. ..............................................................................................................................143
Figure 6-8: Distribution of movement clusters (●) against trials grouped by distance in ordering of actual occurrence for participant CA. Mean dissimilarity scores at each according throwing distance by direction are superimposed (-●-)................................144
Figure 6-9: Angle-angle plots for all movement clusters of participant RY. (a) Angle-angle plot of right shoulder joint abduction angles against right elbow joint flexion angles. (b) Angle-angle plot of left included shoulder joint angle against left elbow joint flexion angle. (c) Angle-angle plot of left knee joint flexion angle against left hip join flexion angle. ..............................................................................................................................145
Figure 6-10: Distribution of movement clusters (●) against trials grouped by distance in ordering of actual occurrence for participant RY. Mean dissimilarity scores at each according throwing distance by direction are superimposed (-●-)................................146
Figure 6-11: Angle-angle plots for all movement clusters of participant SH. (a) Angle-angle plot of right shoulder joint abduction angles against right elbow joint flexion angles. (b) Angle-angle plot of left included shoulder joint angle against left elbow joint flexion angle. (c) Angle-angle plot of left knee joint flexion angle against left hip join flexion angle. ..............................................................................................................................148
Figure 6-12: Distribution of movement clusters (●) against trials grouped by distance in ordering of actual occurrence for participant SH. Mean dissimilarity scores at each according throwing distance by direction are superimposed (-●-)................................149
Figure 6-13: Angle-angle plots for all movement clusters of participant BR. (a) Angle-angle plot of right shoulder joint abduction angles against right elbow joint flexion angles. (b) Angle-angle plot of left included shoulder joint angle against left elbow joint flexion

x
angle. (c) Angle-angle plot of left knee joint flexion angle against left hip join flexion angle. ..............................................................................................................................150
Figure 6-14: Distribution of movement clusters(●) against trials grouped by distance in ordering of actual occurrence for participant BR. Mean dissimilarity scores at each according throwing distance by direction are superimposed (-●-)................................152
Figure 6-15: Angle-angle plots for all movement clusters of participant DU. (a) Angle-angle plot of right shoulder joint abduction angles against right elbow joint flexion angles. (b) Angle-angle plot of left included shoulder joint angle against left elbow joint flexion angle. (c) Angle-angle plot of left knee joint flexion angle against left hip join flexion angle. ..............................................................................................................................153
Figure 6-16: Distribution of movement clusters (●) against trials grouped by distance in ordering of actual occurrence for participant DU. Mean dissimilarity scores at each according throwing distance by direction are superimposed (-●-)................................154
Figure 6-17: Angle-angle plots for all movement clusters of participant NI. (a) Angle-angle plot of right shoulder joint abduction angles against right elbow joint flexion angles. (b) Angle-angle plot of left included shoulder joint angle against left elbow joint flexion angle. (c) Angle-angle plot of left knee joint flexion angle against left hip join flexion angle. ..............................................................................................................................155
Figure 6-18: Distribution of movement clusters (●) against trials grouped by distance in ordering of actual occurrence for participant NI. Mean dissimilarity scores at each according throwing distance by direction are superimposed (-●-)................................156
Figure 6-19: Angle-angle plots for all movement clusters of participant JA. (a) Angle-angle plot of right shoulder joint abduction angles against right elbow joint flexion angles. (b) Angle-angle plot of left included shoulder joint angle against left elbow joint flexion angle. (c) Angle-angle plot of left knee joint flexion angle against left hip join flexion angle. ..............................................................................................................................158
Figure 6-20: Distribution of movement clusters (●) against trials grouped by distance in ordering of actual occurrence for participant JA. Mean dissimilarity scores at each according throwing distance by direction are superimposed (-●-).................................159
Figure 6-21: Individual plots of the performance scores against the kinematic dissimilarities between subsequent trials for each participant. ..............................................................160
Figure 7-1: Mean performance and standard deviation for each participant..........................174 Figure 7-2: Mean performance scores and standard deviation for each participant at each
throwing distance for increasing (■) and decreasing (♦) throwing distance. .................174 Figure 7-3: Mean dissimilarity scores and standard deviation for each participant (better
throwers further to the right). .........................................................................................175 Figure 7-4: Individual plots of dissimilarity scores between subsequent trials in actual
ordering of occurrence of unperturbed trials (●) and perturbed trials (●). For participants AN and LU a log-linear plot is shown in order to ease interpretation............................176
Figure 7-5: Individual plots of estimates of τrel with confidence intervals for each throwing distance in actual ordering of occurrence for each participants. ....................................178
Figure 7-6: Best linear unbiased estimates of model coefficients for each participant for the right elbow joint, right shoulder joint flexion angle, left shoulder joint linear and quadratic coefficient, right hip joint, right knee joint, and left knee joint.....................181
Figure 7-7: Estimates of wrist trajectory radii for each participant for each condition with superimposed model fit as estimated by the mixed-model.............................................184
Figure 10-1: (A) Results of bootstrapping procedure for participant LU (B) Plot of Hubert-Γ scores against number of clusters for participant LU. ....................................................225
Figure 10-2: Angle-angle plots for all movement clusters of participant CR. (a) Angle-angle plot of right shoulder joint abduction angles against right elbow joint flexion angles. (b) Angle-angle plot of left included shoulder joint angle against left elbow joint flexion
xi
angle. (c) Angle-angle plot of left knee joint flexion angle against left hip join flexion angle. ..............................................................................................................................227
Figure 10-3 : Distribution of movement clusters (●) against trials grouped by distance in ordering of actual occurrence for participant CR. Mean dissimilarity scores at each according throwing distance by direction are superimposed (-●-).................................228
Figure 10-4 : Angle-angle plots for all movement clusters of participant LU. (a) Angle-angle plot of right shoulder joint abduction angles against right elbow joint flexion angles. (b) Angle-angle plot of left included shoulder joint angle against left elbow joint flexion angle. (c) Angle-angle plot of left knee joint flexion angle against left hip join flexion angle. ..............................................................................................................................230
Figure 10-5 : Distribution of movement clusters (●) against trials grouped by distance in ordering of actual occurrence for participant LU. Mean dissimilarity scores at each according throwing distance by direction are superimposed (-●-).................................231
Figure 10-6 : Angle-angle plots for all movement clusters of participant CAL. (a) Angle-angle plot of right shoulder joint abduction angles against right elbow joint flexion angles. (b) Angle-angle plot of left included shoulder joint angle against left elbow joint flexion angle. (c) Angle-angle plot of left knee joint flexion angle against left hip join flexion angle. ..............................................................................................................................232
Figure 10-7: : Distribution of movement clusters (●) against trials grouped by distance in ordering of actual occurrence for participant CAL. Mean dissimilarity scores at each according throwing distance by direction are superimposed (-●-).................................233
Figure 10-8 : Angle-angle plots for all movement clusters of participant AN. (a) Angle-angle plot of right shoulder joint abduction angles against right elbow joint flexion angles. (b) Angle-angle plot of left included shoulder joint angle against left elbow joint flexion angle. (c) Angle-angle plot of left knee joint flexion angle against left hip join flexion angle. ..............................................................................................................................234
Figure 10-9: Distribution of movement clusters (●) against trials grouped by distance in ordering of actual occurrence for participant AN. Mean dissimilarity scores at each according throwing distance by direction are superimposed (-●-).................................235
Figure 10-10 : Angle-angle plots for all movement clusters of participant MI. (a) Angle-angle plot of right shoulder joint abduction angles against right elbow joint flexion angles. (b) Angle-angle plot of left included shoulder joint angle against left elbow joint flexion angle. (c) Angle-angle plot of left knee joint flexion angle against left hip join flexion angle. ..............................................................................................................................237
Figure 10-11: Distribution of movement clusters (●) against trials grouped by distance in ordering of actual occurrence for participant MI. Mean dissimilarity scores at each according throwing distance by direction are superimposed (-●-).................................238
Figure 12-1: (a) Results of bootstrapping procedure for participant BR. (b) Hubert-Γ scores of clustering for participant BR. .........................................................................................240
Figure 12-2: (a) Results of bootstrapping procedure for participant CA. (b) Hubert-Γ scores of clustering for participant CA. .........................................................................................241
Figure 12-3: (a) Results of bootstrapping procedure for participant DU. (b) Hubert-Γ scores of clustering for participant DU..........................................................................................242
Figure 12-4: (a) Results of bootstrapping procedure for participant JA. (b) Hubert-Γ scores of clustering for participant JA. ..........................................................................................243
Figure 12-5: (a) Results of bootstrapping procedure for participant KE. (b) Hubert-Γ scores of clustering for participant KE. .........................................................................................244
Figure 12-6: (a) Results of bootstrapping procedure for participant NI. (b) Hubert-Γ scores of clustering for participant NI. ..........................................................................................245
Figure 12-7: (a) Results of bootstrapping procedure for participant RY. (b) Hubert-Γ scores of clustering for participant RY. .........................................................................................246

xii
Figure 12-8: (a) Results of bootstrapping procedure for participant SH. (b) Hubert-Γ scores of clustering for participant SH. .........................................................................................247
Figure 12-9: (a) Results of bootstrapping procedure for participant AN. (b) Hubert-Γ scores of clustering for participant AN..........................................................................................248
Figure 12-10: (a) Results of bootstrapping procedure for participant CAL. (b) Hubert-Γ scores of clustering for participant CAL. ..................................................................................249
Figure 12-11: (a) Results of bootstrapping procedure for participant CR. (b) Hubert-Γ scores of clustering for participant CR. .....................................................................................250
Figure 12-12: (a) Results of bootstrapping procedure for participant MI. (b) Hubert-Γ scores of clustering for participant MI. .....................................................................................251

1
1 Chapter One : Introduction
At its core, this thesis is concerned with gaining a better understanding of how
movement coordination in biological organisms is achieved. How is it possible that we can
walk from point A to point B? How are we able to pick up a cup and drink our tea? How can
we jump over a fence without losing balance? How can we throw a ball towards a target?
Whilst these questions are at some level of description relatively easy to answer: “Well, we
just do it!”, they each deal with basal properties of biological organisms and the means of
these organisms to interact with their environment. Examining these questions from a
structural level and, therefore, referring to actual physiological structures, the answers to these
questions become difficult (if possible to answer at all). However, they provide a first glimpse
of the tremendous complexity involved in movement coordination. Accordingly, the aims of
this thesis are tailored to current knowledge of movement coordination and control, and upon
reading it, one will not encounter any definitive answers to these questions. However, the
present programme of work attempts to make a small but worthwhile contribution to the great
and mysterious puzzle of movement coordination in biological organisms, and perhaps one
day we will be able to answer such questions.
A theoretical perspective with the potential to help us solve these problems on
movement coordination in the future is provided by dynamical systems theory (DST). Routed
in nonlinear physics, this framework has provided relatively simple but fascinating solutions
for complex problems in movement coordination. Over the course of the last thirty years,
DST has provided an established theoretical foundation for the investigation of problems in
movement coordination in biological organisms. The present programme of work adopted this
framework and accordingly much of the first part of the literature review in the second
chapter will be devoted to the description and summary of the dynamical systems framework
to movement coordination. Indeed, the starting point for this programme of work will be a
definition of movement coordination developed by the Russian movement scientist Bernstein
(1896-1966) which will provide a frame of reference maintained throughout the thesis. The
first part of Chapter 2 will be concluded with an overview of the issues surrounding the
dynamical systems framework. As discussed further in the second chapter, these ideas are
concerned with: (i) relation of discrete and rhythmical movement models; (ii) biomechanical
degrees of freedom; and (iii), degenerate vs. task determined movement models.

2
Accordingly, in the second part of Chapter 2, a movement model will be described
which will enable experimental investigation of each of these issues: the basketball hook shot.
Following previous investigations of ballistic throwing movements from a DST perspective, a
review of the literature on basketball throwing will highlight the candidacy of the basketball
hook shot as an appropriate movement model in order to address the three identified issues. In
Chapter 3, the candidacy of the basketball hook shot is empirically examined in a study
describing significant adaptations in movement patterning of the basketball hook shot
movement due to changes in throwing distance. Since the basketball hook shot marks a
considerable deviation from many previous applied movement models in the literature, results
obtained during Chapter 3 will highlight some limitations regarding existing analysis
methods. Accordingly, in Chapter 4 the literature will be revisited and several different
analysis methods for studying coordination and control in discrete, multi-articular actions will
be investigated. Based on the results from this overview, a new cluster analysis approach will
be identified as a potential method to enable investigation of discrete multi-articular actions,
such as the basketball hook shot, using the conceptual framework of DST.. In Chapter 5, the
cluster analysis method will be formulated based on previous work from the literature and the
feasibility will be examined with several validations studies.
The new movement model investigated in Chapter 3 and the analytical apparatus from
Chapter 5 enabled the application of the conceptual framework of DST to the basketball hook
shot, as an exemplar of discrete multi-articular actions, which will be the main aim of Chapter
6. The results obtained in Chapter 6 highlighted, for the basketball hook shot, some strong
differences compared to more traditional movement models. Nevertheless, the results seem to
support dynamical systems theory as a feasible theoretical framework able to incorporate
various domains of biological movement coordination into a coherent programme. Based on
the results from Chapter 6, in Chapter 7 a refinement of the experiment in Chapter 6 will be
presented which will further highlight some key differences between the basketball hook shot
and existing movement models typically encountered in studies of movement coordination in
DST (e.g., the concept of critical slowing down). The last chapter of this thesis, the epilogue,
will conclude with a summary of this programme of work and provide some propositions for
future research.

3
2 Chapter Two : Literature Review
Part One - Theoretical Overview of Literature
Scientific studies investigating human movement coordination require the adoption of
a theoretical framework to guide analysis and interpretation of collected data. One of the most
prominent frameworks in recent times has been dynamical systems theory which presents the
basis for the present work. Dynamical systems theory seeks to understand human
coordination through the concepts of synergetics and nonlinear dynamics. However, in order
to provide a basis of what is actually meant by movement coordination, a definition will be
provided, which will serve as a common thread leading through the thesis.
Bernstein’s Legacy: Defining coordination
Coordination
A central notion in the area of motor control is the so-called degrees of freedom
problem, which was first appreciated and accordingly formulated by the Russian scientist
Nicolai Aleksandrovich Bernstein (1896-1966) who investigated movement coordination.
From his studies Bernstein derived the necessity for a sensory adjustment mechanism for
goal-directed behaviour. In the early 20th century this insight went against commonly
accepted standards which were based on pure reflex models of movement control (Bernstein,
2006a).
Bernstein’s arguments stemmed from the notion that movements always take place in
an environment under the influence of internally self-generated forces and external forces
which together act upon the mover. External forces can be viewed as a gradient field in which
the behaviour of the movement system unfolds. Since the force field can change in time in
ways which cannot be completely predicted by the movement system the external forces
experienced by the actor can continually change. Accordingly, for successful achievement of
task-goals the movement system has to be able to adapt and to accommodate for these
externalities and Bernstein pointed out that movement coordination demands therefore an
adjustment mechanism within the movement system (Bernstein, 1967, 2006b).
Investigating the internal force production of the neuro-anatomical system the
complexity of coordination is further increased. For example, the mere structural assembly of

4
a muscle appears to be quite ill-suited for successful movement control. Muscle functioning
always depends on the current and the past status of the muscle tissue resulting in highly
nonlinear properties of the movement system. Hence during movement the functional
relationship is constantly changing, making successful movement coordination a highly
complex task (especially for a hierarchical control system which prescribes muscle commands
in advance of movement initiation) (Bernstein, 1996). Therefore, the application of a specific
signalling pattern to the muscle can lead to very different outcomes always depending on the
current context the muscles resides in. Further, usually the same force can be produced by
different combination of muscles depending on the current anatomical arrangement of the
movement system which further complicates the task of coordination. These insights lead
Bernstein to conclude that no strict signalling patterns can be stored by the central nervous
system (Bernstein, 1967). Any simple signalling mechanism from the centre to the periphery
would not be sufficient for successful behaviour, in other words univocality of the signal and
the corresponding effect cannot exist. Accordingly, he termed this notion as “functional non-
univocality” (Bernstein, 1967, p.105).
The different parameters which are necessary to define a specific movement in
external space resulting from the force generated in the neuro-biological system and within
the external force field can be seen together as the degrees of freedom of the system. Relating
the necessary degrees of freedom of the actor in three dimensional space with those which
underlie the degrees of movement generation it becomes obvious that the number of the latter
is exponentially higher compared to the resulting movement degrees of freedom. Hence the
system inherently possesses redundancy. The main problem posed to the movement system
now lies in regulating these redundant degrees of freedom, representing the so-called ‘degrees
of freedom problem’. Accordingly, Bernstein formulated coordination as follows:
“The co-ordination of a movement is the process of mastering redundant degrees of
freedom of the moving organ, in other words its conversion to a controllable system”
(Bernstein, 1996, p.127)
This definition of coordination enables movement scientists to investigate the degrees
of freedom problem at several levels of observation. In studies of movement coordination the
degrees of freedom are usually equated with the biomechanical degrees of freedom set by the
body joints (Newell and Vaillancourt, 2001) which also represents the level mainly followed
in this thesis.

5
Coordination as task-dependent integration
Investigating movement variability in highly trained movements Bernstein noticed that
movements are not “chains of details but structures which are differentiated into details” and
called them “morphological structures” (Bernstein, 1967, p.69). These morphological
structures should not be seen as static entities but they develop in time and adapt to
environmental demands. They were based on a hierarchy where the building blocks were
formed by so-called synergies. Synergies were formulated as integrated body structures
consisting of several units which work together in order to fulfil task demands. Applying
changes to one part of the movement resulted in global reorganization of movement
sometimes at far removed sites from the perturbing source highlighting interaction and
coupling effects between the different components. Bernstein saw this integration of
movements as one of the key features of coordination (Bernstein, 1967). The integration was
achieved in a task dependent manner and served the present task goal which, according to
Bernstein, is the most important constant in actually solving a particular movement problem.
Bernstein postulated that it is the required solution (or the task outcome) which should be
represented in the central nervous system (Bernstein, 1967).
Investigating the outcome of similar actions in several contexts Bernstein noticed
qualitative similarities. He captured this fact through the notion of topological objects where
qualitative properties are shared across different contexts as opposed to metric features. For
example, participants are able to write the letter A with different effectors, e.g. with both
hands, the feet, or the mouth, and the according outcome will easily be identifiable as the
letter A (Bernstein, 1967). However, the actual metric specifics between outcomes will differ
despite preservation of the qualitative peculiarities of the letter A (see Figure 2-1).
Figure 2-1: Topological class of letters A. Adapted from Bernstein (1967, p.43)

6
In conclusion, Bernstein’s insights can be used as a general framework for some of the
key issues in movement science. Bernstein’s definition of coordination will underpin the
discussion to follow and its implications (non-univocality, degrees of freedom, redundancy,
morphological structures, and topological objects) provide a set of features that any theory
explaining human movement behaviour should address. In the next section the application of
dynamical systems theory to movement coordination will be introduced which will be
subsequently linked to Bernstein’s framework.
The Dynamical Systems Theory (DST) and Movement coordination
A possible solution for the degrees of freedom problem emerged when the application
of synergetics, a theory of complex physical systems, found a correspondence in the study of
human movement behaviour. Preceded by work from Kelso (e.g. Kelso, 1984), Haken, Kelso
and Bunz (1985) reported an experiment in a seminal paper where participantss were
instructed to synchronize oscillatory movements of both index fingers with a metronome.
Participants moved their fingers in either the same (in-phase) or in opposite directions (anti-
phase) in reference to the body midline. With increasing movement frequency, the
participants exhibited sudden, unintended changes in movement behaviour where switches
from anti-phase to in-phase movement were observed. The authors modelled this behaviour as
an instance of a self-organising system according to the theory of synergetics providing a link
between the domains of movement organisation in neurobiological systems and physical
dynamical systems.
In order to sufficiently discuss the implications of this finding, certain key concepts
from synergetics will be briefly introduced in the following section. For an in-depth
mathematical treatment of the topic compare Haken (1983) and for a more phenomenological
introduction from a behavioral point of view compare Kelso (1995).
Synergetics and Physical Dynamical Systems
The theory of Synergetics deals with complex physical systems and its main goal lies
in providing an explanation of how these systems achieve ordered behaviour without the
necessity of an external, executive agent. Investigating the behaviour of lasers, Hermann
Haken (1927- ), a German physicist, was able to derive a set of lawful relationships which
provided core concepts for the synergetics framework. Haken suggested that a laser
constitutes a complex system which consists of countless interacting subcomponents, the laser

7
atoms. During the activation of a laser an external energy source feeds energy into the system
and releases energy through light into the environment. Thus, the laser system constitutes an
open, non-equilibrium system which exchanges matter and energy with the environment. The
energy fed into the system is stored within the atoms and lifts electrons to higher energetic
level. The electrons are able to spontaneously jump from the higher to the initial energetic
level thereby emitting light through photon emission. This emitted light can be absorbed by
other atoms shifting their electrons to a higher energetic level where the same process of
spontaneous emission can reappear. Further, when an electron which already resides in a
higher energetic state is hit by a photon a so-called induced emission occurs where the
electrons emit a photon with the same phase as the hitting photon had. Through this process
of spontaneous emission, induced emission and absorption, the atoms are able to interact with
each other. Initially the atoms emit light waves of all wavelengths resulting in microscopic
chaos. When the energy pump reaches a certain excitation threshold, the uncoordinated
behaviour of the atoms emitting light of all wavelengths experiences a dramatic change.
Through their joint interaction the atoms start emitting light with a common wavelength
yielding the actual laser light and the system settles into an ordered state. The external energy
supplied to the system is completely random and contains no information whatsoever about
the desired coherent state. Hence, the system is able to settle into a macroscopic ordered state
without the necessity of an external agent deliberately forcing the atoms into a specific
behaviour (Haken, 1983). Only through the interaction between the subcomponents a stable
behavioural pattern emerges. This process is called self-organization and forms a key concept
of the synergetic framework.
The theoretical concept that describes the orderly behaviour of the system is called an
order parameter or an attractor. This attractor resembles a collective variable of the system
describing the structure and dynamic behaviour of the system as a whole. Attractors usually
need fewer arguments to describe their structure in comparison to the number of parameters
needed to describe the behaviour of all subcomponents involved, yielding a compression of
information. Further, the number of exhibited attractors in these systems are far less compared
to the potential arrangements of these system based on its subcomponents yielding a
compression of system degrees of freedom.
The subcomponents of a system and attractor states are connected by a tight
interrelationship. Attractors are formed through the interactions of the subcomponents but at
the same time, the order parameter supports the process of self-organization forcing the
8
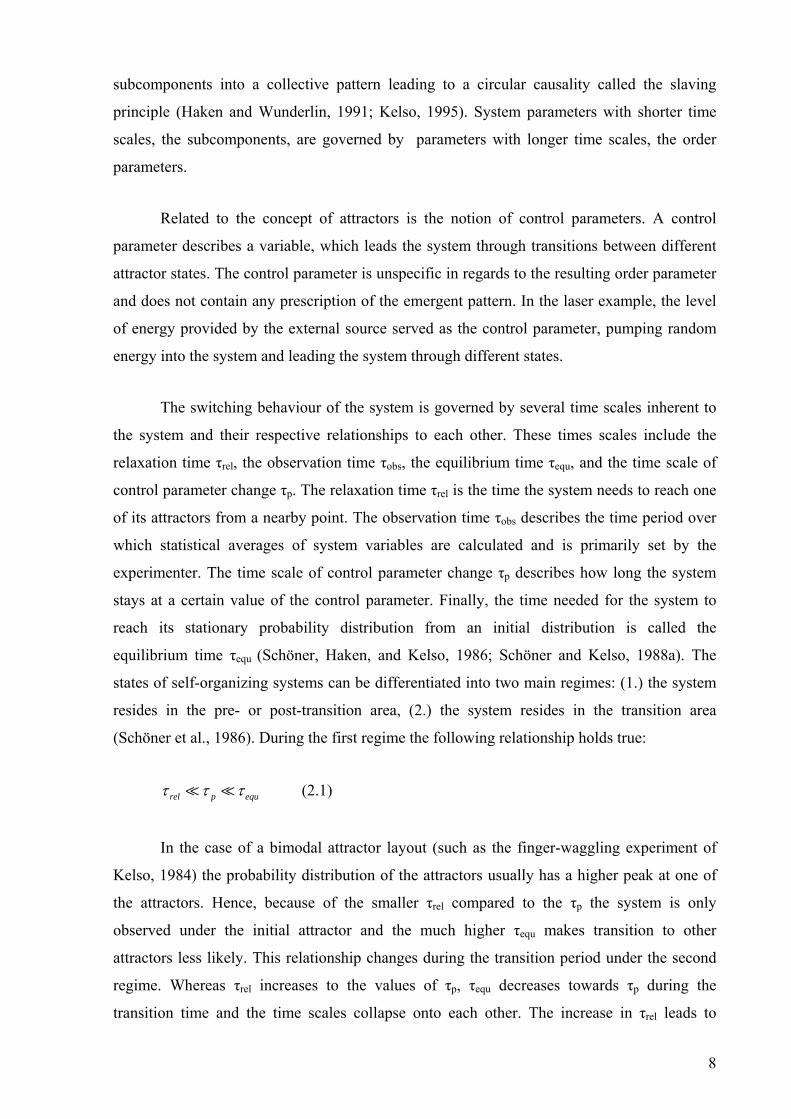
subcomponents into a collective pattern leading to a circular causality called the slaving
principle (Haken and Wunderlin, 1991; Kelso, 1995). System parameters with shorter time
scales, the subcomponents, are governed by parameters with longer time scales, the order
parameters.
Related to the concept of attractors is the notion of control parameters. A control
parameter describes a variable, which leads the system through transitions between different
attractor states. The control parameter is unspecific in regards to the resulting order parameter
and does not contain any prescription of the emergent pattern. In the laser example, the level
of energy provided by the external source served as the control parameter, pumping random
energy into the system and leading the system through different states.
The switching behaviour of the system is governed by several time scales inherent to
the system and their respective relationships to each other. These times scales include the
relaxation time τrel, the observation time τobs, the equilibrium time τequ, and the time scale of
control parameter change τp. The relaxation time τrel is the time the system needs to reach one
of its attractors from a nearby point. The observation time τobs describes the time period over
which statistical averages of system variables are calculated and is primarily set by the
experimenter. The time scale of control parameter change τp describes how long the system
stays at a certain value of the control parameter. Finally, the time needed for the system to
reach its stationary probability distribution from an initial distribution is called the
equilibrium time τequ (Schöner, Haken, and Kelso, 1986; Schöner and Kelso, 1988a). The
states of self-organizing systems can be differentiated into two main regimes: (1.) the system
resides in the pre- or post-transition area, (2.) the system resides in the transition area
(Schöner et al., 1986). During the first regime the following relationship holds true:
rel p equτ τ τ (2.1)
In the case of a bimodal attractor layout (such as the finger-waggling experiment of
Kelso, 1984) the probability distribution of the attractors usually has a higher peak at one of
the attractors. Hence, because of the smaller τrel compared to the τp the system is only
observed under the initial attractor and the much higher τequ makes transition to other
attractors less likely. This relationship changes during the transition period under the second
regime. Whereas τrel increases to the values of τp, τequ decreases towards τp during the
transition time and the time scales collapse onto each other. The increase in τrel leads to

9
increasing fluctuations of the attractor and the system undergoes a so-called critical instability
(Kelso, Scholz, and Schöner, 1986; Schöner et al., 1986).
Using the laser example introduced earlier during the transition period after an
additional energy burst fed into the system it would disrupt the laser light perhaps causing a
flickering of the light for a longer time compared to the stable region were the same burst
would be dampened out much faster. The increase of fluctuations is termed critical
fluctuations and the increase of the relaxation time is called critical slowing down (Haken,
1983, p. 110; Haken, Kelso, and Bunz, 1985; Scholz, Kelso, and Schöner, 1987). Because the
equilibrium time is decreased, the system is able to visit other attractor states more easily and
transitions between attractor states is possible. Further manipulation of the control parameter
re-establishes the initial time scale relationships, stabilizing the new attractor. These different
time scale relationships and their accompanying features are inherent to physical complex
systems (Haken, 1983).
Critical instabilities represent a key concept which will be highlighted in the following
sections as the main entry point into unravelling the dynamics of the system. Hence, from a
synergetics viewpoint when the system goes through phases of instabilities most information
about its underlying dynamics can be obtained in contrast to other motor control theories like
the information processing framework under which differences between stable states of the
system are preferably investigated (Kelso, 1995; Kelso and Schöner, 1988).
Depending on the type of the phase transition that occurs, the system can also exhibit a
so-called hysteresis effect (Haken, 1983, p.182). When the system is prepared in one state and
the control parameter value is altered (e.g. increased) at a certain threshold, the system
switches into a new state. Starting from this state and decreasing the control parameter value
back to the initial level, the system stays longer in the second state than before and changes to
the first state at a lower value of the control parameter. Hence, the system exhibits a
dependence on the direction of control parameter change and switching from one state to
another at different control parameter values.
In summary, synergetics provides a framework, which describes and formalizes how
complex, open systems which are not in equilibrium with their environment are able to
exhibit ordered system states through self-organization. The framework entails a set of
theoretical concepts, which provide an analytical apparatus making predictions and
experimental testing possible. Accordingly an experimenter can investigate whether a

10
behavioural change is governed by the laws of self-organization or whether maybe some other
dynamic underlies the observed behaviour.
Synergetics and coordination in dynamical neurobiological systems
In this section the general principles of synergetics will be related to the domain of
motor control. The authors in the finger flexion-extension experiment (Haken et al., 1985)
defined human behaviour as the result of a complex, open system and accordingly applied the
theoretical apparatus of synergetics. By modelling the movement of the fingers using a model
with two non-linear, coupled oscillators the authors were able to explain the movement
outcome from a synergetics point of view.
Figure 2-2: Anti-phase and in-phase finger movement. Adapted from Kelso and Schöner (1988, p.32)
Seeking to describe the movement of the fingers by a global parameter, Haken et al.
(1985) operationalized the discrete relative phase of the fingers as the dependent variable.
When the fingers moved in the same direction in relation to the body midline the movements
were defined as an in-phase movement whereas when the fingers moved in opposite
directions the movement was defined as anti-phase (see Figure 2-2).
When the participants began with an anti-phase motion, at an individual critical
threshold reordering of the finger coordination occurred with increasing movement frequency

11
and a transition to an in-phase motion could be observed. However, when the participants
started with an in-phase movement pattern, no transitions in the opposite direction occurred.
For the latter condition, this finding held for both directions of frequency change from low to
high as well as from high to low (Haken et al., 1985). The combination of anti-phase,
frequency increase, pattern switching and subsequent persistence in the in-phase pattern was
interpreted by the authors as an occurrence of hysteresis.
Based on the peculiar behaviour of the relative phase dependent variable, Haken,
Kelso, and Bunz (1985) interpreted this measurement as a direct representation of the attractor
dynamics governing this specific movement model. Accordingly, the movement frequency
served as a control parameter. Through this approach, the authors were able to directly
identify properties of synergetics in the domain of human motor behaviour.
The mathematical model based on two oscillators which captured the dynamics of the
behaviour is now known as the HKB-model (Haken et al., 1985). The behaviour was
modelled on two different levels of observation: in abstract order parameter space based on
the relative phase (Ф) and in movement space of the fingers based on the displacement of the
finger tips. Both models lead to the same results showing how different levels of observations
can be used in order to identify the dynamics of the system. The order parameter approach
lead to equation (2.2).
( ) cos cos 2
dVd
V a b
φφ
φ φ φ
= −
= − − (2.2)
V is the so called potential function and a and b are model constants (compare Haken et al.,
1985). In a subsequent investigation the model was extended by including a stochastic noise
term (compare equation (1.3), Schöner et al., 1986).
tdV Qd
φ ξφ
= − + (2.3)
ξ is a Gaussian white noise process and Q>0 is the noise strength (compare Schöner et al.,
1986).
Using this extended model the predicted time scale behaviour of the system could be
assessed. Using a torque pulse which was applied to the right index finger during bimanual

12
movements Scholz, Kelso, and Schöner (1987) were able to directly estimate τrel (see also
Scholz and Kelso, 1989). The results confirmed the validity of the model and lead to further
support of the synergetics modelling approach (Schöner et al., 1986).
The model was further extended included a measure of asymmetry between the two
oscillators (Fuchs and Jirsa, 2000) in order to include further experimental findings and
extend the generality of the model to account for different sized effectors.
(1 2 ) sin 2 cos 2 ta b Qφ σ φ φ ξ= − − − + (2.4)
σ is a symmetry parameter (compare Fuchs and Jirsa, 2000).
The modelling approach made it possible to describe the movement as a trajectory in
an abstract landscape. The shape of the landscape consisting of valleys and mountain ridges
represented the properties of the underlying attractors. This phenomenological modelling
enabled researchers to express movement behaviour in terms of the synergetic concepts in
problems where rigorous mathematical treatment was not possible and a more
phenomenological approach was necessary (compare Thelen, 1995).
Figure 2-3: HKB-model as a function of the ratio b/a for different values of Δω. Adapted from Kelso (1994, p. 396)

13
In Figure 2-3 the landscape is shown for model 2.4 for different values of the
asymmetry parameter. In the top row the switch from a bimodal attractor layout at the left
hand side for low movement frequency to a uni-modal layout is shown. There are three
different stable regions, thereby the two outer ones represent the same anti-phase movement
pattern at relative phase values of π and -π. The in-phase movement is shown at the centre
with a relative phase of zero. As movement frequency increases the outer stable regions
become unstable until at the far right they completely disappear.
In the middle row a small asymmetry between the two oscillators is introduced. This
asymmetry leads to a symmetry break yielding the preference of the right anti-phase pattern
over the left pattern where one oscillator is leading the other. The minima are slightly shifted
off from the pi and –pi positions. With increasing movement frequency the same effect as
before is visible where the anti-phase patterns lose their stability properties and only the in-
phase pattern remains stable. In the bottom row a strong asymmetry between the oscillators is
present which leads to a destabilization of the anti-phase patterns which are only transiently
stable. At the highest movement frequency the asymmetry leads to the vanishing of all stable
states and only areas of slight transient stability are left. Due to these somewhat more stable
regions a phenomenon comes into effect which is called intermittency, whereby the system
resides longer in those regions where previously a stable attractor was present. However, the
overall behaviour is marked by constant phase wandering (Kelso, 1994).
In conclusion, viewing movements of neurobiological systems modelled as complex,
open, dynamical systems, provides an opportunity for analysis from a synergetics point of
view. This approach has proved to be successful in several different instances (see following
Section), leading to a direct connection between complex systems theory and neurobiological
behaviour. The experimental approach used during the finger flexion-extension task where a
potential control parameter was driven through a pre-specified parameter range has become a
gold standard in studies of coordination under the dynamical systems perspective. Since the
systems properties can be most easily identified during periods of instability, this approach
provided a simple mechanism to trigger these instabilities and investigate changes in global
behaviour of the system under scrutiny (Beek, Peper, and Stegeman, 1995; Kelso and
Schöner, 1988). In the following section, the synergetics or dynamical systems approach to
human movement will be validated against Bernstein’s perspective on movement science in
order to justify the viability of this particular framework.

14
Key principles of Dynamical Systems Theory and Bernstein’s Insights
Bernstein’s definition of movement coordination was principally concerned with the
redundant degrees of freedom present in the movement system. From a dynamical systems
theoretical approach these multiple degrees of freedom are welcomed in stark comparison to
classical cybernetics control theories. As became clear from the discussion of attractors, the
actual number of system states and the related degrees of freedom of a self-organized system
at the global level are far less than those present at the component level resulting in the
inherent information compression of the system (Kay, 1988). The interaction of the different
degrees of freedom actually may provide the very basis for their own governance by
harnessing inherent processes of self-organization. From a control perspective the process of
self-organization reduces the complexity of the system and only a limited number of
parameters are needed to control system behaviour. The remaining variables do not need
explicit regulation since their behaviours are governed by the attractor properties, bound
together through interaction and the resulting self-organization via the slaving principle.
Accordingly the conversion of the system into a controllable unit is simplified and the
regulating degrees of freedom are compressed to only a few important degrees (Kelso and
Schöner, 1988, p.31).
Regarding the non-equivocality principle introduced by Bernstein, recent
investigations of brain dynamics from a synergetics approach suggest that similar processes
which govern behavioural dynamics are also present at the level of brain functioning
connecting these two domains of neurobiology (Carson and Kelso, 2004; Fuchs, Jirsa, and
Kelso, 2000; Kelso, 1998; Kelso et al., 1998; Lindenberg, Ziemann, Hajak, Cohen, and Faith
Berman, 2002). Such research could potentially solve the problem of functional non-
equivocality through a coherent mechanism working at several levels. As suggested earlier,
explicit control and knowledge of specific contextual information is not needed by the
controller. Many aspects of the actual movement generation and execution can be devoted to
the substructures and to their interactions with each other, which in turn are governed by self-
organization.
Bernstein’s emphasis on morphological structures also fits well with the notion of
attractors. Attractors do not represent static entities in time but are in constant flux under the
influence of control parameters and their underlying generating structures. Accordingly,
changes in one site of the structure can lead to changes in the interaction patterns of elements
of the attractor and yet do not necessarily imply changes in global behaviour. Through this

15
mechanism it is possible to ensure that a particular task goal is met while at the same time
providing necessary adaptability, thereby yielding an elegant solution to the juxtaposition of
adaptation and stability. Again, self-organization and the slaving principle serve as the
integrative forces generating the morphological structures and establishing synergies.
Saltzman and Kelso (1987) showed how under the dynamical systems framework these
synergies can be assembled in a task-dependent manner thereby incorporating Bernstein’s
notion of task-dependent integration.
Finally, the notion of topological structures can also be well captured by the dynamical
systems theoretical approach. As shown in the case of the finger flexion-extension task the
very topological arrangement of the movements of the fingers which was represented by the
relative phase resembled the collective variable that governed behaviour. Thereby the actual
parameterization of the movement changed, e.g. the amplitude decreased with increasing
movement frequency (Haken et al., 1985), but nevertheless the global appearance of the
movement stayed constant. As will be shown in the next section this movement variable is
found in many contexts in various effector systems, further strengthening its characterisation
as a topological structure.
To summarise thus far, the synergetics or dynamical systems theoretical approach to
human movement provides a potentially informative theoretical framework well suited to
answering problems in movement coordination and control with the potential to integrate
some of the key issues of movement coordination. Hence, pursuing further research using the
dynamical systems theoretical framework as a worthwhile enterprise which provides the
necessary rationale for using this specific framework as the theoretical underpinning for the
present work. An overview of empirical studies relating dynamical system theory to human
movement will be provided in the next section. This overview is by no means exhaustive and
focuses mainly on work which will be related to the development of the research questions
underpinning the line of work presented in this programme (see Kelso, 1995 for a broader
overview).
Perception and Coordination
Through inclusion of ideas from ecological psychology into an overarching theoretical
approach with dynamical systems theory further modelling of perceptual mechanisms became
possible providing a direct link between perception and coordination. A seminal study
investigating coordination between persons was undertaken by Schmidt, Carello and Turvey

16
(1990). They were able to demonstrate that the same nonlinear dynamics governing
coordination within a single participant also applied to coordination between people. In the
experiment two participants were seated opposite to each other and were instructed to swing
one of their lower legs whilst watching the legs of the other person. Movement frequency was
the postulated control parameter. When participants started with an alternating anti-phase
pattern and the movement frequency was increased a switch to the symmetric pattern, the in-
phase pattern occurred. Measuring the standard deviation of the relative phase between the
legs the authors found an increasing instability of the movement as well as hysteresis. These
results lead the authors to conclude that the switch between the two patterns resembled a
phase transition (Schmidt et al., 1990, p.245).
Another study investigating perception-action coupling was conducted by Sternad
(1998). The author used a ball juggling task and showed that through a direct linkage between
action and perception in terms of a nonlinear dynamical system, regulation of the movement
could be explained. Participants were instructed to bounce a ball with a racquet whilst keeping
the ball’s amplitude constant. The system was modelled using a differential equation
approach. The model showed that the perceptual information interacted directly with the
dynamics of the coordination task. The participants were able to discover the stability
properties of the task and exploit these in order to ensure task achievement. Using different
bouncing heights, Sternad (1998) was able to demonstrate the generality of the underlying
system which was held invariant over different conditions exhibiting “motor equivalence”
(Sternad, 1998, p.324).
In a follow-up study to the ball juggling task experimental results indicated a
differential effect connected to performance level where skilled performers were better in
exploiting the stability regions compared to novices. When decoupling the haptic information
from the movement by using a lever to perform the bounce the performer fell into more
unstable regions of the system indicating that haptic information is necessary to uncover the
stability properties of the task. The same change was not observed when participants were
deprived of visual information (Sternad, Duarte, Katsumata, and Schaal, 2000).
Further support for increased stability based on perceptual information was found in a
study investigating the influence of visual information in a circle-drawing task. However,
whereas increasing temporal movement stability was found when participants were offered a
congruent visual stimulus the spatial performance was unaltered (Byblow, Chua, Young, and
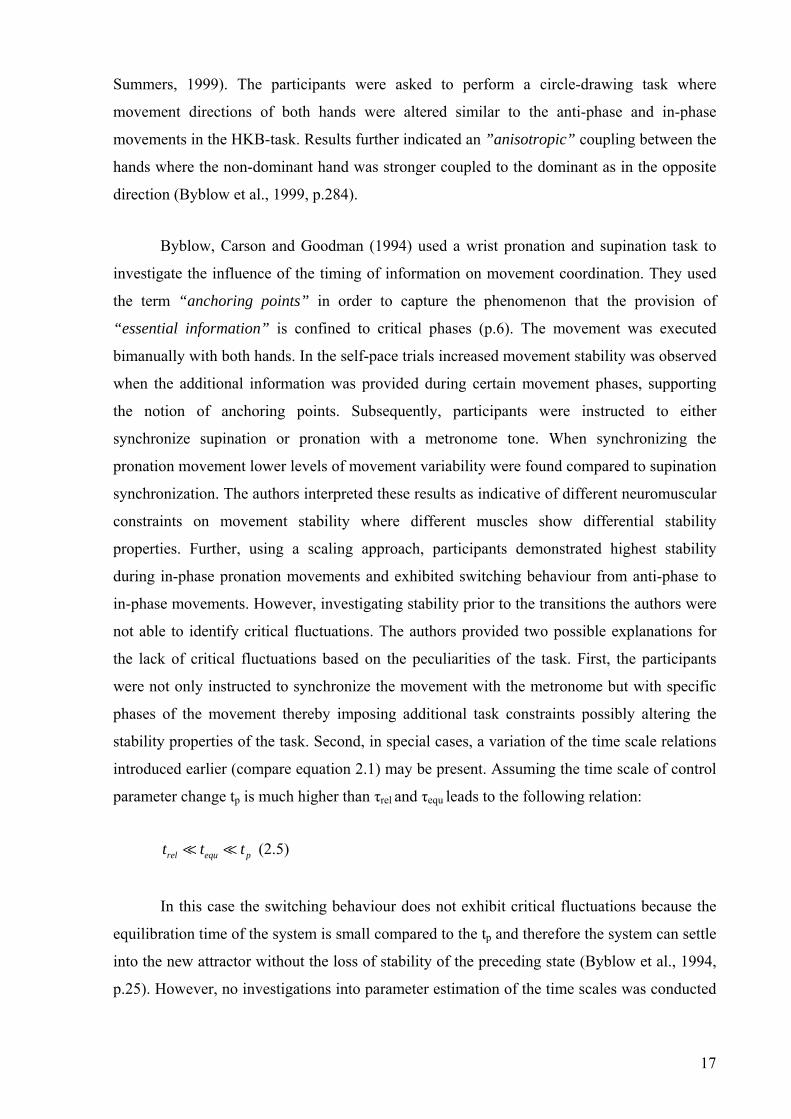
17
Summers, 1999). The participants were asked to perform a circle-drawing task where
movement directions of both hands were altered similar to the anti-phase and in-phase
movements in the HKB-task. Results further indicated an ”anisotropic” coupling between the
hands where the non-dominant hand was stronger coupled to the dominant as in the opposite
direction (Byblow et al., 1999, p.284).
Byblow, Carson and Goodman (1994) used a wrist pronation and supination task to
investigate the influence of the timing of information on movement coordination. They used
the term “anchoring points” in order to capture the phenomenon that the provision of
“essential information” is confined to critical phases (p.6). The movement was executed
bimanually with both hands. In the self-pace trials increased movement stability was observed
when the additional information was provided during certain movement phases, supporting
the notion of anchoring points. Subsequently, participants were instructed to either
synchronize supination or pronation with a metronome tone. When synchronizing the
pronation movement lower levels of movement variability were found compared to supination
synchronization. The authors interpreted these results as indicative of different neuromuscular
constraints on movement stability where different muscles show differential stability
properties. Further, using a scaling approach, participants demonstrated highest stability
during in-phase pronation movements and exhibited switching behaviour from anti-phase to
in-phase movements. However, investigating stability prior to the transitions the authors were
not able to identify critical fluctuations. The authors provided two possible explanations for
the lack of critical fluctuations based on the peculiarities of the task. First, the participants
were not only instructed to synchronize the movement with the metronome but with specific
phases of the movement thereby imposing additional task constraints possibly altering the
stability properties of the task. Second, in special cases, a variation of the time scale relations
introduced earlier (compare equation 2.1) may be present. Assuming the time scale of control
parameter change tp is much higher than τrel and τequ leads to the following relation:
rel equ pt t t (2.5)
In this case the switching behaviour does not exhibit critical fluctuations because the
equilibration time of the system is small compared to the tp and therefore the system can settle
into the new attractor without the loss of stability of the preceding state (Byblow et al., 1994,
p.25). However, no investigations into parameter estimation of the time scales was conducted

18
in this study and no further indication why the proposed time scales relationship should be
present was provided.
A study investigating the influence of haptic information used a finger flexion-
extension task. Kelso, Fink, DeLaplain and Carson (2001) found a differential effect of
perceptual information on movement stability. Participants were instructed to either
synchronize peak flexion or peak extension with a metronome tone. Haptic information was
provided through padded stoppers which constrained the movement range of the fingers.
When the haptic information was provided synchronous with the auditory tone the movement
exhibited higher stability compared to when haptic information was syncopated with the
auditory tone with increasing movement frequency indicating that critical phases for
information provision exist.
The findings from the different studies presented so far highlight the importance of
perceptual phenomena in shaping actual movement behaviour and how information from the
environment can be utilized in order to control movements and alter stability properties. In
this way information acts in the same domain where the attractors reside. Thus, the dynamics
of the system can be captured by a single unified description. Through this theoretical
description, information can be used by the system to guide behaviour by constraining system
degrees of freedom. However, this relationship is by no means simple since for example as
has been shown in the study made by Byblow et al.(1999).
A study conducted by Mechsner, Kerzel, Knoblich and Prinz (2001) showed that in
some tasks the perceptual effects can provide the main source of pattern stability. Participants
were instructed to rotate two vertical handles either in-phase or anti-phase. The handles were
attached under a table and participants could only view the movement through two rotating
pointers which were attached to the top ends of the handles above the table. When the pointers
rotated synchronous with the handle movement the typical switch from anti-phase to in-phase
movements with increasing movement frequency could be observed. However, when the
pointers were primed to rotate in an anti-cyclical manner to the actual handle movement, no
transitions could be observed when participants performed actual anti-phase movements with
an apparent in-phase movement of the pointers. In contrast, during in-phase movement of the
handles resulting in anti-phase movements of the pointers phase transitions to in-phase of
pointers were observed. The authors interpreted the result as indicative of movement stability
being less dependent on processes in the motor system and neuro-anatomical constraints but

19
more on perceptual phenomena for this task (Mechsner et al., 2001, p.72). In response to this
claim Carson and Kelso (2004) noted that it seems very unlikely that a singular domain
should be the sole determinant of coordination and that it is rather the integration of
perceptual, cognitive, and physiological phenomena which governs coordination. Hence, in
the following section the influence of neuro-anatomical constraints on movement
coordination from a dynamical systems perspective will be investigated.
Neuro-anatomical constraints
Beside the line of research investigating perceptual influence several studies have
investigated the influence of neuro-anatomical constraints on movement behaviour from a
dynamical systems perspective. In a variation of the wrist pronation-supination movement
models, Carson (1995) investigated phase-transitions behaviour in self-paced trials and scaled
frequency trials. Participants were instructed to perform supination-pronation movements
using fixed manipulanda, resulting in isometric force production task (Carson, 1995).
Participants had to synchronize the movement with a metronome either during the pronation
or supination phase of the movement. In anti-phase mode the relative phase showed brief
departures from the prescribed pattern with increasing movement frequency however no
complete phase-transitions were observed. The relative phase showed higher stability during
the in-phase movements corroborating the results from preceding experiments (see previous
sections). Regarding the differences in torque between anti-phase and in-phase movement the
former showed lower levels and higher variability in magnitude and frequency. For the in-
phase condition, differential effects were observed between movements where either the
supination or the pronation was synchronized with the metronome supporting the notion of
anchoring points during movement execution (Carson, 1995).
Another variation of the wrist movement model investigated the influence of the
position of the pivoting point in freely moving manipulanda using wrist supination-pronation
movements (Carson, Riek, Smethurst, Pàrraga, and Byblow, 2000). Through variation of the
pivoting point which affected the arm muscle geometry in the participants the authors
introduced different task constraints between the conditions. In a first experiment, participants
were instructed to either synchronize the maximal extension of the movement or the maximal
flexion with a metronome. The results indicated a differential effect on movement stability
which was contributed to the influence of the musculo-skeletal arrangement (Carson and
Riek, 1998). Investigating the influence of wrist rotation on the stability in uni-manual

20
flexion-extension movement of the right index finger Carson and Riek (1998) found further
support for the influence of neuro-muscular geometry on pattern stability.
The application of the principles derived from the HKB-Model has not been confined
only to the study of similar effector systems. There have also been various studies with
different effector combinations used.
For example, Kelso, Buchanan and Wallace (1991a) investigated the coordination of
synchronous movements in the elbow and wrist using the scaling paradigm. Participants were
instructed to either coordinate elbow flexion-extension movements with wrist flexion-
extension movement or elbow extension-flexion movements with wrist flexion-extension
movements. Additionally the movement was to be performed either with the hand supinated
or pronated. Results indicated a differential effect of the hand position on movement stability.
When the hand was supinated with increasing movement frequency a switch from wrist-
flexion/elbow-extension to wrist-flexion/elbow-flexion occurred. Whereas when the wrist was
pronated the exact opposite behaviour was observed. Investigations into the movement path of
the wrist exhibited that regardless of the underlying movement pattern with increasing
movement frequency the wrist path changed from a more linear to a curvilinear pattern. The
authors interpreted their findings also from a neuromuscular point of view where the different
wrist positions lead to different signalling patterns (Kelso et al., 1991a).
In a similar realm Serrien and Swinnen (1997) investigated rhythmical coordination
between the arms. The results showed that phase locking between the limbs was higher when
homologous limbs were used compared to non-homologous limb combinations. Using a 2:1
frequency locking, higher variability was apparent during homologous limb motion compared
to homo-lateral and cross-lateral motions. The authors interpreted these findings based on the
different eigenfrequencies of the limbs which made deviations from a 1:1 phase relation
easier. This indicated a stronger phase locking between homologous limbs (Serrien and
Swinnen, 1997, p.1501), again highlighting neuro-anatomical constraints on movement
coordination although this has yet to be confirmed.
Behavioural information and intrinsic dynamics
So far, the studies reviewed in this chapter have not been as concerned with the fact
that human movement is influenced by the intentions of the actor. Schöner and Kelso (1988b)
provided an operationalization which integrated intentions into the dynamical systems

21
framework through a formal model. Intentions were conceptualized as “behavioral
information” (p.506) describing in the broadest sense information which is meaningful and
specific to the task. Behavioral information thereby includes information present in the
environment, as introduced earlier, or memorized information acquired through learning. The
information acts at the level of order parameters and can change or perturb the attractor
layout. Intentional information under this view is conceptualized as an “intended behavioral
pattern” (p.507) perturbing the attractor layout towards the desired pattern. Order parameter
dynamics in the absence of behavioral information are captured by “intrinsic dynamics”
(p.506). Intrinsic dynamics and behavioral information can therefore stand in either
competitive or cooperative relations with each other. The authors provided support for their
formalisation through a study where intentional switching between in-phase and anti-phase
movements in a finger flexion-extension task was investigated. The results showed shorter
times when switching from anti-phase to in-phase in contrast to the opposite direction. When
participants were instructed to intentionally resist the phase transition from anti-phase to in-
phase with increasing movement frequencies, the authors observed decrements in movement
variability. The behavioral information was used to stabilize the intrinsic unstable movement
pattern. These findings could be replicated using a wrist supination-pronation task (Carson,
Byblow, Abernethy, and Summers, 1996) and elbow-elbow and elbow-knee flexion-extension
task (Serrien and Swinnen, 1999).
The notion of intrinsic dynamics provided the necessary prerequisites for including
learning processes into the dynamical systems theoretical framework. In order to
experimentally investigate intrinsic dynamics a new experimental methodology was
introduced termed ‘scanning procedure’ (Zanone and Kelso, 1992). Using a finger flexion-
extension task Zanone and Kelso (1992) investigated learning of a 90° offset pattern between
both hands. During the scanning procedure participants had to perform movements covering
all phase relationships between 0° and 360° of the fingers. Plotting movement stability against
the phase yielded a stability landscape. This landscape provided a summary of the stability
properties of the intrinsic dynamics of each individual performer (Zanone and Kelso, 1992).
The scanning procedure was conducted before, during and after the learning phase in order to
provide information of how the stability landscape is affected by learning the new task. The
‘to-be-learned’ 90° offset pattern was trained for five consecutive days. Results showed a
change in the layout of the stability landscape. Yet, the changes showed inter-individually
different paths indicating a dependency between the initial stability landscape and the
individual learning process.

22
When a region of high stability was present near to the ‘to-be learned’ pattern, during
the training period the stable region shifted towards the desired region and subsequently
stabilized the new movement pattern. However, when the regions of stable movement were
further away from the desired pattern an existing region was deleted and a new stable region
was established at the desired location. The authors termed the former process as a
cooperative strategy whereas the latter was termed a competitive strategy (Zanone and Kelso,
1992).
In order to probe the concept of competitive and coordinative strategies Zanone and
Kelso (1997) conducted a follow-up study. Using the same task participants underwent the
scanning procedure and consecutively based on the individual stability properties were
instructed to learn individually different patterns. The results corroborated the notion of
competitive and cooperative strategies. In addition, the authors were able to show transfer of
learning to a new movement pattern. Together with the desired pattern a mirror pattern
offsetted by 180° was stabilized as well. The authors identified this as a spontaneous transfer
of learning (Zanone and Kelso, 1997, p.1474). Seeking to generalize the transfer findings
Kelso and Zanone (2002) investigated a flexion-extension task with the elbow and the knee.
The results indicated that stable phase relations learned in one effector system which were
initially unstable in the other effector increased their stability after training, supporting the
notion of transfer of learning.
Extending upon these findings, Kostrubiec and Zanone (2002) investigated the
connection between the movement variability and movement outcome based on memory
mechanisms. The task consisted of a wrist pronation-supination movement using a joystick
(Kostrubiec and Zanone, 2002). The authors hypothesized the presence of a metric on the
stability landscape based on the phase distance between movement patterns in phase angles.
The distance between an existing and a desired patterns was related to the two learning
regimes where competitive regimes were expected with high distances and the cooperative
regime with low distance. Using the probing procedure, distances between movement patterns
for the participants were established. The authors assumed that for the cooperative regime the
movement could be based on existing more similar memory structures which should affect the
stability and accuracy of the pattern as opposed to the competitive regime where new
structures have to be established (Kostrubiec and Zanone, 2002).
23
The interaction of the patterns with memory structures was analyzed through
measurement of the persistence of the movement patterns without support of an external
stimulus. A synchronized light stimulus was provided at the beginning of the trials which was
withdrawn during the trials and the participants had to perform the newly trained patterns
from memory. For the competitive regime the stability and accuracy of the patterns were
lower compared to the cooperative learning condition and the movement deteriorated soon
after withdrawal of the light stimulus supporting the expectations (Kostrubiec and Zanone,
2002).
Kostrubiec, Tallet and Zanone (2006) performed another study which investigated the
persistence of a newly learned movement pattern. The same movement model was used and
participants had to acquire movement patterns under either the cooperative or the competitive
regime. The authors expected performance in a retention test to show differentiated responses
for the two regimes. The authors hypothesized that under the cooperative regime where only a
shifting of existing stability regions occurs the change would be transient as opposed to the
competitive regime where a new region has to be developed yielding a more permanent
change in memory structures. The results showed higher movement stability for the
competitive pattern compared to the cooperative patterns during a retention test after three
weeks supporting the model. Further, the cooperative regime the authors postulated the
possibility that this strategy formed the necessary prerequisite for fast changes based on
contextual changes which are not covered by learning but immediate adaptations to task
requirements (Kostrubiec et al., 2006).
However, regarding the two regimes some contradictory findings have also been
observed. In a study using pronation-supination movements of both wrists (Smethurst and
Carson, 2001), participants trained 90° out-of-phase movements and no destabilization of the
180° pattern could be observed questioning the competitive regime. The authors argued that
the competitive regime might be related to the very structure of the probing task. Participants
had to voluntarily destabilize the momentarily executed pattern in order to achieve the
different phase relationships during the scanning task. Therefore, the competitive regime
might be a result of the procedure (Smethurst and Carson, 2001). Further experimentation is
needed to investigate to what extent intrinsic dynamics and learning are linked to each other
and whether a task-dependence exists.

24
Investigating the stochastic HKB-Model Post, Peper, Daffersthofer and Beek (2000b)
raised the issue to what extent intrinsic and intentional dynamics could be regarded as
separated from each other. Investigating in-phase and anti-phase movements in the elbow the
authors estimated the different parameter of the model using a mechanical perturbation. Only
participants who were able to produce both movement patterns without phase transitions over
the complete frequency range were included in the study. Surprisingly, when estimating the
parameters the authors found higher attractor stability for the highest frequency for the anti-
phase pattern, but only when using group data, whereas the individual data showed high
variations. The authors attributed this deviation from the model to the intentions of the
participants which can apparently lead to strong changes in the attractor layout (Post et al.,
2000b).
Putting aside the methodological difficulties in regards to segregation of intrinsic
dynamics and behavioural information experimentally, the concepts discussed above highlight
the individual character of movement coordination. Behavioural information as intentionality
raises the issue of how to measure intentions experimentally, which at present is only possible
based on specific assumptions made by the experimenters. Under this view coordination
solutions to specific tasks will always be influenced by the individual histories of the
performers represented by their intrinsic dynamics. It could be postulated that in a task where
more degrees of freedom in movement choice are present, such as multi-articular actions,
different task solutions are more likely to emerge.
Multi-articular actions
So far this review has focussed on either uni-manual or bi-manual movement models.
The analysis of movement from a dynamical systems theoretical perspective has not been
confined to these models but has been extended into the domain of multi-articular actions.
These actions have been investigated to a much lesser extent and only incomplete support for
all principles associated with bimanual movement has been found as noted below.
A multi-articular action in the present work is defined by a movement which involves
more than two joints at the same time. This is based on the observation that for these models
the segment movement cannot be captured by the traditional relative phase measure. In the
following section several studies will be presented highlighting some of the results and issues
observed using these movement models.

25
Buchanan, Kelso and de Guzman (1997) further investigated the elbow-wrist
movement model used by Kelso et al. (1991a). Participants were instructed to perform
curvilinear motions with the hand at constant movement speed. The motion was to be
matched with a reference path provided online on a computer screen in front of the
participants. Six different reference curves with varying curvatures were used which served as
the potential control parameters. Path length was held constant between curvature conditions.
Based on the ranges of motion of the wrist and shoulder, different movement patterns with
varying curvatures were observed. Relative phase measures between the wrist and elbow
indicated critical fluctuations in the vicinity of the transition. The results lead the authors to
conclude that: (i) the pattern was based on self-organization processes; (ii) that the activation
and respective suppression of involved joint degrees of freedom served to stabilize or
destabilize the system; and (iii), that the curvature served as a control parameter (Buchanan,
Kelso, and deGuzman, 1997; Fink, Kelso, Jirsa, and de Guzman, 2000). Subsequently, the
authors were able to model the movement based on a nonlinear coupled oscillator model
(DeGuzman, Kelso, and Buchanan, 1997).
Kelso and Jeka (1992) investigated movement coordination using a flexion-extension
task but this time in concordance with parallel motions in the knee and elbow joints.
Participants were seated in a chair with arms and legs were attached to levers permitting only
flexion and extension movements in the arms and the legs. The dependent variable was the
relative phase between the different limb pairs. The authors grouped the movement patterns
according to the common movement direction as either D-mode were limbs were moving in
opposite directions, and S-mode were the limbs were moving in the same directions. Phase
transitions with increasing movement frequency were mainly identified from D-mode to the
S-mode, with the S-mode showing higher stability. The transitions were always accompanied
by increasing movement variability indicating loss of stability as the triggering mechanisms
for phase transitions which was initiated mainly by the arm movements (Kelso and Jeka,
1992). At the highest frequency, the relative phase showed a phase wandering where no stable
coordination pattern between the limbs could be established although the authors were able to
show that the time spent in the vicinity of pre-existing stable movement patterns was longer,
exemplifying an intermittency effect. These results were corroborated in a follow up study
which showed that the muscle activation pattern influenced the transitions, with the majority
of transitions following a non-homologous to homologous muscle activation pattern route
(Jeka, Kelso, and Kiemel, 1993). Phase transitions were accompanied by increased movement

26
variability. However, after the transition variability was maintained at a high level and did not
relax back to the initial levels.
A somewhat different task from the preceding examples was investigated by Limerick,
Shemmell, Barry, Carson, & Abernethy (2001). The authors used a cyclical lifting task where
participants were instructed to lift a weight of 1kg onto different heights between 10 and 50
cm with the height changing systematically in both directions. The task can be considered
different from the preceding task inasmuch as the task is rhythmical but does not follow a
strict sinusoidal rule unlike most of the tasks introduced earlier (i.e., a concatenation of
several interlinked movements). Based on the kinematics of the lower limbs the authors
identified two different movement patterns: a squat pattern and stoop pattern. The two
patterns are different in terms of the ranges of motion of the ankle, knee and joint angles as
can be seen in Figure 2-4.
When the lifting height was varied 9 out of 11 participants exhibited switching
behaviour between the two patterns. In general, the main route taken was switching from the
squat pattern to the scoop with increasing height and in the opposite direction with decreasing
height. Inter-individual differences were apparent with some participants exhibiting abrupt
changes between the patterns whereas others presented a longer transition period using
intermediate movement patterns.
Figure 2-4: Ankle, knee, and hip kinematics during a complete trial of cyclic lifting and lowering. Adapted from Limerick et al. (2001, p.55)
27
The individual scoop and squat patterns showed differences between the participants
where individual different ranges of motion in the knee could observed. The occurrence of the
transitions exhibited a dependency with the direction of the height change where the switch
from the squat to the stoop pattern occurred at a later height with increasing height compared
to the condition where the height was decreased. The authors interpreted this finding as a
hysteresis effect (Limerick et al., 2001, p.559).
Li, Levin, Cordero and Swinnen (2005) investigated coordination within- and
between-arms using a rhythmical flexion-extension movement paradigm. Participants were
instructed to perform several different movement patterns including anti-phase and in-phase
movements between and within arms resulting in eight different movement patterns. All
movements were performed at a frequency of 1.33Hz. Results showed higher movement
stability when the elbow and wrist were used in the same direction compared to opposite
directions and higher stability when movements between limbs were prepared in in-phase
compared to anti-phase corroborating the findings in the four-limb task (Jeka et al., 1993).
Movement variability between joints was lower in the elbows compared to the wrist. When
participants performed anti-phase movements with the wrist, movement variability was lower
when elbows were also prepared in an anti-phase manner compared to in-phase which
indicated an interaction effect between the joints (Li et al., 2005). Overall the wrist played a
higher role on movement variability than the elbow. The authors interpreted the results as
indicative of a hierarchical organisation of the limbs with higher contributions of between
limbs effects over intra-limbs effects and distal over proximal in intra-limb effects.
In an effort to provide a classification scheme which incorporates multi-articular as
well as unimanual movement Newell, Liu, & Kress (2001) developed a hierarchical three-tier
model of movement organization using dynamical systems perspective. The highest level
describes macro phenomena representing the spatial-temporal outcome of the behaviour. The
middle level describes mainly the dynamics of the segment kinematics whereas the lowest
level describes behaviour of the underlying subsystems. The different levels are coupled with
each other and usually the time scales of the levels get shorter from the higher towards the
lower level (Newell et al., 2001, p.62). Using this classification scheme, most of the studies
presented so far can be categorized by movement models where the middle and the top level
are the same. The task outcome is equivalent to the actual movement pattern or rather the task
outcome already prescribes to some extent the underlying movement pattern (Hong and
Newell, 2006). This distinction is potentially of great importance, since based on Bernstein’s

28
(1967) definition coordination is mainly challenged by the redundant degrees of freedom.
When the two levels are equal the redundancy at least at the joint level is already somewhat
reduced rendering this movement type as a special case. In this regard, the decoupling of the
two levels potentially introduces another level of complexity where a specific task outcome
can be achieved using various different redundant movements at the second level.
Conceptually, the term redundancy commonly refers to the fact that the same
functionality can be provided by various structures of the same type which does not capture
the actual circumstances in neurobiological systems. Usually, in neurobiological systems
same functionality can only be achieved by structurally different components. For example a
person can pick up a cup with either hand. Although both hands are similar they are not
structurally equal. As has been noted by Edelman (1987) this strategy provides a robust
mechanism against system failure and is common to biological systems. He termed this
strategy “degeneracy” in order to separate it from redundancy. Degeneracy is defined as:
“[…] degeneracy is reflected in the capacity of structurally different components to yield
similar outputs or results (Edelman and Tononi, 2000, p.86)”
Degeneracy could be identified in various domains including the immune system
(Edelman and Gally, 2001), embryogenesis (Edelman, 1988), neuronal organization in the
central nervous system (Edelman, 1987; Sporns, Tononi, and Edelman, 2002; Tononi, Sporns,
and Edelman, 1999) and motor control (Edelman, 1987; Sporns and Edelman, 1993)
supporting its generality in neurobiological systems.
Directly investigating degenerate processes Chen, Liu, Mayer-Kress and Newell
(2005) studied skill acquisition in a pedalo-locomotion task. Four participants trained 50 trials
a day for 7 days. The authors operationalized the movement time and the smoothness of the
movement as performance variables. When correlating the performance variables with a
measure of the differences between successive movement trials the authors were not able to
identify a significant correlation. The findings were interpreted as apparent degeneracy in the
movement system where similar performance output can be achieved by varying movements (
Chen, Liu, Mayer-Kress, and Newell, 2005). This finding could be further corroborated in a
learning study using a ski-simulator task (Hong and Newell, 2006) highlighting that, when the
possibility for further movement adaptations is present, the neurobiological system is able to
take advantage of additional degrees of freedom.

29
In summary, studies that have interpreted multi-articular actions from a dynamical
systems perspective show that coordination changes do not follow such a straight forward
trend like in the uni-manual and bimanual cases but rather complex interaction effects
between the different segments dynamics can be expected. Therefore, the simple bimodal
attractor landscape described in the studies presented earlier may be merely a result of the
specific task chosen and potentially is not present in multi-articular actions. Since in this
movement the possibility for much more individually shaped behaviour is present it therefore
seems likely that performers are able to take advantage of this inherent degeneracy and
present much richer adaptation strategies between and within individuals. However, at present
only limited knowledge and data is available.
Discrete movements
The research discussed thus far can all be categorized as employing rhythmical
movements which represent the main movement model investigated from a dynamical system
perspective. In contrast discrete movement types have not received attention to the same
extent (Beek et al., 1995; Schöner, 2002; Summers, 1998). This is a surprising observation
since Schöner (1990) provided a theoretical treatment of coordination of discrete movements
under the dynamical systems framework although this has not been seriously investigated. In
the following the model will be introduced shortly and some issues will be highlighted before
some studies will be presented.
Regarding the theoretical modelling of discrete movements Schöner (1990) postulated
that discrete movements represent a limit case of cyclical movements, a view which has been
recently renewed (Jirsa and Kelso, 2005). Based on this notion he constructed a model
involving two postural states, one initial posture and one final posture, which are represented
by point attractors. Through intention (behavioral information) a limit cycle attractor can be
generated within the system connecting the initial state and the end state with each other.
Destabilizing the initial attractor leads the system to follow the limit cycle attractor and after
half a period the final attractor is stabilized, onto which the system relaxes yielding the
desired discrete movement. Intentions therefore form a crucial part of the model (Schöner,
1990, p.259). Coordination in this model deals with the timing of different components. Using
this notion Schöner hypothesized that sequential and synchronous timing of the joints might
constitute the discrete analogy to anti-phase and in-phase rhythmical movements.
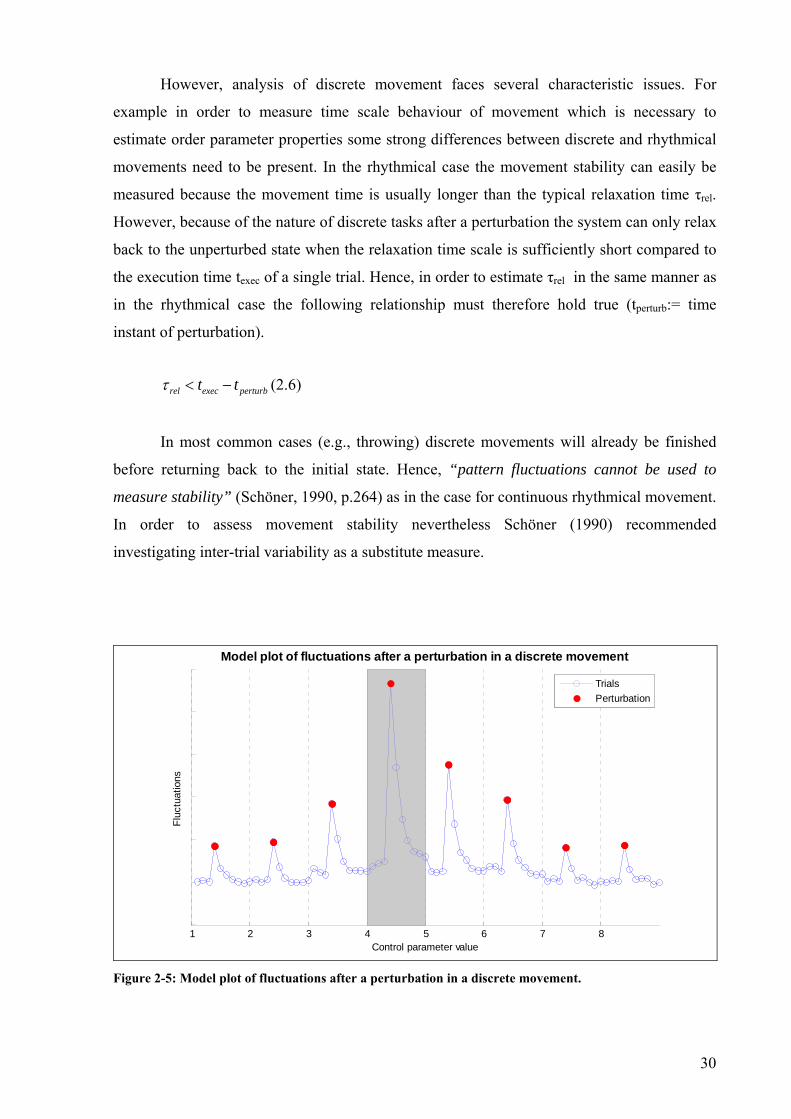
30
However, analysis of discrete movement faces several characteristic issues. For
example in order to measure time scale behaviour of movement which is necessary to
estimate order parameter properties some strong differences between discrete and rhythmical
movements need to be present. In the rhythmical case the movement stability can easily be
measured because the movement time is usually longer than the typical relaxation time τrel.
However, because of the nature of discrete tasks after a perturbation the system can only relax
back to the unperturbed state when the relaxation time scale is sufficiently short compared to
the execution time texec of a single trial. Hence, in order to estimate τrel in the same manner as
in the rhythmical case the following relationship must therefore hold true (tperturb:= time
instant of perturbation).
rel exec perturbt tτ < − (2.6)
In most common cases (e.g., throwing) discrete movements will already be finished
before returning back to the initial state. Hence, “pattern fluctuations cannot be used to
measure stability” (Schöner, 1990, p.264) as in the case for continuous rhythmical movement.
In order to assess movement stability nevertheless Schöner (1990) recommended
investigating inter-trial variability as a substitute measure.
1 2 3 4 5 6 7 8Control parameter value
Fluc
tuat
ions
Model plot of fluctuations after a perturbation in a discrete movement
TrialsPerturbation
Figure 2-5: Model plot of fluctuations after a perturbation in a discrete movement.
31
Figure 2-5 represents a hypothetical model plot of the fluctuations according to this
proposition. After each perturbation several trials are needed in order to relax back to the
initial level of fluctuations. Thereby, the control parameter is held constant for several trials.
Whereas at the beginning in the pre-transition area only a small number of trials is needed.
When reaching the transition area (grey shaded area) the level of fluctuations increases and
accordingly τrel increases translating into increased number of trials needed to relax back to
the pre-perturbed base-line. Subsequently when the system exists in the transition area, τrel
becomes smaller again and accordingly the fluctuations and the needed number of trials return
to the initial level. However, the development of Schöner’s proposition has not been
experimentally investigated yet.
Conceptually discrete movements form another challenge to the dynamical systems
theoretical perspective, describing phase transitions between attractors as a trajectory between
different loci in the system state space. For a rhythmical movement switching from one
attractor to another cannot be achieved between consecutive trials since this would imply a
discontinuous change in the attractor function leading to infinite acceleration in attractor
space which is not possible for a biological dynamical system (Newell et al., 2001). However,
in a discrete movement switching between attractors in consecutive trials is theoretically
plausible because for a discrete movement after termination of the movement the system has
to go back to its initial state in order to perform the subsequent trial. During this period,
behavioural information gained from the just finished movement can be used to adapt the
intrinsic dynamics. In turn, this potentially leaves the initial conditions in regards to the body
posture unaltered but subsequently leads to a different end posture yielding a different
movement pattern (compare Liu, Mayer-Kress, and Newell, 1999; Scholz and McMillian,
1995 for examples; Scholz, Millford, and McMillan, 1995).
Regarding common experimental procedures, information about the system’s state is
always lost between subsequent trials since analytically trials are usually recorded from the
beginning to the end where recording stops. For the recording of the subsequent trial the
system needs to be set back to the initial state thereby going through a relative void where the
mentioned additional influence may affect the subsequent behaviour unnoticed by the
experimenter.
Nevertheless, dynamical systems theory has been applied to discrete movement
models. Using a table-tennis movement model Sorensen, Ingvaldsen and Whiting (2001)

32
tested some of the proposition made by Schöner (1990). The authors assumed that the spatial
position of the ball served as a potential control parameter and the distance of the racket from
the edge of the table resembled a kinematic collective variable as well as the type of stroke
(forehand or backhand). The ball was delivered by a projection machine to positions between
the right and left end of the table. Two different condition were applied: (1). The location of
ball delivery was scaled from left to right and right to left, and (2.) random locations of ball
delivery. The participants were instructed to return the ball to a fixed position for all trials.
The starting distance from the table and the starting posture was standardized. The results
indicated a switching behaviour from the backhand to the forehand pattern depending on the
ball delivery. Further, the switching point was different in two directions in condition one
indicating a hysteresis effect. Based on the different transition points the authors defined a
“hysteresis area“ (Sorensen et al., 2001, p.31). The switching in stroke behaviour was also
present in the results for the racket-table distance which showed either sudden increases or
decreases. However, one participant did not exhibit these sudden changes and used the same
distance for both stroking patterns. Comparing the movement variability during the stable
extreme positions with the movement variability in the hysteresis area results showed higher
variability for the forehand stroke but not for the backhand stroke. During the random
condition the same outcome was obtained when compared to condition one over both
directions (Sorensen et al., 2001). The authors concluded that the results provide evidence that
the approach derived by Schöner (1990) is capable of accommodating for the movement
model used. However, they pointed out that the issue of instabilities is not sufficiently
addressed because no critical slowing down based on perturbation could be investigated.
Button, Bennett and Davids (1998) conducted a study investigating differences in
discrete and continuous movements in a reaching task. Participants were instructed to perform
grasps between two dowels set at a specific distance. In the rhythmical condition the
movement had to be synchronized to a metronome whereas in the discrete condition the
movement was to be accomplished within a specific movement time which was matched to
the movement times from the continuous condition. During a scanning procedure participants
were instructed to adjust their final hand closure at different marked points along the distance
between the two dowels. The point of final closure was systematically increased. Pre- and
post-tests were conducted without any spatial instructions where participants self-selected the
point of final closure. The results showed significant differences between the discrete and the
rhythmical conditions. When comparing the self-selected with the most stable scanning
condition the differences were higher for discrete compared to rhythmical movement. The

33
scanning procedure during the discrete condition predicted in 4 out of 6 participants different
preferred distances compared to the self-selected condition. An effect that was not observed
during the rhythmical condition. The authors concluded that the organization of discrete and
rhythmical movements appears fundamentally different (Button et al., 1998).
A second study from the same authors (Button, Bennett, and Davids, 2001)
investigated the differences between discrete and rhythmical movement using the same task
when no spatial constraint were imposed on the final hand closure but the movement time was
changed in a scaling fashion allowing the movement to adapt spontaneously. No phase
transitions between different patterns were found as well as no differences between the two
conditions. The authors interpreted the result as supportive of Schöner’s (1990) model in
contrast to the preceding study. However, both studies assumed the time of relative final hand
closure as a potential order parameter. At present it is not known whether this assumption is
valid and accordingly whether the findings really relate to the used concepts.
Another study investigating a reaching and grasping task was conducted by Kelso,
Buchanan and Murata (1994). The task included a bar which was prepared at specific angles
with the horizontal line on a vertical clock face. Participants were instructed to rotate the bar
back to the vertical twelve o’clock position. Based on the observations during the experiment
the authors defined two different movements strategies: a forward projection with pronation
of the wrist and a forward projection with supination of the wrist (Kelso et al., 1994, p.71).
Based on the results the authors were able to identify two critical regions where the
coordination was bistable showing the choice for one strategy depended on the preceding
angle of preparation. The result was interpreted as a hysteresis effect supporting the findings
made by Sorensen et al. (2001) in the table tennis task.
Lames (1992) investigated switching behaviour in golf swings due to changes in target
distance in one participant. The author operationalized the relative timing of upswing and
downswing as the coordination variables. Distances were changed between 10m and 100m in
increments of 10 in either increasing or decreasing direction. The authors classified the
movement patterns using a cluster analysis. The results indicated three different patterns
which could be identified: a chip, a pitch and a full-swing. When starting from 100m at 90m
distance the pattern switch from full-swing to pitch and remained in this pattern until 20m,
with one erroneous full swing attempt at 65m. At 20m distance the participant changed to a

34
chip strategy. However, when starting from 10m the switches occurred at 30m and at 70m
indicative of a hysteresis effect (Lames, 1992).
Some investigations into discrete movements have been conducted using throwing
tasks. Southard (1998) investigated changes in throwing patterns of the arm due to enforced
changes in segment mass of the upper arm and changes in throwing velocity. Segment mass
was altered by attaching additional mass to either the upper or lower arm, or the hand by
using a heavier ball. The author modelled the throwing movement as an open kinetic-link in
the throwing limb where positive segment lag of distal over proximal segments leads to a
whipping like movement which is regarded as an optimal technique. Segment lag was defined
as the difference of relative time to peak velocity of the according segments. Southard
postulated lag as a potential order parameter and the throwing velocity and segment mass as
potential control parameters. Using the model participants were rated on a four level scale
according to exhibited segment lags between trunk, upper arm, lower arm, and hand. The
author observed a better performance of weaker throwers either with increasing throwing
velocity or addition of mass to proximal segments. Conversely, the added mass deteriorated
performance for better throwers (Southard, 1998). Regarding the justification of segment lag
the author failed to provide strong support for this assumption. Some changes between
segments lag were accompanied by fluctuations in lag measure but not all of them. No
investigations into time scale behaviour were performed and hysteresis was not shown since
only scaling in one direction was performed.
In a follow-up study with children, Southard (2002) investigated in more detail how
changes in throwing velocity alter movement patterning. Participants were grouped into four
different skill levels and their individual maximum throwing velocities (vmax) were
determined. Participants performed throws between 10% and 100% of vmax in increments of
10%. Increasing the throwing velocity lead only for the two weaker groups to changes in
coordination. The author observed lower variability for better skilled throwers compared to
weaker throwers and changes in lag sequencing was accompanied by higher variability in
some cases. Again, the author failed to provide comprehensive evidence supporting for the
assumption of segment lag as an order parameter.
Another study investigating a throwing movement from a dynamical systems
perspective was conducted by Liu and Burton (1999). They investigated the influence of
shooting distance on movement patterns of 20 novice throwers in basketball. The authors
35
propose the distance as a control parameter without providing sufficient evidence for this
claim other than anecdotal proof. The authors varied the distance between 1.5m and 12m in
steps of 1.5m in a randomized fashion. Each participant performed 20 shots from each
distance. Additionally the authors included a condition where the participants pretended only
to shoot from each of the according throwing distances. The analysis was based on two
unsynchronized VHS-Video cameras from both sides. Remarking that at the time of
experimentation no analysis methods existed which could identify differences in shooting
form for the basketball shots (Liu and Burton, 1999, p.833) the authors assessed the shooting
patterns using a nominal scale rating foot placement, trunk rotation, hand shooting height and
jumping height. For example, release of the ball above head height scored a 3 whereas
releasing from below chin scored a 0. No explicit kinematic data was collected. The authors
concluded that they were able to identify phase transitions between different movement
patterns which were accompanied in some cases by increasing fluctuations although no
description of the actual measurement of fluctuations was provided. The transitions occurred
at different distances in the two conditions. During actual shooting the transition distance
occurred at a lower distance compared to the simulated shooting condition. Although showing
some interesting results the study suffers from some severe short-comings. The authors were
not able to provide any evidence that their measurement method was able to pick up any
meaningful differences in shooting patterning. Accordingly, it was not clear whether the so-
called transitions between different movement patterns described actual transition behaviour
or whether they were the result of adaptation of a single movement pattern. The investigation
into the stability or in dynamical system terminology of critical fluctuations was not
sufficiently explained. Based on their randomized distance approach, the authors were not
able to show any hysteresis. Regarding the participants used in the study, the authors noted
that pattern stability was likely to be influenced by playing standards (Liu and Burton, 1999,
p.833). However, the movement patterns showed “remarkable stability in all body
components across distance and conditions” (Liu and Burton, 1999, p.838) which
contradicted the assumption and possibly pointed towards an insufficient analysis
methodology. In conclusion, although the result appeared interesting the authors failed to
provide sufficient justification for their results.
In summary, in regards to discrete movement models the support of the dynamical
systems tenets is by no means as broad as it is in the case of cyclical bimanual movements.
This his been pointed out by several authors (Button et al., 1998; Summers, 1998) and
accordingly “studies of phase transitions in the context of discrete movements such as
36
reaching and grasping have been few and far between” (Wimmers, Savelsbergh, Beek, and
Hopkins, 1998, p.245). The studies discussed provide only weak support for the tenets of
dynamical systems theory for discrete movements whereas hysteresis effect has often been
established, proof for the remaining phase-transition criteria has not been typically presented.
The difficulty with discrete movement models is further exacerbated due to the insufficient
methodological treatment of discrete movement in regards to pattern stability and the
subsequent investigation into time scale behaviour (Schöner, 2002). At present no clear
analysis method recommendations exist. In regards to the methodological approach in studies
with discrete movements the range of proposed order parameter varies vastly in stark contrast
to the rhythmical domain. Whereas in the latter case mainly variants of the initial in-phase-
anti-phase model were used, for discrete movements concepts like segment lag, time-of-
closure, or throwing posture compete as potential order parameters. Accordingly, in some
cases it seemes unclear as to what the actual rational for the proposed order parameter were.
However, connecting these presented discrete movement models with the hierarchical
scheme introduced earlier, most of the studies also exhibited a separation of the second and
third level where segment kinematics were not prescribed by task requirements. Hence,
potentially indicating high complexity in order parameter behaviour when degeneracy
constraints are relaxed.
Limitations of the dynamical systems theoretical framework of movement
coordination
The dynamical systems theoretical framework of movement coordination has not been
unchallenged. As DST marks a serious departure from pre-existing theories (i.e. information
processing), criticisms concerning a number of issues have recently surfaced in the literature.
In the following discussion, the criticised issues will be divided into internal and structural
themes. Internal issues do not challenge the fundamental assumptions of the framework as a
whole whereas the structural criticisms address fundamental assumptions of the framework
and therefore lead to stronger implications regarding the validity of the framework.
Internal issues
Regarding internal criticisms, some debate over the HKB-Model has accumulated
since its introduction. For example, Peper and Beek (1998) investigated extension-flexion
movements of the wrist using the scaling methodology in which participants were instructed

37
to keep the movement amplitude constant whilst the movement frequency was increased.
Under this task constraint no phase transitions could be observed which lead the authors to
postulate that the coupling term of the HKB-Model may be wrong and proposed a new model
formulation (Peper and Beek, 1998). It remains unclear though to what extent the instructions
actually influenced the dynamics of the system. Potentially the results were a consequence of
the specific task raising the issue of the interactions between intentions and intrinsic dynamics
which are not very well understood at present (Post et al., 2000b).
Further, criticism regarding the HKB-model was formulated by Kao, Ringenbach and
Martin (2003). Investigating the transition behaviour from walking to running on a treadmill,
the results showed no critical fluctuations preceding the transition from walking to running.
The authors operationalized the relative phase between knee and ankle joint angle kinematics
and between knee and hip joint angle kinematics as the dependent measures and estimated the
variability of these parameters through standard deviations. When participants switched from
walking to running no increase in the variability was observed, which lead the authors to
conclude that the HKB model does not apply to lower limb kinematics in gait. As discussed
earlier critical fluctuations are not always present in all cases of phase transitions, limiting the
impact of this criticism. However in this particular study no justification was given as to why
the chosen parameters should actually represent the order parameter dynamics in the first
place. Walking represents a full body movement and obviously involves more components
than only the knees, hip, and the ankle. Accordingly, the implications derived seem rather
arbitrary.
Structural issues
Referring now to structural criticisms, a common issue raised in connection to the
dynamical systems framework addresses the type of movement models studied (Walter,
1998). As became clear from the preceding overview, the overwhelming majority of the
movement models used can be subsumed under the umbrella of cyclical movements using few
biomechanical degrees of freedom. For these movements although being perceived as
archetypes of human coordination (Turvey, 1990) the “specific relevance of these models to
most purposeful movements […] remains unclear” (Walter, 1998, p.327). Support for this
view recently gained momentum specifically regarding the lack of functional movements
studied (Obhi, 2004, compare Figure). Accordingly, Walter (1998) concluded that ”the
importance of nonlinear phase transitions in most purposeful skills has yet to be determined”
(p.327). This is a particularly serious concern for every theoretical framework since the

38
application of concepts should be possible in the domain of everyday tasks as well laboratory
simulations (Cordo and Gurfinkel, 2004).
Figure 2-6: Types of movement tasks used in bimanual coordination studies. Adapted from Obhi (2004, p. 113)
Locating functional movement models or rather object/goal-oriented movements
(Obhi, 2004) within the hierarchical structure introduced earlier (Newell et al., 2001),
functional movements can be regarded as movements where the levels of the spatial-temporal
outcome and the movement dynamics are separated from each other. In most studies
discussed previously these two levels are identical. Hence, past research provides little
information of how the coupling between these two levels is achieved. Accordingly, deeper
insights into this coupling from a dynamical systems perspective remain elusive.
Regarding the external validity of movements with limited biomechanical degrees of
freedom another problem arises. Using a low dimensional task the possible movement
solutions are limited already a-priori which potentially introduces a bias in the way movement
behaviour adapts (Fink et al., 2000). Hence, the mere set-up of a specific task, the behavioural
information inherent to the task, already biases the possible movement outcomes leading
potentially to false conclusion when generalized to other contexts (Heise and Cornwell, 1997;
Hong and Newell, 2006; Sames, 2000). Accordingly, when a task provides several degrees of
freedom and degeneracy is available to the system it seems reasonable to assume that the
movement system is able to make use of these additional degrees of freedom yielding more
complex behavioural outcome compared to a simple bimodal state as has been showed in the
pedalo locomotor task (Chen et al., 2005).

39
From a conceptual standpoint this seems also problematic since a basic assumption of
dynamical systems theory states that findings from low-dimensional movements do not
necessarily transfer across to higher-dimensional movements (Swinnen and Carson, 2002).
Hence, by limiting the chosen models to a specific subset the dynamical systems framework
is able to incorporate only movements which are close to the utilized movements in terms of
the degrees of freedom but is by its own virtue potentially not able to generalize to higher
order movements. Further, applying Bernstein’s definition of coordination, stressing the
notion of redundant degrees of freedom, in some of the tasks reviewed earlier, the redundancy
at the component level appears very limited and therefore it remains unknown to what extent
these findings hold up in general. Yet, the necessity to conduct research using more than
bistable, two-component movements has been acknowledged within the dynamical systems
literature quite early on (Kelso and Schöner, 1988).
Regarding the apparent dichotomy between discrete and cyclical movements the
confinement not only to low-dimensional tasks but to cyclical tasks seems especially
problematic since recent investigation into the relation between discrete and rhythmical
movements found some compelling evidence for fundamental differences between these
movement classes (Obhi, 2004).
Schaal, Sternad, Osu and Kawato (2004) investigated wrist flexion and extension
movements in participants whilst recording synchronously brain activation through functional
Magnetic Resonance Imaging (fMRI). Results indicated that brain activation patterns differed
significantly between rhythmical and cyclical movement even when executed in the same
joint. Similarly, in a study investigating kinematic differences between rhythmical and
discrete movement execution in a bimanual task (Wei, Wertman, and Sternad, 2003)
significant differences were found. Participants performed a flexion-extension movement with
the dominant arm and were instructed to add either a discrete movement or rhythmical
movement in the non-dominant arm according to an imperative signal. Results indicated that
movement initiation deviated significantly between the two conditions. In the discrete
condition participant initiated the movement during all instances of the cycle of the dominant
arm. In the rhythmical condition movement initiation was mainly distributed around the
turning points of the rhythmical movement. The authors concluded that different movement
preparations between the two movement types were necessary pointing towards significant
differences between discrete and rhythmical movement execution (Wei et al., 2003). Similar,
in the investigation of grasping Button et al. (1998) performed a comparison between

40
rhythmical and discrete movement execution. The results indicated differences of the
preferred grasping patterns between the two conditions which lead the authors to conclude
that the two movements were “fundamentally different” (p.818).
Another structural criticism to the dynamical systems framework can be addressed to
one of its fundamental conceptions. Whereas in the domain of physical systems like the laser
example mentioned earlier a rigorous mathematical treatment of the interactions of the
subsystem components is possible providing a cause-effect relationship between the processes
on the microscopic level and directly connecting with the resulting behaviour at the
macroscopic level. This approach is not readily available in the domain of biological
movements because of the sheer complexity inherent to neurobiological systems (Hossner,
2000). The escape route proposed to this problem lies in using a phenomenological approach
to the systems which applies to all of the studies mentioned so far (Beek et al., 1995; Haken
and Wunderlin, 1991). In using this approach the question of why the movement behaves in a
specific way cannot be answered and sometimes only a mere description of the movement can
be derived missing the linking between the macroscopic and microscopic levels of
observation with each other (Hossner, 2000; Lames, 1992; Sporns and Edelman, 1993).
This line of criticism can be further pursued in regards to the borders and boundaries1
(Hossner, 2000) of the system. Crucial for the application of dynamical systems theory to the
study of neurobiological coordination is the identification of the sufficient and necessary
components of the system in order to capture the behaviour at a chosen level of observation.
The definition of the level of observations and the included components seems often to be
justified only because of ease of analysis. Herein lies the problem that postulated system as
such could be something of an ontological fiction rendering the derived insights potentially
less than useful (Hossner, 2000). For example, the study of Kao et al. (2003) investigating the
transitions from walking to running presented earlier.
In order to overcome this problem some propositions regarding meaningful levels of
observation and division of components were provided by Schöner (1995). Divisions of
system borders have to be chosen in order to minimize the interactions between different
components. If the different components are highly interactive with each other the behaviour
cannot be investigated separated from each other leading to unreasonable results. The
1 Translated from german: „Ränder und Grenzen“ (Hossner, 2000)
41
components still have to be related to the particular task at hand and therefore are always task
specific. However, this justification has not been used in any of the studies presented.
In summary, several issues surrounding the dynamical systems framework can be
identified which pose different levels of threat to the framework as a whole which need to be
addressed by further research.
Conclusion – Part One
In this chapter, the dynamical system approach to movement coordination has been
introduced. Based on a definition of coordination developed by Bernstein (1967) entailing
several conceptual issues, it has been shown that the dynamical systems theoretical
framework has the potential to address the basic definition and the accompanying issues.
The synergetics framework provides the theoretical basis for the process of self-
organization in complex non-equilibrium systems. Key concepts from synergetics are
attractors, control parameters and the notion of time scales entailing critical fluctuations,
critical slowing down and hysteresis. The synergetics framework provided the necessary
experimental apparatus which makes predictions and therefore scientific investigations of
motor control under this framework possible and feasible. A subsequent brief overview of the
existing literature concerning the dynamical systems framework showed that the framework
has been successfully applied to various problems in movement coordination. Thereby,
integrating several facets of human motor control including perceptual, intentional, and
developmental phenomena. Thus, providing a coherent view on neurobiological motor
control.
The key notion in many of these studies was the importance of stability as a mean to
investigate the properties of the specific movement behaviour. Loss of stability and
subsequent changes in global systems behaviour served as the focal point in these
investigations and provided the main entry point into investigations under this framework.
However, the different findings even for apparent highly similar tasks highlighted that
subtle changes in task specific requirements can lead to dramatic changes in behavioural
outcomes (e.g. changing the pivoting point in the pronation-supination task or providing
additional perceptual information) affecting the possibility to generalize beyond specific
tasks. Incorporating intrinsic dynamics made investigations into motor learning possible
42
which have highlighted the individual characteristics of movement coordination which are
influenced by past and present behaviour of the performer.
Regarding recent criticism of the dynamical systems framework, the main issues could
be appointed to the confinement to a specific kind of movement models. This confinement
entailed several further issues which have been highlighted in the previous section. Hence, in
order to address some of the issues with regards to the dynamical system paradigms
experimentation using different movement models seems necessary. Three issues appear
especially significant:
1. The dichotomy of discrete and rhythmical movements, where discrete movement pose
several conceptual as well as methodological challenges.
2. Movement models using low numbers of biomechanical degrees of freedom vs.
movements involving high numbers of biomechanical degrees of freedom.
3. Goal-directed degenerate movements vs. movement determined movement models.
In the following section the necessary prerequisites for addressing these issues will be
developed resulting in the proposition of a potential movement model.
Prerequisites for a different movement model
As has been recently highlighted the domain of sport provides valuable sources for
movement models which deviate from the movements traditionally used in studies of motor
control (Davids, Button, Araújo, Renshaw, and Hristovski, 2006). In this regards a ballistic
throwing movement could sever as a candidate. A strong argument in favour of this model is
based on the fact that several authors have already investigated ballistic throwing movements
from a dynamical systems theoretical perspective (e.g. Liu and Burton, 1999; Southard, 1998,
2002). Therefore, some guidance of how to proceed with the application of dynamical
systems theory is present. However, as has been highlighted in this chapter, these studies
suffered from some serious shortcomings but nevertheless it seems feasible to expand upon
their approaches.
Relating ballistic throwing movements to the issues identified earlier the movement
appears to provide a suitable candidate movement model. Ballistic throwing movements are

43
discrete and usually incorporate movements of the whole body involving many biomechanical
degrees of freedom (Hore, Watts, and Tweed, 1994). Further, defining an explicit target to be
thrown at changes the task into throwing for precision and detaches somewhat the level of the
task-goal from the level of coordination introducing the possibility of degenerate movement
behaviour. As has been shown the throwing velocity and the throwing distance respectively
may serve as potential control parameters triggering changes in throwing movement
patterning. Facilitation of switching behaviour could be achieved by limiting task instruction
in regards to the actual movement execution which limits the amount of behavioural
information constraining possible movement adaptations.
In order to provide a connection between a new movement model and the existing
body of literature introduced earlier it seems advantageous to choose a throwing movement
where some properties in movement execution are present which can be related to already
investigated movement models (such as the curvature of the wrist trajectory in multi-joint
unimanual movements, see Buchanan et al., 1997). In the following chapter, a potential
movement model, the Basketball Hook Shot, will be introduced.

44
Part two - Literature of basketball hook shot
As was discussed in the previous section, throwing movements may represent an
excellent movement model with which to relate to the key principles of dynamical systems
theory. In fact, Liu and Burton (1999) presented some interesting indications for changes in
movement patterning in a basketball shooting task. As will be shown in this chapter, changes
in kinematic variables have been found in numerous studies investigating basketball shots
under varying distance requirements. The subtle adaptations that have appeared make it
difficult to attribute changes in movement patterning as phase transitions between attractors.
Further, because of the widespread familiarity of basketball set shots (or free throws) it might
be likely that many people already possess specific behavioural information about the task
which potentially hinders self-organized adaptations strategies (compare Post et al., 2000b). A
classical basketball throw may not prove to be a suitable candidate movement model and
there is a need to seek a less common shooting movement. A candidate movement model may
be found in the basketball hook shot.
Defining the Hook Shot
According to Martin (1992) the hook shot itself can be distinguished into two basic
techniques: the traditional hook or sky hook and the jump hook. Both techniques use a one-
handed throw but exhibit some distinct differences. During the sky hook the shoulders are
almost in line with the throwing direction. The throwing arm is on the opposite side to the
basket. Therefore in a game situation the body provides cover from an opponent. The wrist of
the throwing arm describes a wide arc and the elbow is extended during most of the
movement. The jump off takes places from the leg opposite to the throwing arm and the ball
should be released at the peak of the jump. During the jump hook the upper body is almost
square to the throwing direction and both feet are used for jumping. The throwing technique is
much more similar to the set shot technique though lacking the guidance of the ball by the
non-throwing hand. The elbow is flexed at the beginning of the movement and stays flexed
until the last phase of the throw (Martin, 1992). In game situations variations of these general
movements can be observed and individual variations are expected to be high since individual
modifications to general motion patterns are common (Satern and Keller-McNulty, 1992).
The hook shot per se describes a broad range of movements and therefore even for players
familiar with the hook shot sufficient room for adaptations due to contextual changes can be
assumed supporting the hook shot as a candidate movement model. In this regards a
basketball hook shot does not completely prescribe the throwing movement but some

45
degenerate degrees of freedom are always present which can be potentially exploited by the
performer.
As the hook shot is a ballistic throwing movement it falls into the class of discrete
multi-articular actions. The ball release is performed whilst the thrower is airborne which
means that small adaptations in movement patterning need to be accommodated by global
reorganization because of inertial affordances (Hang, Cheung, and Roberts, 2001). As the
hook shot is a unique and complex movement it can be assumed that people not familiar with
basketball will have very limited knowledge of the movement and accordingly should exhibit
relatively unconstrained behaviour depending on the specific task instructions. Potentially,
this feature can be further investigated by juxtaposition of novice and skilled performers and
potential differences in adaptation strategies.
Based on the movement of the throwing arm, which follows a curvilinear path, the
movement pattern resembles some of characteristics of the movement used in studies using a
curvilinear movement in one arm presented earlier (Buchanan et al., 1997; DeGuzman et al.,
1997; Kelso et al., 1991a). Movement patterning from the hook shot can therefore be related
to the results of existing investigations potentially providing some common ground between
the basketball hook shot and more traditional movement models.
To date, no scientific studies investigating the hook shot have been published.
However, in order to provide some frame of measurement the literature dealing with
basketball set shots and jump shots will be investigated based on the assumption that some
features found in these actions should apply to some extent to the hook shot.
Research on basketball throwing actions
Several basketball studies described in this section have used a motion capturing
approach based on the 2D kinematics of the thrower. At present, it is not known to what
extent these measurements are valid therefore some uncertainty regarding the validity of the
results may exist (Debicki, Gribble, Watts, and Hore, 2004; Gard, Knowx, and Childress,
1996). The type of motion capturing will be stated for each investigation (2D vs. 3D).
Hudson (1982) investigated differences in free throw shots between participants of
different skill levels using 2D motion capture. The author found significant differences in
relative release height between the different groups with the better throwers using higher ball

46
release heights. The experts revealed an increased shoulder angle between the trunk and the
upper arm compared to the intermediate and the novice groups and successful shots were
released higher than unsuccessful shots (by 4 cm). No differences between groups for release
angle and release speed could be identified but the data showed considerable intra-group
variability (Hudson, 1985 2D). Another basketball study investigated the continuous segment
kinematics during the throwing movement (Hayes, 1987, 2D). It was shown that the
sequencing of the maximum segment velocity started at the lower limbs and proceeded along
the shoulder, upper arm, lower arm, and the hand to the ball . The movement was analysed
from the instance of the crouch prior to throwing until ball release. However a small sample
of only nine shots (all successful) were analyzed (Hayes, 1987).
In a 2D kinematic analysis of the jump shot of female basketball players, Elliot and
White (1989) found greater ranges of motions for the throwing shoulder and wrist angle in 3
point shots compared to free throws. The results may have been influenced by the task
instruction to use the same take-off technique during the two shots (Elliot and White, 1989,
p.7) which highlights the influence of restrictive behavioural information that potentially
limits movement adaptations in throwing tasks. Using 2D kinematic analysis, Elliot (1992)
compared jump shots from male and female basketball players shooting from 4.25m (free
throw line), 5.25m and 6.25 (3 point distance). A significant difference in the velocity of the
throwing shoulder for the females between the closest and the further distances could be
found. The shoulder angle was also the only angle parameter which was significantly different
between genders. The authors observed that the male shooters tended to release the ball closer
to the peak height of the wrist compared to the female players who released the ball during the
ascent of the ball. The authors attributed this fact to the weaker strength of the female players
who were able to transfer momentum from the vertical and horizontal velocity of the body to
the rising ball (Elliot, 1992, p.116).
This finding was supported in a study using 3D motion capturing and comparing
basketball jump shots from three different distance ranges (<3.66m, 3.66m-5.49m, >5.59m)
where it was shown that the release height decreased with increasing distance (Miller and
Bartlett, 1993). The authors observed an increase in the throwing elbow angular velocity with
increasing shooting distance which was achieved despite decreased elbow joint range of
motion. The wrist showed the opposite trend. The authors suggested that the influence of the
elbow joint in force production increased with higher distances (Miller and Bartlett, 1993,
p.289). In a study with three participants shooting at different distances (Miller and Bartlett,

47
1991) observed the same trend in results using 3D motion capturing. When re-evaluating the
pooled data the authors suggested that the data analysis used may have been misleading and
proposed an approach based on regression analysis instead of ANOVA since shots within a
certain distance factor came actually from different distances (Miller, 1996).
A follow-up study (3D) investigated the influence of distance on shooting kinematics
in relation to playing positions (i.e., guards, forwards, and centers). The results corroborated
the findings from the preceding study (Miller and Bartlett, 1996). The authors found a slight
trend for guards and forwards to use the jump differently from centers. Where the former
smaller players used the jump mainly for increasing the release height the latter taller players
used the jumping velocity in order to accelerate the ball at higher distances.
Differences between the 2D kinematics of players of varying playing position have
also been identified by Walters, Hudson and Bird (1990). Investigating four participants
shooting from 4.3m, 5.2m, and 6.1m at a angle of 45° to the basket board, significant
differences were found for release speed which increased with increasing distance for all
participants. The authors concluded that long distance shooters adapted their release speed in
a more systematic fashion than the middle distance shooter.
Satern, Messier and McNulty (1989) investigated the influence of varying basket
height (3m and 2.4) and ball size (normal and intermediate) in 13-year-old adolescents.
Significant differences were found only for ball release angle and the release angle of the
shoulder in relation to height. The authors concluded that the movement patterns were
possibly already too established as the different conditions did not elicit adaptations in the
movement. The authors remarked that because of data pooling the individual differences
could have been masked by the analysis (Satern et al., 1989, p.133).
Rojas, Cperot, Oña and Guiterrez (2000) investigated the influence of a defending
player on shooting kinematics of the jump shot using 3D motion capturing. Participants were
instructed to perform a jump shot at the corner of the free throw line after receiving a pass
from another player. A defender ran up towards them at random times and tried to interfere
with the shot. The set-up was arranged in order to simulate an actual game situation. Results
indicated a faster release at increased height during the presence of an opponent. Participants
used a more upright position especially with higher shoulder angles. The authors concluded
that despite small differences between the conditions the coordination demands might be
altered between the two conditions (Rojas et al., 2000, p.1659).

48
Investigating the variability of discrete variables at ball release in the free throw,
Miller (2000) found greater coefficients of variation in release angle and release height for
successful shots compared to non-successful shots. The non-successful shots exhibited greater
absolute variability for linear velocities of segment endpoints. All shots showed increasing
variability with increasing shooting distance. In a follow-up investigation, inaccurate shots
were again not characterized by higher variability compared to accurate shots (Miller, 2002).
Changes in release parameter variability followed no obvious trend pointing towards
individual strategies for increasing shooting distances. Regarding the segment variability,
decreasing values from lower to upper extremities were found with the lowest variability in
the wrist. Miller (2002) concluded from his analysis that it was not possible for the
participants to perform the same movement pattern twice.
Except for Hayes (1987) all studies presented so far used only discrete data points
during key events in order to assess the kinematics of the basketball shot which provides very
limited information about the actual process of coordination during the throw. In general,
approaches focussing on continuous kinematics are sparse (Satern and Keller-McNulty,
1992). A recent exception is a study conducted by Button, MacLeod, Sanders and Coleman
(2003) who investigated movement variability during the free throw adapting a time-
continuous approach. Kinematic data of the throwing arm was captured in 2D with six female
participants of varying performance abilities. Performance outcome was rated using a four
point scale (Landin, Herbert, and Fairweather, 1993) and all throws irrespective of success
were included in the subsequent analysis. Joint angle kinematics showed a tendency for
decreasing variability with increasing abilities. Inter-trial variability at ball release was only
decreased for the best throwers and variability at the wrist was generally lower compared to
the elbow. Movement variability plots showed increasing variability from start to mid-point
of the movement followed by decreasing variability scores towards ball release in all
participants. Investigations into the sequencing of joints based on a cross-correlation
technique indicated a proximal-to-distal sequence for the two participants with the highest
ability apparent. With regards to the literature, the authors highlighted that at present mainly
investigations of discrete key events with grouped data were executed and that more
investigations using an individualized approach were needed.
Satern and Keller-McNulty (1992) conducted a study investigating the free throw in
20 participants (10 male, 10 female) using time-continuous measurements of four successful
throws per participant (2D). Based on time-angle curves and angle-angle plots the authors

49
were able to identify different inter-individual styles in free throw execution. The results
showed interdependence between elbow and knee where flexion and extension occured
simultaneously in both joints (Satern and Keller-McNulty, 1992, p.22). The authors
investigated the possibility of analysing the data with time-normalized angle plots but
discarded this type of analysis based on differences in the length of the time curves which
lead to skewing of the data plots thereby introducing spurious differences. Their reference
points where offset of motion for the start of the trial to 0.1s past ball release as the endpoint
of trial. The curves showed differences in the individual preparatory motions possibly caused
by the observed differences in trial lengths. However, no quantitative analysis of observed
differences was provided. The authors emphasized that information obtained from discrete
key-events did not provide information about the temporal relations between limb segments
which is needed if coordination should be assessed (Satern and Keller-McNulty, 1992).
Conclusion: Part Two
In the preceding section, research regarding basketball shooting was reviewed since no
literature concerning the hook shot could be located. The findings from these studies
supported the initial notion that shooting distance might serve as an influential parameter
acting upon movement coordination. A robust finding was that increases in ball velocity and
hand movement speed were associated with alterations in joint angle kinematics. This
information potentially provides a link between the basketball shot and studies investigating
throwing for movement speed (Southard, 1998, 2002) and uni-manual rhythmical movements
(Buchanan et al., 1997; DeGuzman et al., 1997; Kelso, Buchanan, and Wallace, 1991b).
Hence, it can be postulated that throwing distance acts as a candidate control parameter which
can be used in a scaling type experiment. Also, since a curvilinear pattern of the throwing
hand is explicitly used during movement execution of the hook shot one can assume a
connection between the unimanual studies discussed earlier. However, the literature presented
showed that alterations in movement kinematics were highly influenced by individual
prerequisites like experience and anatomical characteristics (for example body height and
strength). This fact stresses the importance of individualized analysis approaches which also
ties in with the theoretical implications derived earlier in regards to intrinsic dynamics.
No previous research has studied changes in global movement patterning from a
dynamical systems theoretical point of view. Arguably the restrictive regulations for
performing a basketball set-shot narrowly constrain the phase space, thereby hampering the
occurrence of phase transition. Hence, the basketball set-shot might not be a suitable

50
movement model for the observation under the current purpose. The potential for the
basketball hook shot in this regard has received much less attention.
Regarding the level of information concerning basketball set-shots it has to be stressed
that the data base generally derived from applied studies seems quite weak. As has been
pointed out most studies used a 2D motion capturing approach often paired without the use of
markers which makes correct estimation of joint positions and subsequent calculations of
correct joint angles difficult at best (Bartlett, Bussey, and Flyger, 2006). Further, as can be
seen in Table 2-1 the actual number of throws investigated in the presented studies were very
limited and can be only explained by past difficulties in data collection and data processing.
Accordingly, usage of such a limited number of throws per participant strongly constrain the
amount of information available about intra-individual adaptations.
Table 2-1: Summary table of reported studies indicating type of motion capturing (2D/3D), number of participants (N), number of throws (No. Throws), and whether only successful shots were investigated. Authors 2D/3D N No. throws only successfulHudson (1982) 2D 18 54 no Hudson (1985) 2D 22 66 yes Hayes (1987) 2D NA 9 yes Elliot and White (1989) 2D 10 20 yes Elliot (1992) 2D 24 72 yes Miller and Bartlett (1991) 3D 3 6 yes Miller and Bartlett (1993) 3D NA 15 yes Miller (1996) 3D 15 15 yes Walters, Hudson and Bird (1990) 2D 4 12 yes Satern, Messier and McNulty (1989) 2D 13 104 yes Rojas, Ceperot, Ona and Guiterrez (2000) 3D 10 80 yes Miller (2000) NA NA NA no Miller (2002) 3D 12 360 no Button, MacLeod, Sanders and Coleman (2003) 2D 6 180 no Satern and Keller-McNulty (1992) 2D 20 80 yes Total 157 1073 Liu and Burton (1999) (ordinal) 2D 10 1600 no
An apparent departure was the study made by Liu and Burton (1999) where a
significantly higher number of trials was recorded from each participant. Yet, the data were
analyzed only on an ordinal scale (see Paragraph on discrete movements in Chapter 2 ) which
again limits the amount of information available.
Another point of criticism concerns the heavy emphasis placed upon successful shots.
An implicit assumption taken with this line of investigation is that shots were taken from the

51
exact same spot in order to be comparable to each other. This seems especially unlikely for
jump shots and to some extent also for the free throw. For example, assuming a successful
shot made by a performer from 4m distance, the exact same shot from 4.1m will quite
probably lead to an unsuccessful shot without any observable change in the recorded
kinematics. Yet, in making the shot successful the kinematics have to be adapted to the altered
task constraints. Hence, the exact location of ball and performer in 3D space in relation to the
basket has to be taken into account in order to make the comparison between successful and
non-successful shots meaningful. Thus, focussing solely on successful shots seems not
necessary.
Finally, since the basketball shot derives directly from an applied setting it seems
somewhat surprising that only a single study investigated how the presence of an opponent
affected throwing behaviour. From a practical point of view, information about change in
throwing kinematics due to distance alterations are only of theoretical interest unless it is
known whether the similar procedures are in place when performers face an opponent.

52
3 Chapter Three: Analysing the basketball hook shot
Introduction
As discussed in the previous chapter, the basketball hook shot represents a promising
movement model for the application of dynamical systems theory to the study of coordination
of discrete, multi-articular actions in degenerate neurobiological systems. However, a first
necessary step for this programme of work was to consider to what extent adaptations in the
hook shot due to changes in task constraints could be expected. Hence, the first study
investigated adaptation of coordination in the basketball hook shot due to changes in two
interacting constraints required to be satisfied in the context of basketball: (i) changes in
throwing distances; and (ii), the presence of a defender. Based on the conjecture that
increasing throwing distance leads to increasing throwing speeds (Dupuy, Mottet, and Ripoll,
2000) the throwing distance was identified as a potentially influential parameter. A key
question was whether changes due to alterations in throwing distance remain the same
independent of the presence of a defender. The presence of a defender can impose spatial and
visual constraints on the thrower, limiting movement space and sight of the intended target
(i.e., the hoop), hence it seems plausible that the presence of the defender might affect
movement patterning. However, concrete predictions other than those observed by Rojas et al.
(2000) like increased shoulder angle and decreased movement time when throwing against a
defender. could not be inferred from the literature. Conceptually, the manipulation of
constraints can be viewed from a dynamical systems perspective as the emergence and decay
of constraints as formulated by Guerin and Kunkle (2004). The importance of constraints in
shaping behaviour varies in time depending on the current control parameter value. Hence,
whereas one constraint might be highly influential in certain regions of phase space, its
influence can potentially decay as a different constraint gains importance and starts to emerge
over time
As was pointed out earlier, it seemed advantageous to investigate potential
commonalities between the basketball hook shot and previous movement models used.
Accordingly a two-fold strategy was used. First, in line with the work of Southard (1998,
2002) which highlighted the influence of throwing velocity on selected joint lag coordination
the joint lag in the basketball hook shot was investigated. However, the task constraints of
neither of Southard’s previous studies greatly emphasised throwing precision since
participants were only instructed to aim at a mat which was placed five metres away. Further,
no attempt was made to analyse lower body kinematics during performance and all

53
measurements were pooled for group comparisons. Hence, it was not clear to what extent the
same trends could be identified for the basketball hook shot. Second, during the execution of a
hook shot the trajectory of the wrist describes an arc-like pattern very similar to experiments
investigating uni-manual movement coordination (Buchanan et al., 1997; DeGuzman et al.,
1997; Kelso et al., 1991a). Therefore, potentially similar coordination dynamics might be
exhibited by the basketball hook shot. Accordingly, constrained by increasing throwing speed,
the curvature of the wrist joint trajectory should increase and in turn the radii of the wrist
trajectories should decrease. An interesting issue arises when interpreting the radii from a
biomechanical viewpoint using the distinction between throwing for distance and throwing
for precision. During the former, a curvilinear path would be expected as opposed to throwing
for precision where a more rectilinear path appears desirable (compare Kreighbaum and
Barthels, 1996). Hence, in both cases, as the distance increases, the radii should increase.
In regards to the different arm coordination patterns between the hook shot and the
basketball set shot, detailed investigation of the arm movement is necessary, since in set shots
the throwing elbow appears to play a bigger role in the movement with increasing distance
(Miller and Bartlett, 1993). Furthermore, participants of different skill levels have been
observed to exhibit different levels of movement variability in free-throwing (Button et al.,
2003). In order to investigate whether a similar trend was present for the basketball hook shot,
participants from a range of different skill levels were observed in the study. It seems likely
that expert players should possess more detailed behavioural information regarding the
concept of a hook shot (apart from the instructional constraints of this experiment) due to their
prior experience (see also Kudo, Tsusui, Ishikura, Ito, and Yamamoto, 2000; McDonald, van
Emmerik, and Newell, 1989). Since the DST framework highlights significant levels of inter-
individual variation in movement patterning, a multiple single-participant design approach
was used (Bates, 1996; Williams, Haywood, and VanSant, 1998; Zhan and Ottenbacher,
2001), with a concordant emphasis on intra-individual adaptations during analysis.
Method
Participants
Four participants (Age = 22.25±3yrs; Height = 1.88±0.14m) were involved in the
study. Participant 1 was a professional basketball player, participants 2 and 3 (female) were
intermediate players (regional club level) and participant 4 was a novice. Each participant
signed a consent form approved by the University of Otago Ethics Committee before taking
54
part in the study. All participants used their dominant right hand for throwing and had not
experienced any injuries in the six months preceding the study.
Procedures
Participants were instructed to score baskets (without using the backboard) with a
hook shot technique. The movement started with the participants’ back facing towards the
basket and they performed one ball bounce before shooting. This pre-shot routine was
intended to resemble the task constraints of a typical game situation. A mobile basket fixed at
a conventional height of 3.05m with a Plexiglas backboard and a standard sized basketball
(Size 7, FIBA approved) was used for all shooting trials. Replicating the scaling procedure
used by Southard (2002), throwing distance to the basket was varied from 2m to 9m in
increments of 1m after each trial block comprising eight shots. In the ‘no-defender condition’
the participant performed shots unopposed. During the ‘defender-condition’ a skilled
basketball defender was positioned at 3m distance from the shooting location. He was
instructed to run towards the throwers after they performed the bounce, and to stop 1 m in
front of the shooter before jumping vertically with arms reaching directly upwards. Before
data recording, participants performed a self-selected warm-up for 15 minutes. Next they
performed 10 shots each from 2m, 5m, and 7m to familiarize themselves with the procedure.
During data recording for all shots either with or without defender from 2m to 9m was
performed sequentially. In between trials, 30s recovery time was provided to prevent fatigue
effects. The order of defender and no-defender conditions was randomized.
Data Analysis
Joint centres of participants were identified using passive reflective markers to enable
recording of joint trajectory data with a 12-digital-camera system (Motion Analysis Corp.,
USA) set at a sampling frequency of 100Hz. Participants were prepared with reflective
markers (5mm diameter) at the left (l) and right (r) acromion, C7, sternum, lateral epicondyles
humerus (l/r), mid wrist (r/l), spina illica anterior superior (r/l), spina illica posterior superior
(r/l), sacrum, lateral and medial epicondyles, femoris (r/l), lateral and medial malleolus (r/l),
heel and toe marker (r/l) in order to identify anatomical landmarks. In addition one marker
each was placed on the tibia (r/l), on the lateral part of the femur (r/l), the humerus (r/l) and on
the distal, dorsal part of the forearm.

55
The position of the hip joint centre was estimated using the procedure of Bell,
Pedersen and Brand (1990), and position of the shoulders by using the procedure by Rab,
Petuskey and Bagley (2002). After visual inspection of the frequency spectra, raw
displacement data were filtered using a second order Butterworth filter set at a cut-off
frequency of 10Hz From the marker trajectories, a 12-segment body model was established.
Joint angles were calculated using the Euler convention but only angles in the primary joint
plane of motion were used for further analysis. Shoulder joint kinematics were estimated
through the included angle between the upper arm and the trunk. Movement time commenced
from the instance of maximum crouch and finished at the instance of maximum wrist height
(i.e., assumed to represent ball release). In order to obtain angle-angle plots, trials were time
normalized to 50 data points. All velocity measurements were based on the filtered data, not
on the time normalized data.
Discrete variables, including angles of the right and left elbow, shoulder, hip, knee,
and ankle joint at ball release were chosen for analysis. In order to obtain an estimate of
throwing velocity, maximum linear wrist velocity was determined. Segment lag was
estimated using the instance of maximum linear velocity with the determined trials. Naming
convention following Southard (2002, 2006) was always based on the distal segment (Wrist
lag: right wrist lag – right elbow lag). Shoulder lag was calculated as right shoulder lag – left
hip lag, to investigate the sequencing between upper and lower body along the kinematic
chain. Movement coordination was qualitatively examined using angle-angle plots of the right
shoulder joint and the right elbow joint, the left shoulder joint and the left elbow joint, and the
left knee joint and the left hip joint with time normalized plots (Button et al., 2003).
Following the methods used by Buchanan et al. (1997) the radius of the wrist
trajectory was estimated by minimizing the sum:
( ) ( ) ( )21/ 22 2 22
01
1 N
k k kk
R x a y b z cN
σ=
⎛ ⎞⎡ ⎤= − − + − + −⎜ ⎟⎣ ⎦⎝ ⎠∑ (3.1)
Over the parameters (R0, a, b, c) where R0 was the desired radius and a, b, c estimated the
mid-point in space of the virtual circle, xk, yk, zk where the actual position of the wrist at time
frame k, and N was the number of total time frames. The sum was minimized using the
lsqnonlin function in Matlab 7.1.

56
Following the suggestions of Reboussin and Morgan (1996) for statistical analysis of
multiple single-participant designs the responses of the discrete angle kinematics at ball
release were analyzed using a mixed-effects model (compare Boyle and Willms, 2001; Laird
and Ware, 1982; Pinheiro and Bates, 2000; Sullivan, Dukes, and Losina, 1999; Verbeke and
Molenberghs, 2000 for an overview). Through this approach, changes in individual joint
angle kinematics could be separated into population effects which were shared across
participants represented by a fixed-effects structure and inter-individual differences which
were represented by a random effects structure. After visual inspection and preliminary
separate model fits for each participant, a linear regression model using a linear and a
quadratic distance trend was deemed sufficient to represent the changes in kinematics due to
changing throwing distance. In order to represent the influence of the defender an additional
factor with 2 levels was included representing the two conditions. Accordingly, together the
quantitative linear and quadratic regression components and the qualitative direction
component represented the fixed-effects structure of the model. As discussed earlier, the
basketball literature suggested some common trends across angles across participants
rendering this assumption feasible.
Regarding potential individual differences in movement adaptation strategies,
participants were regarded as random samples from a wider population introducing a random
component into the model. Accordingly inter-individual differences were modelled as random
effects which were included into the model yielding the mixed-model approach. For the
random effect, a two-level nesting was chosen. The first level represented a random effect
structure with an individual intercept and linear slope for the throwing distance for each
participant. This way different intercept terms representing different mean joint angles and a
different slope representing inter-individual differences in adaptation strategies due to the
varying throwing distance could be estimated. Further, in order to represent interaction effects
between defender condition and distance, a nested random effect was included. The effect was
nested within participants based on the assumption that interactions between the defender
condition and distance would show inter-individual differences. Since different skill levels
were used, the impact of the defender were assumed to vary between participants. Following
this rational the following full model could be formulated:
20 1 2 3 0 1 1 ,
1,...,8, 1, 2, 2,...,9, 1,...,10ijkl ijkl ijkl j i i j i ijkly d d b b d b
i j k l
β β β β ε= + + + + + + +
= = = =(3.2)

57
With β representing fixed effects and b and ε representing random effects with: β0 = general
intercept, β1= linear coefficient, β2 = quadratic coefficient, β3j = condition coefficient, b0i =
participant intercept, b1i = participant linear coefficient, b1j,i = distance by condition
interaction, and ε = residual variance. The random effects were assumed to be independently
within- and between- participants and normally distributed with a mean equalling 0 and
diagonal covariance matrix.
( ) ( ) ( )2 2 20 1 1 ,0, , 0, , 0,i s i sl j i cdb b bσ σ σΝ Ν Ν∼ ∼ ∼
Since several measures were observed from the same individual it seemed likely that the
measurements were strongly correlated between successive trials within participants. Further,
based on preceding investigations of movement variability (compare Button et al., 2003) the
typical linear model assumption of independent identical normally distributed residuals
seemed unlikely a-priori. Accordingly, an extended linear mixed-effects model was used to
accommodate the correlation and potential heteroscedasticity structure of the data. In order to
represent the correlation within- participants, a first-order autoregressive correlation term was
included. Heteroscedasticity was modelled through different variance terms for each
participant strata. Therefore, the covariance matrix for the residuals consisted of a blocked
diagonal matrix again assuming independence between participants.
( )20,iijkε σΝ Δ∼
Where Δ was a blocked diagonal matrix. Based on the algorithm used for this procedure, in
order to obtain unique estimates for the variance strata, one variance stratum was constrained
to equal 1 and the remaining strata were estimated as ratios of the first stratum (see Pinheiro
and Bates (2000) p. 209 for details).
As a first approach the full model was fitted to the data and if possible simplification
of the nested random effects structure was investigated based on assessment of confidence
intervals for the random effects. Only those random effects were maintained where the
confidence intervals were well bounded away from zero indicating significance. Reduced
models were always compared with the more complex model using likelihood ratio tests. The
reduced model was accepted when no significant differences between the models were
indicated (Pinheiro and Bates, 2000; Sithole and Jones, 2002; Verbeke and Molenberghs,
2000). When the estimation algorithm for the full model failed to converge, indicating a

58
misspecification of the model, the next simpler marginal model was used and the
simplification procedure was applied to this reduced model. The final model fit was
investigated based on the distribution of standardized residuals and the congruence of the
fitted and actual collected data The fixed-effects coefficient was tested using a Wald-statistic
which provided approximate F-tests, a common approach of testing fixed-effects in mixed-
models (Boyle and Willms, 2001; Brown and Prescott, 1999; Greenland, 2000; Pinheiro and
Bates, 2000; Verbeke and Molenberghs, 2000). All statistical analysis where performed using
the R software (R Development Core Team, 2006) and the nlme package (Pinheiro, Bates,
DebRoy, and Sarkar, 2006) for mixed-effects modelling. All remaining calculations were
performed using Matlab 7.1 (see Appendix B). Test results were deemed significant if p <
0.05 and highly significant if p < 0.01.
Performance scores were measures using a four-point scale, where a direct hit scored
1, an indirect hit using the back board scored 2, a miss with either rim or board scored 3, and
an air ball scored 4.
Results
This section is divided in several subsections. First, the results from the mixed-
modelling statistics for the joint angles at ball release, the radius of wrist trajectory, wrist
displacement velocity and movement time will be reported. Subsequently, the results from the
performance measure, temporal joint lag, and joint lag variation will be described. Finally, a
description of angle-angle plot of the movement is provided.
Mixed-modelling of ball release data
F-Tests for joint angles
Table 3-1 shows the results of the population F-Tests for the fixed-effects for each
body angle at maximum wrist height obtained from the mixed-model analysis. For the right
elbow a significant quadratic effect of distance could be identified. The model estimated a
coefficient for β2 with 0.1, which indicated a significant trend of increasing elbow joint
extension with increasing throwing distance.

59
Table 3-1: Results of significance test for fixed-effects for distance, squared distance and direction. See equation 3.2 for details. * = significant, ** = highly significant
Angle Distance Distance^2 Direction right elbow 0.04 4.30* 9.23 right shoulder 1.89 0.60 1.88 left elbow 3.26 0.00 1.12 left shoulder 0.13 0.51 3.60 right hip 11.14** 11.55** 0.77 right knee 37.00** 8.66** 0.10 right ankle 3.98 0.32 0.47 left hip 38.04** 1.16 0.04 left knee 0.15 1.82 2.15 left ankle 1.57 0.85 0.08
For the right hip joint angle, significant effects for the linear and quadratic term could
be identified with β1 = 0.44 and β2 = -0.16, resulting in greater values with increasing distance
(i.e., greater hip flexion). In contrasts, for the right knee joint the estimated coefficient (β1 = -
0.54, β2 = 0.25) resulted in greater extension angles with increasing throwing distance.
Similar, the left hip joint angle demonstrated a significant positive linear trend only (β1 =
0.38) which indicated that the participants used greater extension angles with increasing
shooting distance. All remaining angles failed to show significant main effects for the
population. In summary, the mixed-effect procedure identified common trends for the right
elbow, the right and left hip and the right knee.
Standard deviation of intercept, slope, and slope^2
Table 3-2 : Estimated standard deviations for model parameter. Participant intercept = σs, participant by distance = σsl, condition by distance within participants = σcd, residual = σ. Angle participant
intercept participant by distance
condition by distance within participant
Residual
right elbow 5.73 0.86 0.42 2.27 right shoulder 26.88 1.73 0.53 3.02 left elbow 29.75 3.45 0.77 10.97 left shoulder 26.99 3.81 0.59 8.60 right hip 20.61 0.73 0.35 3.62 right knee 21.70 NA 0.86 4.48 right ankle 6.22 0.49 0.43 1.82 left hip 7.50 0.14 0.18 1.86 left knee 6.21 0.41 0.27 1.26 left ankle 16.49 0.82 0.36 1.16
Table 3-2 shows the estimated standard deviations of the random effects for the
intercept and the slope for participants, the condition by distance interaction which was nested
within participants, and the remaining residuals obtained from the mixed-model analysis. For
all model fits, the confidence intervals for the intercept and the distance coefficient were
60
bounded well away from zero. All model fits were compared to models without random
effects indicating that the random effects models significantly improved the model fit using
likelihood ratio tests and information criterion values (Akaike Information criterion (AIC) and
Bayesian Information Criterion (BIC), see Pinhéiro and Bates (2000), page 10 for details). For
the right knee the model fit indicated a very small value for right knee close to the parameter
boundary of zero. Hence, the effect was neglected and likelihood-ratio comparison showed no
significant differences which indicated that the simpler model fitted the model equally well.
With regards to standard deviation comparisons, only the participant intercepts and the
residuals could be compared directly because they share common units. The former reflected
the mean angles across trials used by each participant, whereas the latter indicated the
deviations from the model which were also calculated in angles units. Comparison of the
participant intercepts and the residual errors showed that in all cases the inter-individual
difference was greater compared to the residual variance. In particular, the right shoulder, left
arm complex and right hip and right knee showed extremely high inter-individual variances
(population standard deviations of > 26°) which suggested that the four participants showed
considerable variation in body postures at ball release. Relatively low inter-individual
variations was found in the left hip and knee, the right ankle and the right elbow, however
(population standard deviation of < 10°). Investigation of the residuals exhibited similar levels
between the different angles except for the right elbow and the left shoulder which showed
that the highest errors were almost two-times greater in magnitude compared to the next
smaller value.
Except for the right hip and knee variation in slopes was greater between participants
compared to the variation within participants between conditions. The standard deviations for
the left elbow and the left shoulder showed the highest scores (> 3) indicating the adaptation
strategies between participants showed high inter-individual variation. In contrast, for the left
leg, especially hip and knee joints, the variations were only minimal (< 0.5) signalling a
common trend between participants. The right knee showed the highest inter-individual
variation between conditions which was partly due to the missing estimate for the between-
participant slope since some of the variations was contained within the between-condition
variation. Again, the left leg showed the lowest values with greater variation between
condition for the upper segments.

61
Individual model coefficients
Using the mixed-modelling approach the best linear unbiased predictors (BLUP) of
the individual random coefficients can be obtained which described the intra-individual
progression. These were used in order to investigate the intra-individual variation for those
angle kinematics which showed no significant fixed-effects for linear and quadratic distance.
Through this approach, the inter-individual differences could be investigated in more detail
and an assessment was possible whether the non-significant main effects were partly a result
of contrary strategies used by participant or genuinely small effects.
Right shoulder
Slope coeff icient
-2 -1 0 1 2
JA
DA
MA
PA
Left elbow
Slope coeff icient
-6 -4 -2 0
Left shoulder
Slope coefficient
-6 -4 -2 0 2
JA
DA
MA
PA
Right ankle
Slope coeff icient
-1.0 -0.5 0.0 0.5
JA
DA
MA
PA
Left knee
Slope coeff icient
-0.4 0.0 0.2 0.4 0.6
DEFNO.DEF
Left ankle
Slope coefficient
-2.0 -1.0 0.0
JA
DA
MA
PA
Figure 3-1: Best linear unbiased estimates of individual random coefficients for each participant for the right shoulder, left elbow, left shoulder, right ankle, left knee, left ankle.

62
A striking feature of the individual plots in Figure 3-1 was the range of different
adaptations across angles and within angles. For the right shoulder participant PA showed the
exact opposite trend compared to the remaining participants who appeared to use very similar
strategies. In contrast, for the left elbow, participants MA and DA both showed decreasing
angles with distance whereas JA and PA showed only minor changes with distance. For the
left shoulder all four participant show different adaptations from each other. Whereas PA held
the shoulder angle more or less constant, DA increased the angle with distance where MA
decreased it slightly. This mixed approach contrasted with the pattern of JA who exhibited
much smaller shoulder angles with increasing distance. For the right ankle, participants PA
and MA showed opposite signs between conditions but were mirror-inverted between
participants. The left knee showed in general relatively small adaptations with distance, as
indicated by the small magnitudes of slope coefficients, but nevertheless showed variations
between participants in the direction and for PA also between conditions. Similarly, changes
in the left ankle were relatively small except in participant PA, who showed coefficient
correlations which were twice as high in magnitude compared to the remaining participants.
Variation in estimated inter- participant residual variances
Table 3-3 : Estimated heteroscedasticity parameters for each participant compared to the residual variance of participant JA and the Ratio between the maximum and the minimum estimate.
JA DA MA PA Ratio right elbow 1.00 1.24 1.55 1.47 1.55 right shoulder 1.00 1.09 0.99 1.18 1.18 left elbow 1.00 0.98 1.19 0.71 1.67 left shoulder 1.00 1.14 1.02 0.59 1.92 right hip 1.00 1.13 1.59 0.87 1.83 right knee 1.00 1.12 1.45 1.32 1.45 right ankle 1.00 1.25 2.34 1.44 2.34 left hip 1.00 1.02 1.26 1.24 1.26 left knee 1.00 1.65 1.56 1.49 1.65 left ankle 1.00 1.03 1.29 1.92 1.92
Table 3-3 shows the estimated variance components for each participant for each angle
representing the heteroscedasticity between participants. For all model fits, the necessity of
the heteroscedasticity models was based on visual inspection of the model residuals and
likelihood ratio test between the same model with and without the heteroscedasticity
component which resulted in all cases in significant improvements of model fits indicated by
significant ratio tests. The ratio of the maximum to the minimum estimated variance showed a
similar spread across the angles. However, for the right ankle the highest variance was more
than twice as high as the lowest variance value. In Table 3-4 the rankings of the variance
components are indicated. With regards to the variability of the lower body segments,
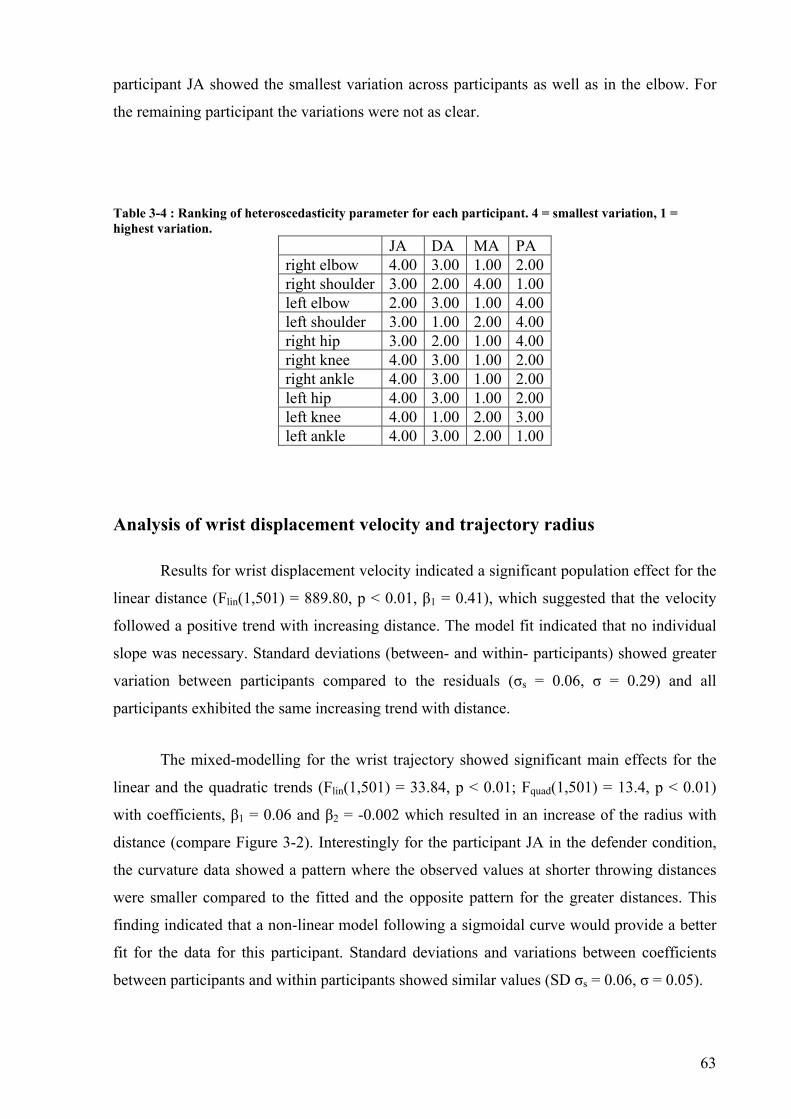
63
participant JA showed the smallest variation across participants as well as in the elbow. For
the remaining participant the variations were not as clear.
Table 3-4 : Ranking of heteroscedasticity parameter for each participant. 4 = smallest variation, 1 = highest variation.
JA DA MA PA right elbow 4.00 3.00 1.00 2.00right shoulder 3.00 2.00 4.00 1.00left elbow 2.00 3.00 1.00 4.00left shoulder 3.00 1.00 2.00 4.00right hip 3.00 2.00 1.00 4.00right knee 4.00 3.00 1.00 2.00right ankle 4.00 3.00 1.00 2.00left hip 4.00 3.00 1.00 2.00left knee 4.00 1.00 2.00 3.00left ankle 4.00 3.00 2.00 1.00
Analysis of wrist displacement velocity and trajectory radius
Results for wrist displacement velocity indicated a significant population effect for the
linear distance (Flin(1,501) = 889.80, p < 0.01, β1 = 0.41), which suggested that the velocity
followed a positive trend with increasing distance. The model fit indicated that no individual
slope was necessary. Standard deviations (between- and within- participants) showed greater
variation between participants compared to the residuals (σs = 0.06, σ = 0.29) and all
participants exhibited the same increasing trend with distance.
The mixed-modelling for the wrist trajectory showed significant main effects for the
linear and the quadratic trends (Flin(1,501) = 33.84, p < 0.01; Fquad(1,501) = 13.4, p < 0.01)
with coefficients, β1 = 0.06 and β2 = -0.002 which resulted in an increase of the radius with
distance (compare Figure 3-2). Interestingly for the participant JA in the defender condition,
the curvature data showed a pattern where the observed values at shorter throwing distances
were smaller compared to the fitted and the opposite pattern for the greater distances. This
finding indicated that a non-linear model following a sigmoidal curve would provide a better
fit for the data for this participant. Standard deviations and variations between coefficients
between participants and within participants showed similar values (SD σs = 0.06, σ = 0.05).

64
Distance(m)
Rad
ius(
m)
0.6
0.8
1.0
1.2
2 3 4 5 6 7 8 9
JA/Defender JA/No defender
2 3 4 5 6 7 8 9
DA/Defender DA/No defender
MA/Defender
2 3 4 5 6 7 8 9
MA/No defender PA/Defender
2 3 4 5 6 7 8 9
0.6
0.8
1.0
1.2PA/No defender
Figure 3-2: Estimates of wrist trajectory radii for each participants for each condition with superimposed model fit.
Movement time
Mixed-effects analysis of the movement time indicated no significant effects or
interactions for distance and condition. Between- participants differences in mean movement
time showed a standard deviation of σs = 2ms and total mean movement time was at 30ms (±4
SD).
Performance scores
In Figure 3-3 the performance scores for the four participants are shown.

65
2 3 4 5 6 7 8 90
0.5
1
1.5
2
2.5
3
3.5
Distance (m)
Per
form
ance
JA
2 3 4 5 6 7 8 90
0.5
1
1.5
2
2.5
3
3.5
Distance (m)
Per
form
ance
DA
2 3 4 5 6 7 8 90
0.5
1
1.5
2
2.5
3
3.5
Distance (m)
Per
form
ance
MA
2 3 4 5 6 7 8 90
0.5
1
1.5
2
2.5
3
3.5
Distance (m)
Per
form
ance
PA
no defenderdefender
Figure 3-3: Individual mean performance scores for each throwing distance for each condition with standard deviations.
In general, the expected trend was found for decreasing performance with increasing
distance. Friedman Rank-Sum tests indicated a marginally significant effect for distance when
averaged over participant and distances and blocking for condition χ27 = 13.41, p < 0.07.
Further, the distance effect was significant when averaging over conditions and blocking for
participants χ27 = 16.15, p < 0.03. The random participant comparisons showed only a
marginally significant effect when averaging over conditions and blocking for distance χ23 =
6.65, p < 0.09. No significant effects for condition were observed.
Temporal joint lag
Residual plots of the mixed-modelling for the lag data indicated some serious
deviation from normality. Therefore, a factorial generalized least square model was used
instead where the distance was treated as a qualitative factor like in a traditional ANOVA
framework as opposed to a continuous covariate. In order to accommodate for the high serial
correlation and heteroscedasticity of the data, the covariance matrix was chosen such that a
lag-1 autocorrelation structure and separate variance estimates for each participant, similar to
the mixed-effects model introduced earlier (for details see Pinheiro and Bates, 2000), were
estimated. Accordingly only population effects are presented in this analysis.

66
Distance(m)
Wris
t Lag
(ms)
20406080
2 3 4 5 6 7 8 9
No defender
2 3 4 5 6 7 8 9
Defender
JA DA MA PA
Distance(m)
Elb
ow L
ag(m
s)
-50
0
50
2 3 4 5 6 7 8 9
No defender
2 3 4 5 6 7 8 9
Defender
Distance(m)S
houl
der L
ag(m
s)
-40
-20
0
20
2 3 4 5 6 7 8 9
No defender
2 3 4 5 6 7 8 9
Defender
Distance(m)
Hip
Lag
(ms)
-10
0
10
2 3 4 5 6 7 8 9
No defender
2 3 4 5 6 7 8 9
Defender
Distance(m)
Kne
e La
g(m
s)
-150
-100
-50
2 3 4 5 6 7 8 9
No defender
2 3 4 5 6 7 8 9
Defender
(a)
(b) (c)
(d) (e)
Figure 3-4: Individual mean joint lags at each throwing distance for each condition for (a) wrist lag, (b) elbow lag, (d) shoulder lag, (d) knee lag, (e) hip lag. (■) JA, (●) DA, (▲) MA, (♦) PA
In Figure 3-4 the mean wrist lag for the four participants can be observed. Whereas
participants DA, MA and PA exhibited similar trends with minor changes over distance and
between conditions, participant JA demonstrated a greater lag for smaller distances. The
analysis demonstrated a significant main effect for condition F(1,505)=9.54, p < 0.01 and a
distance by condition interaction F(7,505) = 2.29, p < 0.05. All four participants exhibited
positive wrist lag values indicating that the maximum velocity of the elbow occurred before
the instance of maximum velocity of the wrist, supporting the kinetic chain principle
(Kreighbaum and Barthels, 1996). The mean elbow lag in Figure 3-4 showed similar trends
for all participants except for participant JA. For the smaller distances, participant JA
exhibited a negative lag which switched to positive values at 4m distance. Hence, for the
smaller distance participant JA did not depend on a summation of the segment velocities in
order to satisfy the distance constraint. No significant effects of elbow lag were observed.
Mean shoulder lag values were differentially distributed for the four participants. Participant
PA showed a negative shoulder lag for all distances, whereas participant DA started with a

67
negative lag and increased the positive lag values for greater distances. Participant MA
exhibited positive lag values for almost all trials, whereas participant JA started with positive
values which decreased to negative values during the no-defender condition, showing a
similar trend during the ‘defender-condition’ (F(1,495)=12.68, p < 0.07, and condition
F(1,495)=2.75). For hip lag, a significant effect for distance F(1,495)=9.61, p < 0.01, was
reported. Post-hoc analysis indicated a significant difference between 9m and 2m distance
with an estimated difference of 0.65 indicating that the lag became more positive with
increasing distance. Values for all participants were mainly positive. Knee lag showed a
different trend compared to the other plots where the instant of maximum velocity for the
ankle always occurred after the maximum knee angle velocity for all four participants. No
significant effects were recorded.

68
Joint lag variation
Distance(m)W
rist L
ag(m
s)
0246
2 3 4 5 6 7 8 9
No defender
2 3 4 5 6 7 8 9
Defender
JA DA MA PA
Distance(m)
Elb
ow L
ag(m
s)
-4
-2
0
2
4
2 3 4 5 6 7 8 9
No defender
2 3 4 5 6 7 8 9
Defender
Distance(m)
Sho
ulde
r Lag
(ms)
-5
0
5
2 3 4 5 6 7 8 9
No defender
2 3 4 5 6 7 8 9
Defender
Distance(m)
Hip
Lag
(ms)
-5
0
5
10
2 3 4 5 6 7 8 9
No defender
2 3 4 5 6 7 8 9
Defender
Distance(m)
Kne
e La
g(m
s)
-4-3-2-101
2 3 4 5 6 7 8 9
No defender
2 3 4 5 6 7 8 9
Defender
(a)
(b) (c)
(d) (e)
Figure 3-5: Joint lag coefficient of variation for each participant for each throwing distance for both condition. (a) wrist lag, (b) elbow lag, (c) shoulder lag, (d) knee lag, (e) hip lag. (■) JA, (●) DA, (▲) MA, (♦) PA
Figure 3-5 shows the coefficient of variation (CV) for different joint lags for each
participant. Absolute values were overall very low. Especially Wrist, Elbow, and Knee CV
indicated very high stability of lag sequencing in these segments. For Knee CV there was an
apparent outlier for 8m during the ‘no-defender’ condition caused by two trials where
participant PA did not perform a jump, turning only on the left foot whilst shooting. Highest
variability can be observed in the Hip CV and Shoulder CV mainly from participants PA and
MA indicating some instability in lag coordination between the upper and lower body
segments and between the arm and the trunk. No differences between the conditions were
apparent from the plots and for the remaining joints no clear differences between participants
were noted.

69
Angle-angle plots
0
50
100
1500 50 100 150 0 50 100 150
0
50
100
150
0
50
100
150
0 50 100 150 0 50 100 1500
50
100
150
2-3m 4-5m 6-7m 8-9m
Right elbow joint angles (°)
PA
MA
DA
JA
Righ
t sho
ulde
r joi
nt a
ngle
s(°)
defender no defender
Figure 3-6 : Angle-angle plot of right shoulder and right elbow joint kinematics for each participant (horizontal) grouped for 2-3m, 4-5m, 6-7m, and 8-9m (vertical).
Figure 3-6 shows the angle-angle plots of the right shoulder and the right elbow for the
participants where each row represents a single participant. There were clear qualitative
differences in elbow and shoulder joint coordination between participants. For participant JA
two movement patterns based on the range of motion of the shoulder could be identified. One
pattern was prominent at smaller distance values (less than 6m), whilst the other was used at
greater distances. At smaller distances the plots showed a parallel extension of the elbow and
elevation of the shoulder, as indicated by the near diagonal direction of the plots. For the
greater distances, the elbow remained almost completely extended over the whole movement
duration and only a slight flexion at the end of the movement was apparent. Hence, wrist
acceleration was mainly achieved by elevation of the shoulder, whereas for smaller distances,

70
the elbow had a much greater influence. The variability of the plots was greater at smaller
distances, especially at the beginning of the movements. However, at the end of the
movement, the different plots converged into a similar region.
Participant DA showed some changes over distance in the angle-angle plots. At
smaller distances, the movement was initiated with an elevation in the right shoulder joint and
a flexed elbow joint followed by a simultaneous extension of shoulder and elbow joints. For
larger distances, the elbow was slightly more flexed at the beginning and was extended during
the first part of the movement. Subsequently the same parallel movement in the elbow and
shoulder joint as for the smaller distances was adopted. The initial flexion angle of the elbow
was very similar to the angle used by Participant 1 for smaller distances. Both participants JA
and DA exhibited similar ranges of movement in the shoulder joint. However, whereas
participant JA changed to another pattern with increasing distance, participant DA appeared to
adapt an existing pattern, indicating that the coordination pattern for the throwing arm in
participant DA was not affected by the presence of a defender.
Participant MA showed high variability for the two smallest distances at which some
patterns were used in both conditions and which deviated quite strongly from the remaining
trials. The distinction between the trials was mainly due to different ranges of motion in the
elbow joint, which started from a more flexed position (joint angles < 50°). For the remaining
trials, range of motion in the elbow was very limited, and the wrist acceleration seemed to be
solely a result of movement in the shoulder with no differences between the two conditions.
With increasing distance, the starting value for the shoulder angle decreased, indicating a
lower upper arm position at the beginning of the movement. The pattern appeared to be more
similar to the trials by participant JA for the greater distances compared to participant DA.
Participant PA exhibited differences between the conditions which were most
pronounced in the final elbow angle. In the baseline condition the elbow flexed more
compared to the defender condition. This difference decreased with increasing distance. This
participant showed the smallest shoulder angles at the beginning and the end of the movement
compared to other participants. For the largest distances the pattern was somewhat similar to
the pattern exhibited by participant JA.
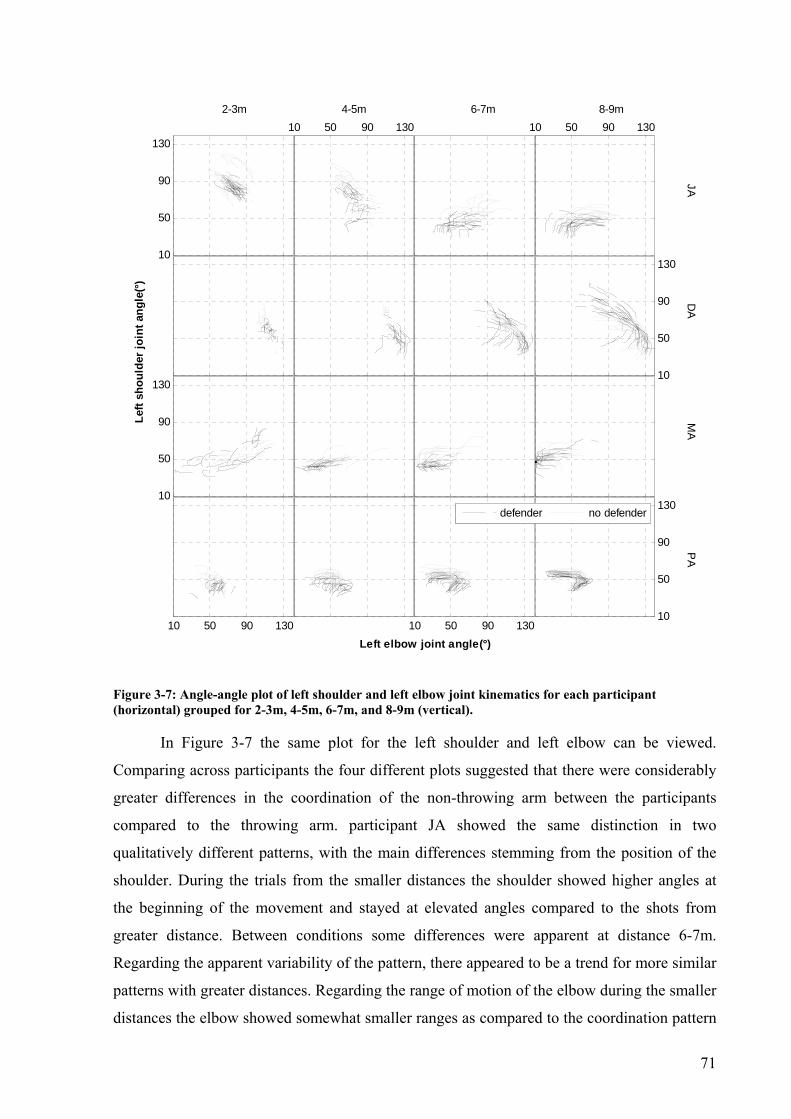
71
10
50
90
13010 50 90 130 10 50 90 130
10
50
90
130
10
50
90
130
10 50 90 130 10 50 90 13010
50
90
130
2-3m 4-5m 6-7m 8-9m
Left elbow joint angle(°)
PA
MA
DA
JA
Left
shou
lder
join
t ang
le(°)
defender no defender
Figure 3-7: Angle-angle plot of left shoulder and left elbow joint kinematics for each participant (horizontal) grouped for 2-3m, 4-5m, 6-7m, and 8-9m (vertical).
In Figure 3-7 the same plot for the left shoulder and left elbow can be viewed.
Comparing across participants the four different plots suggested that there were considerably
greater differences in the coordination of the non-throwing arm between the participants
compared to the throwing arm. participant JA showed the same distinction in two
qualitatively different patterns, with the main differences stemming from the position of the
shoulder. During the trials from the smaller distances the shoulder showed higher angles at
the beginning of the movement and stayed at elevated angles compared to the shots from
greater distance. Between conditions some differences were apparent at distance 6-7m.
Regarding the apparent variability of the pattern, there appeared to be a trend for more similar
patterns with greater distances. Regarding the range of motion of the elbow during the smaller
distances the elbow showed somewhat smaller ranges as compared to the coordination pattern

72
at greater distance indicative of activation of movement degrees of freedom with increasing
distances. For participant DA the alteration of the movement patterns across distance showed
some distinct peculiarities. For distances between 2m and 5m the movements of the left arm
complex were quite constrained and only minimal ranges of motion were visible with slightly
greater magnitudes at 4-5m during the defender condition. However, from 6m onwards the
range increased dramatically with some differences between conditions becoming even more
pronounced during the highest throwing distance together with an increase of movement
range of motion. The elbow joint at the beginning of the movement (bottom right) showed
high angle values indicative of high flexion followed by a joint extension during movement
execution. However, the differences between the conditions seemed to stem mainly from the
position of the shoulder which was smaller during the defender position suggesting a lower
raised arm. Again, a completely different pattern could be observed in participant MA. The
participant mainly varied the flexion angle of the elbow only and held the shoulder relatively
constant during all throws. During the initial distances the pattern showed high fluctuations
and seemed to settle into a more consistent pattern only for the greater distances with some
separation between conditions during distance 6m-7m. Participant PA also showed trends for
greater stability with increasing distance and qualitatively the pattern was again different from
the patterns of the remaining participants. The shoulder exhibited only minor ranges of
motion and the movement mainly stemmed from motion in the elbow joint.
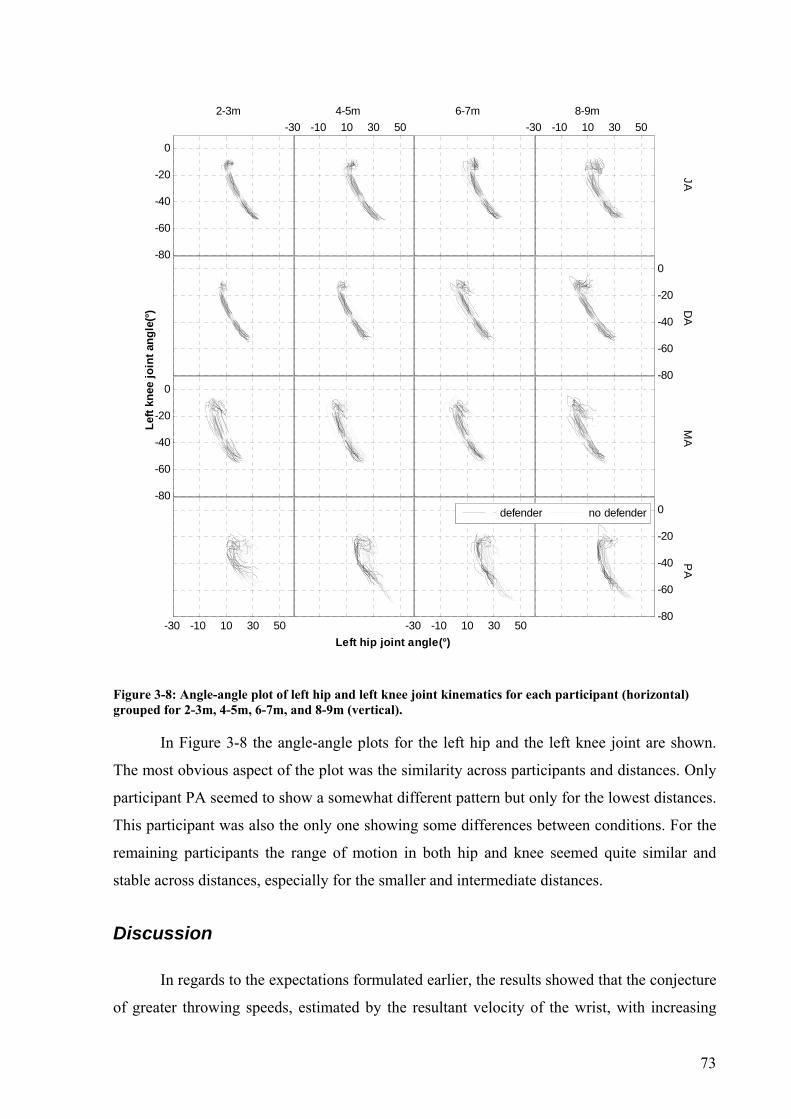
73
-80
-60
-40
-20
0
-30 -10 10 30 50 -30 -10 10 30 50
-80
-60
-40
-20
0
-80
-60
-40
-20
0
-30 -10 10 30 50 -30 -10 10 30 50-80
-60
-40
-20
0
2-3m 4-5m 6-7m 8-9m
Left hip joint angle(°)
PA
MA
DA
JA
Left
knee
join
t ang
le(°)
defender no defender
Figure 3-8: Angle-angle plot of left hip and left knee joint kinematics for each participant (horizontal) grouped for 2-3m, 4-5m, 6-7m, and 8-9m (vertical).
In Figure 3-8 the angle-angle plots for the left hip and the left knee joint are shown.
The most obvious aspect of the plot was the similarity across participants and distances. Only
participant PA seemed to show a somewhat different pattern but only for the lowest distances.
This participant was also the only one showing some differences between conditions. For the
remaining participants the range of motion in both hip and knee seemed quite similar and
stable across distances, especially for the smaller and intermediate distances.
Discussion
In regards to the expectations formulated earlier, the results showed that the conjecture
of greater throwing speeds, estimated by the resultant velocity of the wrist, with increasing
74
throwing distance was correct. The results indicated a strong linear trend for increasing
velocity with increasing distance in all participants. Investigation of joint lag revealed that the
lag showed only marginal changes with increasing distance and only the hip showed a
significant improvement with distance. However, the lag values were in general mostly
positive suggesting that joint lag was inherently better in this movement compared to the
standard throwing pattern investigated by Southard (2002). This was further supported by the
joint lag variability which was also much more consistent compared to the study by Southard
(2002). Particularly, the CV values for wrist lag for all participants were low.
One explanation for the joint lag differences reported in this study and in Southard
(2002) could be the differences in task constraints between the hook shot and the overarm
throw. Being an airborne movement, the hook shot could be viewed as inherently unstable
compared to a standard throwing movement where a support base is present. Therefore, the
margin of error for this unstable movement was arguably smaller and accordingly movement
variability had to be tailored to this restriction. In support of this idea, it is notable that Van
Emmerik and van Wegen (2000) reported in a standing task that postural sway amplitudes
changed depending on the body position. When individuals leaned forward, shifting their
centre of mass closer to the boundary of the support area, the postural sway decreased in
comparison to upright standing. The authors interpreted this finding as an indication that
participants were able to detect the stability boundaries of the task and adapted their body
sway according to this constraint (van Emmerik and van Wegen, 2000). A similar
phenomenon was reported earlier in a ball-juggling task (Sternad, 1998)
The hip and shoulder lags showed the highest variations, indicating some variability in
the coupling between the upper and lower body segments. Participant PA was the only
individual who showed a constant negative lag for the shoulder for all conditions and also the
highest variability in the angle-angle plots for the left leg as well as opposite trends for the
right ankle and the left knee between conditions at ball release. This finding was harmonious
with other research showing effects of skill level on coupling differences between upper and
lower body degrees of freedom with a multi-articular action (Vereijken, Emmerik, Bongaardt,
Beek, and Newell, 1997; Vereijken, van Emmerik, Whiting, and Newell, 1992). In summary,
the trend observed by Southard (1998; , 2002) in the overarm throwing movement was not
present in the basketball hook shot for this population.

75
The results also provided no support for the hypothesis that the radius of the throwing
hand trajectory increased with distance and therefore changed from a curvilinear to a more
rectilinear pattern. Instead, in the hook shot movement the opposite trend was present. Hence,
the results stood also in opposition to the traditional biomechanical accounts of ‘push-like’
and ‘throw-like’ movements (Kreighbaum and Barthels, 1996). In the present study, all
participants tended to use a throw-like movement during the smaller distances and a more
push-like movement when throwing from further away. Similarly, whereas Keighbaum and
Barthels postulated that during the push-like segmental rotations are performed synchronously
in order to generate the rectilinear path, the presented results did not support this hypothesis.
For example, participant DA exhibited clear synchronous movements in shoulder and elbow
joints over all the distances despite altering of the radii. When combining the radius data with
the angle-angle plots, the results did not generally reveal different movement patterns with
different radii as were visible in the uni-manual shoulder-elbow-wrist flexion-extension
movement (Buchanan et al., 1997). However, for participant JA the radii showed some
indication for bimodal behaviour in both angle-angle plots of the upper limbs and the radius
data where freezing movement degrees of freedom in the elbow was accompanied with
changes in the radii.
Regarding the presence of emerging and decaying constraints only participant PA
showed different movement patterns for the right elbow and left hip joint between the two
conditions which diminished at further throwing distances (see Figures 3-8). These findings
might be interpreted according to the skill level of that participant. It is possible that the
presence of a defender provided an unfamiliar context imposing a behavioural constraint. For
a relative novice, the influence of the defender may decrease with increasing distance,
showing how the two constraints interacted with each other. For the smaller distances, the
defender acted as the primary constraint, which subsequently decayed as increasing throwing
distance emerged as the main constraint. For the remaining participants, all of whom had prior
experience of competitive performance in basketball, the defender constraint was less
influential. In this study, it was assumed that all participants used the same movement pattern
as they would in a competitive performance environment. Therein lay a possible explanation
for the lack of strong kinematic differences between conditions, due to the peculiarities of the
hook shot where the actual throwing movement takes place on the opposite side of the
shooter’s body away from the defender. The shooter’s body provides cover from direct
interference of the opponent to the shooting arm and therefore it can be expected that
differences in shooting kinematics with and without a defender should be somewhat smaller

76
than for a standard basketball set-shot. A set-shot often occurs with a defender immediately in
front of the shooter. This notion was supported by previous data showing a lack of a more
upright position of the shooter during the presence of a defender compared to a standard jump
shot (see Rojas et al., 2000). However, movement pattern differences based on skill level have
to be interpreted cautiously because of the single participant design. In summary, the expected
interaction between the task constraints of shooting distance and the presence of a defender
was not shown for experienced basketball players who used similar movement patterns for
defender and no-defender conditions.
Regarding the result of the discrete and continuous kinematic variables both the
mixed-modelling approach and the angle-angle plots suggested strong similarities between
participants in the lower body segment kinematics. Especially the hip segments which
exhibited highly significant effects for both sides (see Figure 3-8). Similarly the variations in
strategies used during ball release showed only minor variations and little inter- participant
variability for the lower limbs. With regards to skill related variability, the measurements of
the lower body supported the hypothesis that the most skilled performer showed the lowest
levels of movement pattern variability. In contrast, measurements for the upper body showed
high variations between participants and high intra-individual variations in the case of the left
elbow as well. The investigation of the individual adaptation strategies in the discrete
measurements further emphasized the different strategies used by the participants. Herein, the
results of the present study for the hook shot vary strongly from results obtained from a
basketball free throw where decreasing variability in linear speeds were found from lower to
upper body segments (Miller, 2002).
The unique action of the hook shot might also be responsible for the decreasing
influence of the elbow joint with increasing distance, putatively different from a standard
basketball jump shot (Miller and Bartlett, 1993). In the present case, except for participant
DA, all other participants used an extended elbow movement pattern and accordingly the
acceleration of the wrist was mainly provided by shoulder movements. Hence, some
precautions have to be executed when transferring results obtained from a standard basketball
shot to a basketball hook shot.
Regarding variations observed in the angle-angle plots, the difference between the four
participants highlighted the importance of intra-individual analysis methods and process-
orientated analysis measurements, where this effect could have been masked when relying on

77
discrete measurements only (Schöllhorn, Nigg, Stefanshyn, and Liu, 2002). Due to the
different experience and skill levels of the participants, differences in movement pattern
adaptations were expected. Yet the range of different solutions to the given motor problem
was striking, illustrating the role of degeneracy in neurobiological systems and consequent
effects on the indeterminacy of goal-directed movement patterns (see Edelman & Gally, 2001;
Chow et al., in press; Davids et al., 2006; Hong & Newell, 2005; Liu, Mayer-Kress & Newell,
2006).
The distinct coordination patterns adopted between participants illustrated how the
same functionality, although with varying success, could be achieved by different
arrangements of neuro-mechanical structures (Edelman and Gally, 2001). The hook shot was
performed either with synchronous flexions of the elbow or by movement of only the
shoulder which in turn could be combined with different movements in the non-throwing arm.
In case of the skilled participant, two completely different patterns were present clearly
indicating degenerate functioning. Such distinct changes in movement patterning were not
apparent for participant DA at least for the throwing arm, but did surface in the non-throwing
arm. Furthermore this characteristic could be also observed in participants MA and PA. It is
possible that these participants tried to maintain constant movement patterning in the
throwing arm and used the non-throwing arm as a sort of damping mechanism in order to
accommodate for perturbations like increasing throwing distance. By investigating only the
throwing arm, one could mistakenly conclude that the movement stayed relatively constant
over distance and conditions. In contrast, a different conclusion could be made based on the
coordination of the non-throwing arm as well. This observation ties in with Bernstein’s (1967)
notion of morphological structures where perturbations to the movement can lead to
alterations far from the actual source, in this case stemming from the increasing force
requirements in the throwing arm.
Focussing on the behaviour of the throwing arm for participants DA, MA, and PA, the
changes in movement patterning seemed to be gradually scaled as opposed to the sudden,
qualitative reorganization of participant JA. From a dynamical systems theoretical viewpoint,
this kind of behaviour was not suggestive of transitions between distinct attractors. Instead the
movement adaptation can be interpreted as a change of an existing attractor layout in order to
accommodate the necessary changes in constraints. These data are consistent with findings
reported by Kostrubiec and Zanone (2002) who showed transient changes in attractors in a
learning study using a wrist supination-pronation task. In their work, an existing attractor was

78
transiently shifted towards a ‘to-be-learned’ pattern in order to accommodate environmental
constraints. However, without investigating time scale behaviour in the present study, this
interpretation of movement patterning as adapting an existing attractor layout remains
speculative (see Liu, Mayer-Kress & Newell, 2006).
Conclusion
In conclusion, participants adapted their movement strategies to the emerging distance
constraints, and only for the novice did the secondary constraint of the defender impact on
movement patterning. Based on the individual routes of change taken by each participant, the
task constraints seemed to interact with their intrinsic dynamics (individual abilities). And the
behavioural information intrinsic to the task was differentially used. Whereas participants DA,
MA, and PA sought to stabilize a specific pattern to achieve the task outcome, participant JA
was able to switch between completely different patterns. Based on these findings and those
of Southard (2002), throwing distance was postulated as an important control parameter for
the organisation of discrete over arm throwing actions such as the hook shot.
The presented study demonstrated the value of the basketball hook shot as a potential
movement model to investigate the application of dynamical systems theory to the study of
coordination in a degenerate, discrete multi-articular action. All four participants showed
adaptations in movement kinematics due to the alterations of throwing distance. Participant
JA showed some peculiarities in the movement kinematics in the upper body segments which
were potentially indicative of order parameter behaviour. For the remaining participants, main
differences between conditions could be observed in the non-throwing arm. In general, the
findings confirmed the necessity for intra-individual analyses of coordination data and a
greater future focus on process-orientated approaches. The relatively minor differences
between conditions indicated that the secondary constraint of the defender could be dropped
from further investigations.
Regarding potential investigations of time scales in the basketball hook shot the
movement time observed indicated that it would not be possible to investigate the relaxation
of the movement after a perturbation within a single trial since the observed movement times
would not provide participants with enough time to alter movement execution. Hence, time
scale behaviour can only be investigated using the between-trials approach proposed by
Schöner (1990).

79
4 Chapter Four: Analyzing discrete multi-articular actions
The preceding chapter showed that the basketball hook shot resembles a potential
movement model that is well suited to the investigation of a degenerate, discrete multi-
articular action from a dynamical systems theoretical perspective. However, the analysis
methods used in Chapter 3 did not allow to determine a candidate order parameter for the
basketball hook shot. Hence, alternative analytical tools which take the coordination of the
whole body into account are needed to enable the analysis of phase transitions in discrete,
multi-articular actions. In this chapter several available candidate tools will be assessed. In
order to enable systematic comparison the required properties for a suitable method will be
derived first.
Prerequisites for a measurement tool
Typically in studies of movement coordination from a dynamical systems theoretical
perspective order parameter behaviour has been established using measurements of the
movement kinematics. In studies of bimanual coordination, for example, the derived
kinematics are usually transformed into phase angles and the relative phase is used to describe
the coordination of the involved segments (e.g. Carson et al., 2000). The underlying
assumption in this approach is that the derived measurements are closely related to the order
parameter dynamics of the system. Based on these measurements, differences between
movement patterns (or the respective order parameters) are inferred. Accordingly, the first
prerequisite for an analysis tool is the ability to distinguish between movement patterns on a
global scale allowing the categorisation of separate movement patterns into distinct groups.
The distinction between movement patterns in cyclical movement models has been
mainly derived from changes in the temporal arrangement of the moving segments and/or
changes in range of motions (Buchanan et al., 1997; Haken et al., 1985). Hence, a tool
suitable for discrete, multi-articular actions should be able to pick up variations in movement
patterning along these lines incorporating information from all involved moving segments.
However, the mere derivation of distinct changes between different movement patterns does
not suffice by itself to establish phase transitions behaviour. Based on derivations presented
earlier in regards to attractor time scale behaviour, transitions should be accompanied by
several characteristic events. Therefore, it follows that an analysis tool should also provide

80
information about the time scales of the movement. Hence, the following hallmark features of
phase transitions should be identifiable: (i) critical fluctuations, (ii) critical slowing down, and
(iii) hysteresis. Further, with regards to the discrete nature of the proposed movement model
it seems necessary that no assumption about the periodicity of input signals should be made.
Existing analysis methods
Relative phase
The most widely applied measurement tool in studies from a dynamical systems
perspective is discrete relative phase (DRP). DRP describes the phasing of two oscillators in
relation to each other (Hamill, Haddad, and McDermott, 2000) by measuring the succession
of three time points: two subsequent instances of time of peak of a reference signal (t1, T) and
the time of peak of the second signal (t2) in between the two events.
1 2t tT−
Φ = (4.1)
Hence, DRP does not provide any information about the amplitude of the signal and
its use is confined to periodic movement models. Therefore DRP cannot account for discrete
movement models which makes it unsuitable for the proposed movement model.
An extension of discrete relative phase is the continuous relative phase (CRP), which
measures the continuous deviation in phase space between two segments.
1 2( ) ( ) ( )CRP t t t= Φ −Φ (4.2)
The phase angle is calculated from:
arctan ωϕ
⎛ ⎞Θ = ⎜ ⎟
⎝ ⎠ (4.3)
The CRP is also confined to use with sinusoidal signals. As Peters, Haddad, Heiderscheid,
van Emmerik and Hammill (2003) showed using simulated non-sinusoidal signals, the results
can be highly misleading and do not represent the actual coordination pattern inferred.

81
Both DRP and CRP measures also suffer from the limitation that only two segments
and their relative motion can be investigated at the same time which makes their application
to multi-articular movements in general questionable (Corder, Levin, Li, and Swinnen, 2005).
On this basis the relative phase measurements do not qualify for application to the proposed
movement model.
Principal Component Analysis
Recently, principal component analysis (PCA) has been proposed as a measurement
tool suitable for investigating movements with multiple biomechanical degrees of freedom.
Analytically, the extraction of principal components is based on the estimation of the
eigenvalues of the sample correlation matrix between the different input dimensions. A set of
principal axes can be obtained which represent orthogonal components of the variation in the
data and which are ordered according to the magnitude of the according variation (Stuart,
1982). This procedure yields a compressed representation of the input space where
redundancies can be filtered out. The correlation is based on the linear model assumption and
accordingly PCA extracts only the linear dependencies between input signals.
Post, Daffertshofer and Beek (2000a) investigated cascade ball juggling during self-
paced and fast-paced trials using a PCA approach. Based on their modelling approach of the
three balls’ flight paths four dimensions were deemed sufficient to model the behaviour of the
system. The subsequent application of PCA analysis to the ball kinematics corroborated this
a-priori modelling. Comparing fast and self-paced juggling, a switch from four to two main
components from the former to the latter condition indicated how PCA analysis was able to
extract important information about movement organization regarding dimensionality. The
authors stressed the importance of studying time series and the spatiotemporal variability
which assists in identification of the most significant events during movement execution
without biasing measurement a-priori in contrast to traditional discrete measurements (Post et
al., 2000a).
PCA was also applied in the study of Chen, Liu, Mayer-Kress and Newell (2005)
introduced earlier. The pedalo-cycling movement was recorded using 3D displacement data of
joints of the whole body resulting in a 45-dimensional input space. Three to six components
extracted by PCA were sufficient for describing 95% of the variance in the data. The first
component accounted for more than half of the variance and its influence increased over the
training period. The loading of the components varied between participants.

82
Corder, Levin, Li and Swinnen (2005) investigated the application of PCA to
rhythmical parallel flexion-extension movements of elbows and wrists. The authors calculated
the relative phase between the different segments and processed the resulting data with PCA.
The identified movement patterning based on PCA matched the a-priori known differences in
coordination patterning. e.g. when all four segments were used in an in-phase manner a single
principle component was sufficient in order to capture data dynamics. This finding lead the
authors to conclude that the PCA approach provides valid results. Investigating the limitation
of PCA the authors noted that for actions where movements other than strict in-phase-anti
phase patterns are prescribed, the resulting principal components structure will be more
complex and accordingly more difficult to analyse. Further, when the input signals do not
approximate sinusoidal signals the principal components will contain some additional noise
components which will complicate the analysis (Corder et al., 2005).
Therefore, it comes as no surprise that the application of PCA has been mostly
confined to rhythmical movement models. Even in a publication serving as a tutorial for the
application of PCA (Daffertshofer, Lamoth, Meijer, and Beek, 2004) sinusoidal signals are
used to demonstrate the feasibility in a simulation study and an investigation into walking on
a treadmill. One exception was a study conducted by Hodges, Hays, Horn and Williams
(2005) who investigated skill acquisition of a soccer chipping task. Using lower limb
kinematics as input variables the results indicated no changes in the number of extracted
dimensions from the PCA. These preliminary findings do not lend strong support to the
suitability of PCA with discrete multi-articular actions.
Moreover, since non-linear system behaviour on a global and local scale forms the
building blocks of the dynamical system theoretical perspective, it seems highly questionable
whether PCA represents a suitable measurement tool for analysing movement. Attempting to
address this limitation, Balasubramaniam and Turvey (2004) investigated coordination in hula
hooping using a non-linear variant of traditional PCA. Instead of the correlation matrix, the
authors used the mutual information between input signals to uncover redundancies in input
space (Steuer, Kurths, Daub, Weise, and Selbig, 2002). Movements represented by 3D
kinematics of the lower limbs joint positions served as input signals. By using the mutual
information the authors hoped to protect against non-linearities and non-stationarities
occurring in the input signals (Balasubramaniam and Turvey, 2004, p.180). However,
estimation of the mutual information itself is not easily accomplished (Steuer et al., 2002) and
Balasubramanaiam and Turvey (2004) provided no guidelines about how parameters were

83
fitted to the model. Further, it can be argued that the chosen task resembled a highly
constrained rhythmical task where high correlation between the different segments can be
expected and it seems unlikely that a ballistic throwing movement would exhibit similar
underlying relationships between movement components.
In regards to the criteria formulated earlier, PCA per-se does not identify attractors but
serves primarily as a compression device. Simply recognising that two movements can be
represented by a number of dimensions does not provide information about whether they are
the same or whether there are fundamentally different. In order to identify commonalities or
differences between movement, the projected signals in the compressed space still have to be
investigated. Hence, with PCA the problem of identifying different movement patterns is only
delayed, not solved, although admittedly, a compressed representation of differences between
movements might make this problem somewhat easier.
In conclusion, the application of PCA aims at identifying the number of degrees of
freedom in a given dataset (Chen et al., 2005) which does not necessarily provide information
about phase transitions between different coordination patterns. Without the information
about the attractor dynamics time scale behaviour cannot be investigated. PCA in itself does
not satisfy the necessary criteria derived earlier.
Self-organizing maps
Acknowledgement of the non-linear relationship between input variables in motor
control research has lead to investigations using unsupervised artificial neural network
modelling. Due to the inherent properties of neural networks this class of analysis method can
accommodate for non-linearity in input data and may be suitable for studies in motor control
(Perl, 2004; Schöllhorn, 2004). Several authors have used varying approaches involving the
application of self-organizing maps (SOMs). Similar to PCA, application of SOMs results in a
compressed representation of an input space in which relationships between input dimensions
are preserved (Kohonen, 1990).
Barton (1999) applied a SOM to classify different walking patterns using a two-stage
approach. During the first stage, a 2D-SOM (15x10 nodes) was trained with the joint angle
kinematics of the pelvis, hip, knee, and ankle yielding a compressed representation of the
movement. Subsequently, a second smaller SOM (5x3) was trained with the representation
from the first SOM in order to obtain a low dimensional identification of different walking
84
patterns. The time-series nature of the data was preserved by presenting each time-slice at
time t together with the slices at t+1 and t+2. Applying the approach to gait data from a
clinical population the results showed that patients with similar conditions were mapped onto
similar regions in the second SOM which was regarded in support for the analysis approach.
A recent application of this method by Barton, Lees, Lisboa and Attfield (2006) to the
study of gait patterns used only one SOM (15x10). Using data from the Derby gait and
movement laboratory database 3D displacement, moment, and power measures were
obtained. Although the data stemmed from different domains the authors argued against
normalizing input angles using z-scores (mean of zero and variance equal 1) based on the fact
that offset information between angles would be lost. Further, for different participants
different ranges can be observed which would be cancelled out by formulation of the z-scores
(Barton et al., 2006). Therefore, a simple range normalization was applied to each input
signal. To accommodate for the time-series property of the signals, the authors formed an
augmented input vector which contained the current time frame plus input vectors which
followed 5% and 10% after the current frame. Based on this approach the authors were able to
qualitatively identify differences between normal and pathological gait patterns.
Bauer and Schöllhorn (1997) used SOM to investigate different movement patterns in
a discus throw. Fifty three throws from two discus throwers were collected over a period of
one year. Using 3D motion capture, joint angle displacement and velocity curves were
obtained and time-normalized to 51 points. These data served as the training set for a SOM
(11x11). The authors determined the necessary number of nodes based on a criterion which
measured the neighbouring preservation between input and output space. Accordingly, trials
which are close to each other in input space should be grouped closer together in output space.
By recording the activation of the nodes based on the actual times series an activation
sequence of map nodes was obtained. The input space data was normalized using z-scores
which provided better results according to the authors compared to no normalization and pre-
processing using PCA. Based on this representation differences between trials were
established by imposing a metric on the 2D topology of the node grid. Differences were
calculated using the Euclidean distances between active nodes yielding a distance matrix for
all trials. This distance matrix was subsequently entered into a clustering analysis which
determined groupings in the trial difference structure. The results indicated a learning effect
for one of the participants and that trials within sessions were more similar than trials between
sessions.

85
Another application to gait by one of the authors using the same approach
demonstrated a better identification rate of the SOM using time-continuous measurements
compared to traditional discrete data analysis (Schmidt, Schöllhorn, and Bauer, 1997;
Schöllhorn, Stefanyshyn, Nigg, and Liu, 1999).
Analytically, self-organizing maps are based on a so-called winner-take-it-all
algorithm (Kohonen, 2001). Following an iterative training procedure at each step the current
input vector is compared with the current weights of the nodes and the node which is closest
based on a specified metric is the winning node. Subsequently, the weights of the winning
node and nodes in its immediate proximity are adjusted closer to the current input vector until
convergence of the map is reached. Since the output space usually is of much lower
dimension compared to the input space this procedure results in a compression of the data.
Based on the properties of the SOMs the topology of the input space together with non-linear
relationships between the different input spaces is preserved (Kohonen, 1990; Kohonen,
2001).
Although the SOM technique seems promising some significant problems accompany
this approach. The validity and representativeness of the results obtained from SOM
modelling obviously depends on the properties of the input space. For example, in a
simulation study comparing SOM, PCA, and several other measures it could be shown that
especially with high-dimensional data, the results from SOM can be misleading (Bezdek and
Pal, 1995). More importantly the results obtained from the SOM procedure are highly
dependent on the chosen architecture of the map. Whereas Bauer and Schöllhorn (1997)
investigated different map dimensions holding the number of nodes constant, the other studies
discussed failed to do so. Accordingly, it is difficult to interpret whether the results were
unrepresentative of the data and just a result of the specific architecture chosen.
Further, the SOM by itself does not accommodate for time-series structure of the data.
Only in the recent application by Barton et al.(2006) a potential solution has been provided
(i.e., the embedding of the input vectors was based on a dynamical embedding procedure).
Unfortunately, it still seems likely that this embedding structure is highly dependent on the
chosen task and its proper estimation is far from being a trivial task by itself (compare Kay,
1988). Hence, two architectural problems regarding the embedding of the input space and the
embedding of the output have to be solved before further application of SOM appears
feasible.

86
Finally, SOMs by themselves are not the solution to the problem of grouping
movement patterns but merely serve a similar purpose as PCA does. Whereas most studies
analyse the maps qualitatively, the study by Bauer and Schöllhorn (1997) used a cluster
analysis in order to group objects. However in using cluster analysis the authors must have
assumed an Euclidean metric in node space. This assumption is questionable since the actual
node space only identifies which nodes represent neighbouring objects, not necessarily how
similar there weights are. Since the grid space can be intricately folded the assumption of an
Euclidean metric can be highly misleading which unfortunately has not been investigated in
the literature.
In conclusion, SOMs provide some promising features, potentially supporting their
application as a valuable analysis tool for human movement studies in the future. However at
present several methodological questions require further investigation before SOMs can be
seen as a feasible analysis tool. Since, these problems were beyond the scope of the current
programme of work, the feasibility of SOMs was no longer pursued.
Root mean square approaches
One of the more traditional approaches comparing the analysis of movement patterns
based on time continuous data is the root-mean-squared-error (RMSE) criterion (Magill,
1989). In its simplest formulation the deviations between two curves (e.g. a trial pathway and
a criterion pathway) at successive time points of a trial pathway are calculated, squared,
summed, and the square root is taken from the resulting deviation score. Basically, the
procedure calculates the Euclidean distance between two vectors in n where n refers to the
number of time points of the two curves.
( ), ,1
n
trial i criterion ii
RMSE x x=
= −∑ (4.4)
A condition inherent to this approach comprises that both curves must have the same number
of time points otherwise a comparison is not possible.
Sidaway, Heise and Zohdi (1995) developed an extension of this approach to estimate
the variability in coordination between two joint angles which can be obtained from angle-

87
angle plots. The procedure was called Normalized-Root-Mean-Square (NoRMS) method and
measures the deviation of a group of trials from a mean trial. The desired angle kinematics of
two angles are time normalized in order to obtain the same number of time slices for each
trial. The underlying assumption therefore is that movements are scaled in a similar fashion
and the relative placement of key events does not change between trials. Based on the time-
normalized representation of the group of trials, a mean trial is calculated and subsequently
the deviation from the mean trial for each trial using the RMSE for each angle is calculated
(similar to the standard deviation in univariate statistics). Two variation scores per trial are
obtained which are again squared, summed and the square root yields a single score which
describes the deviations of the current trial from the mean trial. The resulting score is scaled
according to the number of data frames and the excursion of the mean curves.
2 21 1 2 2
2
1
1
(( ) ( ) )
( )
*100*
k
n
kk
i
J
ii
R Angle MeanAngle Angle MeanAngle
RRMS
n
RMS
NoRMSJ L
=
=
= − + −
=
⎛ ⎞⎜ ⎟⎜ ⎟⎝ ⎠=
∑
∑
(4.5)
Sidaway et al. (1995) (1995) applied the method to data from a rhythmical ski simulator task.
The results indicated that skilled performers showed higher consistency in movement
execution compared to novice performers in the knee-knee and hip-knee angle-angle plots.
The procedure was identified by Mullineaux, Barlett and Bennett (2001) as suitable to
identify consistency in non-linear movement patterns.
Recently Hodges, Hays, Horn and Williams (2005) applied the procedure to skill
acquisition data from a novice player in a soccer in-step movement. Using a 3D motion
capturing system, a model representation of the movement was obtained which provided the
desired joint angle kinematics. The results showed decreasing NoRMS scores throughout the
learning period indicating less variability in movement execution in the lower limb segments
(Hodges et al., 2005).
A procedure similar to NoRMS was used in the study made by Chen, Liu, Mayer-
Kress(2005) described earlier. A Cauchy criterion which measures the differences between

88
movements pattern performed on consecutive trials was used. The criterion was based on the
differences between the spatial joint displacement in 3D space using a time-normalized
representation of the movement. The differences were squared, summed over all variables, the
square root was taken and divided by the number of trials – 1 and number of input spaces.
0.5452
, , 1 , ,1 1
1 ( )45*( 1)
n
k i j k i j kj i
C x xn +
= =
⎛ ⎞= −⎜ ⎟− ⎝ ⎠
∑ ∑ (4.6)
Hence, when movements in subsequent trials was very similar a small Ck was
obtained. Participants movements in the pedalo-locomotor task were recorded by a motion
capture system in 3D and a whole body model was obtained. Results indicated a decrease of
the Cauchy scores during the learning period (Chen et al., 2005).
In summary, the three approaches presented all apply the RMSE to estimate deviations
between executed trials. The Cauchy criterion estimates the differences between two trials,
whereas the NoRMS procedure estimates the variability of several trials together. The basic
procedure therefore holds very few assumptions regarding the distributions of the raw data
and only penalize higher deviations greater in magnitude than smaller deviations by squaring
the deviations which seems to be an intuitively valid assumption. By using a whole body
representation in the Cauchy-score differences in movement coordination in all segments can
be assessed at the same time. Since no weighting of the different deviations is introduced,
neither in time nor between different segments, equal importance is assigned to all segments
and to all time instances. Hence, regarding the scalar nature of the dissimilarity scores
obtained in all three procedures information is lost about the occurrence of deviations.
Important for all procedures is the assumption that time normalizing trials does not
influence the variability of the signal and accordingly biases the deviation scores (Cordero,
Koopman, and van der Helm, 2006; Page and Epifanio, 2007; Satern and Keller-McNulty,
1992). A potential confounding factor might be the introduction of the range normalization
used in the NoRMS procedure. When the scores are range normalized the underlying
assumptions is that small deviations in one angle with only small range of motions are as
important as high deviations in another angle possessing a high range of motion. This line of
reasoning seems counterintuitive since one can argue that for the CNS, limiting the range of
motion in one angle represents a control problem by itself. Similar, like for a moving segment
a joint angle cannot be held constant without determined control. Hence, range normalization

89
of this angle masks this information and potentially biasing the results (Schöner and Scholz,
under review).
A problem in particular with the NoRMS procedure is related to the calculation of the
mean trial which implicitly assumes a normal distribution of the angle data which has to be
checked on a task specific basis. Since the mean is quite sensitive to outliers, such trials will
increase the deviation score disproportionately and potentially yield incorrect conclusions.
Similarly, if the kinematics exhibit clustering behaviour where the investigated group of trials
contain sub groupings, the level of variability within each group may be very small but
because of the formulation of a mean trial, the dissimilarity score could be potentially
inflated.
In conclusion, the RMSE procedures provides an intuitive approach in order to
estimate the differences between different trials. However, the score itself only provides
information about deviations in kinematics between trials, and not an absolute indication of
movement patterning. Hence, regarding the formulated prerequisites the RMSE procedure
alone does not prove sufficient for the present programme of work.
Cluster analysis
Cluster analysis represents a heuristic tool of analysis which aims at uncovering
grouping structure in populations of different objects. Usual in application of cluster analysis
the experimenters are faced with large amounts of data which need to be organized according
to the underlying structure in the data in order to be more easily understood. Application of
cluster analysis is common in various fields of research including biology (Handl, Knowles,
and Kell, 2005) medicine (Blashfield, 1980; Everitt, Landau, and Leese, 2001), economics
(Ketchen and Shook, 1996; Punj and Stewart, 1983).
In regards to studies in motor control, several applications of cluster analysis have
been undertaken. Howard and Wilson (1983) used a cluster analysis to describe movement
patterning in the backstroke swim start in ten participants. Using 2D motion capture, the
authors calculated joint angles based on a 14 segment body model. Digitizing started from
movement initiation and ended at entry of the head into the water. Using each 14 dimensional
posture representation as an input vector, the movement postures or modal action patterns
(MAP) were grouped according to their similarity in a hierarchical clustering algorithm.
Based on the groupings of the data the authors identified twenty-one MAPs which were

90
required in order to distinguish between different starting techniques. Interestingly, when one
specific participant was discarded from the analysis only six distinct patterns remained
(Wilson and Howard, 1983).
Other applications of cluster analysis to golf movement patterning were performed by
Lames (1992) and more recently by Ball and Best (2007). The latter authors highlighted the
usefulness of cluster analysis “especially for identification of different styles, or movement
strategies“ (p.3). Ball and Best’s (2007) study investigated weight transference during the
golf swing of 62 participants during ten simulated golf drives. Based on the centre of pressure
path way during several key events of the movement, the authors were able to distinguish
between different movement strategies. A two-stage cluster analysis was used where during
the first stage a hierarchical cluster analysis was used. Subsequently all likely solutions were
fed into a non-hierarchical cluster analysis and the different solutions were assessed using
several validation measures indicating a best fit solution. The authors stressed the importance
of validating the cluster analysis results using several measures.
One of the most consistent advocates in regards to the application of cluster analysis
for motor control research has been the movement scientist Wolfgang Schöllhorn (1993,
2003, 2004). Schöllhorn has used several different approaches for the analysis of time-
continuous representations of movements based on kinematics and kinetics eventually
assessed through a cluster analysis. For example, using 3D motion capture, Schöllhorn (1993)
investigated discus throws in one participant using eight trials in total. Estimating a Hanavan
body model, kinematic and kinetic data of the joint angles was derived. PCA was applied to
the time curves of the data from each trial and a factor loading matrix for each trial was
obtained. These loading matrices were compared to each other and the derived dissimilarity
scores were fed into a cluster analysis algorithm. The results showed a division of the eight
trials into two groups (Gp 1 = 6 trials, Gp 2 = 2 trials). However, these different movement
patterns were not apparently related to effectiveness as no association with performance could
be identified within this small sample.
Jaitner, Mendoza and Schöllhorn (2001) investigated the run-up phase in long jumping
using a cluster analysis. The authors obtained joint angle displacement and velocity data using
2D motion capture of 57 trials across 17 participants. The joint curves were time-normalized
and range normalized. The pair wise differences between all trials were calculated and
arranged in a distance matrix which was subsequently analyzed using a cluster analysis.

91
Based on the obtained clustering the authors were able to determine differences in the
execution of the steps prior to the take-off. Further, strong indication for individual different
movement patterns was exhibited. However, in both Jaitner et al. (2001) and Schöllhorn’s
(1993) studies no validation of the cluster analysis was performed.
Another prominent area where several applications of cluster analysis have been
undertaken concerns the study of gait in cerebral palsy patients. O’Byrne, Jenkinson and
O’Brien (1998) investigated gait pattern in 146 patients with cerebral palsy using a cluster
analysis approach. Sagittal plane kinematics consisting of range of movement and maximum
flexion and extension of hip, knee, and ankle were used as input vectors for the cluster
analysis using a hierarchical k-means clustering algorithm. The resulting grouping was
indicative of different walking styles and was used to establish a reliable identification
scheme for clinicians. A similar approach was used by Kienast, Bachmann, Steinwender,
Zwick and Saraph (1999). Based on 3D motion capturing and successive calculation of angles
of the lower limbs a k-means clustering was performed. The cluster analysis was able to
distinguish between normal and pathologic gait patterns. Furthermore, the cluster containing
the pathological gait patterns exhibited a subdivision into different expressions of typical gait
pathologies (Kienast et al., 1999).
A significant investigation into the use of cluster analysis for gait pathologies was
performed by Toro, Nester and Farren (2007). The authors criticized preceding investigations
that have not validated the cluster analysis noting that it remained unclear how in many
studies the optimum number of patterns was assessed (Toro et al., 2007). The authors
proposed a hierarchical clustering algorithm where a-priori numbering of clusters was not
determined, rather the cluster solution and optimal number was post-priori assessed. The
investigation was based on the kinematics of the lower limbs using a 3D motion capturing
system with 67 subjects. The subject pool contained eleven children with no gait
abnormalities, the other subjects had some form of gait pathology. Movement cycles were
normalized to 100% of gait cycle and a mean curve from each subject, based on 20 trials was
determined. Initial contact, maximum stance extension and maximum swing flexion from the
hip and similar measurements from the knee and the ankle were chosen as input variables to
the cluster analysis. The authors postulated three criteria in order to determine the optimality
of the cluster solution: (1) The gait patterns of the non-pathological children should be
grouped together into one single cluster separate from the other gait patterns; (2) Standard
deviations between data cases within a cluster should exhibit stable values over a range of

92
different cluster solutions; (3) A post clustering visual inspection of the normalized angle
plots should exhibit distinctive differences between the clusters for at least one joint (Toro et
al., 2007, p.4).
Based on the three criteria and using a furthest neighbourhood algorithm the authors
identified a 14-cluster solution which best represented the data. One cluster consisted only of
a single trial which exhibited high variability and was discarded from the analysis. The gait
patterns of the normal subjects were all grouped into a single cluster. Subsequently, detailed
investigation of the angle curves made significant differences between the clusters apparent.
In summary, cluster analysis appears to be promising methodological approach that
can distinguish between globally similar and different movement patterns. The combination
of RMSE approach and cluster analysis used in the investigations of Schöllhorn and co-
workers seems well placed to address the first prerequisite of the desired analysis method.
Using a time-continuous approach makes it is possible to assess timing between different
segments together with range of motion information. However, as has been highlighted, the
issue with the application of cluster analysis is related to the assessment of the validity of the
obtained solution and how to identify a valid clustering scheme.
Further, in regard to the second prerequisite identified earlier, cluster analysis might
prove especially useful since the results can be directly used to identify hysteresis effects (see
Lames, 1992). However, in its present form the cluster analysis technique has not yet been
used to identify other hallmark dynamical systems features such as critical fluctuations or
critical slowing down.
Conclusion
In this chapter several analytical methods have been investigated which could be used
to identify phase transition behaviour in a discrete, multi-articular action. At present there is
no universally agreed upon analytical tool available which could be directly applied to
studying this type of movement model. Based on the identified prerequisites for a potential
tool, different methods from the extant literature were assessed and cluster analysis was
identified as showing the highest proximity to the desired properties. However, the
application of cluster analysis still presents unresolved issues which, unfortunately, have yet
to be addressed sufficiently in the literature. An interesting feature of this approach is that
through cluster analysis, the grouping of different movement patterns can be derived in a

93
systematic manner. Typically, in investigations from a dynamical systems theoretical
perspective, movement patterning and related order parameters have been derived either
through a-priori knowledge obtained from previous investigations or from formal
mathematical modelling. Potentially, the systematic approach underlying cluster analysis
enables access to movements which have not been investigated before by movement
scientists. Hence, it seems viable to investigate further the potential of cluster analysis in
studies of motor control, especially in regards to application to discrete multi-articular actions
like the basketball hook shot.
94
5 Chapter Five: Analyzing movement through a novel cluster analysis approach
Based on the assessment of the different analysis methods in the preceding chapter,
cluster analysis was identified as a potential analysis tool for this research programme. In this
chapter, a brief overview of the cluster analysis methodology is provided. Subsequently the
feasibility of cluster analysis is assessed through several empirical, validation studies.
Cluster analysis basics
The basic aim of cluster analysis as a research method is to find groupings or clusters
of objects belonging together within a greater population which is usually investigated by
multivariate measurement techniques. Application of cluster analysis typically involves three
successive steps (Handl et al., 2005): 1) Pre-processing; 2) Cluster analysis, and; 3) Cluster
validation. In this introduction, each of the three steps is discussed in detail.
Pre-processing
During pre-processing, the input variables are chosen which serve as the determinants
from which differences between objects can be assessed. The input variables have to be
chosen by the experimenter based on application of a-priori empirical information or by
theoretical rationale in the absence of data. For example, when investigating gait patterns one
would usually include those variables which have been identified in the literature to be
influential in regulating gait. Usually the input variables span a high multi-dimensional space
which prevents the use of other statistical methods.
When the dimensionality of the input space has been determined, the measurement
scales of the input variables are investigated. An important decision concerns whether all
input variables stem from the same domain or whether they exhibit different units and scales
(e.g. ordinal, nominal and interval) as in other statistical methods. This process entails the
issue of data normalization. Typical normalization schemes involve either the formation of z-
scores or simple range normalization. When a mixture of scales differing in quality are
present, other schemes might be needed (Everitt et al., 2001). However, when the input
variables all stem from the same domain and share a common meaning, then normalization is
not necessary but potentially yields misleading results (Kaufmann and Rousseeuw, 1990;
Schaffer and Green, 1996). Hence, pre-processing procedures need to be tailored to a specific
95
data set. For example, again referring to gait analysis when using angle and displacement data
a different scheme is necessary compared to only angle or angle and nominal data reflecting
characteristics of different patient cohorts.
The following stage of pre-processing involves the definition of a dissimilarity score
which represents the relation of the different objects to each other. The score should exhibit
high values when objects are dissimilar from each other and accordingly low values when the
objects are more alike. When interval scaled variables are used (e.g. joint angles) a common
choice for a dissimilarity score is the Canonical or Euclidean distance between two input
vectors which is basically the RMSE score mentioned in the previous chapter. The
dissimilarities between all input objects are plotted and the results are arranged in a distance
matrix D. Rows and columns of this matrix represent the different inputs so that, for example,
the difference d6,10 between the sixth and the tenth object can be found at the entry of the sixth
row and the tenth column (compare ). The matrix is symmetric and has zero entries on the
main diagonal.
12 1
21
( 1)
1 ( 1)
00
0
n
n n
n n n
d dd
dd d
−
−
=D
…
…
Cluster analysis
In the next step, a clustering algorithm is used which performs the actual cluster
analysis. Two main schemes can be distinguished: hierarchical and non-hierarchical
clustering. The main differences between these two methods are that, in the former, no
knowledge of the number of clusters is present, whereas during non-hierarchical clustering,
the number of clusters formed is decided by the experimenter a-priori. Since for the present
research programme the number of clusters is not known, following the arguments by Toro et
al. (2007) further discussion will focus on hierarchical clustering and on agglomerative
methods.
Agglomerative hierarchical clustering partitions the data into clusters in a succession
of steps. During the first step, the number of clusters equals the number of input objects. The
algorithm searches for the two objects with the smallest dissimilarity based on the
dissimilarity matrix and merges these objects into a single object. Depending on the choice of
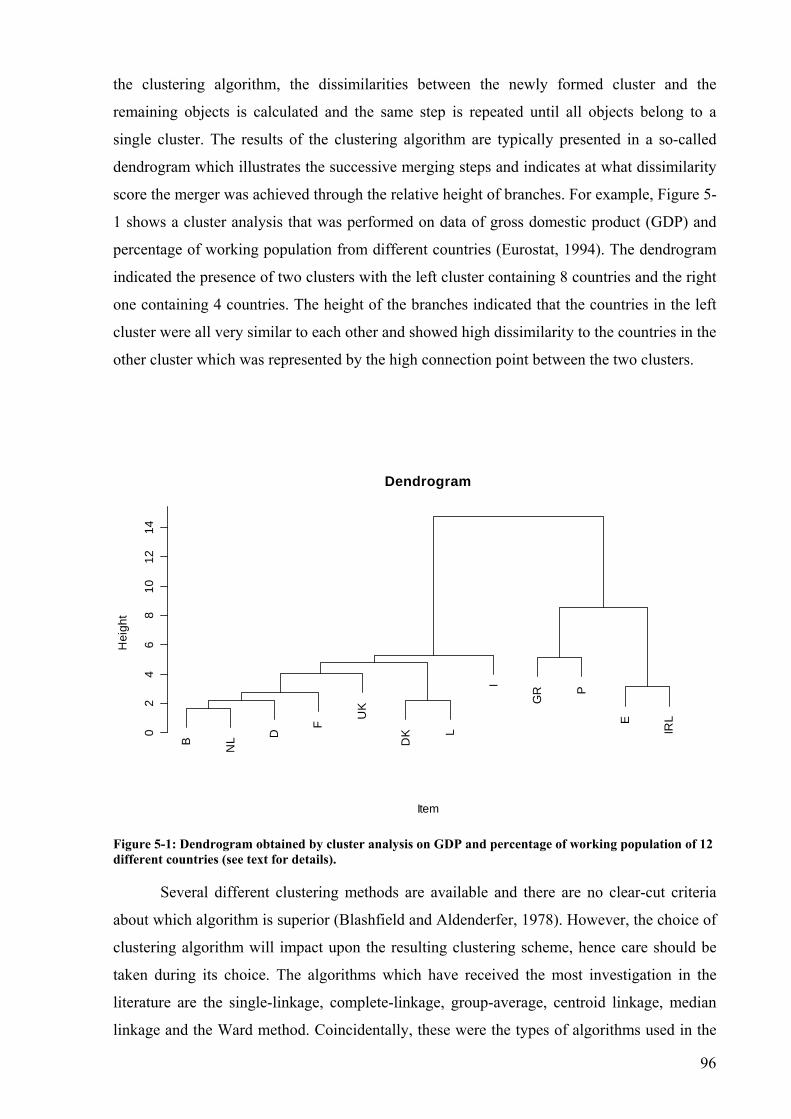
96
the clustering algorithm, the dissimilarities between the newly formed cluster and the
remaining objects is calculated and the same step is repeated until all objects belong to a
single cluster. The results of the clustering algorithm are typically presented in a so-called
dendrogram which illustrates the successive merging steps and indicates at what dissimilarity
score the merger was achieved through the relative height of branches. For example, Figure 5-
1 shows a cluster analysis that was performed on data of gross domestic product (GDP) and
percentage of working population from different countries (Eurostat, 1994). The dendrogram
indicated the presence of two clusters with the left cluster containing 8 countries and the right
one containing 4 countries. The height of the branches indicated that the countries in the left
cluster were all very similar to each other and showed high dissimilarity to the countries in the
other cluster which was represented by the high connection point between the two clusters.
B NL D
F
UK
DK L
I
GR P
E
IRL
02
46
810
1214
Dendrogram
Item
Hei
ght
Figure 5-1: Dendrogram obtained by cluster analysis on GDP and percentage of working population of 12 different countries (see text for details).
Several different clustering methods are available and there are no clear-cut criteria
about which algorithm is superior (Blashfield and Aldenderfer, 1978). However, the choice of
clustering algorithm will impact upon the resulting clustering scheme, hence care should be
taken during its choice. The algorithms which have received the most investigation in the
literature are the single-linkage, complete-linkage, group-average, centroid linkage, median
linkage and the Ward method. Coincidentally, these were the types of algorithms used in the

97
studies of human movement presented earlier. In Table 5-1 the different algorithms are shown
together along with some of their properties (Everitt et al., 2001; Kuiper and Fisher, 1975).
Table 5-1: Properties of different cluster algorithms according to Everitt et al. (2001, p.62) Method Distance between
clusters defined as Remarks
Single linkage Minimum distance between pair of objects, one in one cluster, one in the other
Tends to produce unbalanced and straggly clusters (‘chaining’), especially in large data sets. Does not take account of cluster structure.
Complete linkage Maximum distance between pair of objects, one in one cluster, one in the other
Tends to find compact clusters with equal diameters (maximum distance between objects). Does not take account of cluster structure.
(Group) Average linkage Average distance between pair of objects, one in one cluster, one in the other
Tends to joint clusters with small variances. Intermediate between single and complete linkage. Takes account of cluster structure. Relatively robust.
Centroid linkage Squared euclidean distance between mean vectors (centroids)
Assumes points can be represented in Euclidean space. The more numerous of two groups clustered dominates the merged cluster. Subject to reversals.
Median linkage Squared Euclidean distance between weighted centroids
Assumes points can be represented in Euclidean space for geometrical interpretation. New group intermediate in position between merged groups, subject to reversals.
Ward’s method Increase in sum of squares within clusters, after fusion, summed over all variables
Assumes points can be represented in Euclidean space for geometrical interpretation. Tends to find same size, spherical clusters; sensitive to outliers.
The group average algorithm tends to be quite robust against outliers and is not
strongly affected by unequal group sizes. Based on its mathematical properties, Kaufman and
Rousseeuw (1990) recommend the group average algorithm as a good choice in many
situations (see also Punj and Stewart, 1983).
The main issue with hierarchical cluster algorithms is that the result is potentially only
representative of a sub-optimal solution. Due to the nature of the stepping procedure, if a
mistake in the algorithm occurs during one of the earlier steps, there will be an impact on all
of the following steps. Since it is difficult to identify such mistakes once the analysis is
completed, the results of a cluster analysis should not be accepted as correct at the termination

98
of this stage but still need to be validated (Ball and Best, 2007; Blashfield, 1980; Everitt et al.,
2001; Halkidi, Batistakis, and Vazirgiannis, 2002a).
Cluster validation
Validation of the results is an important part of cluster analysis and therefore it is
surprising that this step has been omitted in most of the studies presented earlier. According to
Handle, Knowles and Kell (2005), validation techniques can be classified as either external or
internal measures. External measures are possible if a ‘gold-standard’ for a given set of data is
available and the obtained cluster analysis results can be compared to this standard which
provides a direct assessment of cluster analysis performance. Internal measures work on the
information inherent to the given dataset and aim at assessing the quality of the clustering
without pre-existing data. Several different internal measures have been developed without a
universally agreed-upon procedure. Thus, it is recommended to use several different measures
to accommodate for internal biases of the different methods in order to obtain valid results
(Ball and Best, 2007; Halkidi et al., 2002a; Halkidi, Batistakis, and Vazirgiannis, 2002b;
Handl et al., 2005).
Regarding the internal measures, several different properties can be identified: (1)
Compactness: assessment of cluster compactness or homogeneity; (2) Connectedness:
assessment to what degree the clustering scheme represent local densities in the distribution of
the data; (3) Separation: how well are the different clusters separated; (4) Combination:
validation schemes which use properties 1 to 3; (5) Predictive power/stability: through
resampling methods the stability of the clustering results is investigated; (6) Compliance
between an obtained partitioning and distance information. Based on the distance matrix and
the cluster analysis partition it can be assessed whether the obtained result conforms with the
information in the distance matrix. For example, when a specific partition has been obtained
and one cluster contains two objects which are according to the dissimilarity matrix highly
different from each other the compliance measure would penalize this inconsistency.
Hence, to make an informed decision about the cluster analysis results, a combination
of several validation procedures seems necessary. Following the validation procedures the
final partition of the cluster analysis can be identified since one is usually not interested in the
compete hierarchy but only a few partitions.

99
In conclusion, as has been pointed out, the cluster analysis per se does not represent a
singular procedure but demands the execution of several informed decisions by the
experimenter at various stages during the analysis. Nevertheless, cluster analysis apparently
shows the necessary properties to make it a feasible analysis method to study discrete, multi-
articular action. However, before proceeding, the approach has to be validated in regards to
the remaining prerequisites identified in Chapter 4 related to the identification of phase
transitions (i.e., critical fluctuations, hysteresis, and critical slowing down).
Cluster analysis and scaling experiments
Hallmark features associated with phase transitions such as critical fluctuations,
hysteresis, and critical slowing down, need to be empirically testable using the proposed
method. Hysteresis could be indicated by the cluster solution if changes between different
clusters occurred at different values of a proposed control parameter depending on the
direction of change (compare Lames, 1992). Critical fluctuations cannot be assessed directly,
based on the clustering itself, but the dissimilarity score could be utilized as a surrogate
measure. When critical fluctuations are present, mean dissimilarity scores for a given control
parameter as represented in the distance matrix should exhibit a sharp rise, denoted as a
‘knee’ in the plot of the mean dissimilarity scores against the control parameter. Accordingly,
if peak behaviour of mean scores occurs in the vicinity of switching areas, this occurrence
may be interpreted as indicative of critical fluctuations. According to Schöner (1990), inter-
trial variability can be used in order to assess the stability of the movement (Scholz and
Schöner, 1999; Schöner, 2002) and subsequently to identify critical slowing down after a
perturbation (Schöner, 1990). Dissimilarity scores between trials should decrease between
subsequent trials after the application of a perturbation, similar to the Cauchy criterion applied
by Chen, Liu, Kress & Newell (2005). Hence, during phases of instability the dissimilarity
scores should take longer (i.e., more trials) to relax back to the unperturbed state compared to
the number of trials needed in stable regions. The information can be directly obtained again
from the dissimilarity matrix D since the first main diagonal of the D represent the differences
between subsequent trials.
In the present form, the proposed cluster analysis approach is based on a single-
participant design. According to the theoretical foundations of DST explained earlier,
variability at several levels of observation is inherent to neurobiological systems and although
archetypical responses, like for example phase transitions, are observed across participants,
strong inter-individual differences usually are present (compare Thelen, 1995). For example,

100
in the study by Kelso et al. (1992), using a multi-articular movement model, the authors
observed different switching strategies between participants (see also Buchanan et al., 1997
for similar findings). Similar, in the study by Sorensen et al. (2001) the hysteresis areas were
located at individually different positions. Hence, when using a multi-articular degenerate
movement it seems likely that even greater inter-individual differences would be observed.
This expectation is also supported by the findings from Chapter 3, where the four participants
exhibited strong inter-individual differences during movement execution. Accordingly, it
seems necessary to adopt an analysis approach, which is centred around a single-participant
design. This has also been recognized in the literature (Button et al. 1998; Button et al. 2003;
Button et al. 2006). Using such a “coordination profiling” approach (Button et al. 2006, p.
138) has the advantage that detailed analysis of individual responses is possible. This
approach prevents masking effects of individual variability which can occur when adopting a
group based analysis (Schöllhorn et al. 2002). Further, extending the individual analysis and
using a multiple-baseline single participants design overcomes some of the inherent
limitations of single-participants designs in terms of generalizing the findings (Bates, 1996;
Reboussin and Morgan, 1996, Zhan and Ottenbacher, 2001).
In summary, cluster analysis potentially provides the necessary features to investigate
all of the prerequisites of a dynamical systems theoretical analysis. At the same time it could
relieve researchers from requiring extensive a-priori knowledge about order and control
parameters allowing them to test the tenets of dynamical systems theory with a wide range of
movement models based on a systematic approach. To probe the feasibility of the cluster
analysis some sort of validation has to be performed. Hence, in the following sections a
proposed cluster analysis method will be explained and subsequently a validation of the
method shall be conducted.
Proposed cluster analysis method
The technical method is based on the assumption that kinematic similarity between
different movement trials is related to the similarity of underlying order parameters. In the
examples from the literature where a-priori knowledge of order parameters was available, the
argument in favour of designating a specific variable as an order parameter was partly based
on the kinematic properties of the task. For example, in the finger flexion-extension task, the
relative phase was assumed as an order parameter based on the switching between ‘in-phase’
and ‘anti-phase’ behaviour which in turn is a result of the neuro-mechanical properties of the
index finger segments (Assisi, Jirsa, and Kelso, 2005; Carson and Riek, 1998; Carson et al.,
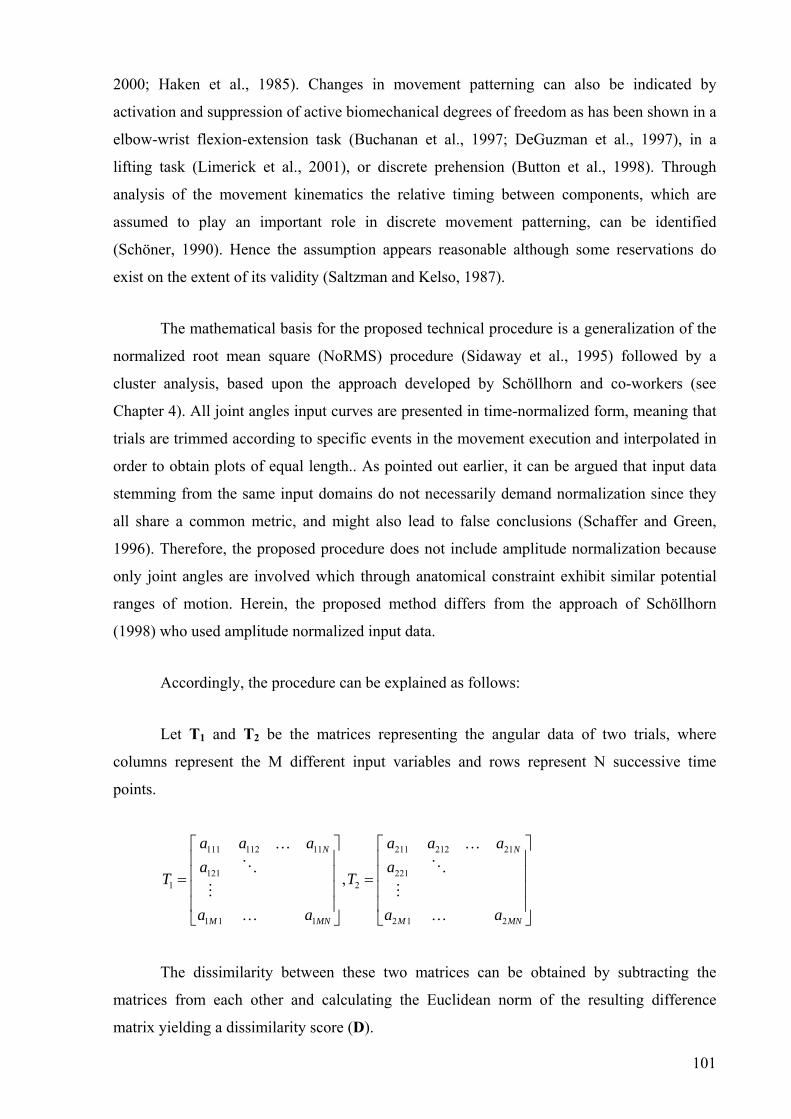
101
2000; Haken et al., 1985). Changes in movement patterning can also be indicated by
activation and suppression of active biomechanical degrees of freedom as has been shown in a
elbow-wrist flexion-extension task (Buchanan et al., 1997; DeGuzman et al., 1997), in a
lifting task (Limerick et al., 2001), or discrete prehension (Button et al., 1998). Through
analysis of the movement kinematics the relative timing between components, which are
assumed to play an important role in discrete movement patterning, can be identified
(Schöner, 1990). Hence the assumption appears reasonable although some reservations do
exist on the extent of its validity (Saltzman and Kelso, 1987).
The mathematical basis for the proposed technical procedure is a generalization of the
normalized root mean square (NoRMS) procedure (Sidaway et al., 1995) followed by a
cluster analysis, based upon the approach developed by Schöllhorn and co-workers (see
Chapter 4). All joint angles input curves are presented in time-normalized form, meaning that
trials are trimmed according to specific events in the movement execution and interpolated in
order to obtain plots of equal length.. As pointed out earlier, it can be argued that input data
stemming from the same input domains do not necessarily demand normalization since they
all share a common metric, and might also lead to false conclusions (Schaffer and Green,
1996). Therefore, the proposed procedure does not include amplitude normalization because
only joint angles are involved which through anatomical constraint exhibit similar potential
ranges of motion. Herein, the proposed method differs from the approach of Schöllhorn
(1998) who used amplitude normalized input data.
Accordingly, the procedure can be explained as follows:
Let T1 and T2 be the matrices representing the angular data of two trials, where
columns represent the M different input variables and rows represent N successive time
points.
111 112 11 211 212 21
121 2211 2
1 1 1 2 1 2
,
N N
M MN M MN
a a a a a aa a
T T
a a a a
⎡ ⎤ ⎡ ⎤⎢ ⎥ ⎢ ⎥⎢ ⎥ ⎢ ⎥= =⎢ ⎥ ⎢ ⎥⎢ ⎥ ⎢ ⎥⎣ ⎦ ⎣ ⎦
… …
… …
The dissimilarity between these two matrices can be obtained by subtracting the
matrices from each other and calculating the Euclidean norm of the resulting difference
matrix yielding a dissimilarity score (D).

102
1 2 2D T T= −
When two trials are performed with exactly the same movement pattern, the score will
be zero, and accordingly, the more the kinematics between two trials differ from each other,
the higher the D value yielded. Calculating all possible permutations of trial pairings, the
obtained D scores can be arranged in a distance matrix which can be subsequently submitted
to a hierarchical cluster analysis following the approaches of Wilson and Howard (1983) and
Schöllhorn (1995; , 1998). According to the the literature, the average distance method has
desirable mathematical properties, is widely used and is robust against outliers and unequal
cluster group sizes (Kaufmann and Rousseeuw, 1990; Kuiper and Fisher, 1975). Since it is
possible that the experimenter a-priori does not know whether equal groups sizes will be
obtained or that participants may show outlying behaviour between trials, it seems reasonable
to make the average distance algorithm the method of choice for the proposed analysis
approach.
In order to secure the results against the possible identification of false structures
following the arguments presented earlier, a two-fold validation scheme is proposed.
First, a bootstrapping method developed by Shimodaira and co-workers (2002; , 2004;
Suzuki and Shimodaira, 2004) can be used. This method assesses the stability of the
clustering through multi-scale bootstrapping, testing the reliability of a particular cluster
solution. During the multi-scale bootstrapping procedure, several bootstrap replicates are
generated by sampling from the experimental data. Multi-scale bootstrapping refers to the fact
that the sample sizes are varied. Through this approach, by recording the number of times a
specific partitioning obtained from the “bootstrap replicates” matches the initial clustering,
the stability of the specific cluster can be assessed. Subsequently each node in the cluster tree
can be rated with p-values indicating the level of statistical probability of the specific node
representing true clustering (Shimodaira, 2002, 2004). In regards to the bootstrapping
procedure, an important question deals with the number of bootstrap replicates necessary to
ensure convergence of the procedure. Following the propositions of Suzuki and Shimodaira
(2006b), once the range of all p-values ± 2*standard errors falls between 0 and 1, the number
of iterations can be deemed sufficient. All necessary procedures are available through the R
software package (R Development Core Team, 2006) and the add-on packages pvclust
(Suzuki and Shimodaira, 2006a) and scaleboot (Shimodaira, 2006). Second, the results can be
checked using the Hubert-Γ value which estimates the compliance between the distance

103
matrix and the clustering structure (Halkidi et al., 2002a). High Hubert-Γ scores indicate the
existence of compact clusters and one usually inspects a plot of Hubert-Γ scores plotted
against several partitions where the best solution is indicated by a significant knee of the
graph (Halkidi et al., 2002b). Together, the two methods test different properties of the cluster
solution and one can assume some robustness of this particular validation scheme.
Error influences
Because the calculated dissimilarity score forms the input for the clustering algorithm,
an investigation into possible error sources is necessary. A simple model with only two linear
curves will be used to highlight further issues which might occur during the analysis.
Let f1 be the reference graph with f1 := a*ti (i=1,..N) where a is a constant slope, N is
the number of time frames and f2 is the testing graph. Three different influences will be
investigated: (I) Different intercepts, (II) different slopes, and (III) different offsets between
the graphs.
(I) Different intercepts: Let f2 := a*ti + b
bNbatatDN
iii =−−= ∑
=1
2)(
(II) Different slopes: Let f2 := c*ti, with c:=a+b.
∑∑==
=−=N
ii
N
iii tbctatD
1
2
1
2)(
(III) Different offset: Let f2 := a(ti + b).
abNbtaatDN
iii =+−= ∑
=1
2))((
In case (I), the error term consists of two parts. The first square root term affects all
trials in the same way since all trials should have the same length after time normalization.
Therefore, only the second part is of interest. From a movement coordination perspective the
different intercepts represent differences in actual movement execution, from where it follows
104
that the obtained score is actually intended. In case (II) two cases have to be distinguished. In
the case of a true difference, the former argument applies. In the case of an erroneous
difference when the true slopes are equal (e.g. the differences in the slope can be introduced
either if one of the cutting points is not the same in the two trials or when the trial lengths
differ), the dissimilarity is erroneous and gets multiplied by the squared time points.
Similarly, in case (III) the difference can be introduced when inaccurate cutting points are
being used. The error term gets inflated, not only by the offset error, but can also be
multiplied by the slope and the square root of the number of points which will always be >1.
Both cases (II) and (III) highlight the importance of using trials that cannot differ much in
length before time normalization in order to obtain meaningful data. Further, trimming points
must be used which can be reliably identified in all used trials.
Method Evaluation
In order to show that the procedure extracts meaningful data from the analysis of
movement kinematics, studies will be used where some a-priori knowledge about possible
movement patterning is present and hence the validity of the cluster solution can be externally
assessed.
Three studies were chosen in order to fulfil two requirements. On the one hand it
should be validated whether the proposed method was able to extract the same information
when compared to traditional measures for a task where both methods could be applied. For
this reason, a task from the rhythmical bimanual coordination domain was chosen which
could be analyzed with the proposed method as well as a traditional method. In regards to the
present programme of work, obviously the feasibility of the method with the proposed new
movement model had to be investigated as a prerequisite for further investigations. Here, a
relatively simple experiment was chosen were the cluster analysis method should show its
potential in identifying clearly different discrete, multi-articular movement patterns. In a
second step it was checked whether the sensitivity of the method was high enough in order to
pick up alterations between similar movements, a property which would be desirable for
further investigations.

105
Experiment 1
Methods
In the first experiment, a wrist supination-pronation task was investigated similar to
the movement model used by Carson et al. (1996). A case study approach was used in which
the participant was seated in front of two manipulanda and instructed to synchronize an anti-
phase movement with a metronome. Movement frequency was scaled from 1 Hz to 2.5 Hz in
steps of 0.25 Hz and each step lasted for 8 seconds. As is the convention in many studies of
phase relations in cyclical movements, the participant was instructed that, if the movement
patterning were to become unstable, the most comfortable pattern should be adopted. The
recording frequency of accelerometers attached to the manipulanda was set at 500Hz and data
from 12 trials in total were collected. Single movement trials were determined according to
the occurrences of maximum pronation of the right hand and time normalized to 100 data
points. Discrete relative phase (DRP) data were calculated according to the method of Kelso
(1995) using the displacement data from the accelerometers. Displacement data were also
used for the clustering procedure and dissimilarity scores were calculated according to the
procedure explained earlier. For the bootstrapping procedure 10,000 iterations were
performed and the standard errors of the p-values were investigated.
All statistical analysis were performed using the R software with the pvclust,
scaleboot, and fpc packages for the cluster analysis and validation. All remaining calculations
were performed using custom programs written in Matlab 7.1.

106
Results
050
100
150
200
Discrete Relative Phase
Frequency [Hz]
DR
P [°
]
1.00 1.50 2.00 2.50
Figure 5-2: Mean discrete relative phase and standard deviations from one trial.
Figure 5-2 shows the mean DRP for each movement frequency bin from all trials. As
expected from previous studies, the anti-phase pattern was stable for the lower movement
frequencies and a shift to an in-phase pattern was apparent at a critical frequency of 1.75 Hz.
The error bars indicated a high increase in the variability of the movement pattern at the
critical frequency. Since the results for the individual scaling trials were all very similar, only
a single representative scaling trial will be discussed and the results of DRP and the cluster
analysis compared.
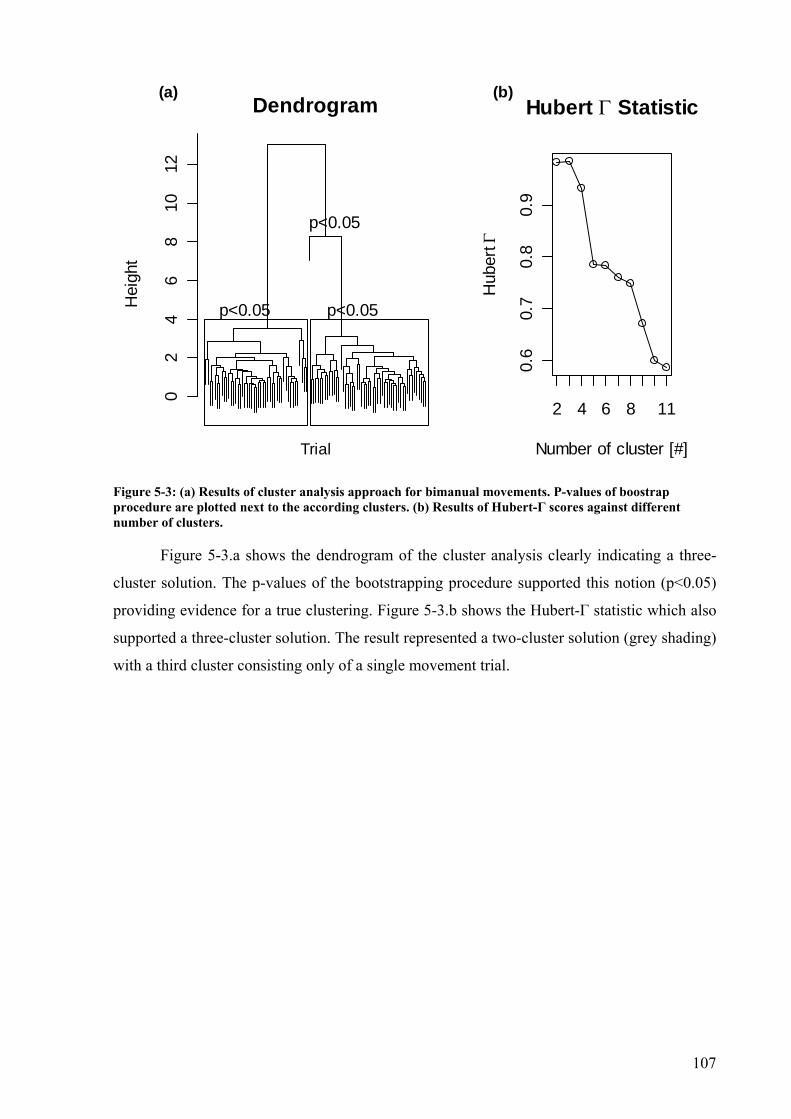
107
02
46
810
12
DendrogramH
eigh
t
p<0.05
p<0.05
p<0.05
Trial
0.6
0.7
0.8
0.9
Number of cluster [#]
Hub
ert Γ
2 4 6 8 11
Hubert Γ Statistic(a) (b)
Figure 5-3: (a) Results of cluster analysis approach for bimanual movements. P-values of boostrap procedure are plotted next to the according clusters. (b) Results of Hubert-Γ scores against different number of clusters.
Figure 5-3.a shows the dendrogram of the cluster analysis clearly indicating a three-
cluster solution. The p-values of the bootstrapping procedure supported this notion (p<0.05)
providing evidence for a true clustering. Figure 5-3.b shows the Hubert-Γ statistic which also
supported a three-cluster solution. The result represented a two-cluster solution (grey shading)
with a third cluster consisting only of a single movement trial.

108
1 1.25 1.5 1.75 2 2.25 2.5
Cluster-DRP-Distribution
Frequency [Hz]
Perc
enta
ge
020
4060
8010
0 Cluster 1 Cluster 2 Cluster 3
050
100
150
200
DR
P
Figure 5-4: Percentage of identified clusters against movement frequency with results from mean discrete relative phase superimposed.
Figure 5-4 shows the cluster distribution as a function of movement frequency with
the associated mean DRP superimposed. The plot provided clear evidence for a relation
between the clustering and the movement frequency. For the lower frequencies, the
participant used Cluster 3, which represented in the present case the anti-phase movement. At
2Hz, a switch from Cluster 3 to Cluster 2 took place. Further, a single occurrence of the
Cluster 1 was present which represented the singular object visible in Figure 5-3.a. As can be
seen from the DRP graph Cluster 2 represented the in-phase movement pattern.

109
1.5
2.0
2.5
3.0
3.5
Fluctuation measures
Frequency [Hz]
Dis
sim
ilarit
y [°
]
1.00 1.25 1.50 1.75 2.00 2.25 2.50
1020
3040
DR
P S
tand
arde
viat
ion
[°]
Diss-ScoreDRP
Figure 5-5: Plot of deviations scores obtained from the cluster analysis approach (left y-axis) plotted against the movement frequency and standard deviations obtained from discrete relative phase analysis (right y-axis).
In Figure 5-5, the fluctuations of the movement patterns are plotted by using: (a) the
dissimilarity scores obtained from the clustering approach, and (b) the standard deviation of
the DRP measures. The two measures mirrored each other quite closely with a sharp rise at 2
Hz. However, the dissimilarity scores showed an increase for the highest movement
frequency which was not as strong in the DRP measure. This difference stemmed from the
lack of sensitivity of the DRP measurement where only three points of the movement cycle
were used to estimate the value, whereas for the dissimilarity score, information over the
course of the whole trial was used. Analysing the kinematics of the trial showed that for the
higher frequency even the in-phase pattern showed some variation in the range of motion of
the wrist which was not identified by DRP.
In summary, the results of the clustering analysis closely resembled the results
obtained from the discrete relative phase measure identifying the different collective states of
the system (Haken, Kelso & Bunz, 1985), thereby providing the necessary information for
subsequent analysis. In addition, the cluster analysis showed some enhanced sensitivity over
the DRP technique which resulted from the analysis of continuous kinematics in contrast to
DRP which estimated the movement patterning solely based on three time slices and
discarded all information regarding movement amplitude.
110
Experiment 2
Methods
In order to assess the feasibility of cluster analysis as a method for differentiating
between discrete movement patterns, a multi-articular throwing task was investigated. Four
professional basketball players (age = 22 ± 4 yrs, height = 1.91 ± 0.8m) were instructed to try
and score baskets using three different shooting techniques from appropriate distances: ‘free
throws’ from 4.6m distance, ‘three point’ shots (6.5m), and ‘hook shots’ (4m). As
experienced players, the participants were familiar with the required techniques and throwing
distances. The protocol did not resemble the standard scaling methodology protocol, but was
used to highlight the validity of the technical analysis method for clearly distinguishing
between different established movement patterns.
Participants were prepared with passive reflective markers (5mm diameter) on the left
(l) and right (r) acromion, C7, sternum, lateral epicondylus humerus (l/r), radial styloid (r/l)
and ulnar (r/l), back of the right hand, spina illica anterior superior (r/l), spina illica posterior
superior (r/l), sacrum, lateral and medial epicondyles femoris (r/l), lateral and medial
malleolus (r/l), heel and toe marker (r/l) in order to identify anatomical landmarks. In addition
one marker each was placed on the tibia (r/l), on the lateral part of the femur (r/l) and the
humerus (r/l) and on the distal, dorsal part of the forearm. Sampling frequency was set at 100
Hz during motion capture with a three-dimensional motion capture system (Motion analysis
corp.) using 12 digital cameras. A mobile basket fixed at a conventional height of 3.05 m with
a Plexiglas backboard and a standard sized basketball (Size 7, FIBA approved) was used as
the target for all shooting trials.
From the position of a marker, hip joint centres were estimated using the procedure by
Bell, Pedersen and Brand (1990), and positions of the shoulder joints using the procedure by
Rab, Petuskey and Bagley (2002). Subsequently a 13-segment rigid body model was
established using Visual3D software (C-motion). Joint angles were calculated using the Euler
convention but only angles in the primary joint plane of motion were used for further analysis.
Shoulder joint kinematics of the right and left shoulder were estimated through the included
angle between the upper arm and the trunk. The trials were trimmed from the instance of
maximum hip flexion before throwing to the instance of maximum wrist height. All trials
were time normalized to 50 data points. The resulting joint angle plots were then used with
the proposed clustering method. The number of bootstrapping samples was chosen according

111
to the standard errors of the p-values ranging between 10,000 and 20,000 iterations. As
before, all statistical analyses were performed using the R software and further calculations
were performed using custom programs written in Matlab 7.1.
Based on a-priori experiential knowledge assuming a three-cluster solution
corresponding to the three shooting techniques, it was predicted that the free throws and the
three point shots should be more similar compared to the cluster of patterns for the hook shots
since these techniques appear more similar to each other.
Results
free
1fre
e 2
free
7fre
e 10 fre
e 9
free
3fre
e 4
free
5fre
e 8
free
63p
13p
53p
6 3p 4
3p 3
3p 7
3p 9
3p 2
3p 1
03p
8ho
ok 1
hook
8ho
ok 9
hook
10
hook
4ho
ok 3
hook
12
hook
7ho
ok 1
1ho
ok 2
hook
5ho
ok 60
100
200
300
400
500
Participant 1
Hei
ght
p<0.05 p<0.05 p<0.05Trial
3p 1
3p 6
3p 9
3p 5
3p 2
3p 3
3p 1
03p
43p
8 3p 7
free
1fre
e 3
free
2fre
e 4
free
9fre
e 5
free
8fre
e 10
free
6fre
e 7
hook
1ho
ok 2
hook
6ho
ok 8
hook
9ho
ok 3
hook
4ho
ok 5
hook
7ho
ok 1
0
010
030
050
0
Participant 2
eg
t
p<0.05 p<0.05 p<0.05Trial
3p 1
3p 3
3p 8
3p 2
3p 5
3p 7
3p 6
3p 1
03p
9 3p 4
free
1fre
e 6
free
8fre
e 2
free
5fre
e 3
free
7fre
e 4
free
9ho
ok 1
hook
5ho
ok 3
hook
2ho
ok 7
hook
4ho
ok 1
0ho
ok 6
hook
9ho
ok 80
100
300
500
Participant 3
Hei
ght
p<0.05 p<0.05 p<0.05Trial
3p 1
3p 4
3p 6
3p 1
03p
53p
7 3p 8
3p 9 3p
3 3p 2
hook
1ho
ok 8
hook
2ho
ok 5
hook
9ho
ok 7
hook
6ho
ok 1
0ho
ok 3
hook
4fre
e 1
free
3fre
e 4
free
5fre
e 6
free
7fre
e 8
free
9fre
e 10 fre
e 20
100
200
300
400
Participant 4
eg
t
p<0.05 p<0.05 p<0.05Trial
Figure 5-6: Individual dendrogram obtained from the results of the cluster analysis approach. P-values for each cluster are plotted underneath the according cluster.
Figure 5-6 shows the cluster solutions for the different participants with the three
predicted main clusters for all four participants. The p-values obtained from the bootstrapping
procedure supported the reliability of the three-cluster solution. The performance of
participants one to three support the prediction of greater similarity between the free throw
and the three-point shot, although some individual variability in the extent of this support was
present in the data. For participant one, the free throws were well separated from the three-

112
point shots compared to participants two and three where the merging between the clusters
occurred at a much lower dissimilarity value. For participant four, the cluster analysis grouped
the three-point shots and the hook shots together. Further qualitative inspection of the
kinematics for participant four revealed a special technique for the hook shot, a so-called
“jump-hook” which is much more similar to a jump shot (Martin, 1992), and explains the
outcome of the cluster analysis. The variations in dissimilarity values when comparing the
different techniques for the individual participants were supported by the Hubert-Γ values in
Figure 5-7.
2 3 4 5 6 7 8 9 10 11
0.55
0.60
0.65
0.70
0.75
0.80
0.85
0.90
0.95
Hubert Γ Statistic
Number of cluster [#]
Hub
ert Γ
Participant 1Participant 2Participant 3Participant 4
Figure 5-7: Plot of Hubert-Γ scores for each participant against number of clusters.
For participant one and participant two, the three-cluster solution showed the highest
score whereas participants three and four demonstrated a peak at two clusters. However, in
participant four’s case the decrease to the 3-cluster solution was relatively small indicating a
possible differentiation using three clusters. The differences observed between the Hubert-Γ
and bootstrapping procedure indicated that some interpretation in their use is needed.
In summary, the cluster analysis applied to three different shooting techniques
performed by skilled performers lead to entirely expected results. The method was able to
identify a-priori known differences between the different movement patterns supporting the
application of the methodology for analysing performance of discrete multi-articular actions.

113
Furthermore, the technique was also able to identify some interesting individual differences in
relation to the amount of dissimilarity between three basketball shooting techniques.
Experiment 3
Methods
The third validation study used a scaling methodology with a discrete multi-articular
action. Two professional basketball players (age=20 and 21 yrs, height=1,93 and 2.00m) were
instructed to score baskets using a hook shot technique from distances between 2m to 9m.
Both participants typically played as forwards and were experienced at the hook shot
technique. The changing distance imposed different strength and coordination requirements
on participants and was assumed as a potential control parameter (Southard, 1998, 2002). The
study was performed in a gymnasium with a ceiling height of only 4.5m. This physical
environmental characteristic imposed a spatial constraint on the shooting technique because
the ball trajectory arcs normally exhibited during basketball shots from further distances were
not available to the performers. The experimental set-up was chosen after initial pilot work,
the rationale was to facilitate a strong division between techniques used for close- and far-
range shots. Therefore, at least a two-cluster solution was expected to result from this
particular experimental manipulation. During shots from closer distances participants could
perform their typical techniques since the ceiling did not limit selected throwing arcs, whereas
for greater distances it was believed that the height constraint would lead to a forced
adaptation in movement patterning, which would be identified by the cluster analysis.
Participants were prepared in the same way as in the preceding experiment and the
same recording set-up was used. After a 15-minute warm-up period each participant
performed eight trials from each distance starting at 2m and ending at 9m in increments of
one metre. Afterwards the same procedure was applied in reverse starting from 9 metres. Data
analysis was performed in the same way as in experiment 2.

114
Results
010
020
030
040
0
Trial
Dendrogram of Participant 1(a)
Hei
ght
p<0.05 p<0.05
2 6 10 16
0.50
0.60
0.70
0.80
Number of Cluster [#]
Hubert Γ Statistic(b)
Hub
ert Γ
Figure 5-8: (a) Dendrogram of participant 1 based the results from the cluster analysis approach. P-values of bootstrap procedure are plotted above according clusters. (b) Plot of Hubert-Γ scores for participant 1 against number of clusters.
Figure 5-8.a shows the cluster solution obtained from the hook shots performed by
participant one. The dendrogram presented a clear two-cluster solution with high
dissimilarities between the two clusters indicated by the height of the tree branches. This
visual impression was also supported by the bootstrap procedure where both p-values for the
according cluster were < 0.05. The Hubert-Γ scores also supported the two-cluster solution
(compare Figure 5-8.b) with a maximum for two clusters. The left cluster contained trials
from greater distances and the right cluster captured trials from smaller distances, indicating
usage of different movement patterns by participant one as distance changed. With increasing
distance, movement patterns belonging to cluster 1 were observed until the 6m location,
where a switch to cluster two took place and accordingly a transition to a different movement
pattern (see Figure 5-9.a). This movement pattern was retained until the final distance for
shooting. When starting to shoot from 9m, the participant used movement pattern two until
the distance value reached 4m, and only switched to movement pattern one at 3 m. This
observation is consistent with a hysteresis effect, with the movement patterning dependent on
the direction of control parameter change, although this suggestion needs to be ratified by
further research.

115
Cluster distribution of Participant 1
Trial [#]
Clu
ster
[#]
1
2
2 4 6 8
2m
2 4 6 8
3m
2 4 6 8
4m
2 4 6 8
5m
2 4 6 8
6m
2 4 6 8
7m
2 4 6 8
8m
2 4 6 8
9m
increasing decreasing Fluctuations
Distance [m]
Dis
sim
ilarit
y [°]
10
11
12
13
14
2m 3m 4m 5m 6m 7m 8m 9m
increasingdecreasing
(a) (b)
Figure 5-9: (a) Plot of obtained clusters for participants 1 against trials grouped by throwing distance for increasing throwing distance (■) and decreasing throwing distance (▲). (b) Plot of dissimilarity scores for participant 1 against throwing distance for increasing (■) and decreasing (▲) throwing distance.
Figure 5-9.b shows the mean dissimilarity scores at each distance for the two
conditions. The scores during the increasing distance trials showed a sudden jump from 5m to
6m followed by high values at 7m distance. At 8m, the dissimilarities faded away and
increased slightly afterwards at 9m. For the decreasing condition, a similar sudden jump was
present at distance 5m to 4m, with a first sudden rise at 8m distance. Relating these findings
to data in the movement patterns associated with distance, it was apparent that, in both cases,
sudden jumps in movement pattern dissimilarity accompanied the transition from one cluster
solution to another. In light of the propositions discussed earlier, this observation could be
interpreted as the presence of critical fluctuations just before a phase transition.
In summary, for participant one the two expected movement patterns were identified.
Further key indicators were observed providing good support for the occurrence for a phase
transition but further investigations of time-scale behaviour are necessary in order to make
conclusive statements.

116
5010
015
0
Dendrogram of Participant 2(a)
Hei
ght
1 2 3 4 5
p<0.15 p<0.16
p<0.02
p<0.02 p<0.13
2 6 10 14
0.50
0.52
0.54
0.56
0.58
0.60
Number of Cluster [#]
Hubert Γ Statistic(b)
Figure 5-10: (a) Dendrogram of participant 2 based the results from the cluster analysis approach. P-values of bootstrap procedure are plotted above according clusters. (b) Plot of Hubert-Γ scores for participant 2 against number of clusters.
Figure 5-10.a shows the cluster solution for the hook shots performed by participant
two. The dendrogram showed a distinction into two main clusters with both containing two
further subclusters and one small cluster which contained only two trials. The Hubert-Γ scores
indicated a preference for partitions of 5 to 8 clusters which was also supported by the
bootstrapping procedure. Overall, the height of the dendrogram was lower compared to
participant one. This finding indicated that in general the dissimilarity between the clusters
was not too high, potentially indicating the presence of a scaling strategy where a single
movement pattern is scaled according to distance affordances, in contrast to switching
behaviour between globally different patterns. For ease of discussion the numbering scheme
of the clustering can be seen by the number at the bottom of the rectangles (Figure 5-10.a).
The lower p-values for clusters 1, 2, and 5 indicated that these partitions were not as stable as
cluster 4 and that some trials might have changed clusters between bootstrapping replications.

117
Cluster distribution for Participant 2
Trial [#]
Clu
ster
[#]
1
2
3
4
5
2 4 6 8
2m
2 4 6 8
3m
2 4 6 8
4m
2 4 6 8
5m
2 4 6 8
6m
2 4 6 8
7m
2 4 6 8
8m
2 4 6 8
9m
increasing decreasing Fluctuations
Distance [m]
Dis
sim
ilarit
y [°]
8
9
10
11
2m 3m 4m 5m 6m 7m 8m 9m
increasingdecreasing
(a) (b)
Figure 5-11: (a) Plot of obtained clusters for participants 2 against trials grouped by throwing distance for increasing throwing distance (■) and decreasing throwing distance (▲). (b) Plot of dissimilarity scores for participant 2 against throwing distance for increasing (■) and decreasing (▲) throwing distance.
Plotting the cluster solution against distance to targets in Figure 5-11.a made a
differential effect for the two conditions apparent. During the increasing distance condition,
participant two preferred three different patterns with cluster 1 for distances between 2m and
4m, cluster 4 for distances between 5m and 7m and cluster 6 for 8m and 9m accordingly. A
different picture was apparent for the decreasing distance condition. Starting from 9m, pattern
5 was used until 7m where the participant switched to cluster 4 just like in the increasing
condition. However, as cluster 4 was maintained until 5m some fluctuations towards cluster 5
were apparent. At 4m initially movements from cluster 4 were used, followed by one instance
of cluster 5and subsequent use of movement patterns which belonged to cluster 2 which pre-
dominated until 2m. At this location some alternating behaviour with cluster 1 was apparent.
In regards to the branching of the main clusters in the dendrogram, clusters 1 and 2
could be assigned to lower throwing distances whereas cluster 3 and 4 represented shots from
higher distances. Comparing the transitions between the two main clusters between
conditions, the clustering provided some indication for a hysteresis effect.. Whereas cluster 1
was mainly used during the increasing condition, cluster 2 was more prominent during the
decreasing condition. Similar, the occurrences of cluster 5 during the decreasing condition for
distances between 4m and 7m indicated some memory effect which potentially arose through
the previous usage of cluster 5 in contrast to the increasing condition. Potentially, for this

118
individual the intrinsic dynamics were influenced by the manipulation of the task constraints
yielding the observed behaviour.
Regarding the mean dissimilarity score in Figure 5-11.b a decreasing trend with
increasing distance was apparent. For the increasing condition from 2m to 5m, the
fluctuations decreased with a minimum at 6m followed by increases for 7m and 8m,
accompanying the switch from pattern 10 to pattern 6. For the decreasing condition the scores
rose from a minimum at 9m to a peak value at 7m followed by a minimum at 5m and rising to
their highest value at 2m. At 7m the switch from pattern 6 to pattern 10 took place.
In summary, the patterning for participant 2 was more varied than for participant 1 but
also followed a distance-related trend. Some indication of a hysteresis effect but no critical
fluctuations could be observed.
In conclusion, the results of the scaling experiment in a constrained physical
environment justified the application of the cluster analysis. Particularly for participant one,
the results showed strong indications of phase transitions where all predicted criteria were
fulfilled. For participant two the results were not as clear cut, with the movement patterning
showing a hysteresis effect only and smaller distinctive differences as distance varied.
Possibly, the constrained environment influenced the movement patterning in a different way
for this participant as compared to participant one. Both participants showed a trend for
differential use of movement patterning as throwing distances changed, which was expected
a-priori and which was identified by the cluster analysis to support its feasibility. However,
the bootstrapping procedure and the Hubert-Γ values showed that, when interpreting results of
a cluster analysis, a validation approach is necessary so that no naïve interpretation of the
cluster analysis is made.
Conclusion
In this chapter a technical method for analysing joint kinematics data from discrete
movements based on a cluster analysis was introduced. The method provided information
about similarities in the kinematics between movement trials assuming only limited a-priori
knowledge of their underlying structure. Based on the assumption that movement similarity
resembles some information about the involved attractors, the method can be used in
combination with a scaling procedure to investigate phase transitions in discrete movements.
The postulation of potential collective system states can be made objectively and apparent

119
arbitrary divisions between different movement patterns are avoided. Further, the analysis
enables the investigator to identify different accompanying characteristics of phase transitions
like hysteresis, critical fluctuations and directing subsequent research. Using data from three
different studies, the method could be successfully applied exemplifying its relevance for
studying movement coordination.
However, the method can only be used as a first approach investigating the underlying
order parameters of the specific task at hand since no explanation about the actual
construction of the order parameters is obtained from its implementation. Therefore, whilst
the method would be enhanced by subsequent kinematic investigation, crucial information
regarding the dynamic structure of different movement models can be gained. Especially
regarding the results from experiments 2 and 3, the methods are suitable to investigate the
proposed degenerate, discrete movement model. Further, based on the results in experiment 3
some further support was found for interpreting shooting distance as a candidate control
parameter, highlighting the feasibility of using a basketball hook shot as an exemplar model
for studying phase transition behaviour in discrete, multi-articular actions. Accordingly, in the
following chapters, an investigation of the basketball hook shot from a dynamical systems
theoretical perspective will be presented.
120
6 Chapter Six: Phase transitions in a discrete multi-articular action
Introduction
Summarising the progression of the research programme thus far, the findings from
Chapter 3 supported the candidacy of the basketball hook shot as a suitable movement model,
i.e., a discrete, multi-articular action with degenerate properties. In Chapters 4 and 5, the
necessary analytical procedure was developed to enable systematic investigation of the hook
shot. Both studies indicated that the throwing distance resembled an influential task
constraint. Therefore, the following requirements set out within this research programme have
been met: (i) identifying the basketball hook shot as a movement model, (ii) the use of a
cluster analysis approach combined with a scaling experiment, and (iii) manipulating
throwing distance as a candidate control parameter. Accordingly, the main aim of the present
chapter was to ascertain whether phase transitions in movement patterning for the basketball
hook shot would be triggered by changes in throwing distance.
With regards to the experimental procedure adopted thus far, several possibilities exist
to improve the methodology. For example, the instance of maximum wrist height was used in
Chapters 3 and 5 to determine the occurrence of ball release. However, the true point of ball
release may show some variation during movement execution and may change systematically
with throwing distance (Elliot, 1992; Miller and Bartlett, 1996). Hence, precise estimation of
the actual instance of ball release could reduce the influence of noise on derived movement
kinematics. For example, the kinematics of the throwing arm showed some peculiar
differences between participants (see Chapter 3), and increasing the precision of movement
kinematics regarding the arm could serve to further highlight differences in movement
patterning.
In this chapter the term ‘scaling’ will be used in two different contexts. When referring
to the experimental methodology scaling describes the continual manipulation of a candidate
control parameter in either an increasing or decreasing direction. When used in the context of
movement patterning, scaling describes the fact that a specific movement pattern is
continuously adapted into a different form which emphasises the way that movement patterns
are related to each other.

121
The results from Chapter 3 provided evidence for two distinct strategies used by the
participants dependent on manipulations of throwing distance. Whereas participant JA used
two different movement patterns, one at shorter distances and one at longer distances, the
remaining participants seemed to adapt a single movement pattern throughout the experiment.
For them, pattern alterations according to throwing distance were less distinct. Their scaling
strategy involved keeping the movement kinematics of the supporting leg and the throwing
arm relatively stable and varying mainly the kinematics of the non-throwing arm according to
throwing distance. In contrast, participant JA held the lower body kinematics stable but
exhibited peculiar changes in movement patterning in both arms. In regards to the skill level
of the participants, JA was a professional basketball player whereas the other participants
were either novices or intermediate players with prior experience at club level.. These results
suggested that the differences in movement patterning were influenced by skill level.
However, based on the single-participant design no strong conclusions could be made.
Further, the identification of phase transitions was hampered as the systematic scaling of
throwing distance in both directions was not employed and therefore hysteresis behaviour
could not be investigated.
In Chapter 5, a similar movement adaptation scheme was identified for the two
participants investigated. Results from the cluster analysis for participant one clearly indicated
a division into two distinct movement patterns according to throwing distance. Measurement
of pattern dissimilarity showed increased values within the switching regions for one
participant, suggestive of critical fluctuations, and comparison of the transition points between
the two movement clusters indicated hysteresis behaviour. Together, these results provided
support for the occurrence of global reorganization of movement patterning due to alterations
in throwing distance, indicative of phase-transition behaviour. In contrast, cluster analysis
applied to the movement kinematics of participant two showed less peculiar differences
between movement patterns according to throwing distance. This finding could be indicative
of scaling behaviour as observed in the three less skilled participants in Chapter 3. Since no
critical fluctuations were identified for this participant, further support for a scaling scheme
rather than global reorganization was provided. Nevertheless, analysis of the transition points
between movement clusters for participant two indicated hysteresis behaviour.
Both participants studied in Chapter 5 were professional basketball players which
questioned the relationship between choice of throwing strategy and experience level,
although no investigation of throwing performance was undertaken. Potentially, classification

122
of participants’ skill level, purely based on prior playing experience, was insufficient.
However, as this study was conducted with the special constraint of a low building ceiling
some caution must be exercised since this could have affected movement patterning.
Therefore, to further investigate the connection between throwing strategy and skill level it
was necessary to explore the movement behaviour of participants with a range of different
skill levels. Unfortunately, because of the complexity arising from the analysis method it was
not feasible to conduct an experiment with groups of sufficient sizes in order to make
conclusive statements on skill group membership. In addition, due to local difficulties in
accessing a large sample of professional basketball players, made it impossible to establish an
expert group either. Therefore, maintaining a range of different skill levels was decided on,
but to rate participants rather on actual performance during the experiment as reported in the
study by Button et al. (2003, N=6) and accordingly discuss results based on this performance
rating. This way, differences in adaptation strategies, despite similar levels of prior
‘experience’ as reported in Chapter 5, could be observed according to actual shooting
performance.
Accordingly, the following predictions in regards to movement patterning were
formulated. Based on the results from Chapter 3 where two different movement patterns were
identified only for the skilled performer, for skilled participants, the movement patterning
should follow a clear distinction into two different strategies which can be divided into
movements more prevalent at smaller distances and movement patterns more prevalent at
higher distances. The differences between the movement patterns should show changes in the
kinematics of both upper body segments, paired with high stability for the kinematics of the
supporting leg. Transitions between the movements should be accompanied by critical
fluctuations, possibly occurring at different distances depending on the direction of distance
change (indicating hysteresis behaviour). In contrast, according to the results from the three
less experienced performers in Chapter 3, less skilled players should show a scaling approach
where a single movement pattern is adapted across all distances and conditions. Movement
kinematics of the support leg and the throwing arm should reveal small changes and higher
deviations should be present in the kinematics of the non-throwing arm. Modifications to the
movement pattern as identified by the cluster analysis approach should show no critical
fluctuations however hysteresis behaviour should be present as in the case of participant 2 in
study three of Chapter 5. Hence, the first strategy exhibited by more skilled participants can
be attributed to a phase-transition following a bimodal attractor layout (Haken et al., 1985)
123
whereas the strategy adapted by less skilled performers resembles a uni-modal attractor layout
with transient modification of the attractor (Kostrubiec and Zanone, 2002).
As was argued during Chapter 2 providing a link between movement models used in
previous studies from a dynamical systems perspective and the basketball hook shot would
provide a better understanding of shared properties between discrete, multi-articular
movements and more traditional bimanual movements. Accordingly, in Chapter 3 the
curvature of the wrist trajectory was investigated and results were contrary to those inferred
from the literature on rhythmical movement patterns (Buchanan et al., 1997; Kelso et al.,
1991b), highlighting the need for further investigation. Based on these findings it was
expected that the radius of the wrist trajectory would increase with throwing distance as a
consequence of hand velocity increasing with throwing distance.
Further, in order to keep the analysis consistent with the biomechanics literature on
basketball movements, it appeared advantageous to maintain analysis of discrete kinematics at
the point of ball release as well as the mixed-effects modelling approach. In Chapter 3, the
time of occurrence of ball release was actually estimated from the instance of maximum wrist
height. As noted earlier, since this could have been a misleading measure, further
investigation based on the actual instance of ball release seemed necessary. Results from
Chapter 3 indicated also consistent patterning of the kinematics of the lower body across
participants and distances with the lowest variability exhibited by the professional player. In
contrast, the discrete kinematics of the upper body showed greater variations both across
distances and participants. In detail, the results showed increasing extension angles in the
right elbow, the right knee, and the left hip and greater flexion in the right hip with increasing
throwing distance. The most peculiar result in Chapter 3 concerned the high inter-participant
residuals in comparison to the intra-participant residuals which was much greater for all joint
angles. Performance scores obtained in Chapter 3 indicated a decreasing trend with greater
throwing distance. Based on the different experience levels of the participants it was expected
that performance levels during the experiment should follow the prior experience levels.
Together, these results served as the guiding hypotheses for the present experiment. However
as suggested, some unexpected differences in movement kinematics might occur because of
the altered task constraints in the present study (no defender).
With regards to the distinct properties of discrete movements (compared to rhythmical
movements) another hypothesis can be investigated. As discussed earlier, behavioural

124
information could be used by the performer in between trials to alter movement patterning in
subsequent trials. For example, when receiving information about the outcome of the
movement, an actor can use this information to alter execution in a subsequent trial (compare
Liu et al., 1999 for an example). A simple postulation could be formulated indicating that low
performance scores should be followed by high differences in the kinematics between
subsequent trials. This approach seems intuitively reasonable since when an actor provides a
poor performance (e.g. overshoots the target), he/she typically adjusts movement kinematics
in order to perform more successfully on the subsequent trial, therefore exhibiting greater
dissimilarities between these subsequent trials. When performance is good, it seems
reasonable to expect that movement kinematics would be kept similar in order to replicate the
trial outcome, resulting in low dissimilarities between subsequent trials. A limitation of this
approach would be that potential effects of the candidate control parameter distance would not
be taken into account. Analytically, the comparison of the similarity between subsequent trials
can be easily obtained from the calculations necessary for the cluster analysis approach.
Since, during the calculation of the distance matrix D the dissimilarities between all trials are
calculated, differences between subsequent trials present only a subset.
Materials and Methods
Participants
Eight males (Age=27±5, Height=175cm±16, Weight=81kg±14) participated in the
study. Participants JA, NI, and CA were semi-professional basketball players for the Otago-
Nuggets (New Zealand national franchise) in the national league. Participants DU, KE, RY,
and BR had at least played at club level whereas participant SH had no prior experiences in
playing basketball. All experimental procedures were approved by the University of Otago
Ethics committee. All participants used their dominant right hand for throwing and had not
experienced any injuries in the six months preceding the study.
Apparatus
A mobile basket fixed at a conventional height of 3.05m with a Plexiglas backboard
and a standard sized basketball (Size 7, FIBA approved) was used for all shooting trials.
Sampling frequency was set at 100 Hz during three-dimensional motion capture (Motion
analysis corp.) using 12 digital-cameras. A DV-camera was synchronized with the motion
analysis system to enable visual determination of the time of ball release.

125
Participants were prepared with passive reflective markers (5mm diameter) at the left
(l) and right (r) acromion, C7, sternum, lateral epicondyles humerus (l/r), radial styloid (r/l)
and ulnar (r/l), back of the right hand, spina illica anterior superior (r/l), spina illica posterior
superior (r/l), sacrum, lateral and medial epicondyles femoris (r/l), lateral and medial
malleolus (r/l), heel and toe marker (r/l) in order to identify anatomical landmarks. In addition
one marker each was placed on the tibia (r/l), on the lateral part of the femur (r/l) and the
humerus (r/l) and on the distal, dorsal part of the forearm. In contrast, to the preceding
chapters an extended marker set was used where information about the wrist flexion and
rotation as well as shoulder movement flexion, abduction, and rotation could be obtained.
Procedure
Participants attempted to score baskets without the help of the backboard using a hook
shot technique. The technique was verbally explained by an experimenter as a shot performed
with the dominant right hand whilst being airborne. The participant was asked to place their
body between the basket and the throwing arm as if to prevent a potential defender from
interfering with the throw. The throwing arm should thereby resemble a curvilinear pattern. If
the participants felt the need to adapt the movement to the specific distance in a certain way
they were allowed to apply the necessary changes. Participants started the movement with
their backs facing towards the basket and performed one ball bounce before shooting. This
routine was intended to resemble a typical game situation.
The throwing distance to the basket was varied from 2m to 9m in increments of 1m
after each trial block comprising ten shots and resulting in a total of 160 shots per participant.
During the ‘increasing condition’ (INC) the distance was scaled progressively from 2m to 9m
whereas during the ‘decreasing condition’ (DEC) distance was decreased from 9m to 2m
resembling the typical scaling procedure used in previous studies (see Chapters 3 and 5, Kelso
and Schöner, 1988; Schöner et al., 1986) where the throwing distance resembled a candidate
control parameter. Before data recording, participants performed a self-selected warm-up
regime for 15 minutes with instructions to perform a range of different shooting techniques.
When signalling they were ready for testing, the participants were prepared with the markers
and the particular throwing instructions were given after which they performed 10 shots each
from 2m, 5m, and 7m to familiarize themselves with the procedure. All participants
performed the same protocol starting with the INC condition followed by the DEC condition.
In between shots, 30s recovery time was provided to help prevent any fatigue effects.

126
Performance score was judged for each trial and recorded by an experimenter on a
seven-point scale (see Table 6-1).
Table 6-1. Basketball hook shot scoring system (adapted from Landin et al., 1993) Score Criteria
1 Airball; Ball misses completely by at least 2m
2 Airball less than 2m
3 Ball hits backboard first; no score
4 Ball hits backboard first; score
5 Ball hits outside of rim; score or no score
6 Ball hits inside or top of rim; score or no score
7 Ball passes cleanly through the basket without touching rim
Data processing
Coordinates of the reflective markers were reconstructed and three dimensional-
coordinates were obtained using Evart 4.6 software (Motion analysis corporation). After
visual inspection of frequency spectra of the displacement data, a 2nd order Butterworth filter
set at a cutoff-frequency of 10Hz was applied in both time directions. From the position of
markers, the hip joint centre was estimated using the procedure by Bell, Pedersen and Brand
(1990), and position of the shoulder joint by using the procedure by Rab, Petuskey and
Bagley (2002). Subsequently a 13-segment rigid body model was established using Visual3D
software (C-motion). Joint angles were calculated using the Euler convention, but only angles
in the primary joint plane of motion were used for further analysis, except for the right
shoulder joint, assumed to be the main contributor to throwing performance, for which all
three Euler angles were maintained. Shoulder joint kinematics of the left shoulder were
estimated through the included angle between the upper arm and the trunk for ease of
calculation. As in Chapter 3 and Buchanan et al. (1997), the radius of the wrist trajectory was
estimated by minimizing the sum:
( ) ( ) ( )21/ 22 2 22
01
1 N
k k kk
R x a y b z cN
σ=
⎛ ⎞⎡ ⎤= − − + − + −⎜ ⎟⎣ ⎦⎝ ⎠∑ (6.1)
Over the parameters (R0, a, b, c) where R0 was the desired radius and a, b, c estimated the
mid-point in space of the virtual circle, xk, yk, zk where the actual position of the wrist at time
frame k, and N was the number of total time frames. The sum was minimized using a
nonlinear least-square algorithm (lsqnonlin, Matlab 7.1).

127
Data analysis
The data analysis followed a two-fold strategy. The mixed-effects modelling approach
for the discrete ball release data was used, as in Chapter 3. This approach allowed population
and individual differences of discrete kinematic measurements at ball release to be identified.
The full mixed-effects model was:
20 1 2 3 0 1 1 ,
1,...,8, 1, 2, 2,...,9, 1,...,10ijkl ijkl ijkl j i i j i ijkly d d b b d b
i j k l
β β β β ε= + + + + + + +
= = = =(6.2)
With β representing fixed effects and b and ε representing random effects with: β0 = general
intercept, β1= linear coefficient, β2 = quadratic coefficient, β3j = condition coefficient, b0i =
participant intercept, b1i = participant linear coefficient, b1j,i = distance by condition
interaction, and ε = residual variance. The random effects were again assumed to be
independently within- and between-participants and normally distributed with a mean equal to
zero and diagonal covariance matrix.
( ) ( ) ( )2 2 20 1 1 ,0, , 0, , 0,i s i sl j i cdb b bσ σ σΝ Ν Ν∼ ∼ ∼
In this experiment no defender was present but two different conditions in regards to
the direction of distance changes were present, the same fixed-effects and nested random-
effects structures were utilized. Acknowledging that the occurrence of hysteresis can vary
between participants, the nested random-effects structure seemed appropriate in order to
represent inter-individual differences.
Subsequently, the continuous recording of each individual’s joint angle kinematics
was analysed using the cluster approach derived in Chapter 5. Movement trials were cut from
the instance of minimum knee joint flexion before jump-off to the instance of ball release as
determined from the DV-camera recording. The right wrist joint flexion angle, the right
shoulder joint flexion, abduction, and rotation angles, the included angle of the left shoulder
joint, right and left elbow joint flexion angles, right and left hip joint flexion, right and left
knee joint flexion, and the left ankle flexion angle were used for analysis. Typical trial lengths
were between 15 and 25 frames. Accordingly in order to avoid skewing the time-series, as
described in Chapter 5, movement trials were normalized according to mean trial lengths
which resulted in different lengths of normalized times series between participants. However,

128
since data analysis followed a single-participant approach the different lengths did not affect
further analysis. A switch between clusters was defined when three criteria were met: (1.) the
majority (i.e., at least 60%) of trials from an initial cluster changed at a specific distance. (2.)
the initial cluster had to provide the majority of trials in the preceding distance and (3.) the
new cluster had to provide the majority of trials at the subsequent distance. This approach
ensured that a switch between stable movement patterns occurred. Following the
recommendations of Toro, Nester and Farren (2007), differences between clusters were
subsequently investigated using angle-angle plots.
Skill levels of the participants were rated according to mean performance during the
experiment. Differences of the kinematics between subsequent trials were extracted from the
dissimilarity matrix D (see Chapter 5) from the entries of the first main diagonal and were
normalized according to the individual length of time series. Performance and dissimilarity
scores were analyzed using Friedman-Rank sum tests. The association between performance
scores and changes of kinematics in subsequent trials were analyzed using Kruskal-Wallis
rank-sum tests. In case of significant effects, post-hoc tests were performed using the
procedures described in Siegel and Castellan (1988, see p. 180-181 and 213-214). All
statistical analyses were performed using the R software (R Development Core Team, 2006).
As described in Chapter 5 the pvclust (Suzuki and Shimodaira, 2006a), scaleboot
(Shimodaira, 2006) and fpc (Henning, 2006) packages were used for the cluster validation
procedures and the lme package for the mixed-model procedures (Pinheiro and Bates, 2000).
Nonparametric post-hoc tests were performed using the pgirmess package (Giraudoux, 2006).
All remaining calculations were performed using custom software written in MATLAB 7.1
(see appendix). Significance levels for all statistical analysis were set at p < 0.05 and deemed
highly significant if p < 0.01.
Results
The results section is divided into sub-sections examining data from the performance
scores, mixed-modelling of joint angle kinematics, wrist radius and wrist linear velocity,
followed by the results from the cluster analysis and performance scores in relation to
kinematics.

129
Performance scores
In Figure 6-1 the rating of participants according to their mean performance scores is
shown. Two of the three expert players (NI and JA) were also the two best performers during
the experiment whereas participant CA was the second least successful thrower. Surprisingly,
participant SH, the novice performer with no prior experience in using the basketball hook
shot or in playing basketball, achieved an intermediate performance in comparison to the
remaining participants. The data indicated that the range of ability levels was spread more
towards the intermediate-skilled side of the experience continuum with no participants scoring
less than 3 out of 7 on average.
KE CA RY SH BR DU NI JA1
2
3
4
5
6
7
Participant
Mea
n pe
rform
ance
sco
re
Performance rating
Figure 6-1: Mean performance and standard deviation for each participant.
In Figure 6-2 the individual performance scores across throwing distances and
condition are shown.

130
2 3 4 5 6 7 8 9
1234567
Distance (m)
Per
form
ance
BR
2 3 4 5 6 7 8 9
1234567
Distance (m)
Per
form
ance
CA
2 3 4 5 6 7 8 9
1234567
Distance (m)
Per
form
ance
DU
2 3 4 5 6 7 8 9
1234567
Distance (m)
Per
form
ance
JA
2 3 4 5 6 7 8 9
1234567
Distance (m)
Per
form
ance
KE
2 3 4 5 6 7 8 9
1234567
Distance (m)P
erfo
rman
ce
NI
2 3 4 5 6 7 8 9
1234567
Distance (m)
Per
form
ance
RY
2 3 4 5 6 7 8 9
1234567
Distance (m)
Per
form
ance
SH
increasingdecreasing
Figure 6-2: Mean performance scores and standard deviation for each participant at each throwing distance for increasing (■) and decreasing (♦) throwing distance.
Friedman Rank-Sum tests for throwing distance attained almost conventional levels of
statistical significance, χ27 = 13.3, p < 0.07 when averaging over participants and blocking for
condition. Further, the distance effect was significant when averaging over conditions and
blocking for participants χ27 = 31.15, p < 0.01. Post-hoc analysis showed significant effects
between distances 3-5m, 3-7m, 5-6m, and 5-8m, which all indicated deteriorating
performance with increasing distance. Comparisons between participants showed a significant
effect when averaging over conditions and blocking for distance χ27 = 635.65, p < 0.01. Post-
hoc analysis indicated significant effects between CA-JA, CA-NI, JA-KE, JA-RY, KE-NI
which supported the findings obtained from the mean performance scores (compare Figure 6-
1). Condition effects were significant when blocking for participants χ21 = 4.5, p < 0.05 which
indicated that the participants were better during DEC compared to INC.

131
Mixed-effects modelling
Application of the mixed-modelling to the right shoulder rotation angles showed
serious deviations from normality for the residuals which could not be remedied applying
different model-fits. Therefore, no mixed-effects analysis of the right shoulder joint rotation
angles was undertaken.
Fixed-effects F-tests
Table 6-2: Wald-tests for fixed-effects structure for each joint angle. See equation 6.2 for details. * = significant, ** = highly significant
Angle Distance Distance^2 Direction right elbow 0.44 0.37 1.55 right shoulder flexion 1.75 0.85 7.51* right shoulder abduction 140.29** 0.18 6.49* right wrist 12.83** 0 39.31** left elbow 3.27 38.55** 23.5* left shoulder 0.04 0.08 0.01 right hip 0.58 30.35** 6.95* right knee 1.86 0.18 0.18 left hip 4.61* 17.97** 7.45* left knee 0.06 0.83 5.2 left ankle 19.13** 23.89** 3.03
Table 6-2 shows the results of the tests on the fixed effects structures for the different
joint angles at ball release which represented trends for the whole sample. For the right elbow,
left shoulder, right knee, and the left knee joint, no significant effects neither for throwing
distance nor for condition could be identified. For the right shoulder joint flexion angle, a
significant direction effect was identified with β3 = -2.31, indicating reduced flexion in the
upper arm during the DEC trials. The right shoulder abduction angle showed significant
effects for both linear distance and direction with β1 = 3.99 and β3 = -3.28, resulting in
decreasing abduction angles with increasing distance and higher abduction angles in the DEC
condition compared to INC. A similar trend was visible for the right wrist joint angle at ball
release with β1 = 1.61 and β3 = 6.64, which indicated higher flexion angles with increasing
distance and higher values during the DEC condition. In contrast, the left elbow showed a
significant quadratic trend paired with significant differences between conditions. The
according estimated coefficients were β2 = 0.39 and β3 = -4.98, indicative of a more flexed
arm during the DEC condition and increasing values with distance.
The right hip also joint showed significant effects for the quadratic trend and between
conditions with β2 = -0.14 and β3 = 1.43, suggesting increased extension angles with

132
increasing shooting distance plus greater hip joint extension during the DEC condition. The
left hip joint showed significant effects for all three population effects with coefficients of β1
= 1.05, β2 = -0.07, and β3 = -0.71 which resulted in increasing joint extension angles with
throwing distance and lower mean extension angles during the DEC condition. The left ankle
joint showed a significant increase in plantar flexion with increasing distance (coefficients β1
= 0.75 and β3 = -0.13) and no differences between conditions. Together the results for the
lower body indicated a more extended position at ball release with increasing distance.
Similarly, the results for the right shoulder and right wrist indicated greater joint extension
with increasing distance.
Standard deviation of random effects
In Table 6-3 the estimated standard deviations for the random effects parameter for the
different angles are shown. For the left shoulder a different random effects structure was
indicated by the data where both linear and quadratic effect were nested in condition within
participants. This model formulation was needed because some participants showed
considerable intra-individual differences between conditions resulting in inclusion of an
additional variance term for the quadratic effect (σcdd = 0.55).
Table 6-3: Sample standard deviations of random effects for each joint angle. σs = sample standard deviation of participant-specific intercepts, σsl = sample standard deviation of participant-specific slopes, σcd = sample standard deviation of slopes between condition, σ = sample standard deviations of residuals
Angle σs σsl σcd σ right elbow 13.15 2.01 0.64 17.53 right shoulder X 10.31 1.73 0.55 7.61 right shoulder Y 21.81 0.65 0.6 10.55 right wrist 15.31 1.1 0.79 9.77 left elbow 20.02 2.8 0.36 7.94 left shoulder 29.48 NA 4.97 8.59 right hip 17.47 0.74 0.32 2.73 right knee 39.61 1.11 0.54 5.25 left hip 5.4 0.31 0.09 2.24 left knee 5.31 0.42 0.21 3.22 left ankle 7.06 0.58 0.38 2.61
With the exception of the right elbow and the left knee, the between-participant
residuals (σs) were all greater compared to the general residuals (σ) showing that the inter-
individual variation of chosen mean angles was greater compared to the remaining intra-
individual variation. The highest inter-individual variations in mean angles (σs) were
exhibited in the left shoulder and the right knee ( > 29° ) compared to the lowest values shown
by the left leg complex ( < 7.1° ). The right shoulder-arm complex exhibited a somewhat

133
intermediate level of variation with the left shoulder-arm complex showing more variation.
Similarly, the right leg complex showed elevated variation values. The left leg complex
showed the lowest slope values (σsl < 0.6 ) and the highest values were exhibited by both
elbows with the left elbow showing more inter-individual variation ( > 2 ). The interaction
effects between participants and distance were greatest for the right arm and again smallest
for the left leg. This effect indicated that the participants varied their ball release postures
between conditions mainly in the upper arm without changing the position of the left leg. The
left shoulder showed the greatest variation in slopes between participants, which was in part a
result of the model fit because no participant specific slope was fitted which inflated the
estimate for the nested slope. Accordingly, the value could not be directly compared to the
remaining models which contained participant-specific slopes. As explained earlier, the
participants showed considerable variation between conditions which lead to the necessity of
fitting these different models in the first place. In regards to the residuals, the same general
trend as before was visible with the lowest values exhibited for the left and right leg and high
variations for the right shoulder-arm complex, indicating high levels of intra-individual
variation.
Individual model coefficients
Best linear unbiased predictors (BLUPs) were estimated in order to investigate the
intra-individual variation for those angle kinematics, showing no significant main effects for
linear and quadratic distance (compare Chapter 3 for details).

134
Right elbow
Slope coeff icient
-2 -1 0 1 2 3
BR
CA
DU
JA
KE
NI
RY
SH decinc
Right shoulder flexion
Slope coeff icient
-2 -1 0 1 2
Left shoulder linear
Slope coeff icient
-5 0 5
BR
CA
DU
JA
KE
NI
RY
SH
Left shoulder quadratic
Slope coeff icient
-1.0 -0.5 0.0 0.5
BR
CA
DU
JA
KE
NI
RY
SH
Right knee
Slope coeff icient
-3 -2 -1 0
Left knee
Slope coeff icient
-1.0 -0.5 0.0 0.5
BR
CA
DU
JA
KE
NI
RY
SH
Figure 6-3: Best linear unbiased estimates of model coefficients for each participant for the right elbow joint, right shoulder joint flexion angle, left shoulder joint linear and quadratic coefficient, right knee joint, and the left knee joint.
Figure 6-3 shows the resulting coefficient for the distance coefficients based on the
combined fixed-effects and BLUPs of the mixed-models. For both right elbow joint and the
right shoulder joint flexion angles it was apparent that the adaptations to throwing distance
lead to high variation in the inter-individual strategies. For the right elbow joint, three
participants used greater flexion angles (CA, KE, SH), three used smaller flexion angles (BR,
NI, JA) and two showed only minor changes with distance (DU, RY). Similar for the right
shoulder joint flexion angle the relative split was 4:3:1. Potentially this high variety in
participant-specific responses lead to the non-significant main effects. A somewhat different
trend was observed for the left shoulder joint where four participants showed different trends
between conditions for the linear trend and three of them also showed differences between
conditions in the quadratic coefficient. Especially pronounced were the differences between

135
conditions for participant CA. The linear trend of the left shoulder conditions were over 18
units apart from each other indicative of completely different strategies used. A similar effect
was apparent for the quadratic coefficient. These opposite linear and quadratic trends lead to
an effect where differences in angles at the lower distances were almost 30° apart from each
other. With increasing throwing distance they converged into a similar region, clearly
indicative of a hysteresis effect for this participant. For the right knee, the magnitude of the
slope coefficients were relatively small indicating only small changes in the ball release
posture of the right knee with increasing distance (except perhaps for participants KE and
DU). Similarly for the left knee, the estimated slopes were all quite shallow and followed
similar trends. Hence, for these variables there were potentially no true effects for distance.
Heteroscedasticity
In Table 6-4 the rankings of the heteroscedasticity and the ratio between the maximum
and minimum variance are shown (compare Chapter 3 for details).
Table 6-4: Ranking of estimated heteroscedasticity values for each participants for each joint angle and ratio of highest residuals divided by smallest residuals for each joint. Angle BR CA DU JA KE NI RY SH Ratioright elbow 1 3 8 4 7 2 5 6 3.7right shoulder X 2 1 8 5 7 6 4 3 2.35right shoulder Y 3 2 8 6 3 1 7 5 1.38right wrist 4 1 8 2 7 6 3 5 1.56left elbow 3 2 6 5 8 7 1 4 1.63left shoulder 4 1 8 2 7 5 3 6 2.3right hip 5 1 3 6 4 8 2 7 2right knee 5 2 4 6 3 7 1 8 2.7left hip 6 3 1 7 4 8 2 5 1.23left knee 4 5 1 7 2 6 3 8 1.63left ankle 7 3 1 5 2 8 4 6 2.25
The right elbow joint showed a high ratio value of 3.7 indicating that the difference in
intra-individual variations between the most and least variable participant was almost
fourfold. All remaining ratios were much lower ranging and fluctuating around a ratio value
of 2.
With the exception of participant CA, who tended to show the lowest variance, and
SH, who showed the highest variance across angles, there was no clear trend for participants
to exhibit consistently low or high variances across all joint angles. The ranks within
participants actually appeared randomly distributed with different trends between participants.
For example, participant DU showed high variability in the upper body and low variability in
136
the lower body. In contrast, participant BR showed higher variation in the lower body
compared to the upper body. Kruskal-Wallis rank-sum test indicated a significant main effect
for participants, however post-hoc tests indicated significant differences only between
participants KE and NI and CA and RY. In conclusion, heteroscedasticity values showed no
clear pattern in relation to skill level. Only differences between two participant pairings
became significant which were, in the cases of KE and NI between the second best and the
least successful performer, and in the cases of CA and RY between two less successful
performers.
Wrist velocity and trajectory radius
The mixed-model for the wrist velocity showed no general trends across participants
which indicated similar adaptation schemes for distance with only inter-individual differences
concerning the magnitude. The population effects for linear and quadratic distance (F1,1266 =
4203, p < 0.01, F1,1266 = 8.266, p < 0.01) were significant with coefficients (β1 = 0.63 and β2 =
-0.01) indicating an increase of the resulting wrist velocity with distance. The standard
deviation of the participant intercepts and residuals were σs = 0.9 and σ = 0.58 indicating
higher inter-individual variances between mean angles compared to intra-individual variation.
Hence, the displacement velocity of the wrist of the throwing arm clearly increased with
distance.
For the radius of the wrist trajectory, the mixed-model fit indicated homoscedasticity.
Further, no effects between conditions were observed and again a likelihood ratio test
indicated that the random effects structure for condition could be dropped. The fixed-effects
showed significant F-values for the linear and quadratic terms (F1,1266 = 3.93, p< 0.05, F1,1266
= 6.62, p< 0.05) with a small negative linear coefficient (β1 = -0.01) and a small positive
quadratic coefficient (β2 = 0.001) which resulted in a small increase of the trajectory radius
with distance leading to a difference in the radius of only 9 cm. Standard deviations for the
participant effects were higher compared to the residuals (σs = 0.14 and σ = 0.09). Regarding
the differences in slopes between participants, a standard deviation of σc = 0.9 was estimated
which resulted in high variations in the slopes between participants. As can be seen in Figure
6-4 the actual change in distance was negative for some participants (JA and NI) and only
participant SH showed clear increases of the wrist radii with distance.

137
Distance(m)
Rad
ius(
m)
0.20.40.60.81.01.2
2 3 4 5 6 7 8 9
DU KE
2 3 4 5 6 7 8 9
BR NI
CA
2 3 4 5 6 7 8 9
RY JA
2 3 4 5 6 7 8 9
0.20.40.60.81.01.2
SH
Figure 6-4: Estimates of wrist trajectory radii for each participant for each condition with superimposed model fit as estimated by the mixed-model.
Hence, overall the radii showed strong overlap across throwing distances indicating
only minor alterations with distance.
Intra-individual time-continuous results
Cluster analysis
The number of clusters was determined according to the bootstrapping values and the
results of the Hubert-Γ scores (see Chapter 5 for details). In Table 6-5 the results of the
bootstrapping procedure together with the number of trials contained in each cluster for all
participants are shown. All detailed results from the bootstrapping and the Hubert- Γ can be
seen in Appendix C. Since p-values could be established only if the cluster nodes contained
more than one item, clusters which consisted only of a single trial were marked NA. The
range of determined clusters varied between six and three clusters.

138
Table 6-5: Results of multi-scale bootstrapping procedure (p-values) for each cluster for each participant and number (no.) of trials contained in each cluster.
Cluster 1 Cluster 2 Cluster 3 Cluster 4 Cluster 5 Cluster 6 Subject p no. p no. p no. p no. p no. p no.
BR NA 1 94 48 92 4 96 23 67 5 79 78CA 98 4 56 19 93 18 78 9 NA 1 82 109DU 98 56 95 4 95 43 87 43 79 13 JA 94 40 81 25 56 41 92 54 KE 99 119 96 8 NA 1 90 13 96 7 NA 1NI 98 12 98 66 94 5 100 76 NA 1 RY 99 29 99 125 NA 1 NA 1 100 4 SH NA 1 93 131 100 28
Cluster 5 of Participant CA exhibited a very small p-value. However, the next branch
underneath that particular node contained only one main cluster and a singular object with a
p-value of 99 for the former which indicated strong validity for this particular node (see
Appendix C). However, because further separation was rejected by the Hubert-Γ scores this
inferior solution was nevertheless chosen for consistency. A similar situation was present for
cluster 5 for participant BR where the next branch underneath this node contained two main
clusters with p-values of 93 and 97 indicating high stability of these clusters (see Appendix
C). In contrast, for cluster 3 of Participant JA, p-values were small even several steps further
down the dendrogram indicating that this particular cluster was not very stable. For
participants CA, KE, RY, and SH 2/3 the total number of trials were contained each in one
big cluster, whereas for the remaining participants the trials were spread more evenly over
several clusters.
Individual cluster solutions
In order to facilitate comparisons with results from Chapter 3, angle-angle plots of
right shoulder-right elbow, left shoulder- left elbow, and left hip – left knee will be presented.
Since this represented only a two-dimensional representation it should be noted that
this representation does not always necessarily lead to clear separation between clusters since
the actual clustering was determined using the full 12 dimensional input space. The individual
results will be presented together, whereas discussion of the relation of skill level and
adaptation scheme is provided in the subsequent general discussion. The sequence of the
participants follows from lowest performance to highest performance according to Figure 6-1.

139
Participant KE
Regarding the clustering results for participant KE only one main cluster could be
identified which contained 119 trials in total with three smaller clusters and two singular
trials. Investigation of the angle-angle plot of the right elbow and the right shoulder abduction
angles indicated relatively consistent behaviour across movement clusters (compare Figure 6-
5.a). The plots followed a similar pattern with minimal movement in the elbow joint. All
motion of the throwing arm was achieved through movement in the shoulder joint and with
starting angles of -52°±9° STD and final abduction angles at ball release of -99°±11° STD.
For the kinematics of the left arm some differences between cluster 5 and the remaining trials
were visible (see Figure 6-5.b). In general, motion in the non-throwing arm was relatively
constrained with maximum ranges of motion for the elbow of 21° and for the shoulder joint
around 31°. Lower limb kinematics again showed very little variations across movement
clusters, with the exception of two outliers.

140
-20 0 20 40 60 80
-130
-120
-110
-100
-90
-80
-70
-60
-50
-40
-30
Right elbow flexion angle (°)
Rig
ht s
houl
der a
bduc
tion
angl
e (°
)
20 30 40 50 60
40
45
50
55
60
65
70
75
80
85
90
Left elbow flexion angle (°)
Left
incl
uded
sho
ulde
r ang
le (°
)
-10 0 10 20 30
-50
-45
-40
-35
-30
-25
-20
-15
-10
-5
0
Left hip flexion angle (°)
Left
knee
flex
ion
angl
e (°
)
(c)
(a) (b)
Cluster 1Cluster 2Cluster 3Cluster 4Cluster 5Cluster 6
Figure 6-5: Angle-angle plots for all movement clusters of participant KE. (a) Angle-angle plot of right shoulder joint abduction angles against right elbow joint flexion angles. (b) Angle-angle plot of left included shoulder joint angle against left elbow joint flexion angle. (c) Angle-angle plot of left knee joint flexion angle against left hip join flexion angle.
Investigation of the movement cluster distribution gave clear indication of a distance
related change in movement patterning. Clusters 4 and 5 were used during smaller throwing
distances whereas cluster 6 was used for all intermediate and greater distances. Regarding
switching behaviour, transitions between movement clusters could be identified from cluster 4
to cluster 1 at 4m (INC) and from cluster 1 to cluster 5 (DEC) at 3m. This observation
indicated a hysteresis effect. Cluster 1 was maintained longer during the DEC condition
compared to the INC and the final movement pattern was different from the initial movement
pattern. Both instances of movement cluster transitions were accompanied by rises in mean
dissimilarity scores (cluster 4 to cluster 1: 119°→141°, cluster 1 to cluster 5: 93°→148°) with
a third peak at 7m distance.

141
2 3 4 5 6 7 8 9 9 8 7 6 5 4 3 2
1
2
3
4
5
6
Distance(m)
Clu
ster
[#]
80
90
100
110
120
130
140
150
160
Fluc
tuat
ions
[°]
Figure 6-6: Distribution of movement clusters (●) against trials grouped by distance in ordering of actual occurrence for participant KE. Mean dissimilarity scores at each according throwing distance by direction are superimposed (-●-).
Regarding the analysis of kinematics the adaptations of movement patterns expressed
by participant KE clearly resembled a scaling scheme, where a single pattern was altered
according to throwing distance. However, although no clear changes between movement
clusters were identified in the angle-angle plots, in both cases movement cluster transitions
were accompanied by increasing mean dissimilarity scores, indicating that loss of pattern
stability was used in order to change movement patterning. This observation is usually a
typical indicator for critical fluctuations suggestive of global movement reorganization.
Participant CA
For participant CA, six movement clusters in total were identified. The distribution of
trials across clusters was highly skewed with cluster 6 containing 109 out of 159 trials.
Further, cluster 2 showed a p-value of only 56 which indicated very small stability. Inspection
of the movement kinematics showed quite distinct differences in the coordination of the right
shoulder-arm complex as can be seen in Figure 6-7.a. Focussing on movement clusters 2, 3,
and 6, two qualitatively different strategies could be identified between them. The difference
stemmed from different ranges of motion in both the shoulder and the elbow joint of the right
side. For the right elbow joint during movement cluster 6 only a small range of motion was
present (20° - 40°), whereas during movement clusters 2 and 3 ranges of 40° - 100° were

142
present. The starting angle for the shoulder abduction showed only small differences between
the movement clusters. However, at ball release shoulder joint abduction angles were much
lower for clusters 2 (-129°±8° STD,) which indicated greater joint abduction compared to the
remaining trials ( -98°±14° STD). A similar clear distinction between movement patterns was
visible in the kinematics for the left shoulder-arm complex (compare Figure 6-7.b). Whereas
the movement started with similar joint angle combinations (bottom/left), the plot greatly
diverged at ball release. For cluster 6 the left shoulder joint showed little movement range,
paired with greater range of motion in the elbow joint, moving from a more extended position
(~60°) to a much more flexed position (~100°). Investigation of the variation within cluster 6
showed considerable differences in the magnitude of the left shoulder joint angle which
ranged between 22° and 83°, without changing the overall appearance of the individual plots.
Comparing the variability of cluster 6 between the throwing-arm and non-throwing arm,
kinematic variations in the non-throwing seemed somewhat higher. During the remaining
trials the movements in the elbow joint were much smaller and exhibited greater shoulder
abduction angles at ball release (67° - 107°). Investigation of Figure 6-7.c indicated only
small differences in the lower limb kinematics of the left leg with some variations between the
movement clusters. The kinematics of movement cluster 6 showed greater ranges of motion in
the left knee joint, with greater flexion at the beginning of the movement and similar
extension angles at the end of the movement, although some trials from movement cluster 3
showed similar movement ranges.

143
20 40 60 80 100 120
-140
-120
-100
-80
-60
-40
-20
Right elbow flexion angle (°)
Rig
ht s
houl
der a
bduc
tion
angl
e (°
)
40 60 80 100 120
30
40
50
60
70
80
90
100
Left elbow flexion angle (°)
Left
incl
uded
sho
ulde
r ang
le (°
)
0 10 20 30-50
-45
-40
-35
-30
-25
-20
-15
-10
Left hip flexion angle (°)
Left
knee
flex
ion
angl
e (°
)
(c)
(a) (b)
Cluster 1Cluster 2Cluster 3Cluster 4Cluster 5Cluster 6
Figure 6-7: Angle-angle plots for all movement clusters of participant CA. (a) Angle-angle plot of right shoulder joint abduction angles against right elbow joint flexion angles. (b) Angle-angle plot of left included shoulder joint angle against left elbow joint flexion angle. (c) Angle-angle plot of left knee joint flexion angle against left hip join flexion angle.
The distribution of clusters indicated that clusters 1 to 4 were used from 2m to 6m
without exhibiting particularly high stability (see Figure 6-8). Potentially, a bias for
movement cluster 2 for the lower distances and movement cluster 3 for the higher distances
was present. At 7m, a switch to movement cluster 6 occurred which was maintained for all of
the remaining trials except for a few trials during 5m (cluster 3) and 4m (clusters 5 and 2).
The distribution of the dissimilarity scores showed increasing values just prior to settling on
cluster 6 (242°→293°), and subsequently lower values. A second peak was visible at 4m
(205°→363°) where for some trials cluster 2 was used, which is indicative of switching
behaviour between highly different movement patterns in subsequent trials. Participant CA
finished the experiment with a different movement compared to the movement at the
beginning which indicated hysteresis behaviour.
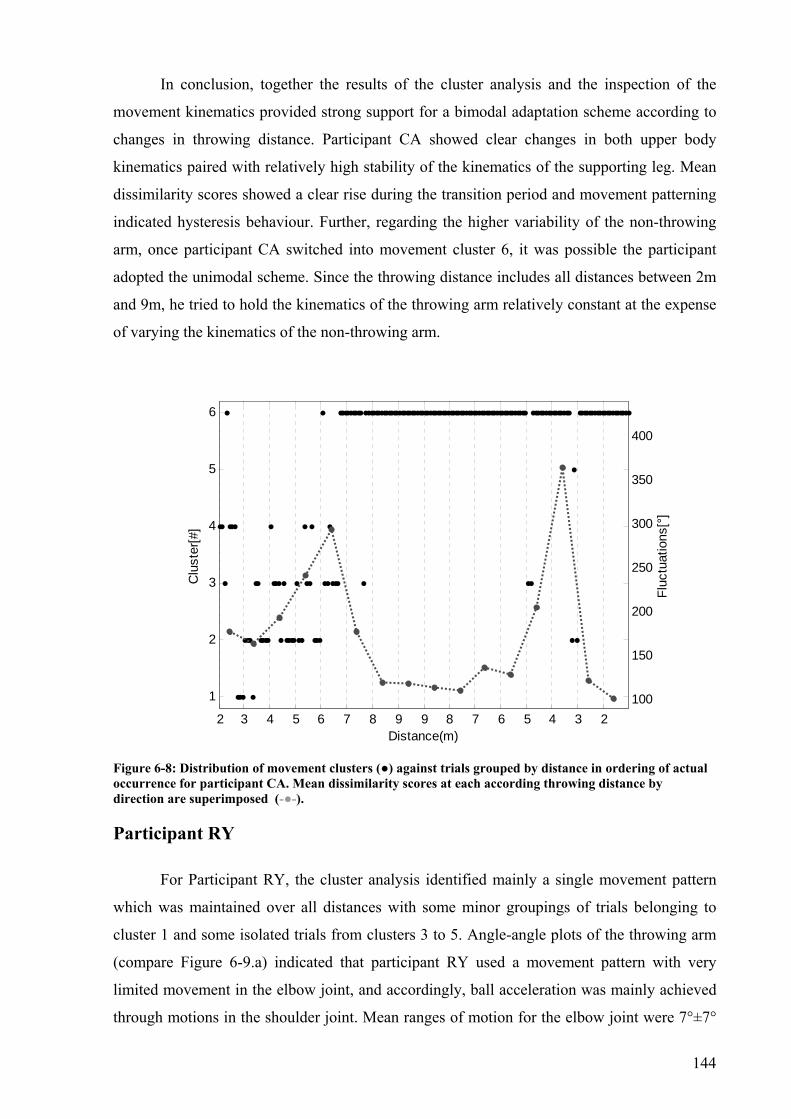
144
In conclusion, together the results of the cluster analysis and the inspection of the
movement kinematics provided strong support for a bimodal adaptation scheme according to
changes in throwing distance. Participant CA showed clear changes in both upper body
kinematics paired with relatively high stability of the kinematics of the supporting leg. Mean
dissimilarity scores showed a clear rise during the transition period and movement patterning
indicated hysteresis behaviour. Further, regarding the higher variability of the non-throwing
arm, once participant CA switched into movement cluster 6, it was possible the participant
adopted the unimodal scheme. Since the throwing distance includes all distances between 2m
and 9m, he tried to hold the kinematics of the throwing arm relatively constant at the expense
of varying the kinematics of the non-throwing arm.
2 3 4 5 6 7 8 9 9 8 7 6 5 4 3 2
1
2
3
4
5
6
Distance(m)
Clu
ster
[#]
100
150
200
250
300
350
400
Fluc
tuat
ions
[°]
Figure 6-8: Distribution of movement clusters (●) against trials grouped by distance in ordering of actual occurrence for participant CA. Mean dissimilarity scores at each according throwing distance by direction are superimposed (-●-).
Participant RY
For Participant RY, the cluster analysis identified mainly a single movement pattern
which was maintained over all distances with some minor groupings of trials belonging to
cluster 1 and some isolated trials from clusters 3 to 5. Angle-angle plots of the throwing arm
(compare Figure 6-9.a) indicated that participant RY used a movement pattern with very
limited movement in the elbow joint, and accordingly, ball acceleration was mainly achieved
through motions in the shoulder joint. Mean ranges of motion for the elbow joint were 7°±7°

145
STD compared to 53°±9° STD for the shoulder. Four clear outliers were present which were
contained in movement cluster 5. Although cluster 1 and cluster 2, based on the kinematics of
the throwing arm, showed considerable overlap, inspection of the kinematics of the non-
throwing arm showed clearly visible differences (compare Figure 6-9.b). The differences
stemmed mainly from the movement in the left elbow joint with mean angles of around
33°±6° STD for cluster 1 and 70°±3° STD for movement cluster 2. Qualitatively, the two
movement pattern exhibited great similarity. The plots showed a small range of overlap
between the two movement clusters but were in general quite well separated from each other.
In contrast, the plots of the lower leg kinematics (see Figure 6-9.c) showed considerable
overlap between the different clusters with some higher variation in cluster 2 compared to
cluster 1. But all plots followed a very similar pattern with a near -45° alignment.
0 20 40 60 80 100
-140
-120
-100
-80
-60
-40
-20
Right elbow flexion angle (°)
Rig
ht s
houl
der a
bduc
tion
angl
e (°
)
20 40 60 80 100
20
30
40
50
60
70
80
90
100
110
Left elbow flexion angle (°)
Left
incl
uded
sho
ulde
r ang
le (°
)
0 10 20 30-50
-45
-40
-35
-30
-25
-20
-15
-10
Left hip flexion angle (°)
Left
knee
flex
ion
angl
e (°
)
(c)
(a) (b)
Cluster 1Cluster 2Cluster 3Cluster 4Cluster 5
Figure 6-9: Angle-angle plots for all movement clusters of participant RY. (a) Angle-angle plot of right shoulder joint abduction angles against right elbow joint flexion angles. (b) Angle-angle plot of left included shoulder joint angle against left elbow joint flexion angle. (c) Angle-angle plot of left knee joint flexion angle against left hip join flexion angle.

146
The distribution of the movement clusters indicated some relation to throwing
distance, where movement cluster 1 was used mainly during greater distance, although cluster
1 was present throughout all distances. Accordingly hysteresis could not be identified for
participant RY. Fluctuations scores showed an increasing trend during the increasing
condition with a peak plateau in the vicinity of the main distribution of cluster 1 trials. During
the decreasing condition strong increasing values were visible from 4m downwards where
mean dissimilarity scores jumped from 122° to 168° from 4m to 3m and from 168° to 185°
degrees from 3m to 2m.
2 3 4 5 6 7 8 9 9 8 7 6 5 4 3 2
1
2
3
4
5
Distance(m)
Clu
ster
[#]
100
150
200
250
300
350
400
450
Fluc
tuat
ions
[°]
Figure 6-10: Distribution of movement clusters (●) against trials grouped by distance in ordering of actual occurrence for participant RY. Mean dissimilarity scores at each according throwing distance by direction are superimposed (-●-).
In summary, for participant RY a single movement pattern was used throughout the
experiment which was scaled according to the throwing distance. At greater throwing distance
a second pattern was used which showed some peculiar differences in the non-throwing arm
but was never stabilized for a longer period of time. Absence of critical fluctuations gave
further support for a scaling regime.
Participant SH
Cluster analysis indicated a three-cluster solution for participant SH, the smallest
number of clusters observed in all participants in the present study. Since cluster 1 contained

147
only a single trial only a two-cluster solution was obtained. The majority of trials were
contained in cluster 2 (131 trials) whereas cluster 3 contained only 28 trials. Investigation of
the angle-angle plots for the right elbow joint and the right shoulder joint abduction angles
indicated some strong differences between the two movement clusters (see Figure 6-11.a). For
movement cluster 2 the right elbow was almost completely extended during the whole
movement and maximum ranges of motion were small for both movement clusters (cluster 2:
16°, cluster 3: 18°), but showed peculiar differences in mean angles (cluster 2: 23°±2°, cluster
3: 51°±3°). During movement cluster 2, at the beginning of the movement shoulder joint
abduction angles were between -55° and -12°, whereas for movement cluster 3 starting angles
were between -110° and -67°. In contrast, shoulder angles at ball release showed similar
values across movement clusters (~-110°). For movement cluster 3 the plots indicated, to
some extent, a sequential strategy where the movement started with flexion of the elbow joint
followed by abduction of the shoulder, as indicated by the rectangular shape of the plots.
Kinematics in the left arm showed high variations across trials with no clear separation
between the two clusters (see Figure 6-11.b). The appearance of the plots were distinctively
different between the two movement clusters. Kinematics of the left leg exhibited high
stability across all trials, showing considerable overlap between trials.

148
0 20 40 60 80 100
-120
-100
-80
-60
-40
-20
Right elbow flexion angle (°)
Rig
ht s
houl
der a
bduc
tion
angl
e (°
)
10 20 30 40 5040
45
50
55
60
65
70
75
80
85
Left elbow flexion angle (°)
Left
incl
uded
sho
ulde
r ang
le (°
)
0 20 40 60
-80
-70
-60
-50
-40
-30
-20
-10
0
Left hip flexion angle (°)
Left
knee
flex
ion
angl
e (°
)
(c)
(a) (b)
Cluster 1Cluster 2Cluster 3
Figure 6-11: Angle-angle plots for all movement clusters of participant SH. (a) Angle-angle plot of right shoulder joint abduction angles against right elbow joint flexion angles. (b) Angle-angle plot of left included shoulder joint angle against left elbow joint flexion angle. (c) Angle-angle plot of left knee joint flexion angle against left hip join flexion angle.
Cluster distribution showed that movement cluster 2 was used from the beginning of
the experiment until 4m distance during the DEC condition where a transition to movement
cluster 3 occurred. Hence, these data clearly indicated a hysteresis effect (see Figure 6-12).
The fluctuations showed some minor variations in the usage of cluster 1 only. During the
switch between the clusters, a peak was visible where dissimilarity scores jumped from 132°
to 188° and high values were maintained for the remaining distances.

149
2 3 4 5 6 7 8 9 9 8 7 6 5 4 3 2
1
2
3
Distance(m)
Clu
ster
[#]
60
80
100
120
140
160
180
200
220
240
Fluc
tuat
ions
[°]
Figure 6-12: Distribution of movement clusters (●) against trials grouped by distance in ordering of actual occurrence for participant SH. Mean dissimilarity scores at each according throwing distance by direction are superimposed (-●-).
In conclusion, for participant SH, movement patterning resembled a bimodal attractor
layout. One movement pattern was used throughout most of the throwing distances until loss
of stability, indicated by critical fluctuations, leading to a transition to a new movement
pattern, also indicating a hysteresis effect.
Participant BR
For participant BR six clusters were identified with a relatively even spread of trials
across the clusters. The angle-angle plot of the right shoulder abduction and right elbow
flexion showed considerable overlap between the different movement clusters (see Figure 6-
13.a). In all trials the elbow started from a flexed position (> 90 °) and was extended during
the throwing movement accompanied by a parallel abduction of the shoulder. In contrast, the
joint angle relationship was similar at the start of the movement between the movement
clusters (denoted by overlapping trials, top/right of graph). There seemed to be some
differences in the ball release position between the clusters with movement cluster 6 showing
increased abduction of the shoulder. Differences were more pronounced in the angle-angle
plots of the left shoulder complex (see Figure 6-13.b). The distribution of movement clusters
6, and movement clusters 2 and 4 were quite distinct. Similarly to the right shoulder-arm
complex, the differences were pronounced at the end of the movement and stemmed mainly

150
from the elbow joint angles (bottom of graph, cluster 2: 84°±10° STD, cluster 4: 102°±9°
STD, cluster 6: 64°±6° STD). Whereas during the trials of movement cluster 6 the elbow joint
performed a pure extension movement, during movement clusters 2 and 4 the elbow joint first
flexed and then extended during the end of the movement. The left leg kinematics exhibited
much lower variations over distances and between movement clusters, a very similar
trajectory across trials, indicating a stable coordination pattern for the left leg (compare Figure
6-13.c). Potentially, trials from movement cluster 4 (-10°±3°) exhibited marginally higher
flexion angles in the knee and the hip compared to cluster 6 (-14°±3°).
0 50 100 150
-160
-140
-120
-100
-80
-60
-40
Right elbow flexion angle (°)
Rig
ht s
houl
der a
bduc
tion
angl
e (°
)
60 80 100 120
60
70
80
90
100
110
120
130
Left elbow flexion angle (°)
Left
incl
uded
sho
ulde
r ang
le (°
)
0 20 40 60 80
-100
-90
-80
-70
-60
-50
-40
-30
-20
-10
Left hip flexion angle (°)
Left
knee
flex
ion
angl
e (°
)
(c)
(a) (b)
Cluster 1Cluster 2Cluster 3Cluster 4Cluster 5Cluster 6
Figure 6-13: Angle-angle plots for all movement clusters of participant BR. (a) Angle-angle plot of right shoulder joint abduction angles against right elbow joint flexion angles. (b) Angle-angle plot of left included shoulder joint angle against left elbow joint flexion angle. (c) Angle-angle plot of left knee joint flexion angle against left hip join flexion angle.
Investigation of the cluster distribution over distance in Figure 6-14.b showed that
cluster 6 was initially the primary movement cluster chosen during throwing distances

151
between 2m and 7m (INC). At 7m distance the movement pattern changed and a transition to
movement cluster 2 occurred which was used until 9m. Subsequently, movement cluster 4
was used until 8m where some fluctuations between the movement clusters 4, 3, and 2 were
apparent. From 7m onwards cluster 2 was again the prominent cluster and lost stability at 5m,
and accordingly at 4m a switch to movement cluster 6 occurred. This movement pattern was
maintained until the end of the experiment. Hence, the clustering showed a clear relation to
throwing distance. Movement cluster 6 was the prominent movement pattern for the smaller
throwing distances, whereas clusters 2 and 4 were used for the intermediate and greater
distances accordingly.
Connecting the cluster distribution and the angle-angle plot, the progression of clusters
6→2→4→2→6 appeared to be mainly a result of adaptations in the kinematics of the left
arm, with relatively high stability in the kinematics of the left leg and the right throwing arm.
Therefore, participant BR belonged clearly in the unimodal adaptation category, with high
consistency in the kinematics of the throwing arm and the supporting leg and high variations
in the kinematics of the non-throwing arm. Regarding the mean dissimilarity scores in Figure
6-14, increasing values occurred just prior to switching of 2→4 (124°→173°), 4→2
(174°→186°), 2→6 (157°→186°), but no increase during switch 6→2, was observed.
However, in general the levels of fluctuation seemed to increase during the experiment and
accordingly the increases for the latter two transitions were only of smaller magnitude. With
regards to switching distances, participant BR showed hysteresis behaviour where movement
clusters were maintained for longer distance periods during the DEC condition compared to
the INC condition supporting the hypothesis. In conclusion, for participant BR clear support
for a scaling regime according to throwing distance was obtained.

152
2 3 4 5 6 7 8 9 9 8 7 6 5 4 3 2
1
2
3
4
5
6
Distance(m)
Clu
ster
[#]
100
110
120
130
140
150
160
170
180
190
200
Fluc
tuat
ions
[°]
Figure 6-14: Distribution of movement clusters(●) against trials grouped by distance in ordering of actual occurrence for participant BR. Mean dissimilarity scores at each according throwing distance by direction are superimposed (-●-).
Participant DU
Participant DU exhibited a 5-cluster solution with a relatively equal spread of trials
across the clusters. Only clusters 5 and 2 were somewhat smaller with only 13 and 4 trials
accordingly, whereas the remaining cluster contained between 43 and 56 trials. Inspection of
the angle-angle plot of the throwing arm showed small ranges of motion ( < 10°) in the right
elbow joint for most of the trials (see Figure 6-15.a). Although higher ranges were present
from some of the trials of movement clusters 4 and 5, comparison of the abduction angles of
the shoulder joint indicated that the motion ranges varied between the movement clusters (e.g.
clusters 1: 24°±6°, cluster 5: 31°±6°). However, no qualitative differences between the
movement clusters could be identified as differences mainly followed a linear trend. From the
plots for the left shoulder-arm complex, no clear separation between the clusters could be
observed either (see Figure 6-15.b). The plots showed only small ranges of motion for the
elbow joint and almost no motion in the left shoulder which was held constant around an
angle of 48°±1° for all trials. Compared to the coordination patterns of the right arm, the left
arm showed somewhat less structure and was marked by somewhat more aberrant behaviour.
Angle-angle plots of the left leg indicated high stability and strong repetition of the same
movement pattern across trials (see Figure 6-15.c).

153
0 10 20 30 40 50 60-130
-120
-110
-100
-90
-80
-70
Right elbow flexion angle (°)
Rig
ht s
houl
der a
bduc
tion
angl
e (°
)
50 60 70 80 90
25
30
35
40
45
50
55
60
65
70
75
Left elbow flexion angle (°)
Left
incl
uded
sho
ulde
r ang
le (°
)
0 10 20 30 40-50
-45
-40
-35
-30
-25
-20
-15
-10
-5
Left hip flexion angle (°)
Left
knee
flex
ion
angl
e (°
)
(c)
(a) (b)
Cluster 1Cluster 2Cluster 3Cluster 4Cluster 5
Figure 6-15: Angle-angle plots for all movement clusters of participant DU. (a) Angle-angle plot of right shoulder joint abduction angles against right elbow joint flexion angles. (b) Angle-angle plot of left included shoulder joint angle against left elbow joint flexion angle. (c) Angle-angle plot of left knee joint flexion angle against left hip join flexion angle.
The distribution of the cluster in Figure 6-16 showed a distance-related progression of
the movement clusters starting with movement cluster 5 for the lowest differences during the
INC condition. Subsequently, there was a switch to movement cluster 3 at 3m distance and a
switch to movement cluster 1 at 7m, distance which was maintained until 6m where a switch
to cluster 4 occurred. The cluster distribution exhibited high stability indicated by low
fluctuations between different movement clusters. Overall, Figure 6-16 gave clear indication
for a hysteresis effect since during the experiment no cluster was accessed twice
(5→3→1→4). Regarding the progression of the dissimilarity scores, the plot showed
relatively small variations across throwing distances and conditions since the maximum
differences between the smallest and the greatest value was only 33% (compare Figure 6-16).
A small rise at, 7m distance occurred (62°→86°) which also marked the transition between

154
two clusters with subsequent decreasing values. The switch between movement cluster 1 and
4 showed only a minor increase in the dissimilarity scores and the scores showed another
smaller jump up from 5m to 4m (63°→84°) and staying at a somewhat elevated level similar
to the values at this distances during the INC condition. Therefore, it could not be
conclusively stated that the switch from movement cluster 1 to 4 was accompanied by
increased fluctuations.
2 3 4 5 6 7 8 9 9 8 7 6 5 4 3 2
1
2
3
4
5
Distance(m)
Clu
ster
[#]
55
60
65
70
75
80
85
90
95
100
Fluc
tuat
ions
[°]
Figure 6-16: Distribution of movement clusters (●) against trials grouped by distance in ordering of actual occurrence for participant DU. Mean dissimilarity scores at each according throwing distance by direction are superimposed (-●-).
In conclusion, for participant DU a scaling scheme could be identified which resulted
from the adaptation of single unimodal movement pattern. However, as the hysteresis effects
indicated there were some differences in the detailed kinematics between the movement
patterns used at the beginning of the experiment and those at the end of the experiment.
Potentially, the attractor layout was changed during the course of the experiment similar to a
learning effect.
Participant NI
Participant NI showed two main clusters (2 and 4), two smaller clusters (1 and 3), and
a singular trial. The angle-angle plot of the right shoulder joint abduction angle and the right
elbow joint angle showed a relatively consistent behaviour across movement clusters, where

155
the elbow and shoulder were extended synchronously resulting in a near 45° plot (see Figure
6-17.a). Although the different plots showed considerable overlap there seemed to be a trend
for movement clusters 1 and 2 to exhibit somewhat smaller shoulder joint abduction angles (-
85°±7° compared to -74°±7°). Similar for movement cluster 4 the shoulder angles at ball
release were also somewhat greater (-113°±11°) compared to the remaining angles (-
139°±8°). For the left arm complex the different clusters showed strong overlap between each
other with some outlying behaviour during movement cluster 2 (see Figure 6-17.b). The
pattern started with similar joint angle combinations across clusters and varied more so
towards the end of the movement. Variation in the left arm seemed to be higher compared to
the throwing arm. Coordination patterns of the left leg were marked by stability small
differences across trials (see Figure 6-17.c).
40 60 80 100 120
-150
-140
-130
-120
-110
-100
-90
-80
-70
-60
Right elbow flexion angle (°)
Rig
ht s
houl
der a
bduc
tion
angl
e (°
)
50 60 70 80 90
95
100
105
110
115
120
125
130
135
140
Left elbow flexion angle (°)
Left
incl
uded
sho
ulde
r ang
le (°
)
0 20 40 60-90
-80
-70
-60
-50
-40
-30
-20
-10
Left hip flexion angle (°)
Left
knee
flex
ion
angl
e (°
)
(c)
(a) (b)
Cluster 1Cluster 2Cluster 3Cluster 4Cluster 5
Figure 6-17: Angle-angle plots for all movement clusters of participant NI. (a) Angle-angle plot of right shoulder joint abduction angles against right elbow joint flexion angles. (b) Angle-angle plot of left included shoulder joint angle against left elbow joint flexion angle. (c) Angle-angle plot of left knee joint flexion angle against left hip join flexion angle.

156
The distribution of the cluster indicated a relation of movement patterning and
throwing distance, as apparent in Figure 6-18. Participant CA started with movement cluster 1
which was used until 4m where a transition to movement cluster 2 occurred. This movement
pattern was maintained until 6m distance followed by a switch to movement cluster 4. This
movement pattern was used until 5m distance during the DEC condition, followed by switch
to movement cluster 2 which was not stabilized until 4m. At 2m some reoccurrences of
cluster 4 could be observed. Hysteresis effects were therefore present between clusters 1 and 2
and between cluster 2 and cluster 4, where the preceding cluster was always maintained for
longer. Fluctuation scores showed a somewhat unstable pattern with constant changes in
levels. Starting with high levels (121°) at 2m distance, the fluctuations showed a small
decrease which accompanied the switch from movement cluster 1 to movement cluster 2
(82°→102°). Rising scores were again visible around the distances where the switch from
cluster 2 to cluster 4 occurred (112°→146°), showing a plateau of greater values at 9m and
8m distance during the decreasing condition. Another peak was present during the switching
between movement clusters 4 and 2 (104°→129°) with a final peak at the 2m throwing
distance (132°), where some of the trials from movement cluster 4 mixed with movement
cluster 2. Whether critical fluctuations were present could not be conclusively determined.
2 3 4 5 6 7 8 9 9 8 7 6 5 4 3 2
1
2
3
4
5
Distance(m)
Clu
ster
[#]
80
90
100
110
120
130
140
150
160
Fluc
tuat
ions
[°]
Figure 6-18: Distribution of movement clusters (●) against trials grouped by distance in ordering of actual occurrence for participant NI. Mean dissimilarity scores at each according throwing distance by direction are superimposed (-●-).

157
The movement patterns used by participant NI followed an ‘up-scaling’ and ‘down-
scaling’ strategy without strong qualitative differences between patterns from small and
greater distances. The scaling strategy affected the patterning as the occurrences of the
transitions between the different movement clusters seemed to be delayed through hysteresis
effects. Hence, participant NI can be classified according to the scaling scheme exhibiting no
critical fluctuations but providing some evidence of hysteresis behaviour.
Participant JA
The cluster analysis identified four movement clusters for participant JA with clusters
sizes varying between 25 and 54 trials. The coordination pattern of the right elbow joint
flexion and shoulder joint abduction in Figure 6-19.a showed a highly stable coordination
pattern with synchronous extension of the elbow joint and abduction of the shoulder joint.
Across trials the arm position at ball release converged into a similar region and the main
differences between the movement clusters appeared to stem from the starting joint angles.
Whereas movement clusters 1, 2, and 3 showed relatively high overlap between each other
(shoulder: -72°±11° STD, elbow: 104°±4° STD), cluster 4 seemed to be somewhat distinct
although only by a very small margin (shoulder: -52°±8° STD, elbow: 113°±4° STD). In
contrast, the coordination of the left upper limb complex showed some stronger differences
between the different movement clusters. Cluster 4 showed only very limited movement in
the elbow joint (range of motion: 9°±5°), which was mostly held constant around 96°±1°
STD. In contrast, clusters 1 and 2 showed much higher ranges of motion (22°±11°) but were
individually paired with different shoulder joint angles. During movement cluster 3 shoulder
motion was only relatively constricted (15°±4°), movement cluster 2 showed somewhat
greater motion 20°±6°, making the two movements quite distinct from each other. During
cluster 1 an intermediate strategy seemed to have been used by the participant with
intermediate ranges of motion in both shoulder and elbow joints. Hence, movement cluster 3
showed clear differences compared to the remaining movement clusters whereas cluster 1, 2,
and 4 were somewhat similar and were differently scaled versions of the same movement
pattern. Lower leg kinematics indicated no differences between the trials and showed high
consistency across trials. Comparing the variation between left and right arm the angle-angle
plot of the left arm seemed to present more variability across trials.

158
20 40 60 80 100 120
-140
-120
-100
-80
-60
-40
Right elbow flexion angle (°)
Rig
ht s
houl
der a
bduc
tion
angl
e (°
)
40 60 80 10030
40
50
60
70
80
90
100
110
Left elbow flexion angle (°)
Left
incl
uded
sho
ulde
r ang
le (°
)
0 20 40 60-70
-60
-50
-40
-30
-20
-10
0
Left hip flexion angle (°)
Left
knee
flex
ion
angl
e (°
)
(c)
(a) (b)
Cluster 1Cluster 2Cluster 3Cluster 4
Figure 6-19: Angle-angle plots for all movement clusters of participant JA. (a) Angle-angle plot of right shoulder joint abduction angles against right elbow joint flexion angles. (b) Angle-angle plot of left included shoulder joint angle against left elbow joint flexion angle. (c) Angle-angle plot of left knee joint flexion angle against left hip join flexion angle.
As can be seen in Figure 6-20 the progression of the movement cluster followed
roughly 3 → 4 → 1 → 2. Regarding switching behaviour, participant JA showed a transition
from movement cluster 3 to movement cluster 4 at 7m distance. However, at 6m distance
movement cluster 7 was transiently used without being stabilized. Subsequently movement
cluster 4 was used until the 7m throwing distance, where a switch to cluster 1 occurred which
was stabilized and maintained until 4m, where the final switch to movement cluster 2 was
performed. Progression of the movement clusters clearly indicated hysteresis effects.
Regarding the transition between movement clusters 3 and 4 as pointed out earlier, the
movement kinematics of the non-throwing arm exhibited quite distinct patterns. Accordingly
the following transitions followed a scaling procedure, where subsequently between cluster 4,
1, and 3, the ranges of motion were increased.

159
Dissimilarity scores showed a small peak only for the transition between movement
clusters 3 and 4 (130°→161°) and followed a decreasing trend for the remaining trials.
Transitions 4→1 and 1→2 were not marked by increased fluctuations.
2 3 4 5 6 7 8 9 9 8 7 6 5 4 3 2
1
2
3
4
Distance(m)
Clu
ster
[#]
90
100
110
120
130
140
150
160
170
180
Fluc
tuat
ions
[°]
Figure 6-20: Distribution of movement clusters (●) against trials grouped by distance in ordering of actual occurrence for participant JA. Mean dissimilarity scores at each according throwing distance by direction are superimposed (-●-).
In summary, for participant JA the kinematics followed a scaling scheme in which a
unimodal pattern was adapted across distances and conditions. However, as for several other
participants, the movement patterns at the beginning and the end of the experiment showed
some distinct differences.
Changes in kinematics due to performance scores
In Figure 6-21 the performance scores were plotted against the summed differences in
joint kinematics between successive trials.

160
0 1 2 3 4 5 61234567
BR
Difference(°)S
core
0 1 2 3 4 5 61234567
CA
Difference(°)
Sco
re
0 1 2 3 4 5 61234567
DU
Difference(°)
Sco
re
0 1 2 3 4 5 61234567
JA
Difference(°)
Sco
re
0 1 2 3 4 5 61234567
KE
Difference(°)
Sco
re
0 1 2 3 4 5 61234567
NI
Difference(°)
Sco
re
0 1 2 3 4 5 61234567
RY
Difference(°)
Sco
re
0 1 2 3 4 5 61234567
SH
Difference(°)
Sco
re
Figure 6-21: Individual plots of the performance scores against the kinematic dissimilarities between subsequent trials for each participant.
For all eight participants, the differences showed considerable overlap between
different performance scores which indicated no simple relationship between the performance
score obtained in one trial and the similarity in kinematics with the subsequent trial.
Accordingly, individual Kruskal-Wallis Rank-sum test expressed no significant effects for
performance on kinematic differences. Participants showed very similar ranges, except for
RY, who exhibited several exceptional high deviations between subsequent trials, and to a
lesser extent participant CA.
Discussion
The present experiment investigated the effects of altering the throwing distance in a
basketball hook shot movement through a scaling procedure. The results presented evidence
for common trends across participants as well as inter-individual variations in adaptation
strategies. The results indicated partial support for the hypotheses, but also some specific
differences from the expectations.
It was hypothesized that the wrist velocity would increase with increasing throwing
distance. The results obtained in this study clearly supported this hypothesis with a highly

161
significant effect for the distance coefficient. In contrast, an increasing radius of the wrist
trajectory with increasing distance was expected but was not supported by the data. Although
significant effects for linear distance and squared distance were obtained, they resulted in only
very small increases of the radius. As visible in Figure 6-4, different adaptations to the
throwing distance were exhibited by the individuals and included both increasing as well as
decreasing radii. Only one participant gave clear indications for increasing radii with
increasing throwing distance. It has been suggested that a change of the radius trajectory
could be linked to changes between throwing for precision and throwing for distance
(Kreighbaum and Barthels, 1996). A similar trend, although in a different setting, has been
observed in studies of uni-manual coordination (Buchanan et al., 1997). Hence, the present
data did not provide strong support for this hypothesis and, in general, the adaptation of
trajectory radii of the wrist seemed to be influenced more by individual intrinsic dynamics
rather than by distance affordances alone. Similarly, no clear relation between skill level and
change in radii could be established either.
Performance was expected to show a general trend for decreasing scores with
increasing throwing distance and to exhibit differential effects between skill levels. The
former hypothesis was supported by the current findings, whereas for the latter, no conclusive
evidence could be obtained. Participants JA and NI demonstrated the highest performance
scores and belonged to the most experienced group. In contrast, participant CA showed the
second lowest performance despite being a semi-professional basketball player. Similarly,
participant SH who was a complete novice to basketball showed intermediate performance
better than participants CA, KE, and RY, with the latter two belonging to the intermediate
experience group. Accordingly, post-hoc analysis of performance scores between participant
indicated significant differences between participants JA and NI and the three least successful
performers.
The results from the mixed-effects modelling provided some support for the
hypothesis that the main sources of variations were located in the upper body kinematics
whereas lower body kinematics were kept stable. Nevertheless, the present study showed
some deviations from the results obtained in Chapter 3. For example, no significant effects for
the right elbow were found and the plot of individual coefficients showed high inter-
individual differences (compare Figure 6.3). Also, the left elbow joint showed a strong
significant quadratic effect of distance which was not found in Chapter 3. In both studies
significant main effects for the right hip joint angles were found, yet the estimated coefficients

162
were different between the two studies with greater hip flexion in Chapter 3 compared to the
present chapter. For the left hip joint angle, both chapters noted significantly higher extension
angles with increasing distance. These differences could be potentially explained based on the
notion that the hook shot movement per se did not prescribe the movement of the right leg.
Accordingly, actors could choose to use either a one-legged or a two-legged jump-off similar
to the distinction between a classic sky hook hot and a jump hook shot (see Chapter 2).
Therefore, in the former case higher flexion angles with distance could have been used.
Investigation of the standard deviations indicated that inter-individual variances were greater
compared to the intra-individual variances in the joint angles from Chapter 3. In both studies
variances of the left leg complex showed the lowest deviations with much higher variations in
the right leg, left arm and the right shoulder joint. Which supports the explanation regarding
the differences of the kinematics of the right leg. The results in the present study indicated a
strong increase in wrist flexion angles which was not investigated in Chapter 3. Regarding the
inter-individual differences in adaptation represented by the slopes in Chapter 3, the left
shoulder joint and the left elbow joint showed greater deviations across participants. This
result could be confirmed for the left elbow joint in the present study. Investigation of the
individual coefficient for the non-significant joint angles provided further support of high
inter-individual variations and in some cases intra-individual variations between conditions.
Both of these findings support the results from Chapter 3. The kinematics of the left shoulder
joint showed great differences with some participants applying only minor adjustments over
distances and others showing strong adaptations. Regarding heteroscedasticity, the present
study showed that intra-individual variance was not a simple function of skill level across
participants and that the variance could be differentially distributed across limbs (see also
Chapter 3 and Button et al., 2003). In conclusion, the results from the ball release data
confirmed high variations for the upper body segments between participants across distance,
and low variation for the left leg-segments.
Interpreting the trends observed for the kinematics of the supporting leg and the upper
body, the behavioural information inherent to this task may have acted in such way that the
movement of the left leg was determined to a large extent through the task constraints,
yielding common effects across participants. In contrast, movement in the upper body
segments were possibly less determined by the behavioural information but more influenced
by the intrinsic dynamics of the performer and shaped by musculo-skeletal constraints
(Carson and Riek, 1998). From this view, intrinsic dynamics and behavioural information

163
would interact within a single performer and coordination dynamics would show a much
higher inter-personal variation when behavioural information of the task was relaxed.
The main aim of the current experiment was to identify different adaptation strategies
according to throwing distance and investigate whether these strategies were linked to
performance levels. Of the eight participants only two, participants CA and SH, showed a
clear distinction into two different movement patterns across throwing distances.
Investigation of angle-angle plots gave clear indication for qualitatively different movement
patterns based on the kinematics in both arms. For the remaining participants (BR, DU, JA,
KE, NI, and RY) the adaptation strategies identified resembled more of a scaling approach,
where a single movement pattern was varied over distance. For these participants, movement
patterning for the support leg and the throwing arm showed high stability across distances and
conditions and variations between distances were visible in the kinematics of the non-
throwing arm. Therefore, the results obtained in this study supported the results obtained in
Chapter 3 and 5.
It was also hypothesized that the two-pattern strategy transitions between movement
clusters would be marked by increasing mean dissimilarity scores exhibiting critical
fluctuations as well as hysteresis effects. For both participants, the findings supported this
hypothesis, providing good evidence for transitional behaviour between different attractors
similar to observations from studies of bimanual coordination (Kelso et al., 1986). Therefore,
the results for these particular participants supported the notion of a bi-stable attractor layout.
For the single pattern strategy, based on the results obtained in Chapter 3 and 5, a hysteresis
effect but no critical fluctuations were expected, which was confirmed in the present study as
well. Accordingly, a shallow, unimodal attractor layout seemed to be present for these
participants.
Regarding the postulated connection of higher skill level with a bimodal attractor
layout, the present results were not supportive since both participants showed somewhat
intermediate performance. Similarly, for the unimodal strategy, participants covered the
whole range of performance levels from the best to the least successful. In this regards the
results of the present study resembles to some extent those reported by Sorensen et al. (2001),
Limerick et al. (2001), and Buchanan et al. (1997) where different strategies between
participants could be identified. Limerick et al. (2001) proposed that potentially
“anthropometric variability“ (p.560) might have contributed to the observed differences in

164
their study. In the present case though, a purely anthropometric explanation seems somewhat
implausible since participants SH and CA showed great differences in anthropometric
measures (HeightSH = 168, WeightSH = 63, HeightCA = 188, WeightCA = 90) despite using the
same strategy. Sorensen et al. (2001) did not provide any explanation for the observed
differences in pattern strategy between the participants. In the study conducted by Buchanan
et al. (1997), which investigated uni-manual movements, different strategies between
participants could be identified but no explanation was presented by the authors who stated
that “many reasons may exist” (p.271) including “physiological aspects, skill level, athletic
ability, experience in specific prior task” (p.271). Similarly, in the study presented earlier by
Post et al. (2000b) only participants who were able to perform anti-phase and in-phase
movements over all frequency ranges without exhibiting phase-transitions were included in
the experimentation. Unfortunately, the authors did not give any indications in what regards
these participants may have differed from “typical” participants exhibiting phase transitions.
Accordingly, in the present programme of work the actual reasons for adopting a specific
pattern strategy could not be inferred. Potentially, some interactions between neuro-muscular
constraints and the task may have contributed to the inter-individual differences and further
investigation seems necessary.
Comparing across participants for each strategy group, there were inter-individual
differences in actual movement patterning between the participants. For the unimodal sub-
group, in regards to coordination of the throwing arm, two main patterns were visible. For
participants BR, JA, and NI, action of the throwing arm was marked by a synchronous
extension of the elbow and abduction of the shoulder joint with similar ranges of motion
(elbow: 150°-50°, shoulder: -40- -150°). However, movements of the non-throwing arm
showed considerable differences between the participants and none of the patterns were
similar between participants. Participants JA and BR showed relatively ordered changes in the
kinematics of the non-throwing arm with changes over throwing distance, with relatively clear
separation between movement clusters. Conversely, participant NI showed great overlap
across movement clusters. Participants DU, RY, and KE showed a completely different
movement pattern in the throwing arm with small movements in the elbow joint and a large
range of motion in the shoulder joint. Similar to the other three participants, participant RY
showed clear differences in the non-throwing arm. The differences between the two
movement patterns could again be linked to the differences between a jump-hook and a sky-
hook shot (see Chapter 2). There were also subtle inter-individual differences between
patterns at the beginning and the end of the experiment. Whereas participants BR, NI, and RY

165
used the same movement clusters at the beginning and the end of the experiment, participants
JA, DU, and KE finished with different movement clusters compared to the start. Although
the movement coordination seemed to be constantly scaled, similar to the proposition made
by Kostrubiec et al.(2006), for some participants the attractor layout showed some persistent
changes resembling a learning effect (compare Zanone and Kelso, 1992; compare Zanone and
Kelso, 1997).
For the bimodal sub-group, the adaptations between participants also showed some
strong differences. Although both participants switched between movement patterns involving
either more active elbow or shoulder motion, the direction of change was different. Participant
CA switched from a movement pattern with synchronous movement in the shoulder and the
elbow joint of the throwing arm to a movement mainly using movement in the shoulder. In
contrast, participant SH started with the latter pattern and switched to the former. Whilst the
movement patterns using only the shoulder were very similar between participants, the
‘elbow-movement patterns’ were quite distinct. For participant CA, the motion was more
similar to the patterns observed in the unimodal group with a great range of motion in both
shoulder and elbow joints. In contrast, participant SH used a sequential pattern with much
smaller ranges of motion in both joint. Comparison of the movement pattern in the non-
throwing arm indicated further differences between the participants, where CA showed
relatively ordered behaviour across movement clusters, and SH showed great variation and
more aberrant movements.
Together, the results obtained across attractor groups and participants provide support
for the concept of degeneracy in multi-articular movements (Hong and Newell, 2006). It
appears that when several movement patterns are available, performers are able to
individually exploit redundant degrees of freedom leading to richer movement dynamics.
Potentially, for these tasks, intrinsic dynamics play a much higher role in movement
organization than in the case of relatively constrained movements, usually observed in studies
using uni- or bimanual movements. Although the results gave indication for relatively simple
attractor layouts (unimodal and bimodal), the range of movements which were encompassed
within these attractors deviated strongly from the attractors found in traditional movement
models. Seemingly, the mere fact that movement patterns were quite distinct from each other
does not necessarily indicate presence of different attractors, but potentially the route taken
between these movement patterns provides the necessary information about the attractor
layouts (Haken and Wunderlin, 1991). Revisiting the study by Limerick et al. (2001) on

166
weightlifting, two different movement patterns were revealed but individually different
transformation strategies existed between these two patterns. Whereas some participants
exhibited abrupt changes between the two movement patterns, others showed transitions more
like a continuous change between the two patterns (Limerick et al., (2001). Taken together,
these findings could imply that similar movements are represented by different numbers of
attractors for different actors. This is a major issue for future research on degenerate,
dynamical movement systems.
In this chapter, the coordination patterns observed in the non-throwing arm appeared
to be of equal importance as the movement of the actual throwing arm. Potentially, the
movements of the non-throwing arm were used in order to stabilize the kinematics of the
throwing arm similar to a dampening mechanism. Through this mechanism perturbations
could be redistributed across movement components in order to ensure task-achievement
(Saltzman and Kelso, 1987) and would underpin the notion of morphological structures
(Bernstein, 1967). In this case, recruitment of degrees of freedom could have been used in
order to stabilize attractors similar to the findings introduced earlier (Buchanan et al., 1997;
Fink et al., 2000).
As mentioned in the introduction of this chapter, it seemed likely that there would be
an interaction between the performance outcome and the distance affordance which would
influence differences between successive movement trials. Analysis of the relation between
performance outcome and adaptations in movement kinematics did not provide evidence for a
simple mapping between these two domains since no consistent effects could be found.
Potentially, this effect can be embedded into the framework of emerging and decaying
constraints where the emerging distance constraints overrides behavioural information
obtained from previous performance outcome (Guerin and Kunkle, 2004). Although this
interpretation remains speculative because it was not specifically tested in the present
experimental set-up, it remains an important issue for future research.
Another point of interest in the present study was related to postulated differences
between rhythmical and discrete movements derived earlier in chapter 2. Investigation of the
movement clusters distribution gave clear indication for switching behaviour between distinct
movement clusters in subsequent trials which is not possible for continuous movement. This
important finding marks a distinct difference between these two movement models in the case

167
of the basketball hook shot as representative for the class of discrete, degenerate multi-
articular movements.
Conclusion
The results of the present study provided further support that the basketball hook shot
resembles a useful movement model to investigate the application of dynamical systems
theory to the study of coordination in discrete, multi-articular actions. Using a scaling
methodology ubiquitous to investigations from a dynamical systems perspective, the results
provided evidence for phase transition behaviour in two participants. In both cases the
participants switched between two qualitatively different movement patterns which were
identified and validated by the cluster analysis approach. For the remaining participants no
such clear transitions were found and movement pattern adaptation appeared to follow a
continual scaling with the highest differentiations between the smallest and the greatest
distances. In order to provide further evidence for phase-transitions further investigations into
time-scale behaviour especially in regards to critical slowing down appears necessary.
The results also provided evidence for distinct differences between traditional
movement models utilized in studies from a dynamical systems perspective and the
movement model in the current chapter exemplifying a discrete multi-articular action. In this
chapter, great variations in selected movement patterns between participants became apparent,
which highlighted the degenerate features of the chosen movement model. Further, based on
observed switching between highly dissimilar movement patterns in subsequent trials, distinct
differences with rhythmical movement models, where such behaviour is not possible, were
highlighted in this chapter.
168
7 Chapter Seven: Investigation of critical slowing down in a discrete multi-articular action
Introduction
In Chapter 6, a scaling experiment using the basketball hook shot was conducted.
Following the studies from Chapter 3 and Chapter 5, throwing distance was systematically
manipulated and movement kinematics were recorded. Application of the cluster analysis
approach (see Chapter 5) provided evidence for two different movement coordination
strategies used by the participants. Participants used either a single type of movement pattern
and adapted this pattern in a scaling fashion to the throwing distance or they used two
qualitatively different movement patterns. Based on further investigation of hysteresis and
critical fluctuations, the two strategies were linked to the presence of attractors and
accordingly represented either a bimodal or a unimodal attractor layout. For the bimodal
layout, the two movement patterns could be clearly distinguished according to the movements
of the upper body. For the unimodal strategy, the kinematics of the throwing arm showed high
stability alongside greater variability in the non-throwing arm. In both strategies, the
movements of the supporting leg varied little across throwing distances, conditions, and
between participants. The literature review in Chapter 2 highlighted the importance of
analysing behaviour over different time-scales in order to determine whether behavioural
changes followed phase transitions. Given that for the bimodal movement strategy hysteresis
and critical fluctuations were identified, it is necessary to investigate critical slowing down
using a perturbation experiment to enhance understanding of the different attractor layouts.
Typically perturbation experiments investigate either the effects in body segments
other than the perturbed segment or the response in different phases during the movement due
to the perturbation. Accordingly, when a perturbation applied to one segment results in
behavioural changes in another segment, one can conclude that the segments are coupled to
each other during action. Similarly, if a perturbation applied during a specific phase of the
movement leads to changes in subsequent movement phases, the coordination of these
different phases are said to be dependent on each other (see Haggard, 1994). For example,
Button et al. (2000) investigated coordination in a ball catching task. A perturbation was
applied to the wrist of the catching-hand of the participants using a hysteresis brake which
was attached through a cord with a sweatband worn by them. The brake applied a resistive
force to the arm during the transport phase prior to the catch. For some participants changes in

169
hand aperture due to the perturbation were found, which indicated coupling between the
transport and grasp phases. Similar results were obtained by Haggard and Wing (1991) for a
prehension task. The perturbation was again applied during the arm transport phase. However,
from a dynamical systems perspective, perturbation experiments typically are not concerned
with the type of immediate coordination responses due to an applied perturbation but rather
with the time the movement systems needs to relax back to the state prior to the perturbation.
Through this approach, the stability of an attractor which underlies the movement can be
tested (see Chapter 2). According to this view, for a bimodal attractor layout the time scales
for relaxation (τrel), control parameter change (τp), and the equilibrium time scale (τequ) should
exhibit two different relationships depending on the value of the control parameter (Schöner
et al., 1986). During the pre- and post-transition areas the relationship rel p equτ τ τ should
hold, whereas within transition regions the time scales should collapse onto each other and
follow rel p equτ τ τ∼ ∼ (see Schöner et al., 1986 and Chapter 2). Accordingly, τrel should
exhibit greater values within transition regions compared to the pre- and post-transition
regions (compare also Figure 2-5). This effect is called critical slowing down (Haken, 1983;
Scholz et al., 1987; Schöner et al., 1986).
A classic study of critical slowing down in the context of movement coordination was
conducted by Scholz and Kelso (1989; compare also Scholz et al., 1987) who investigated
rhythmical extension-flexion movements of both index fingers. Participants performed either
in-phase or anti-phase movements synchronized to a metronome. Prior to the experiment
individual critical frequencies which lead to transitions from anti-phase to in-phase
movements for the participants were determined. Accordingly, participants started with
individually specified movement frequencies which were increased every 10s by 0.2Hz. A
torque, triggered by the occurrence of peak velocity during finger flexion, was applied to the
right index finger approximately 3s into each frequency plateau. This way the authors ensured
sufficient time for transient influence due to changes in movement frequency to become
negligible. At each frequency plateau, one perturbation was applied and participants were
instructed not to anticipate the occurrence of the perturbation. Critical slowing down was
defined as the time after perturbation until two successive stable phase trials were visible by
the authors. Results indicated no changes in critical slowing down during the in-phase pattern.
However, during the anti-phase movements τrel increased with increasing movement
frequency. Further, the perturbations lead to increasing numbers of phase transitions from
anti-phase to in-phase movements, the closer the movement frequency values came to the
predetermined critical movement frequency. Further increases beyond the critical frequency
170
indicated decreasing τrel which were similar to those obtained during in-phase movements
only. Hence, the experiment clearly corroborated the hypothesized critical slowing down
(Scholz and Kelso, 1989; Scholz et al., 1987). Post et al (2000b) applied a similar perturbation
methodology using an elbow flexion-extension movement. Investigation of τrel showed no
differences between anti-phase and in-phase patterns and indicated a general trend for
increasing values with increasing movement frequency. However, as pointed out in Chapter 2,
participants for this study were chosen based on the prerequisite that they were able to
perform the anti-phase pattern at all movement frequencies without phase transitions to in-
phase patterns. Both these studies utilized rhythmical movement models and no experiments
investigating discrete movements with a combined scaling and perturbation approach have
been reported in the literature. Therefore, it remains unclear to what extend these findings can
be generalized to discrete, multi-articular actions.
In summary, in order to investigate attractor stability and accordingly infer time-scale
behaviour, application of a mechanical perturbation to a moving segment has been
traditionally used in the dynamical systems literature. For this reason, it was decided to utilise
a similar procedure to the throwing movement in the basketball hook shot to investigate
effects on critical slowing down. For the bimodal throwing scheme identified in the basketball
hook shot, one might expect the occurrence of critical slowing down as movement patterning
undergoes a phase transition. In contrast, for the unimodal patterning which never enters a
critical region either no changes of the decay parameter or following the results from Post et
al (2000b) a linear decreasing trend should be present. With regards to the actual pattern of
decay for each control parameter plateau, according to the literature, the fluctuations after a
mechanical perturbation should follow an exponential decay pattern (Post et al., 2000b;
Schöner et al., 1986) as was indicated by the modal plot in Chapter 2. In Chapter 3 typical
movement times for the basketball hook shot were shown to be around 30ms, making it
unlikely that relaxation behaviour could be observed within a single trial. Hence, the surrogate
measure proposed by Schöner (1990), based on differences in movement execution between
subsequent trials, needs to be used with the basketball hook shot.
To investigate relaxation behaviour for both strategies (uni- vs bimodal) it was
necessary to investigate performance of participants from a range of different skill levels since
in Chapter 6 it did not become clear what the actual source for the two different strategies
was. Following the arguments provided in Chapter 6, further investigation of discrete
kinematics at ball release could uncover deviations in movement patterning across the three

171
different studies. Additionally, since in Chapter 3, an increase of wrist trajectory radii with
increasing throwing distance was found with no such trend identified in Chapter 6, further
investigation into this issue seems warranted.
Materials and Methods
Participants
Five males (Age=24±5, Height=183cm±8, Weight=80kg±4) participated in the study.
Compared to Chapter 6 the participants were slightly younger and taller (AgeCh6=27±5,
HeightCh6=175cm±16). Participants CR and CAL were semi-professional basketball players
playing for the Otago-Nuggets (New Zealand national franchise). Participants LU and AN had
played at club level whereas participant MI had no prior experience in playing basketball. All
experimental procedures were approved by the University of Otago Ethics committee. All
participants used their dominant right hand for throwing and had not experienced any injuries
in the six months preceding the study.
Apparatus
A mobile basket fixed at a conventional height of 3.05m with a Plexiglas backboard
and a standard sized basketball (Size 7, FIBA approved) was used for all shooting trials.
Sampling frequency was set at 100 Hz during motion analysis with a three-dimensional
motion capture system (Motion analysis corp.) using 12 digital-cameras. A DV-camera was
synchronized with the motion analysis system in order to determine the time of ball release.
Participants were prepared using the same marker set-up as described in Chapter 6.
Additionally, participants wore a wrist band on the right arm with a lightweight cord attached
to it. A metal clip was attached to the loose end of the cord which could be attached to a
weight of 2.5 Kg. The length of the cord was determined so that the cord would be taut when
the thrower reached approximately the position just before ball release. This way a
mechanical perturbation to the throwing arm could be applied which simulated other
perturbation experiments (e.g., Button et al., 2000). Based on a pilot study the mass chosen
resulted in a sudden jerk to the throwing arm which did not disrupt the overall movement for
safety reasons but affected the movements of the throwing arm. This set-up was also chosen
to simulate a foul made by a defender as might occur in an actual basketball game situation
which mimics a perturbation effect.

172
Procedure
The procedure was the same as used in Chapter 6 with the addition of the mechanical
perturbation. A metal clip was attached to the cord with the metal weight at predetermined
random trials to create a perturbation for the throwing movement. In order to disguise the
actual procedure of attaching the weight, the same sequence of operations was performed
between every trial so that participants could not infer from pre-trial preparation whether the
weight was being attached or not. Following the study from Scholz and Kelso (1989),
participants were instructed to not anticipate the occurrence of the perturbation. Before data
recording, participants performed a self-selected warm-up routine for 15 minutes with further
instructions to perform a range of different shooting techniques. Subsequently, reflective
markers were placed on key anatomical positions on the participants as well as the wrist band
when they have indicated to the researcher that they are adequately warmed-up. Next,
throwing instructions were given after which they performed five shots with and five shots
without the perturbation each from 2m, 5m, and 7m to familiarize themselves with the
procedure. All participants reported feeling comfortable with the wrist band on and reported
that the cord did not interfere with their movement execution. Participants performed the
same protocol starting with the INC condition followed by the DEC condition with ten shots
per distance. Accordingly, τp was set at ten trials. This value was chosen ensure a large
enough number of trials for the estimation of τrel. In between shots, 40 s recovery time was
provided to prevent fatigue effects and to provide sufficient time for trial preparation by the
experimenter. Perturbation trials were pre-determined using a random number generator with
a special weighting of trials three to five. This ensured sufficient recording of trials following
the perturbation as well as sufficient trials preceding the perturbation in order to decrease
transient influences of throwing distance changes (see Scholz and Kelso, 1989). For each
distance by condition, at least one trial was perturbed. Additionally two further trials were
perturbed in order to make the weighting of trials three to five less obvious for the
participants. Performance outcomes were recorded on a six-point nominal scale by an
additional experimenter (see Chapter 6 for details).
Data processing
The same procedures used in Chapter 6 were applied in the current experiment.

173
Data analysis
Similarly, the same procedures used in Chapter 6 regarding performance score, mixed-
modelling of joint angles, wrist displacement cluster analysis of continuous joint kinematics
were performed. Based on movement times, angle time curves for all participant were
normalised to 16 frames. In order to investigate critical slowing down, differences in
kinematics in subsequent trials were calculated in the same way as the distance matrix for the
cluster analysis set up (compare Chapter 6). To estimate τrel the dissimilarities were log
transformed, then τrel values were estimated through a simple linear regression procedure:
log( ) log( e ) log( )rel trialrel relfluctuation c c trial a trialτ τ τ∗= ∗ = + ∗ = + ∗ (7.1)
Trials used for the regression included all trials from the perturbed trials to either the
last trial of that particular trial block at that distance, or to the next perturbed trial within that
condition, based on whichever occurred first. Accordingly, for each participant, sixteen
coefficients together with confidence intervals using standard linear regression theory were
obtained. In order to adjust for the possibility of type 1 errors due to the number of statistical
tests, a Bonferroni correction was applied to the confidence intervals. The significance level
was set at p < 0.05 and deemed highly significant if p < 0.01 for all statistical tests.
Results
The results section is divided into sub-sections on performance scores, investigation of
critical slowing down and mixed-modelling of joint angles at ball release, wrist velocity, and
wrist radius.
The results of the cluster analysis are presented in detail in Appendix A. For
participants CR, AN, and MI the results of the cluster analysis provided clear support for a
unimodal attractor layout where hysteresis but no critical fluctuations were observed. For
participant LU, no clustering could be determined and all trials except one trial were grouped
into one cluster. For participant CAL a unimodal scheme was identified, however, the
distribution of movement clusters across throwing distances did not indicate hysteresis
behaviour. In summary, none of the participants exhibited phase transition behaviour.
Unfortunately, it was not possible to invite one of the participants who exhibited phase-
transition behaviour from the previous studies again because of limited access to the motion
capturing system.

174
Performance scores
In Figure 7-1 the rating of participants’ performance according to their mean
performance score is shown. The two most experienced players CR and CAL achieved the
best and third best performance of this sample of basketball players, respectively. As expected
participant MI, the novice performer, showed the least successful performance of all.
MI AN CAL LU CR1
2
3
4
5
6
7
Participant
Mea
n pe
rform
ance
sco
re
Performance rating
Figure 7-1: Mean performance and standard deviation for each participant.
In Figure 7-2 the mean performance scores per distance for each individual participant
can be seen. Overall a general trend for decreasing performance with increasing distance
could be viewed with some variation across participants.
2 3 4 5 6 7 8 9
1234567
Distance (m)
Per
form
ance
AN
2 3 4 5 6 7 8 9
1234567
Distance (m)
Per
form
ance
CAL
2 3 4 5 6 7 8 9
1234567
Distance (m)
Per
form
ance
CR
increasingdecreasing
2 3 4 5 6 7 8 9
1234567
Distance (m)
Per
form
ance
LU
2 3 4 5 6 7 8 9
1234567
Distance (m)
Per
form
ance
MI
Figure 7-2: Mean performance scores and standard deviation for each participant at each throwing distance for increasing (■) and decreasing (♦) throwing distance.

175
Friedman-Rank sum tests indicated that the effect for distance almost attained
conventional levels of statistical significance when blocked over condition χ27 = 13.7, p <
0.06, and a highly significant effect when blocked over participants, χ27 = 28.79, p < 0.01.
Post-hoc tests yielded significant effects for distance between 5m and 9m and between 7m
and 9m, which indicated deteriorating performance with increasing distance. For participants
a significant effect was found when performance scores were blocked over distance χ24 =
22.26, p < 0.01. Post-hoc tests indicated significant differences between participants CAL-MI,
CR-MI, and LU-MI. All remaining comparisons were statistically non-significant.
Critical slowing down
MI AN CAL LU CR0
50
100
150
200
250
Participant
Dis
sim
ilarit
y(°)
Mean Dissimilarity
Figure 7-3: Mean dissimilarity scores and standard deviation for each participant (better throwers further to the right).
Figure 7-3 shows the mean dissimilarities of the subsequent trials for each participant
in the order of actual performance during the experiment. The plot showed a slight tendency
for decreasing trend with increasing performance. A Kruskal-Wallis Rank-sum test indicated
a significant effect for participant, χ24 = 99.24, p < 0.01. Post-hoc tests indicated significant
differences between AN and CR, LU, MI, and CR and between MI and CAL and CR which
indicated that more successful participants showed smaller differences in movement
execution between subsequent trials. Regarding the magnitude of the fluctuations, the
obtained scores indicated relatively high differences of movement patterns between
subsequent trials, as can be seen the differences ranged between 98° for participant CR and
144° for participant AN.
Based on the preceding cluster analysis results, no phase transitions were observed for
any of the five participants. Therefore, no critical slowing down could be investigated and
only behaviour of between-trial fluctuations after the application of the mechanical

176
perturbation could be studied, which was postulated to follow an exponentially decreasing
pattern.
2 3 4 5 6 7 8 9 9 8 7 6 5 4 3 2
102
103
AN
Distance(m)
Dis
sim
ilarit
y(°)
2 3 4 5 6 7 8 9 9 8 7 6 5 4 3 20
200
400CAL
Distance(m)
Dis
sim
ilarit
y(°)
2 3 4 5 6 7 8 9 9 8 7 6 5 4 3 20
200
400CR
Distance(m)
Dis
sim
ilarit
y(°)
2 3 4 5 6 7 8 9 9 8 7 6 5 4 3 2
102
103LU
Distance(m)
Dis
sim
ilarit
y(°)
2 3 4 5 6 7 8 9 9 8 7 6 5 4 3 20
500MI
Distance(m)
Dis
sim
ilarit
y(°)
Figure 7-4: Individual plots of dissimilarity scores between subsequent trials in actual ordering of occurrence of unperturbed trials (●) and perturbed trials (●). For participants AN and LU a log-linear plot is shown in order to ease interpretation.
In Figure 7-4 the differences between successive trials were plotted against throwing
distance in the actual sequence presented during the experiment. In general, the plots showed

177
no distinct pattern and seemed to follow rather a random process. Regarding the behaviour
after perturbed trials the plots gave no visual indication that dissimilarities after a perturbed
trial followed an exponential trend. Hence, none of the plots resembled the proposed model
plot showed earlier (compare Figure 2-5) and actual variations between trials showed high
fluctuations for all participants at all times. Participants LU, AN and MI exhibited some high
peaks in their respective plots which marked for participant AN the transition between two
movement clusters whereas participants LU and MI seemed to exhibit rather outlying
behaviour. For participant LU, the resulting trial marked a completely different movement
pattern compared to the other trials. Yet, compared to the throwing movements observed in
Chapter 6 (for example BR), this movement pattern appeared to resemble a valid hook shot
(see also Appendix A). Accordingly, the movement could not be excluded. Further, as critical
slowing down was estimated for each distance by condition block, maintaining this singular
trial would not have influenced estimates for other throwing distances. With regards to
differences between subsequent trials from different throwing distances the plots gave no
clear indication that increasing or decreasing the distance by 1 m affected the differences
more substantially compared to trials within a specific distance bin. Similarly, kinematics of
the perturbed trials did not show any pronounced differences in relation to the unperturbed
trials. For participant MI a small trend over the course of the experiment was visible where
the fluctuations at the beginning of the experiment seemed to exhibit greater magnitudes
compared to the later trials, apart from the singular peak at 5 m DEC. With regards to the
magnitude of the dissimilarities, the plots supported the impression of Figure 7-3 and
indicated relatively strong changes in movement execution between subsequent trials.
The estimated time scales for each participant for each distance by direction bin are
presented in Figure 7-5. The estimates showed equally positive and negative values which
indicated accordingly increasing and decreasing fluctuations after the perturbation. However,
investigation of the confidence intervals showed that for each estimated slope coefficient a
value of zero was included. Thus indicating high probability for non-significant slopes,
therefore rejecting the hypothesis of an exponential decay pattern. Inspection of Figure 7-5
gave no indication for a systematic variation of the time scales with distance or switching
between different movement clusters. The wide confidence interval for participant AN at 5 m
INC was a result of the peak fluctuations mentioned earlier. For participant LU at 7 m DEC
only 4 trials were available in order to estimate the fluctuations which resulted in the large
confidence interval for this participant. Since the peak fluctuations for participant MI at 5 m

178
DEC occurred before the application of the perturbation, they did not influence the estimate of
τrel.
2 3 4 5 6 7 8 9 9 8 7 6 5 4 3 2
-1
-0.5
0
0.5
ANC
oeffi
cien
t τ
Distance(m)2 3 4 5 6 7 8 9 9 8 7 6 5 4 3 2
-0.5
0
0.5
CAL
Coe
ffici
ent τ
Distance(m)
2 3 4 5 6 7 8 9 9 8 7 6 5 4 3 2
-1
0
1
CR
Coe
ffici
ent τ
Distance(m)2 3 4 5 6 7 8 9 9 8 7 6 5 4 3 2
-2
-1
0
1
2
LU
Coe
ffici
ent τ
Distance(m)
2 3 4 5 6 7 8 9 9 8 7 6 5 4 3 2-1
-0.5
0
0.5
MI
Coe
ffici
ent τ
Distance(m)
Figure 7-5: Individual plots of estimates of τrel with confidence intervals for each throwing distance in actual ordering of occurrence for each participants.
In summary, participants with better performance scores showed smaller differences
between subsequent trials. There were no systematic changes in fluctuations between
subsequent trials and no indication of relaxation behaviour, neither after changes of throwing
distance, nor after a perturbation was identified.
Mixed-effect modelling
Investigation of the residuals obtained from application of the mixed-modelling to the
right shoulder rotation angles, as in Chapter 6, showed strong deviations from normality
which could not be remedied through different model-fits. Therefore, no mixed-effects
analysis of the right shoulder rotation angles was undertaken.

179
Fixed-effects F-tests
Table 7-1: Wald-tests for fixed-effects structure for each joint angle. * = significant, ** = highly significant
Angle Distance Distance^2 Direction right elbow 2.76 2.52 0.23 right shoulder flexion 0.87 13.17** 22.13** right shoulder abduction 41.84* 0.1 0.72 right wrist 1.55 1.31 17.66* left elbow 16.31** 0.17 54.33** left shoulder 0.23 0.5 7.49 right hip 0.05 3.31 12.13* right knee 0.02 1.79 10.0* left hip 24.32** 0.02 2.41 left knee 0.04 0.35 0.41 left ankle 4.6* 0.32 23.29**
In Table 7-1 the results for the fixed-effects are shown. No significant effects were
found for the right elbow joint, the left shoulder joint, and the left knee joint. For the right
shoulder joint flexion angle, significant main effects were found for the quadratic distance
coefficient and direction (β1 = -0.18 and β2 = 5.36), resulting from decreasing flexion angles
with increasing throwing distance and greater joint angles during the DEC condition
compared to INC. The mixed-model analysis reported a significant effect for the right
shoulder joint abduction angle with a coefficient of β1 = 3.44 which indicated increasing
abduction angles with increasing distance. Wrist joint angles, right hip joint angles, and right
knee joint angles all showed significantly greater extension during the DEC condition (β3wrist
= 4.84, β3rhip = -1.9, β3rknee = 2.82). Similarly, the significant effects for the left elbow joint
angle indicated greater joint extension at ball release during the DEC condition (β3 = -9.93) as
well as increasing extension angles with increasing distance (β1 = -0.98). For the left leg, the
hip joint displayed significantly greater extension angles with increasing throwing distance
(β1 = .56) and the ankle joint showed greater plantar flexion with greater throwing distance (β1
= -0.61), as well as greater mean flexion during the DEC condition (β2 = 2.45). In summary,
fixed effects structure indicated common trends across participants for the kinematics of the
supporting leg, the right shoulder joint and the left elbow joint.
Standard deviation of random effects
In Table 7-2, the estimated standard deviations for the random effects parameter for
the different angles are shown. For the left shoulder joint a different random effects structure
was indicated by the data where both linear and quadratic effects were nested in condition
within participants. This model was applied based on the strong intra-individual differences

180
exhibited by some participants between conditions. Through usage of this model, an
additional variance term for the quadratic effect (σcdd = 0.44) was included. For the left elbow,
the model-fits reported a very small intercept term for participants and likelihood-ratio test
indicated that this term could be dropped. Therefore, for the left elbow joint a simpler model
was used.
Table 7-2: Sample standard deviations of random effects for each joint angle. σs = sample standard deviation of participant-specific intercepts, σsl = sample standard deviation of participant-specific slopes, σcd = sample standard deviation of slopes between condition, σ = sample standard deviations of residuals
Angle σs σsl σcd σ right elbow 13.93 1.57 0.47 3.31 right shoulder flexion 16.24 1.51 0.75 5.15 right shoulder abduction 30.96 1.14 0.52 7.29 right wrist 15.85 1.11 0.53 7.36 left elbow 19.51 NA 0.88 8.32 left shoulder 27.53 NA 4.41 6.92 right hip 12.93 0.36 0.45 7.1 right knee 28.49 1.35 0.48 12.34 left hip 14.03 0.18 0.16 4.77 left knee 12.63 0.55 0.12 3.24 left ankle 19.21 0.74 0.29 3.5
Comparison of residuals and participant standard deviations σs showed that the inter-
individual variations were much greater compared to the intra-individual variation. The high
inter-participant standard deviations were estimated for the right shoulder joint abduction
angle, the left shoulder joint, and the right knee joint (all > 27°). The smallest values were
found for the left knee joint and the right hip joint (< 13°). In contrast, for the general
residuals, the greatest value was found for the right knee joint which was about 1.5 times
higher than the second highest value of the left elbow joint. Across segments, small values
were obtained for the left leg complex (<5°). With regards to the variation in participant
specific linear slopes, the smallest variation was observed for the left leg complex and the
right hip joint (<0.75). Similar trends could be observed for the standard deviations of the
direction by slope interactions. The estimates for left elbow joint and the left shoulder joint
were both influenced by the missing participant-specific slope, which resulted in the high
values observed. However, for the left elbow joint, the magnitude of the standard deviation
was only slightly higher compared to the remaining joint angles. This finding was interpreted
as support for the chosen model-fit. In summary, the standard deviations indicated stronger
differences between conditions for upper arm kinematics and higher similarities for the
kinematics of the left leg.

181
Individual model coefficients
Right elbow
Slope coefficient
-1.0 0.5 2.0
AN
CAL
CR
LU
MI
Right shoulder flexion
Slope coeff icient
0.0 1.5
Left shoulder linear
Slope coefficient
-6 -2 2
Left shoulder quadratic
Slope coeff icient
-0.6 0.0 0.6
AN
CAL
CR
LU
MI
Right Hip
Slope coeff icient
0.0 0.5 1.0
AN
CAL
CR
LU
MI
Right knee
Slope coeff icient
-2.5 -1.5 -0.5 0.5
AN
CAL
CR
LU
MI decinc
Left knee
Slope coeff icient
-0.6 -0.2 0.2 0.6
AN
CAL
CR
LU
MI
Figure 7-6: Best linear unbiased estimates of model coefficients for each participant for the right elbow joint, right shoulder joint flexion angle, left shoulder joint linear and quadratic coefficient, right hip joint, right knee joint, and left knee joint.
Investigation of the individual coefficients based on the estimated fixed-effects and
BLUPs for the joint angles, which showed non-significant main-effects, displayed high inter-
individual differences in response to changing throwing distance (compare Figure 7-1). For
the right elbow joint the resulting coefficient could be separated into three different strategies.
Whereas participants MI and LU showed greater flexion angles in the elbow joint with
increasing throwing distance, participants CR and CAL adopted greater extension angles with
increasing throwing distance and participant AN did not show any systematic variation in the

182
elbow joint with throwing distance. A similar split of strategies was identified for the left
shoulder joint for both linear and the quadratic trends. However, for this joint angle
participants CR and AN even displayed opposite strategies between conditions which
deviated in case of participant CR quite strongly. As a result, for participant CR, the
combined effect of the estimated coefficient lead to increasing values for the INC condition
and decreasing values for the DEC condition. These observations, when combined with the
significant main effect for condition, lead to similar values for the higher distances (compare
participant CA in Chapter 6). The right shoulder joint flexion angles showed similar positive
coefficients for three participants and only small coefficients for two participants which also
exhibited marginally different strategies between conditions. Similarly, for the right hip joint,
all participants exhibited a similar positive trend except for participant LU who showed
differences between conditions with opposite signs. The right knee joint again showed greater
variations between conditions with values varying between -2.17 and 1.06, possibly bringing
about the statistically non-significant population effects. Similarly, for the left knee joint, the
variations between participants were much smaller with small estimates of absolute
coefficients; nevertheless they exhibited different strategies between conditions. In summary,
for the right shoulder joint flexion angles, the right hip joint and the left knee joint the non-
significant fixed-effects were reflective of small individual changes, whereas for the
remaining joint angles, potentially the different trends exhibited by participants influenced the
overall sample effects.
Heteroscedasticity
Table 7-3: Ranking of estimated heteroscedasticity values for each participants for each joint angle and the ratio of highest residuals divided by smallest residuals for each joint angle.
Angle AN CAL CR LU MI Ratio right elbow 5 1 2 4 3 2.14 right shoulder X 3 2 5 4 1 1.77 right shoulder Y 5 3 2 4 1 1.78 right wrist 3 1 2 5 4 2.19 left elbow 1 2 4 3 5 1.23 left shoulder 2 3 1 4 5 1.31 right hip 1 5 3 2 4 2.22 right knee 1 5 4 3 2 2.38 left hip 1 5 4 3 2 1.69 left knee 3 5 4 2 1 1.73 left ankle 4 5 2 3 1 2.58
In Table 7-3 the rankings of the inter-individual variance estimates and the ratio of the
maximum to minimum variance for each angle are shown. The maximum ratio was observed
for the left ankle joint. However, in comparison to the remaining ratios the value of 2.58 was

183
not too different from the remaining ratios obtained, which were distributed around ratios of
2. The only exceptions were the left elbow joint and the left shoulder joint which showed
ratios < 1.4 indicating that the residuals between participants were relatively similar.
Regarding the distribution of the heteroscedasticity ranks across participants, no clear
patterning could be identified which was confirmed by a non-significant Kruskal-Wallis rank-
sum test.
Wrist velocity and trajectory radius
Application of the full model to the linear wrist velocity data indicated that a simpler
model would already fit the data sufficiently. Using likelihood-ratio tests, a model without an
interaction term for the direction and participant specific slope was chosen. Significant fixed-
effects were found for all three coefficients (F1,784 = 4403.58, F1,784 = 11.04, F1,784 = 4.41, β1 =
0.64, β2 = -0.01, and β3 = -0.07) which indicated that velocity increased with increasing
distance, with slightly lower wrist velocity used by participants during the DEC condition.
Residual standard deviations for the participant effect were threefold higher than residual
variance (σs = 1.15, σ = 0.37).
For the wrist radius data, the model fit indicated that the random effects for direction
could be dropped. The fixed-effects test indicated a significant effect for linear distance (F1,784
= 6.32, p < 0.05) and direction (F1,784 = 5.78, p < 0.05) with a small coefficient for both the
linear trend of β1 = 0.02 and direction of β3 = -0.02. These data resulted in small increases of
the trajectory radii with increasing distance and lower radii during the DEC condition
compared to the INC condition. However, the actual difference between the radii at 2m and at
9m estimated by the fixed effects components was only 7cm. Residuals variance exhibited
higher inter-individual variance (σs = 0.10m) compared to intra-individual variances (σ =
0.08m).

184
Distance(m)
Rad
ius(
m)
0.4
0.6
0.8
1.0
2 3 4 5 6 7 8 9
CAL
2 3 4 5 6 7 8 9
CR
2 3 4 5 6 7 8 9
LU
2 3 4 5 6 7 8 9
MI
2 3 4 5 6 7 8 9
AN
Figure 7-7: Estimates of wrist trajectory radii for each participant for each condition with superimposed model fit as estimated by the mixed-model.
Visual inspection of the radii against distance (see Figure 7-2) showed a clear trend
only for participant AN, whereas for the remaining participants the changes were marginal.
Discussion
The present experiment investigated the effects of altering the throwing distance in a
basketball hook shot movement through a scaling procedure. At random times the movement
of the participants was disrupted using a mechanical perturbation. Investigation of
fluctuations between subsequent trials provided no evidence for relaxation behaviour in the
basketball hook due to the perturbation. Since none of the participants exhibited phase
transition behaviour, critical slowing down could not be investigated.
Regarding the movement patterning strategies found in Chapter 3 and Chapter 6, the
current study revealed somewhat different findings as none of the participants used the
bimodal attractor strategy. All five participants exhibited behaviour indicative of a unimodal
attractor where a single movement pattern was scaled according to throwing distance. With
regards to the movement patterns, two different strategies across participants were apparent.
In contrast, participants CR and CAL used a movement patterning involving synchronous
movements in the shoulder joint and the arm, participants LU, MI and AN used a pattern with
little movement in the elbow joint where ball acceleration was achieved by movements of the
shoulder joint. Hence, the same two movement patterns, observed in Chapter 6 and Chapter 3,
were also identified in the current study, strengthening support for the role of neurobiological

185
degeneracy in performance of the basketball hook shot. Similarly, movement of the non-
throwing arm showed greater variation compared to the throwing arm and kinematics of the
supporting leg were similar across distances, with participants displaying the same pattern
observed in previous studies. Since the unimodal patterns used by the participants showed
hysteresis effects but no critical fluctuations, the results matched those obtained in Chapter 6,
(except for participant CAL who did not show clear hysteresis behaviour). Participant CR
showed a progression between qualitatively similar patterns, however, with different
movement clusters at the beginning and the ending of the experiment. In conclusion, further
support for more permanent adaptation of the attractor layout, similar to observations from
participants DU, JA, and KE, in Chapter 6 was obtained.
Regarding the analysis of critical fluctuations in the current chapter, no investigation
of critical slowing down was possible since none of the participants exhibited a bimodal
attractor layout. Analysis of the fluctuations did not show any ordered behaviour and the
fluctuations seemed to follow a random pattern. Hence, no exponential decay pattern could be
identified for any of the participants. Investigation of τrel did not exhibit a negative coefficient
which indicated that no relaxation behaviour was indicated by the data. The results can be
interpreted from three different viewpoints. First, it is possible that the measurement used was
not adequate to identify relaxation behaviour in this task. This experiment was the first study
to investigate critical slowing down in discrete, multi-articular movement and this explanation
seems reasonable. Second, it is possible that the applied perturbation simply was not strong
enough in order to elicit the desired effects. Since the weight was determined based on pilot
work no conclusive answer can be given. Hence, until further research of relaxation behaviour
for discrete movement is available, based on both points interpretation of the data has to be
treated with caution. Third, the measurement method was able to capture genuine behaviour
after the perturbation and was solely a result of actual attractor dynamics. Adopting the latter
position, and assuming that inter-trial differences provided information about τrel one can
derive some properties of the underlying attractors.
Since the movement patterns showed relatively high fluctuations between subsequent
trials, and relating this finding to the underlying attractor, the stability of the attractor
potentially was not very strong. Thus, fluctuations inherent to movement systems could have
lead to relatively greater ‘natural’ perturbations of the system. Translating this finding into an
interpretation of a specific topological shape of the attractor, potentially this specific attractor
exhibited a very shallow basin. Therefore, occurring fluctuations were not followed by

186
immediate relaxation behaviour back to the prior state. Under this regime the additional
mechanical perturbations would not be damped out immediately but could have just blended
in with the general fluctuations inherent to the system. The great variation of the movement
patterns individually used by the participants across throwing distances could be seen to
support this view as shallow attractor layouts ease switching between different movement
patterns (Carson et al., 1996; Schöner and Kelso, 1988b). As in Chapter 6, although the
movement patterns for each participant showed similar qualitative appearances across
distances, when comparing solely the trials from the smallest and the largest throwing
distances, clear differences were visible (compare for example participant CR in the Appendix
A). While the movements all belonged to the same attractor, the actual spread of the attractor
needed to cover a broad area in attractor space. Potentially, this finding marks the difference
between movements with greater and smaller numbers of biomechanical degrees of freedom,
especially where movement segments interact with each other. Potentially for these highly
interactive tasks, greater movement flexibility is necessary in order to overcome system
inherent greater perturbations yielding a wide attractor area (Hang et al., 2001; Hirashima,
Kudo, and Ohtsuki, 2003; Kudo et al., 2000). In contrast, for bimanual flexion-extension tasks
where opportunities for perturbations are somewhat more limited, a tighter attractor regime
might be more easily achievable. Regarding the relation of the height of the fluctuations and
the performance attained during the fluctuations, there were some indications for decreasing
fluctuations between subsequent trials with increasing performance similar to the results
obtained by Button et al (2003). However, since only five participants were investigated in
this study, no conclusions could be drawn on this point.
With regards to discrete kinematics, data in the current chapter provided further
support for the findings reported in Chapter 3 and Chapter 5. As the throwing distance was
increased, based on results from the previous chapters, an increase in the linear velocity of the
wrist was expected and this was confirmed in the present chapter. Whereas in Chapter 3, a
strong increase in the wrist radii was observed, this effect was not supported in Chapter 6,
where only a marginal increase was reported. The present chapter confirmed the latter result
and only small increases of wrist radii with increasing throwing distance were found.
Investigation of individual plots showed great variations in the response patterns between
participants. Therefore, the postulation of similarities between the basketball hook shot and
uni-manual throwing movement (see Buchanan et al., 1997) could not be supported. The
explanation of decreasing radii with increasing throwing distance following a transition from

187
throwing for precision to throwing for distance (compare Kreighbaum and Barthels, 1996)
could not be supported either.
The present data supported previous results regarding changes in throwing
performance with increasing distance where a significant negative trend for this relationship
was reported (see Chapters 3 and 5). Further, comparisons between participants noted
significant differences between skill levels with post-hoc testing revealing significant
differences only between the novice and the more skilled players. The rating of the
participants performance followed, in general, expected differences based on prior playing
experience.
With regards to the mixed-effects analysis in the present chapter, a significant main
effect for right shoulder joint abduction angle for the linear trend could be observed with a
coefficient of β1 = 3.44, similar to the coefficient reported in Chapter 6 (β1 = 3.99). In the
latter, a significant effect for direction was noted which was not found in the present study.
For the right shoulder flexion angle, a significant effect for the quadratic distance coefficient
and for direction were observed, whereas in Chapter 6 only for direction a significant effect
was reported. Estimated coefficients showed different signs (β2 = 5.36, Chapter 6 β2 = -3.28).
The linear effect for the wrist joint could not be corroborated in the present chapter, but a
direction effect was present as in the previous chapter (β2 = 4.84, Chapter 6: β2 = 6.64). For
the left elbow, significant effects for linear throwing distance and condition were found which
contrasted with previous findings. In Chapter 3 no effects on this joint were reported and in
Chapter 6 a significant quadratic effects instead of linear effect was noted. In contrast, the
differences between conditions were similar (β3 = -9.93, chapter 6 β3 = -4.98) where opposing
trends were indicated with increasing distance. For the right leg, differences between all three
chapters were observed. The present chapter displayed significant effects for the right hip and
the right knee joint only for direction. In Chapter 6 significant effects were displayed for the
quadratic term and between directions only for the right hip. In contrast, significant linear and
quadratic trends in both hip and knee were reported but no significant differences between
directions were determined in Chapter 3. The estimated coefficient also showed high
variations between studies, e.g., the direction effect for the right hip joint was -0.16 in Chapter
3, 1.43 in Chapter 6, and -1.9 in the present chapter. For the left leg, the current chapter
indicated increasing extension in both the hip and the ankle with increasing distance which
confirmed the results obtained in Chapters 6 and 3. In relation to the fixed effects structure,

188
the current experiment supported the hypothesis for stable sample effects with increasing
throwing distance most notably in the kinematics of the left leg.
With regards to the standard deviation of the random effects, the present chapter
reported similar results, as obtained in the previous two chapters, with high inter-participant
variation in the left shoulder joint and the right knee joint common to all three studies.
Regarding the magnitude of the estimated inter-participant standard deviations, the levels
were comparable between the studies ranging from 5° (Chapter 3) for the lowest variations to
39° (Chapter 6) for the highest variations. However, the data from the present chapter differed
from the previous ones, in that the lowest values were only around 12°, somewhat greater
compared to the values reported in other chapters. The effect of higher inter-participant
variation compared to intra-participant variation, however, was corroborated. Regarding the
estimated standard deviations of slopes, the preceding studies found higher variation of slopes
between participants compared to the variations within participants between conditions which
was supported by the current study. Lowest variations were indicated by the left leg angles
across all three studies. In summary, the current study also showed high variation for the
upper arm kinematics between participants paired with low inter-personal variation for the left
leg. Investigation of individual strategies in the right elbow joint showed a similar response as
present in Chapter 3 where all potential changes were realized by different participants.
Comparison of the individual trends in the right shoulder joint flexion angle at ball release
showed some differences between the current study and Chapter 6 where again all three
adaptations strategies were present. In the current chapter only either very small or positive
increases in flexion angles were observed. For the left shoulder joint, the results were similar
between Chapter 6 and the present study with both studies containing one participant showing
clear hysteresis behaviour across distance. The left knee joint which was investigated on an
individual basis in all three studies showed similar small changes with increasing distance for
either direction. The results for heteroscedasticity estimates confirmed the previous findings
that there is no clear participant or skill related distribution.
In summary, for all three studies, the most robust adaptations across distances and
participants were found for the discrete kinematics at ball release for the supporting leg. The
general adaptation strategy consisted of increasing extension of the supporting leg with
increasing throwing distance by greater plantar flexion of the ankle joint. This is further
combined with greater extension angles in the hip joint, which kept knee angles constant
across throwing distances and conditions. Overall sample effects showed greater variation

189
between the chapters and across participants, which highlights the need for more individual
based approaches. Standard deviations of estimates in all three studies indicated high inter-
individual differences in absolute magnitude of chosen joint angles, suggesting inter-
individual differences in neurobiological constraints and skill levels. Based on the
heteroscedasticity analysis, all three chapters showed no clear relation to performance level
which was different from previous results obtained for basketball free throws (Button et al.,
2003). However, it has to be noted that continuous movement kinematics were used in this
chapter.
Conclusion
The aim of the present study was to identify critical slowing down in a discrete multi-
articular action. However, as none of the participants showed phase transitions, it was not
possible to investigate critical slowing down but only relaxation behaviour after application of
the mechanical perturbation. Investigation of kinematic differences between subsequent trials
did not support the postulated relaxation behaviour for the basketball hook shot. Thus, based
on the results obtained in the current chapter, it appears unlikely that critical slowing down
would have been identified even for participants exhibiting phase transition behaviour.
According to the results from the cluster analysis approach, all five participants used a
unimodal attractor scheme and scaled a single movement pattern according to the throwing
distance. Thus, the results of the cluster analysis and the findings from the discrete kinematics
at ball release supported the findings from Chapter 3 and Chapter 5. Analysis of the discrete
kinematics at ball release confirmed the previous results where high similarity in the trends
for the supporting leg across participants were observed and this was concurrent with greater
individual trends for the upper body kinematics.
190
8 Chapter Eight : Epilogue
Introduction
The purpose of this chapter is to summarise the main findings from this programme of
work and to highlight the implications for future research on discrete, multi-articular actions
from a dynamical systems perspective. The following sub-sections group together some of the
main issues which emerged from the experiments reported in Chapters 3, 5, 6, and 7 and the
reviews of the relevant literature from Chapters 1 and 4. In the first section of this chapter,
problems related to the investigation of discrete, multi-articular actions from a dynamical
systems perspective which emerged purely from a theoretical point of view will be reiterated.
The following section focuses on the description of a suitable movement model, the
basketball hook shot, and the related study which was presented in Chapter 3. The important
issue of data analysis has surfaced frequently in this programme of work, as acknowledged in
the subsequent section covering cluster analysis and the findings from Chapter 5.
Accordingly, the next section focuses on the application of the dynamical systems theoretical
paradigm to the basketball hook shot and the implications which resulted from the studies
presented in Chapter 6 and Chapter 7. Finally, the last sections will address the implications
emerging from the findings of this programme of work, followed by a discussion of
limitations and future research directions.
Discrete, multi-articular actions
The dynamical systems theoretical framework for studying movement coordination
was introduced through concepts derived from the theory of synergetics (Haken, 1983; Kelso,
1995). Synergetics, based on insights from inanimate physical systems, provided the
necessary experimental apparatus, which made investigation of neurobiological movement
coordination from a dynamical systems perspective possible. As shown in the overview of the
literature, the dynamical systems framework has been able to provide answers to some of the
fundamental problems on movement coordination. However, as Chapter 2 highlighted, the
theoretical principles of the dynamical systems approach have generally been derived from
studies of rhythmical movements mainly incorporating a limited number of biomechanical
degrees of freedom. Hitherto, these principles had been tested to a large extent only with these
specific movement models. An interesting question concerned whether the application of
dynamical systems theory is appropriate for the study of discrete and/or functional
191
movements which vary from the prevalent movement models (Hossner, 2000; Obhi, 2004;
Walter, 1998).
Potentially discrete movements pose some conceptual problems for the dynamical
systems framework. For instance, there may be fundamental differences in phase transitional
behaviour between discrete and rhythmical movements. Since transitions between attractors
can be represented by a trajectory in phase space, for neurobiological systems this trajectory
follows a continuous function since discontinuities would present instances where infinite
acceleration would be needed. This is not possible for neurobiological systems (Newell et al.,
2001). This property is readily present in the rhythmical case, and accordingly when
transitions occur they are accompanied by the appearance of several intermediate movement
patterns (demarcated by critical fluctuations). However, for a discrete movement this is not
necessarily the case because in principle different attractors are accessible in successive
movement executions. When performing discrete movements, it is possible for the actor to
evaluate feedback from the previous trial and reflect upon his performance. Accordingly,
he/she can revise his/her intentions leading to changes in movement behaviour. For example,
regarding the movement model used by Sorensen et al (2001), it is reasonable that changing
from a forehand table tennis stroke to a backhand stroke in subsequent trials is readily
possible. Therefore, modelling discrete movement may be feasible on a single trial basis, as
demonstrated by Schöner (1990), Saltzman and Kelso (1987) and Jirsa and Kelso (2005). Yet,
the transition to repetitive movement execution has not been sufficiently addressed in the
literature. This issue is perhaps conceptual in nature and may require further modelling to
address it.
Another problem, more methodological in nature, arises with discrete movements in
regards to the identification of critical slowing down. Following Schöner’s (1990) proposition
on modelling of discrete movements, it was argued that critical slowing cannot be
investigated within a single trial since typically, the execution time is not sufficient for the
movement to relax back to the unperturbed movement trajectory. Schöner (1990) proposed
the inter-trial fluctuations as a surrogate measure of pattern stability. However, this suggestion
has not been fully investigated in the literature and therefore no knowledge about critical
slowing down in discrete movements is currently available.
The issue of discrete movements and their relation to rhythmical movements gained
further momentum based on evidence for significant differences in regards to kinematics

192
(Button et al., 1998; van Mourik and Beek, 2004; Wei et al., 2003) and brain activation (Miall
and Ivry, 2004; Schaal et al., 2004). Accordingly, the review of the literature in this thesis
pointed out that more research using discrete movement models is necessary, as repeatedly
formulated in the dynamical systems literature (see for example Beek et al., 1995; Kelso and
Schöner, 1988; Schöner, 2002; Summers, 1998; Walter, 1998).
Classification of movement models according to a three-tier scheme developed by
Newell et al. (2001) made apparent the issue of task degeneracy related to prevalent
movement models. The model describes three coupled levels of movement organization. The
highest level describes the spatial-temporal outcomes of behaviour, the middle level describes
the dynamics of the segments kinematics, and the lowest level describes behaviour of
underlying subsystems (Newell et al., 2001). In the majority of DST studies, the spatial-
temporal outcome of the movement prescribed the segment kinematics, which in effect results
in equality of the two-upper levels. This collapsing of the upper levels raised the issue: to
what extent was the observed behaviour a result of unrestricted self-organization and not of
the specific task constraints? (Bongaardt, 1996; Hong and Newell, 2006). This issue can be
closely allied with the concept of degeneracy (Edelman, 1987). Related to movement
patterning, degeneracy describes the fact that the same task outcomes can be achieved with
different movement patterning. Accordingly, it seems plausible that when degeneracy is
available to the actor, behavioural responses to a specific task could show much richer
dynamics compared to relatively constrained movements as shown in a study using a ski-
simulator task (Hong and Newell, 2006).
Regarding the biomechanical degrees of freedom involved in the majority of studies
conducted from a dynamical systems perspective, a disproportionate number of studies
involved movements incorporating only very limited biomechanical degrees of freedom
(Cordo and Gurfinkel, 2004). Based on the definition of coordination formulated by Bernstein
(1967) which emphasized the redundancy problem in relation to neurobiological degrees of
freedom, these movement models could arguably be regarded as a special case of movement
coordination. Accordingly, it may not be appropriate to transfer findings to other movement
models where some of these constraints are relaxed (Cordo and Gurfinkel, 2004; Heise and
Cornwell, 1997; Swinnen and Carson, 2002). Review of studies which investigated
movements involving a higher number of biomechanical degrees in freedom present in
Chapter 2 suggested much more complex behaviour compared to the bimanual and unimanual
case (see for example Jeka et al., 1993; Kelso and Jeka, 1992; Limerick et al., 2001).

193
In summary, three main issues with regards to prevalent movement models could be
identified: (i) the dichotomy between discrete and rhythmical movement models (ii) low vs.
high biomechanical degrees of freedom (iii) degenerate vs. task determined movement
models.
In order to investigate these issues further, a suitable movement model has to be
identified and adopted within this programme of work..
The basketball hook shot, a suitable movement model
During the review of the literature on dynamical systems theory, several applications
to ballistic throwing movement were discussed (Liu and Burton, 1999; Southard, 1998, 2002).
Unfortunately, each of these studies showed some serious limitations, although it was argued
that they provided a good starting point for the development of a suitable movement model in
this programme of work. Following the suggestions by Davids et al. (2006; , 2005) and the
approach of Liu and Burton (1999), a basketball throwing movement was investigated as a
potential candidate movement model. Assessment on the literature of basketball set-shots and
jump shots gave some indication that the throwing distance might represent a control
parameter, but also that standard basketball shots exhibited only relatively small variations
with distance, which would hamper the identification of different movement patterns and
therefore possible attractors. In search for a throwing movement which potentially shows
greater adaptations due to changes in throwing distance, the basketball hook shot was
identified. On analysis, the basketball hook shot per-se did not prescribe a determined
movement model but rather a class of movements which shared a common characteristic (see
distinction between shy hook shot and jump hook shot according to Martin, 1992). It was
noted that by using a basketball hook shot the restrictions for movement patterning should be
less severe compared to a standard basketball shot (e.g., a free-throw), thereby facilitating
possible degenerate behaviours. As the basketball hook shot belongs to the domain of ballistic
throwing movements, its execution is discrete and involves whole body movements using
large numbers of biomechanical degrees of freedom. In addition, since the hook shot is an
airborne throwing movement it was assumed that changes in movement patterning would be
attenuated because of inertial interactions between body segment movements (Hang et al.,
2001). Therefore, it was expected that different movement patterns would be relatively
straightforward to identify. Hence, the basketball hook shot appeared well suited in order to
investigate some of the theoretical issues formulated earlier. Another argument in favour of
the basketball hook shot was based on the fact that the hook shot resembled quite a

194
specialized movement with very little application outside of basketball playing. Therefore, the
amount of behavioural information serving to guide movement adaptations could readily be
influenced by the instructions given to potential participants by the experimenter.
In Chapter 3 movement patterning in the basketball hook shot due to changes in
throwing distance was investigated. The basketball hook shot is an emergent action dependent
on specific task constraints, especially the presence of a defender and, therefore, another
question tailored to applied settings was addressed. As the review of the basketball literature
highlighted, very little knowledge is currently available for investigating movement
adaptations in the presence of a defender. Since an approaching defender presents additional
spatial and visual constraints, some differential adaptation could be postulated based upon
investigations of perceptual phenomena in bimanual movements (Byblow et al., 1999;
Schmidt et al., 1990). Accordingly, in addition to the throwing distance, defender and no-
defender conditions were introduced.
In order to provide better linkage between the proposed movement model and pre-
existing movement models, it is important to investigate if studies of unimanual movements
and the basketball hook shot could be related to each other. Based on the anticipated
trajectory of the wrist a potential link between the basketball hook shot and studies with
unimanual shoulder-arm-wrist movement was identified (Buchanan et al., 1997; DeGuzman
et al., 1997). Accordingly, decreasing radii for the trajectory of the throwing arm were
expected as shown in the unimanual case with increasing movement speed.
The results presented in Chapter 3 indicated that throwing distance constrained the
movement patterning. They provided further support for the candidacy of throwing distance
as a control parameter. The participants in that study had different amounts of experience,
with one participant being a professional basketball player and one participant being a
complete novice. There were strong differences in movement kinematics across throwing
distances and between participants. Surprisingly, the presence of the defender showed only
minor influences on movement patterning and only for the novice player. It was argued that
this finding could have been a result of the specific movement execution of the basketball
hook shot by the more experienced participants, where their body positioning during the shot
constrained possible interference by the defender unlike during a basketball set shot.
Regarding sample trends across movement kinematics, analysis of discrete and time-
continuous measures indicated high similarity across participants and distance for the lower
195
limb segments and greater differences for upper body kinematics. Therefore, a mixed-
modelling approach was adopted which made detailed investigations of within-individual
effects possible.
Investigation of angle-angle plots showed a clear distinction for two different
movement patterns across throwing distances for the expert performer. One movement pattern
was used at smaller distances and the other pattern at greater throwing distances. Observed
differences were based on qualitatively different coordination patterns for both upper limb
segments. It was argued that the two different movement patterns resembled attractors and
accordingly, for this participant, a bimodal attractor layout potentially was present. For the
remaining participants differences across throwing distances were less pronounced with high
consistency for the throwing-arm and the supporting leg paired with some greater variability
of the movement kinematics of the non-throwing arm. Hence, for these participants the results
tended to support the use of a single attractor which was transiently adapted in order to satisfy
the task constraints (Kostrubiec et al., 2006). Together the findings neatly expressed the
notion of morphological structures introduced earlier (Bernstein, 1967). Comparison of the
movement patterns across participants highlighted that, although some commonalities were
found in gross movement kinematics, the investigation of detailed kinematics showed some
significant differences between the participants which highlighted the degenerate nature of the
task. For the second unimodal group, unlike the bimanual case where attractors generalized
across participants (one-to-one mapping between attractor and in-phase/anti-phase
movements), for the basketball hook shot the attractor appeared to follow rather a one-to-
many mapping (one attractor maps to several different movement patterns across
participants). Hence, the results indicated some potentially significant differences in attractor
properties between discrete, multi-articular actions and more confined rhythmical movement
models.
Regarding the hypothesized similarities between the movement exhibited by the
trajectory of the wrist of the throwing arm and findings from unimanual movements, the
results indicated exact opposite trends. Whereas for the unimanual movements an increase of
the curvature was observed (Kelso et al., 1991b), for the basketball hook shot the curvature
decreased with increasing movement velocity. Accordingly, further investigation was
necessary.

196
Analysis of discrete, multi-articular actions
Although the experiment in Chapter 3 showed how the concepts and tools of
dynamical systems theory could be applied to studying the basketball hook shot, the results
also highlighted the necessity for the development of a more comprehensive analysis tool,
since identification of different movement patterns was mainly based on visual inspection.
Development of an analysis tool would thereby enable the systematic identification of distinct
movement patterns. Therefore, in Chapter 4 the necessary prerequisites for a suitable analysis
apparatus were derived and several existing tools were assessed according to these criteria.
The results indicated that, at present, none of the existing tools that were investigated fulfilled
all the necessary prerequisites. However, cluster analysis was identified as providing the
closest proximity. Therefore, it was decided to further develop the cluster analysis approach
already used in the literature to incorporate the required properties.
In Chapter 5, the extended cluster analysis approach was developed using a
bootstrapping procedure together with another validity measure to extract movement clusters
based on the kinematics of an action. Further, it was explained how the cluster analysis could
be combined with a scaling methodology to facilitate identification of hallmark characteristics
of dynamical systems in distinct movement patterns, including critical fluctuations, hysteresis,
and critical slowing down. Subsequently the cluster analysis method was tested using three
different movement models. Application of the cluster analysis method to a bimanual
movement (wrist pronation-supination task) showed not only identical results to traditional
analysis methods (i.e., calculation of discrete relative phase), but was able to show more in-
depth information not accessible to traditional methods. Hence, using a bimanual movement
model, the cluster analysis approach could be successfully linked to the existing body of
literature utilising the dynamical systems perspective.
In a second experiment, three different basketball throwing techniques (free throw;
three point jump shot; hook shot) executed by experts performers were individually analysed
using the cluster analysis approach. The results matched the a-priori known differences
between the shooting techniques which supported the application of the cluster analysis
approach to discrete, multi-articular actions. Finally, an experiment was specifically
conducted with the basketball hook shot. Applying a scaling methodology common to
investigations from a dynamical systems perspective, throwing distance was first increased
between 2m and 9m and subsequently decreased from 9m back to 2m. To facilitate different
movement patterning between smaller and greater throwing distances, the experiment was
197
performed in a gym with a low building ceiling. As was argued, this set-up should have
prevented the participants from simply up scaling their movement patterns according to the
throwing distance. The results obtained from the cluster analysis approach indicated for both
participants a distinction into two different movement patterns in relation to the throwing
distance. One pattern was more prevalent at smaller throwing distances and the other at
greater throwing distances. For one participant, the transition between movement patterns
showed critical fluctuations identified by the cluster analysis approach, whereas for the other
participant, no such increases in movement fluctuations were found. However, in both cases
the transitions between the movement patterns were accompanied by hysteresis effects.
Accordingly, it was argued that for one participant the movement patterning followed a
bimodal attractor layout, whereas for the other participant, only a single attractor was used
which supported the findings from Chapter 3. In summary, the results further strengthened the
feasibility of the programme of work. Together, the results obtained in Chapter 3 and Chapter
5 provided the necessary requirements in order to perform a scaling experiment with the
basketball hook shot.
Scaling and perturbation of the basketball hook shot
In Chapter 6 the scaling methodology developed in Chapter 5 was again applied to
basketball hook shots without the constraint of a low ceiling building. Eight randomly chosen
participants representing a variety of different skill levels participated in the study. The results
of the cluster analysis identified throwing distance-related changes in movement patterning
for all participants. However, the investigation of angle-angle plots, critical fluctuations and
hysteresis provided evidence for phase-transition behaviour only for two participants. In both
cases, a bimodal attractor layout was identified corroborating the findings from Chapter 3 and
Chapter 5. Adaptations in the movement kinematics were mainly based on the upper limb
segments, whereas movement kinematics of the supporting leg showed high stability across
distances as well as across all participants. For the remaining six participants a single
movement pattern was adapted to throwing distance, again exhibiting greater variation in the
kinematics of the non-throwing arm. These results also corroborated the findings from
Chapter 3 and Chapter 5. For these participants no critical fluctuations were found but all
participants exhibited hysteresis effects. It was argued that, for these participants, the
movement patterning was the result of a single attractor which was adapted to the throwing
distance.
198
Comparison of the individual coordination patterns across participants revealed
considerable differences between individually chosen movement patterns. With regards to the
movement strategies (bimodal vs. unimodal), no relation to prior experience level or actual
performance of the participant was found during the experiment. Investigation of the discrete
kinematics at ball release using the mixed-effects modelling approach corroborated the
findings from Chapter 3. The results again indicated greater differences between participants
for the upper limb kinematics as opposed to greater similarity in the kinematics of the
supporting leg. Together, the results from the discrete, as well as continuous, analysis
revealed insights into the degenerate properties of the basketball hook shot. The results
highlighted great inter-individual differences in movement patterning for this task and it was
argued that differences in intrinsic dynamics were responsible for the great variety of task
solutions.
Regarding differences between discrete and rhythmical movement models, the
distribution of movement clusters provided evidence that participants were able to alternate
between movement patterns in subsequent trials. As this behaviour is not possible for
rhythmical movements, this finding marked a significant deviation from previous modelling
schemes and served to further highlight specific differences between discrete and rhythmical
movements. Further, as explained during the literature review, a potential source of constraint
responsible for altering movement between subsequent trials could have been task success,
i.e. the scoring of a basket. However, the lack of a clear relationship between obtained
performance scores and the differences in movement patterning in subsequent trials did not
support this hypothesis.
Since phase transitions behaviour for the basketball hook shot could be established in
Chapter 6, the next step consisted of testing the stability properties of the underlying attractors
by means of critical slowing down. Hence, in Chapter 7 a perturbation study with the
basketball hook shot was conducted. Using a paradigm adapted from previous research
(Button et al., 2000; Haggard, 1994; Scholz and Kelso, 1989) a mechanical perturbation was
introduced during execution of the throwing movements. Since in Chapter 6 it did not become
clear what the defining property for the chosen adaptations scheme (bimodal vs. unimodal)
was, performers from a range of different skill levels were again chosen to participate in the
study. Following the proposition made by Schöner (1990) the differences between subsequent
trials was chosen as a potential measurement for relaxation behaviour and accordingly critical
slowing down. However, as the cluster analysis showed, all five participants exhibited an

199
unimodal attractor layout and therefore no phase transition behaviour was found. Therefore,
the investigation of critical slowing down was not possible. The results indicated that the
fluctuations between subsequent trials did not follow the expected pattern. Fluctuations
showed high levels for all participants and remained uninfluenced by the mechanical
perturbation and changes in throwing distance, which appeared somewhat counterintuitive.
Implications
With regards to phase transition behaviour it can be concluded from the combined
results that phase transition behaviour is less likely to occur in the basketball hook shot
compared to bimanual anti-phase/in-phase movements (see Chapters 3, 5, 6, and 7). Out of
21 participants only 4 showed clear phase transitions between two qualitatively different
movement patterns, whereas the remaining participants all used a single type of movement
strategy across all distances and conditions. As the differences between single and multi-
pattern behaviour were not related to skill level, it can only be assumed to be a result based on
the individual intrinsic dynamics of the actors. Nevertheless, for participants where phase
transitions could be identified, the results confirmed the basic predictions of the dynamical
systems theoretical framework. For example, a loss of stability, exemplified by critical
fluctuations, was necessary in order to switch between the different movement attractors.
Further, since switching between attractors was accompanied by hysteresis effects, the
evidence in support of phase transition behaviour was further strengthened.
Investigation of the kinematics showed that for both adaptation schemes the attractors
represented a wide range of different movement patterns. Especially for the unimodal case,
comparison of movement patterns from the smallest and the greatest throwing distances
showed strong differences in segment kinematics. Accordingly, a potential attractor
responsible for generating these movements had to cover a broad area incorporating highly
different movement patterns. This result stands in contrast to investigations using bimanual
movements where the actual movement patterns were more strongly restricted and showed for
example, only small changes in movement amplitudes (Haken et al., 1985). Relating the
present finding to previous studies of motor learning conducted from a dynamical systems
perspective, potentially for this discrete, multi-articular task, movement patterning was altered
using the cooperative strategy described earlier (Kelso and Zanone, 2002; Zanone and Kelso,
1992). Hence, in order to meet the task requirements, the participants chose instead to adapt
an existing attractor layout rather than switching between different attractors. This behaviour
was also identified by Kostrubiec et al. (2006) as a flexible strategy for adapting behaviour to

200
specific contexts. With regards to movement patterning, such a strategy is assumed to
preserve the topological structure of the movement (Zanone and Kostrubiec, 2004) as
indicated by the movement kinematics in the current studies. Hence, the same strategy
typically utilized for persistent learning effects during skill acquisition potentially could also
have been used for immediate adaptations occurring on much smaller time scales. In support
of this view were results obtained for participants JA and DU in Chapter 6 and participant CR
in Chapter 7. These data showed that a similar movement pattern (unimodal scheme) was
used over the course of the whole experiment, but that the movement patterns at the end of the
experiment differed from the initial patterns, indicative of a learning effect. This finding
seemed especially counterintuitive since two of these participants stemmed from the group of
most experienced players and also demonstrated the best performance in their respective
studies. Therefore, one would assume the least changes for these actors. Adopting this
interpretation it becomes possible to explain the great differences between the movement
patterns at the smallest and the greatest throwing distances found in all studies. Since the
attractor was continually shifted further away from the initial position, the resulting
movement behaviour followed this shift. Hence, through continual changes in throwing
distance, and the accumulation of differences in movement execution, the great variations
between movement patterns could have emerged. Thereby, the differences between similar
throwing distances would also exhibit relatively similar movement patterns as shown in the
presented studies.
Relating this notion to those participants who showed a bimodal scheme, potentially
the second attractor was in close proximity to the initial attractor, and therefore the movement
systems ‘preferred’ a phase transition to satisfy the changing task constraints, as opposed to
an attractor shift. In contrast, for the unimodal scheme, either no second attractor was
available, or the distance between attractors in the layout was too large to trigger a phase-
transition. Accordingly, responsibility for the existence of a unimodal or bimodal adaptation
strategy would largely fall upon the individual intrinsic dynamics of the performers.
Interestingly, results obtained from participant CA in Chapter 6, who exhibited a phase
transition, indicated the same shifting process for the usage of movement cluster 6 as did
participants using the unimodal scheme. Potentially, the shifting vs. phase-transition approach
does not resemble a non-overlapping dichotomy but can be used in combination as the data
from participant CA indicated.

201
With regards to the process which drives the shifting of the attractor it is likely that
intentional dynamics played a major role. Since, intentional dynamics can be used in order to
stabilize different regions in attractor space, similar to the process of re-learning, a similar
strategy could be applied for these more transient changes (Schöner and Kelso, 1988b;
Zanone and Kelso, 1992). Therefore, the observed movement patterning (bimodal vs.
unimodal) are likely the result of the interactions of intrinsic and intentional dynamics
(Carson et al., 1996; Lee, 2004). Since, in the case of discrete movements, intentions
explicitly seem to play a stronger role compared rhythmical movements (Schöner, 1990), this
view receives some support. This notion of shifting attractors according to the task
requirement also provides a possible explanation for the identified hysteresis effects in the
unimodal adaptation scheme. As the attractor is shifted only by a small amount, a small
residual of the previous attractor could always be maintained. This residual could contribute
an attracting force which pulls the current attractor back to the previous position and
accordingly leads to a movement pattern which exhibits some characteristics of the previously
used one (Zanone and Kostrubiec, 2004). Hence, this type of behaviour would resemble small
residual (e.g., ‘memory’ or ‘positive transfer’) effects on a short time-scale. A study in
support of this view was conducted by Classen, Liepert, Wise, Hallet and Cohen (1998).
Participants received transcranial magnetic stimulation (TMS) which resulted in thumb
movements in specific individual directions. Subsequently, thumb movement in the opposite
direction were trained with varying time intervals (5 min – 30 min). Follow-up application of
TMS resulted in thumb movement in the trained direction, but not in the initial direction.
However, after individually different time intervals, the movement direction returned to the
initial direction. A similar effect could be responsible for the hysteresis behaviour found in the
current studies.
Incorporating into this model the results obtained from Chapter 7 regarding the
relaxation behaviour, not only is the attractor shifted according to specific requirements of the
task, but it also shows a relatively shallower basin of attraction compared to bimanual
movements. As the fluctuations indicated no influence due to either the mechanical
perturbation or to changes in throwing distance, the ‘natural’ level of perturbations for this
specific task could show greater magnitude, thereby masking these external perturbations.
Possibly, this effect resulted from the multi-articular nature of this specific movement model.
As the basketball hook shot incorporated greater biomechanical degrees of freedom, it seems
intuitive to assume that the movement is exposed to greater perturbations inherent within the
movement system. Accordingly, when the attractors underlying this system are tightly

202
constrained, potentially it could be difficult for the system to adapt to these perturbations.
Hence, a less stable attractor possibly could be more easily adapted due to unforeseen
changes. Further, as shown on several occasions, the participants were able to switch between
highly different movement patterns in subsequent trials. This finding might indicate that it
was relatively easy for participants to modify the attractor layout in between trials. As shown
in experiments using bimanual movements that intentionally switching between attractors is
limited by the inherent stability of the attractors (Carson et al., 1996; Serrien and Swinnen,
1999), using an attractor with a flat bottom layout could support fast adaptations in small
amounts of time, since no great regions of instability and stability have to be negotiated and
breached.
Referring to the initial definition of coordination in overcoming redundant degrees of
freedom, the studies highlighted that once redundant or degenerate degrees of freedom are
available to the performer, these can be readily exploited. Although the movement generation
shared similar characteristics across the different actors, the individual appearances showed
considerable differences in movement execution. It is arguably in this feature that the
strongest differences between the traditional movement models from the bimanual rhythmical
domain and discrete, multi-articular actions were found. Whereas an attractor in a bimanual
experiment could be generalized as anti-phase or in-phase across actors and even across tasks
(for example finger movement and wrist movement Carson, 1995; Haken et al., 1985), in the
case of the basketball hook shot the exhibited movement patterns showed much stronger
individual differences. Hence, once degeneracy is available it seems likely that actors
individually will make use of it.
Since the predictions of dynamical systems theory were not met in total, one
possibility to be explored is that the findings could be explained with an alternative theoretical
approach favouring, for example, the concept of motor programmes. Since the Schema model
(Schmidt, 1975) was initially established using discrete movement models (Schmidt, 2003), it
may provide an appropriate theoretical model for explaining some of the data in this
programme of work. At first glance, the fact that most of the participants across the four
experiments used a scaling strategy could be seen as evidence in favour of a generalized
motor program (GMP). Each participant could simply have used a single GMP and scaled it
according to the throwing distance. Since, the Schema theory allows for individually different
GMPs across participants (Carter and Shapiro, 1984) the inter-individual variability can also
be explained by the GMP theory. However, as pointed out in the discussions of each chapter,
203
even for the participants exhibiting a scaling strategy, the movement patterns at the smallest
and greatest throwing distances showed significant topological differences in movement
patterns. Thus, the movement patterns at the greatest distances did not represent simply an ‘up
scaled’ version of the movement patterns at the smallest distance. Therefore, it seems unlikely
that linear changes of Schema parameters, whilst maintaining the relative timing components
of the movement (Schmidt, 2003), were used. This notion is further rejected by the results of
the cluster analysis. Since, the calculation of the distance measures were based on normalized
angle curves, if a simple scaling, leaving the relative timing unchanged, would have occurred,
the result would have been observations of identical curves for all trials yielding no clustering
at all. This observation occurred for only for two out of fifteen participants in the programme
of work and it is unlikely that these individuals were using a schema to regulate movements,
while other participants were not. Further, except for three cases, all participants exhibited a
hysteresis effect, implying that a specific “recall schema” (Schmidt, 1975, p.236) was
maintained for a longer time depending on the direction of distance change. However, GMP
theory does not predict differences in program execution depending on the previous action
and therefore, in its current definition, cannot accommodate for the observed hysteresis
effects.
Regarding those participants where clear phase transitions were observed, it is even
more difficult to find an explanation using GMPs. In all three cases the two movement
patterns adopted by the participants showed completely different topological characteristics.
Hence, two different GMPs would have been necessary to accommodate for the different
classes of the observed movement patterns (Morris, Summers, Matyas, and Iansek, 1994).
Again, since hysteresis effects were present during all transitions, it is not clear how to
accommodate these findings using a GMP framework. For example, Participant CA used
several similar movement patterns during the initial trials and switched to a complete different
pattern at higher distances, which he maintained until the end of the experiment. It is not clear
why this participant would use one GMP at small throwing distances whilst increasing
distance and another GMP when decreasing throwing distance, especially since performance
scores exhibited no obvious differences between the conditions (compare Figure 6-2) and he
was able to switch between GMP’s in subsequent trials. Hence, it seems difficult to explain
the present findings using generalized motor programmes.
In conclusion, whether the observed effects and proposed attractor shifting observed in
this programme of work represent typical features for discrete, multi-articular movement

204
models more generally cannot be derived based on the results obtained in studying this
specific movement model. Potentially, the results observed were merely a result of the
basketball hook shot and cannot be further generalized to other movement domains, which
leads to the limitations of the present work and potential applications for further research in
the future.
Limitations and Future directions
The main limitations in the current programme work rested on the dependence on the
cluster analysis approach for identifying movement patterns. A systematic method of
identifying different movement patterns was needed to subsequently link specific movement
patterns to attractors. This dependence stemmed from the required departure from the pre-
existing movement model in using a discrete multi-articular movement model as the object of
investigation. However, as pointed out earlier, in order to overcome some of the major
criticisms of the dynamical systems theoretical framework this departure seemed necessary.
To attempt to bridge the gap between discrete multi-articular actions and typical bimanual
rhythmical movements, this novel movement model was developed from previous work on
the throwing task. Similar, the cluster analysis approach was tested with a typical bimanual
movement model first, in order to show its validity and the potential transition for its use with
the novel movement model (see Chapter 5).
In general, this problem highlights the issue of how movements can be modelled as
attractors and how an attractor can be identified when no obvious distinctions are available
like in the case of anti-phase and in-phase movements. As pointed out, typically the
justification for a valid distinction into different movement patterns is based on intuitive
reasoning or prior experience. Hence, when using movement models remote from pre-existing
experiments it is not easily possible to apply any a priori justification. The main motivation
for the development of the cluster analysis method was that this approach would ease the
problems involved when addressing novel movement models and to facilitate further research.
Possibly, the steps taken in the present programme were too bold and maybe a simpler
movement either only discrete or degenerate could have been enough in order to highlight
further issues. The results of the current programme work therefore only provide preliminary
statements about the properties of discrete multi-articular actions, and can be viewed as a
potential departure point for further research. The data reported in this programme of work
reveal that further research investigating the properties of discrete/multi-articular/degenerate
actions is needed.

205
The second limitation was related to the estimation of critical slowing in Chapter 7.
Again, since no previous work was available to guide the application of the perturbation
paradigm to discrete, multi-articular actions, a relatively conservative standpoint, based on the
existing literature, was adopted. Similarly, the study described in Chapter 7 can be seen as a
first necessary step in order to develop an appropriate methodology for probing the stability of
attractors in discrete movements. Further research is needed to conclusively state whether the
results obtained represented genuine attractor stability properties or were merely a result of
the measurement method chosen. Perhaps the selected mechanical perturbation was sufficient
in order to disturb the stability of the pattern. Since it was difficult to control the exact timing
of the perturbation, potentially the magnitude of the perturbation varied in between trials and
therefore influenced subsequent movement behaviour. However, this variation would have
added random rather than systematic noise to the data and, therefore, the results may represent
clear trends. Similarly, perhaps the weight was not sufficient in order to trigger the desired
effects although it was determined in extensive pilot work. In conclusion, these issues
highlight the need for further research using discrete movements in order to further develop
and refine the perturbation paradigm for this class of actions.
In general it can be said, that compared to critical fluctuations and hysteresis, the topic
of critical slowing down has drawn much less attention in the literature. This is even true for
rhythmical movement models. Accordingly, many questions can be formulated which have
not been addressed so far. How general are critical fluctuations across different movement
models, for example, cannot be derived from the current literature. Another issue which has
also not been addressed concerns the relation of critical slowing and motor learning. For
example, in the learning studies performed by Kelso, Zanone and colleagues (Kostrubiec et
al., 2006; Kostrubiec and Zanone, 2002; Temprado, Monno, Zanone, and Kelso, 2002;
Zanone and Kelso, 1992, 1997; Zanone and Kostrubiec, 2004), changes in attractor layout and
the related stability of attractors were found. However, none of the studies investigated the
stability of the attractor using a perturbation paradigm but rather relied on measurement of
standard deviations of relative phase measurements in order to estimate attractor stability.
Accordingly, whether and how critical slowing down is also a function of motor learning has
not been investigated at all and further research seems necessary. In summary, it seems
desirable to devote more research resources to the investigation of critical slowing down,
especially as it deals with one of the fundamental properties of attractors, their stability, which
in turn constitutes one of the corner stones of the dynamical systems framework.

206
Regarding the application of the mixed-modelling approach to discrete ball release
data in chapter 3, 5, and 6 it can be said that some interesting results were obtained using this
approach, which would not be obtained through the classical ANOVA. As the mixed-
modelling approach is widely used in other research domains (Boyle and Willms, 2001;
Brown and Prescott, 1999; Pinheiro and Bates, 2000; Sullivan et al., 1999; Verbeke and
Molenberghs, 2000; Ware, 1985; Weiss, 2005), it is hoped that the present programme of
work on movement coordination might facilitate further applications of these methods, which
provide much richer information combining adaptation on a sample and individual level. As
this problem is not tied to the dynamical systems perspective, the potential field of
applications for this approach are vast and further application seems desirable. Hence, as the
software tools are readily available and widely accessible, it is hoped that more research will
take on this approach.
The present study also highlighted the importance of individualized analysis schemes
(Button, Davids, and Schöllhorn, 2006). With recent advances in recording techniques,
experimenters are now in the unique position that extensive behavioural data from individuals
can be collected and analysed. In this regards the current study tried also to overcome some of
the limitation of previous studies concerned with basketball throws. For example in Chapter
2, the total throws investigated in the reviewed basketball literature consisted of only 1073
throws, whereas in the present thesis a total of over 2600 basketball throws, using full body
kinematics, were analyzed. It is important for this approach to gain further support in the
literature as potentially much more detailed behavioural data can be obtained with its
implementation.
Finally, in relation to the two different adaptation schemes found in this research
programme, it is still not clear what reasons exist for the adoption of different schemes to
satisfy task constraints, and further research is necessary. Potentially initial differences in arm
or body segment strength could have influenced the preference for a particular scheme. This
issue highlights that, at present, is not clear how to establish intrinsic dynamics for tasks other
than anti-phase/in-phase movements. For example, an interesting question concerns whether it
is possible to probe stability characteristics for different types of throwing movements and
infer from these analyses preferences for different adaptation strategies.
In conclusion, the present programme of work highlighted some of the issues the
dynamical systems theoretical framework is currently facing. The studies described

207
throughout the thesis aimed at providing some ideas of how to address these issues. Overall,
the present programme of work supported the basic tenets of the dynamical systems
theoretical framework to movement coordination. Investigation of the basketball hook shot
showed some surprising features with regards to the obtained attractor layout and further
corroborated DST as a valid theoretical framework for the investigation of neurobiological
behaviour across several movement domains. With regards to the novel movement model,
some clear indication on how to model discrete multi-articular actions could be obtained. The
novel cluster analysis approach should facilitate further research using discrete multi-articular
actions and ease the identification of the attractor dynamics in new domains. It is hoped that
further research into the issue of degeneracy can be stimulated as this emerged as one of the
main themes in the present work.
In the end, as noted at the very beginning, the current programme of work could not
answer the question of how we are able to move from point A to point B. But it highlighted
that, whereas some actors may choose to walk through a gate, others may jump over a fence
instead. Nevertheless, both will be able to meet the task requirements of transiting from points
A to B in their own individual way.
If people do not believe that mathematics is simple, it is only because they do not realize
how complicated life is. John von Neumann (1903-1957).

208
9 References Assisi, C. G., Jirsa, V. K., and Kelso, J. A. S. (2005). Dynamics of multifrequency
coordination using parametric driving: theory and experiment. Biological Cybernetics, 93, 6-21.
Balasubramaniam, R., and Turvey, M. T. (2004). Coordination modes in the multisegmental dynamics of hula hooping. Biological Cybernetics.
Ball, K. A., and Best, R. J. (2007). Different centre of pressure patterns within the golf stroke I: Cluster analysis. Journal of Sports Sciences.
Bartlett, R., Bussey, M., and Flyger, N. (2006). Movement variability cannot be determined reliably from no-marker conditions. Journal of Biomechanics, 39, 3076-3079.
Barton, G. (1999). Interpretation of gait data using Kohonen neural networks. Gait and Posture, 10(1), 85-86.
Barton, G., Lees, A., Lisboa, P., and Attfield, S. (2006). Visualisation of gait data with Kohonen self-organising neural maps. Gait and Posture, 24, 46-53.
Bates, B. T. (1996). Single-subject methodology: an alternative approach. Medicine and Science in Sport and Exercise, 28(5), 631-638.
Bauer, H. U., and Schöllhorn, W. (1997). Self-organizing maps for the analysis of complex movement patterns. Neural Processing Letters, 5, 193-199.
Beek, P. J., Peper, C. E., and Stegeman, D. F. (1995). Dynamical model of movement coordination. Human Movement Science, 14, 573-608.
Bell, A. L., Pedersen, D. R., and Brand, R. A. (1990). A comparison of the accuracy of several hip centre location prediction methods. Journal of Biomechanics, 23(6), 617-621.
Bernstein, N. A. (1967). The co-ordination and regulation of movements. Oxford: Pergamon Press Ltd.
Bernstein, N. A. (1996). On dexterity and its development. In M. L. Latash and M. T. Turvey (Eds.), Dexterity and its development (pp. 3-244). Mahwah, N.J.: Lawrence Erlbaum Associates, Inc.
Bernstein, N. A. (2006a). Basic methodological positions of the physiology of movements. Journal of Russian and East European Psychology, 44(2), 12-32.
Bernstein, N. A. (2006b). From reflex to model of the future. Journal of Russian and East European Psychology, 44(2), 99-98.

209
Bezdek, J. C., and Pal, N. R. (1995). An index of topological preservation for feature extraction. Pattern Recognition, 28(3), 381-391.
Blashfield, R. K. (1980). Propositions regarding the use of cluster analysis in clinical research. Journal of Consulting and Clinical Psychology, 48(4), 456-459.
Blashfield, R. K., and Aldenderfer, M. S. (1978). The literature on cluster analysis. Multivariate Behavioral Research, 13, 271-295.
Bongaardt, R. (1996). Shifting Focus: The Bernstein Tradition in Movement Science.
Boyle, M. H., and Willms, J. D. (2001). Multilevel modelling of hierarchical data in developmental studies. Journal of Child Psychology and Psychiatry, 42(1), 141-162.
Brian T. Peters, Haddad, J. M., Heiderscheit, B. C., van Emmerik, R. E. A., and Hammill, J. (2003). Limitations in the use and interpretation of continuous relative phase. Journal of Biomechanics, 36, 271-274.
Brown, H., and Prescott, R. (1999). Applied mixed models in medicine. Chichester; New York: J. Wiley & Sons.
Buchanan, J. J., Kelso, J. A. S., and deGuzman, G. C. (1997). Self-organization of trajectory formation. I. Experimental evidence. Biological Cybernetics, 76, 257-273.
Button, C., Bennett, S., and Davids, K. (1998). Coordination dynamics of rhythmical and discrete prehension movements: Implications of the scanning procedure and individual differences. Human Movement Science, 17, 801-820.
Button, C., Bennett, S., and Davids, K. (2001). Grasping a better understanding of the intrinsic dynamics of rhythmical and discrete prehension. Journal of Motor Behavior, 22(1), 27-36.
Button, C., Davids, K., Bennett, S. J., and Taylor, M. A. (2000). Mechanical perturbation of the wrist during one-handed catching. Acta Psychologica, 105, 9-30.
Button, C., Davids, K., and Schöllhorn, W. (2006). Coordination profiling of movement systems. In K. Davids, S. Bennett and K. Newell (Eds.), Movement System Variability (pp. 133-152). Champaign, IL: Human Kinetics.
Button, C., MacLeod, M., Sanders, R., and Coleman, S. (2003). Examining movement variability in the basketball free-throw action at different skill levels. Research Quarterly for Exercise and Sport, 74(3), 257-269.
Byblow, W. D., Carson, R. G., and Goodman, D. (1994). Expressions of asymmetries and anchoring in bimanual coordination. Human Movement Science, 13, 3-28.

210
Byblow, W. D., Chua, R., Young, D. F. B., and Summers, J. J. (1999). Stabilisation of bimanual coordination through visual coupling. Human Movement Science, 18, 281-305.
Carson, R. G. (1995). The dynamics of isometric bimanual coordination. Experimental Brain Research, 105, 465-476.
Carson, R. G., Byblow, W. D., Abernethy, B., and Summers, J. J. (1996). The contribution of inherent and incidental constraints to intentional switching between patterns of bimanual coordination. Human Movement Science, 15, 565-589.
Carson, R. G., and Kelso, J. A. S. (2004). Governing coordination: behavioural principles and neural correlates. Experimental Brain Research(154), 267-274.
Carson, R. G., and Riek, S. (1998). The influence of joint position on the dynamics of perception-action coupling. Experimental Brain Research(121), 103-114.
Carson, R. G., Riek, S., Smethurst, C. J., Pàrraga, J. F. L. o., and Byblow, W. D. (2000). Neuromuscular-skeletal constraints upon the dynamics of unimanual and bimanual coordination. Experimental Brain Research, 131, 196-214.
Carter, M. C., and Shapiro, D. C. (1984). Control of sequential movements: Evidence for generalized motor programs. Journal of Neurophsiology, 52(5), 787-796.
Chen, H.-H., Liu, Y.-T., Mayer-Kress, G., and Newell, K. M. (2005). Learning the pedalo locomotion task. Journal of Motor Behavior, 37(3), 247-256.
Classen, J., Liepert, J., Wise, S. P., Hallet, M., and Cohen, L. G. (1998). Rapid platicity of human cortical movement representation induced by practice. Journal of Neurophsiology, 79, 1117-1123.
Corder, A. F., Levin, O., Li, Y., and Swinnen, S. P. (2005). Principal component analysis of complex multijoint coordinative movements. Biological Cybernetics, 93, 63-78.
Cordero, A. F., Koopman, H. J. F. M., and van der Helm, F. C. T. (2006). Describing gait as a sequence of states. Journal of Biomechanics, 39, 948-957.
Cordo, P. J., and Gurfinkel, V. S. (2004). Motor coordination can be fully understood only by studying complex movements. Progress in Brain Research, 143, 29-38.
Daffertshofer, A., Lamoth, C. J. C., Meijer, O. G., and Beek, P. J. (2004). PCA in studying coordination and variability: a tutorial. Clinical biomechanics(19), 415-428.
Davids, K., Button, C., Araújo, D., Renshaw, I., and Hristovski, R. (2006). Movement models from sport provide representative task constraints for studying adaptive behavior in human motor systems. Adaptive Behavior, 14, 73-94.

211
Davids, K., Renshaw, I., and Glazier, P. (2005). Movement models from sport reveal fundamental insight into coordination processes. Exercise and Sports Science Review, 33(1), 36-42.
Debicki, D. B., Gribble, P. L., Watts, S., and Hore, J. (2004). Kinematics of wrist joint flexion in overarm throws made by skilled subjects. Experimental Brain Research, 154, 382-394.
DeGuzman, G. C., Kelso, J. A. S., and Buchanan, J. J. (1997). Self-organization of trajectory formation. II. Theoretical model. Biological Cybernetics, 76, 275-284.
Dupuy, M. A., Mottet, D., and Ripoll, H. (2000). The regulation of release parameters in underarm precision throwing. Journal of Sport Sciences, 18, 375-382.
Edelman, G. M. (1987). Neural darwinism - The theory of neuronal group selection. New York: Basic Books, Inc.
Edelman, G. M. (1988). Topobiology: An introduction to molecular embryology. New York: Basic Books.
Edelman, G. M., and Gally, J. A. (2001). Degeneracy and complexity in biological systems. Proceedings of the National Academy of Sciences of the United States of America, 98(24), 13763-13768.
Edelman, G. M., and Tononi, G. (2000). A universe of consciousness: How matter becomes imagination. New York: Basic Books.
Elliot, B. (1992). A kinematic comparison of the male and female two-point and three-point jump shots in basketball. Australian Journal of Science and Medicine in Sport, 24(4), 111-118.
Elliot, B. C., and White, E. (1989). A kinematic and kinetic analysis of the female two point and three-point jump shots in basketball. Australian Journal of Science and Medicine in Sport, 21(2), 7-11.
Eurostat. (1994). Cijfers en feiten: Een statistisch portret van de Europese Unie. Retrieved. from.
Everitt, B. S., Landau, S., and Leese, M. (2001). Cluster analysis (Fourth ed.). London: Arnold.
Fink, P. W., Kelso, J. A. S., Jirsa, V. K., and de Guzman, G. (2000). Recruitment of degrees of freedom stabilizes coordination. Journal of Experimental Psychology: Human Perception and Performance, 26(2), 671-692.
Fuchs, A., and Jirsa, V. K. (2000). The HKB model revisited: How varying the degree of symmetry controls dynamics. Human Movement Science, 19, 425-449.

212
Fuchs, A., Jirsa, V. K., and Kelso, J. A. S. (2000). Theory of the Relation between Human Brain Activity (MEG) and Hand Movements. NeuroImage, 11, 359-369.
Gard, S. A., Knowx, E. H., and Childress, D. S. (1996). Two-dimensional representation of three-dimensional pelvic motion during human walking: An example of how projection can be misleading. Journal of Biomechanics, 29(10), 1387-1391.
Giraudoux, P. (2006). Pgirmess: Data analysis in ecology (Version 1.3.1) [R package].
Greenland, S. (2000). When should epidemiologic regressions use random coefficients? Biometrics, 56, 915-921.
Guerin, S., and Kunkle, D. (2004). Emergence of constraint in self-organizing systems. Nonlinear Dynamics, Psychology, and Life Science, 8(2), 131-146.
Haggard, P. (1994). Pertubation studies of coordinated prehension. In K. M. B. Bennett and U. Castiello (Eds.), Insights into the reach to grasp movement (pp. 151-170).
Haggard, P., and Wing, A. W. (1991). Remote reponses to perturbation in human prehension. Neurscience Letters, 122, 103-108.
Haken, H. (1983). Synergetics: An Introduction. Berlin; New York: Springer-Verlag.
Haken, H., Kelso, J. A. S., and Bunz, H. (1985). A theoretical model of phase transitions in human hand movements. Biological Cybernetics, 51, 347-356.
Haken, H., and Wunderlin, A. (1991). Die Selbstrukturierung der Materie. Braunschweig: Vieweg.
Halkidi, M., Batistakis, Y., and Vazirgiannis, M. (2002a). Cluster validity methods: Part I. SIGMOD Record, 31(2), 40-45.
Halkidi, M., Batistakis, Y., and Vazirgiannis, M. (2002b). Clustering validity checking methods: Part II. SIGMOD Record, 31(3), 19-27.
Hamill, J., Haddad, J. M., and McDermott, W. J. (2000). Issue in quantifying variability from a dynamical systems perspective. Journal of Applied Biomechanics, 16, 407-418.
Handl, J., Knowles, J., and Kell, D. B. (2005). Computational cluster validation in post-genomic data analysis. Bioinformatics, 21(15), 3201-3212.
Hang, D.-A., Cheung, T. K., and Roberts, E. M. (2001). A three-dimensional, six-segment chain analysis of forceful overarm throwing. Journal of Electromyography and Kinesiology, 11, 95-112.
Hayes, D. (1987). Body segment contributions to free throw shooting in basketball. Paper presented at the Biomechanics in Sports V: Proceedings of the Fifth International Symposium of Biomechanics in Sports, Athens: Hellenic Sports Research Institute.

213
Heise, G. D., and Cornwell, A. (1997). Relative contributions to the net joint moment for a planar multijoint throwing skill: Early and late in practice. Research Quarterly for Exercise and Sport, 68(2), 116-124.
Henning, C. (2006). fpc: Fixed point clusters, clusterwise regression and discriminant plots. (Version 1.2-2) [R package].
Hirashima, M., Kudo, K., and Ohtsuki, T. (2003). Uitlization and compensation of Interaction Torques during Ball-Throwing movements. Journal of Neurophysiology, 89, 1784-1796.
Hodges, N. J., Hays, S., Horn, R. R., and Williams, A. M. (2005). Changes in coordination, control and outcome as a result of extended practice on a novel motor skill. Ergonomics, 48, 1672-1685.
Hong, S. L., and Newell, K. M. (2006). Practice effects on local and global dynamics of the ski-simulator task. Experimental Brain Research, 169, 350-360.
Hore, J., Watts, S., and Tweed, D. (1994). Arm position contraints when throwing in three dimensions. Journal of Neurophsiology, 72(3), 1171-1180.
Hossner, E. J. (2000). Module der Motorik. Schorndorf: Hofmann.
Hudson, J. L. (1982). A biomechanical analysis by skill level of free throw shooting in basketball. Paper presented at the Biomechanics in sports: Proceedings of the international symposium of biomechanics in sports, Del Mar, CA.
Hudson, J. L. (1985). Prediction of basketball skill using biomechanical variables. Research Quarterly for Exercise and Sport, 56(2), 115-121.
Jaitner, T., Mendoza, L., and Schöllhorn, W. I. (2001). Analysis of the long jump technique in the transitions from approach to takeoff. Based on time-continuous kinematic data. European Journal of Sports Sciences, 1(5), 1-11.
Jeka, J. J., Kelso, J. A. S., and Kiemel, T. (1993). Spontaneous transitions and symmetry: Pattern dynamics in human four-limb coordination. Human Movement Science, 12, 627-651.
Jirsa, V. K., and Kelso, J. A. S. (2005). The excitator as a minimal model for the coordination dynamics of discrete and rhythmic movement generation. Journal of Motor Behavior, 37(1), 35-51.
Kao, J. C., Ringenbach, S. D., and Martin, P. E. (2003). Gait transitions are not dependent on changes in intralimb coordination variability. Journal of Motor Behavior, 35(3), 211-214.
Kaufmann, L., and Rousseeuw, P. J. (1990). Finding groups in data: An introduction to cluster analysis. New York: John Wiley & Sons, Inc.

214
Kay, B. A. (1988). The dimensionality of movement trajectories and the degrees of freedom problem: A tutorial. Human Movement Science, 7, 343-364.
Kelso, J. A. S. (1984). Phase transitions and critical behavior in human bimanual coordination. American Journal of Physiology: Regulatory, Integrative and Comparative Physiology, 246(6), 1000-1004.
Kelso, J. A. S. (1994). The informational character of self-organized coordination dynamics. Human Movement Science, 13, 393-413.
Kelso, J. A. S. (1995). Dynamic patterns: The self-organization of brain and behavior. Cambridge, Mass.: MIT Press.
Kelso, J. A. S. (1998). From Bernstein's physiology of activity to coordination dynamics. In M. L. Latash (Ed.), Bernstein's traditions in movement studies (Vol. One, pp. 203-219). Champaign: Human Kinetics.
Kelso, J. A. S., Buchanan, J. J., and Murata, T. (1994). Multifunctionality and switching in the coordination dynamics of reaching and grasping. Human Movement Science, 13, 63-94.
Kelso, J. A. S., Buchanan, J. J., and Wallace, S. A. (1991a). Order parameters for the neural organization of single, multijoint limb movement patterns. Experimental Brain Research, 85, 432-444.
Kelso, J. A. S., Buchanan, J. J., and Wallace, S. A. (1991b). Order parameters for the neural organization of single, multijoint limb movement patterns Experimental Brain Research, 85(2), 432-444.
Kelso, J. A. S., Fink, P. W., DeLaplain, C. R., and Carson, R. G. (2001). Haptic information stabilizes and destabilizes coordination dynamics. Proceedings of the Royal Society London B., 268, 1207-1213.
Kelso, J. A. S., Fuchs, A., Lancaster, R., Holroyd, T., Cheyne, D., and Weinberg, H. (1998). Dynamic cortical activity in the human brain reveals motor equivalence. Nature, 392(23), 814-818.
Kelso, J. A. S., and Jeka, J. J. (1992). Symmetry breaking dynamics of human multilimb coordination. Journal of Experimental Psychology: Human Perception and Performance, 18(3), 645-668.
Kelso, J. A. S., Scholz, J. P., and Schöner, G. (1986). Nonequilibrium phase transitions in coordinated biological motion: critical fluctuations. Physics Letters A, 118(6), 279-284.
Kelso, J. A. S., and Schöner, G. (1988). Self-organization of coordinative movement patterns. Human Movement Science, 7, 27-46.

215
Kelso, J. A. S., and Zanone, P. G. (2002). Coordination dynamics of learning and transfer across different effector systems. Journal of Experimental Psychology: Human Perception and Performance, 28(4), 776-797.
Ketchen, D. J., Jr., and Shook, C. L. (1996). The application of cluster analysis in strategic management research: an analysis and critique. Strategic Management Journal, 17, 441-458.
Kienast, G., Bachmann, D., Steinwender, G., Zwick, E.-B., and Saraph, V. (1999). Determination of gait patterns in children with cerebral palsy using cluster analysis. Gait and Posture, 10, 57.
Kohonen, T. (1990). The self-organizing map. Proceedings of the IEEE, 78(9), 1464-1480.
Kohonen, T. (2001). Self-organizing maps (Third ed.). Berlin; New York: Springer.
Kostrubiec, V., Tallet, J., and Zanone, P.-G. (2006). How a new behavioral pattern is stabilized with learning determines its persistence and flexibility in memory. Experimental Brain Research, 170, 238-244.
Kostrubiec, V., and Zanone, P. G. (2002). Memory dynamics: distance between the new task and existing behavioural patterns affects learning and interference in bimanual coordination in humans. Neuroscience Letters, 331, 193-197.
Kreighbaum, E., and Barthels, K. M. (1996). Biomechanics: A qualitative approach for studying human movement (Fourth ed.). Boston: Allyn and Bacon.
Kudo, K., Tsusui, S., Ishikura, T., Ito, T., and Yamamoto, Y. (2000). Compensatory coordination of release parameters in a throwing task. Journal of Motor Behavior, 32(4), 337-345.
Kuiper, F. K., and Fisher, L. (1975). A monte carlo comparison of six clustering procedures. Biometrics, 31, 777-783.
Laird, N. M., and Ware, J. H. (1982). Random-effects models for longitudinal data. Biometrics, 38(4), 963-974.
Lames, M. (1992). Synergetik als Konzept in der Sportmotorik. Sportpsychologie, 3, 12-18.
Landin, D. K., Herbert, E. P., and Fairweather, M. (1993). The effects of variable practice on performance of a basketball skill. Research Quarterly for Exercise and Sport, 64(2), 232-237.
Lee, T. D. (2004). Intention in Bimanual Coordination Performance and Learning. In V. Jirsa and J. A. S. Kelso (Eds.), Coordination dynamics: Issues and trends (pp. 42-56). New York: Springer.

216
Li, Y., Levin, O., Cordero, A. F., and Swinnen, S. P. (2005). Interactions between interlimb and intralimb coordination during the performance of bimanual multijoint movements. Experimental Brain Research, 163, 515-526.
Limerick, R. B., Shemmell, J., Barry, B. K., Carson, R. G., and Abernethy, B. (2001). Spontaneous transitions in the coordination of a whole body task. Human Movement Science, 20, 549-562.
Lindenberg, A. M., Ziemann, U., Hajak, G. o., Cohen, L., and Faith Berman, K. (2002). Transitions between dynamical states of differing stability in the human brain. Proceedings of the National Academy of Sciences of the United States of America, 99(17), 10948-10953.
Liu, S., and Burton, A. W. (1999). Changes in basketball shooting patterns as a function of distance. Perceptual and Motor Skill, 89, 831-845.
Liu, Y.-T., Mayer-Kress, G., and Newell, K. M. (1999). A piecewise linear, stochastic map model for the sequential trial strategy of discrete timing tasks. Acta Psychologica, 103, 207-228.
Magill, R. A. (1989). Motor learning: concepts and application (Third ed.). Dubuque, Iowa: Wm. C. Brown Publishers.
Martin, T. S. (1992). The art of shooting baskets: from the free throw to the slam dunk. Chicago: Contemporary Books.
McDonald, P. V., van Emmerik, R. E. A., and Newell, K. M. (1989). The effects of practice on limb kinematics in a throwing task. Journal of Motor Behavior, 21(3), 245-264.
Mechsner, F., Kerzel, D., Knoblich, G. u., and Prinz, W. (2001). Perceptual basis of bimanual coordination. Nature, 414(1), 69-73.
Miall, R. C., and Ivry, R. (2004). Moving to a different beat. Nature Neuroscience, 10(7), 1025-1026.
Miller, S. (2000). Variability in basketball shooting: Practical implications. Paper presented at the XVIII International Symposium of Biomechanics in Sports, Hong Kong, China.
Miller, S. (2002). Variability in basketball shooting: Pracital implications. In Y. Hong (Ed.), International research in sports biomechanics. New York: Routledge.
Miller, S., and Bartlett, R. (1996). The relationship between basketball shooting kinematics, distance and playing position. Journal of Sports Sciences, 14, 243-253.
Miller, S., and Bartlett, R. M. (1993). The effects of increased shooting distance in the basketball jump shot. Journal of Sport Sciences, 11, 285-293.

217
Miller, S. A. (1996). The relationship between kinematic variables and shooting distance in basketball: a re-evaluation. Paper presented at the Proceedings XIV International Symposium on Biomechanics in Sports.
Miller, S. A., and Bartlett, R. M. (1991). A three-dimensional and temporal analysis of the effects on increased shooting distance in the basketball jump shot. Journal of Sports Sciences, 9, 403-404.
Morris, M. E., Summers, J. J., Matyas, T. A., and Iansek, R. (1994). Current status of the motor program. Physical Therapy, 74(8), 738-752.
Mullineaux, D. R., Bartlett, R. M., and Bennett, S. (2001). Research design and statistics in biomechanics and motor control. Journal of Sports Sciences, 19, 739-760.
Newell, K. M., Liu, Y.-T., and Kress, G. M. (2001). Times scales in motor learning and development. Psychological Review, 108(1), 57-82.
Newell, K. M., and Vaillancourt, D. E. (2001). Dimensional change in motor learning. Human Movement Science, 20, 695-715.
O'Byrne, J. M., Jenkinson, A., and O'Brien, T. M. (1998). Quantitative analysis and classification of gait patterns in cerebral palsy using a three-dimensional motion analyzer. Journal of Child Neurology, 13(3), 101-108.
Obhi, S. S. (2004). Bimanual coordination: An unbalanced field of research. Motor Control, 8, 111-120.
Page, A., and Epifanio, I. (2007). A simple model to analyze the effectiveness of linear time normalization to reduce variability in human movement analysis. Gait and Posture, 25, 153-156.
Peper, C. E., and Beek, P. J. (1998). Are frequency-induced transitions in rhythmic coordination mediated by a drop in amplitude? Biological Cybernetics, 79, 291-300.
Perl, J. (2004). A neural network approach to movement pattern analysis. Human Movement Science, 23, 605-620.
Pinheiro, J., Bates, D., DebRoy, S., and Sarkar, D. (2006). nlme: Linear and nonlinear mixed effects models (Version 3.1-73) [R package].
Pinheiro, J. C., and Bates, D. M. (2000). Mixed-effects models in S and S-PLUS. New York: Springer.
Post, A. A., Daffertshofer, A., and Beek, P. J. (2000a). Principal components in three-ball cascade juggling. Biological Cybernetics, 82, 143-152.

218
Post, A. A., Peper, C. E., Daffertshofer, A., and Beek, P. J. (2000b). Relative phase dynamics in perturbed interlimb coordination: stability and stochasticity. Biological Cybernetics, 82, 443-459.
Punj, G., and Stewart, D. W. (1983). Cluster analysis in marketing research: Review and suggestions for application. Journal of Marketing Research, 20(2), 134-148.
R Development Core Team. (2006). R: A language and environment for statistical computing (Version 2.3.1). Vienna, Austria: R Foundation for Statistical Computing.
Rab, G., Petuskey, K., and Bagley, A. (2002). A method for determination of upper extremity kinematics. Gait and Posture, 15, 113-119.
Reboussin, D. M., and Morgan, T. M. (1996). Statistical consideration in the use and analysis of single-subject designs. Medicine and Science in Sport and Exercise, 28(5), 639-644.
Rojas, F. J., Ceperot, M., Oña, A., and Guiterrez, M. (2000). Kinematic adjustments in the basketball jump shot against an opponent. Ergonomics, 43(10), 1651-1660.
Saltzman, E., and Kelso, J. A. S. (1987). Skilled actions: A task-dynamic approach. Psychological Review, 94(1), 84-106.
Sames, J. N. (2000). The Relation between Human Brain Activity and Hand Movements. NeuroImage, 11, 370-374.
Satern, M. N., and Keller-McNulty, S. (1992). Use of position-time graphs to compare free throw shooting styles of adult male and female basketball players. Journal of Human Movement Studies, 22, 13-33.
Satern, M. N., Messier, S. P., and NcNulty, S. K. (1989). The effect of ball size and basket height on the mechanics of the basketball free throw. Journal of Human Movement Studies, 16, 123-137.
Schaal, S., Sternad, D., Osu, R., and Kawato, M. (2004). Rhythmic arm movement is not discrete. Nature Neuroscience, 7(10), 1137-1144.
Schaffer, C. M., and Green, P. E. (1996). An empirical comparison of variable standardization methods for cluster analysis. Multivariate Behavioral Research, 31(2), 149-167.
Schmidt, O. A., Schöllhorn, W. I., and Bauer, H. U. (1997). Gait pattern analysis using self-organizing neural network. Gait and Posture, 6, 268-269.
Schmidt, R. A. (1975). A schema theory of discrete motor skill learning. Psychological Review, 82(4), 225-260.
Schmidt, R. A. (2003). Motor schema theory after 27 years: Reflections and Implications for a new theory. Research Quarterly for Exercise and Sport, 74(4), 366-375.

219
Schmidt, R. C., Carello, C., and Turvey, M. T. (1990). Phase transitions and critical fluctuations in the visual coordination of rhythmic movements between people. Journal of Experimental Psychology: Human Perception and Performance, 16(2), 227-247.
Schöllhorn, W. I. (1993). Biomechanische Einzellfallanalyse im Diskuswurf: Prozeß- und produktorientierte Technikanalyse mechanischer Energieformen. Frankfurt am Main: Thun.
Schöllhorn, W. I. (1995). Systemdynamische Betrachtung komplexer Bewegungsmuster im Lernprozess. Unpublished Habilitation, Deutsche Sporthochschule, Köln.
Schöllhorn, W. I. (1998). Systemdynamische Betrachtung komplexer Bewegungsmuster im Lernprozess. Frankfurt am Main: Lang.
Schöllhorn, W. I. (2004). Applications of artificial neural nets in clinical biomechanics. Clinical Biomechanics, 19, 876-898.
Schöllhorn, W. I., Nigg, B. M., Stefanshyn, D. J., and Liu, W. (2002). Identification of individual walking patterns using time discrete and time continuous data sets. Gait and Posture, 15, 180-186.
Schöllhorn, W. I., Stefanyshyn, D. J., Nigg, B. M., and Liu, W. (1999). Recognition of individual walking patterns by means of artificial neural nets. Gait and Posture, 10(1), 86.
Scholz, J. P., and Kelso, J. A. S. (1989). A quantitative approach to understanding the formation and change of coordinated movement patterns. Journal of Motor Behavior, 21(2), 122-144.
Scholz, J. P., Kelso, J. A. S., and Schöner, G. (1987). Nonequilibrium phase transitions in coordinated biological motion: critical slowing down and switching time. Physics Letters A, 123(8), 390-394.
Scholz, J. P., and McMillian, A. G. (1995). Neuromuscular coordination of squat lifting, II: Individual differences. Physical Therapy, 75(2), 133-144.
Scholz, J. P., Millford, J. P., and McMillan, A. G. (1995). Neuromuscular coordination of squat lifting, I: Effect of load magnitude. Physical Therapy, 75(2), 44-57.
Scholz, J. P., and Schöner, G. (1999). The uncontrolled manifold concept: identifying control variables for a functional task. Experimental Brain Research(126), 289-306.
Schöner, G. (1990). A dynamic theory of coordination of discrete movement. Biological Cybernetics, 63, 257-270.
Schöner, G. (1995). Recent developments and problems in human movement science and their conceptual implications. Ecological Psychology, 7(4), 291-314.

220
Schöner, G. (2002). Timing, clocks, and dynamical systems. Brain and Cognition, 48, 31-51.
Schöner, G., Haken, H., and Kelso, J. A. S. (1986). A stochastic theory of phase transitions in human hand movement. Biological Cybernetics, 53, 247-257.
Schöner, G., and Kelso, J. A. S. (1988a). Dynamic pattern generation in behavioral and neural systems. Science, 239, 1513-1520.
Schöner, G., and Kelso, J. A. S. (1988b). A dynamic pattern theory of behavioral change. Journal of Theoretical Biology, 135, 501-524.
Schöner, G., and Scholz, J. P. (under review). Analyzing multi-degree-of-freedom movement system based on variance: Uncovering structure vs. extracting correlations.
Serrien, D. J., and Swinnen, S. P. (1997). Coordination constraints induced by effector combination under isofrequency and multifrequency conditions. Journal of Experimental Psychology: Human Perception and Performance, 23(5), 1493-1510.
Serrien, D. J., and Swinnen, S. P. (1999). Intentional switching between behavioral patterns of homologous and nonhomologous effector combinations. Journal of Experimental Psychlogy: Human Perception and Performance, 25(5), 1253-1267.
Shimodaira, H. (2002). An approximately unbiased test of phylogenetic tree selection. Systematic Biology, 51(3), 492-508.
Shimodaira, H. (2004). Approximately unbiased tests of regions using multistep-multiscale bootstrap resampling. The Annals of Statistics, 32(6), 2616-2641.
Shimodaira, H. (2006). Scaleboot: Approximately unbiased p-values via multiscale bootstrap (Version 0.2-2) [R package].
Sidaway, B., Heise, G., and Schoenfelder-Zohdi, B. (1995). Quantifying the variability of angle-angle plots. Journal of Human Movement Studies, 29, 181-197.
Siegel, S., and Castellan, N. J., Jr. (1988). Nonparametric statistics for the behavioral sciences (Second ed.). New York: McGraw-Hill Book Company.
Sithole, J. S., and Jones, N. L. (2002). Repeated measures models for prescribing change. Statistics in Medicine, 21, 571-587.
Smethurst, C. J., and Carson, R. G. (2001). The acquisition of movement skills: Practice enhances the dynamic stability of bimanual coordination. Human Movement Science, 20, 499-529.
Sorensen, V., Ingvaldsen, R. P., and Whiting, H. T. A. (2001). The application of co-ordinative dynamics to the analysis of discrete movements using table-tennis as a paradigm skill. Biological Cybernetics, 85, 27-38.

221
Southard, D. (1998). Mass and velocity: control parameters for throwing patterns. Research Quarterly for Exercise and Sport, 69(1), 355-359.
Southard, D. (2002). Change in Throwing Pattern: Critical Values for Control Parameter of Velocity. Research Quarterly for Exercise and Sport, 73(4), 396-407.
Sporns, O., and Edelman, G. M. (1993). Solving Bernstein's problem: A proposal for the development of coordinated movement by selection. Child Development, 64, 960-981.
Sporns, O., Tononi, G., and Edelman, G. M. (2002). Theoretical neuroanatomy and the connectivity of the cerebral cortex. Behavioural Brain Research, 135, 69-74.
Sternad, D. (1998). A dynamic systems perspective to perception and motion. Research Quarterly for Exercise and Sport, 69(4), 319-326.
Sternad, D., Duarte, M., Katsumata, H., and Schaal, S. (2000). Dynamics of a bouncing ball in human performance. Physical Review E, 63.
Steuer, R., Kurths, J., Daub, C. O., Weise, J., and Selbig, J. (2002). The mutual information: Detecting and evaluating dependencies between variables. Bioinformatics, 18, 231-240.
Stuart, M. (1982). A geometric approach to principal components analysis. The American Statistician, 36(4), 365-367.
Sullivan, L. M., Dukes, K. A., and Losina, E. (1999). Tutorial in biostatistics an introduction to hierarchical linear modelling. Statistics in Medicine, 18, 855-888.
Summers, J. J. (1998). Has ecological psychology delivered what it promised. In J. P. Piek (Ed.), Motor behavior and human skill: A multidisciplinary approach. Champaign, IL: Human Kinetics Publishers, Inc.
Suzuki, R., and Shimodaira, H. (2004). An application of multiscale bootstrap resampling to hierarchical clustering of microarry data: How accurate are these clusters? Paper presented at the The Fifteenth International Conference on Genome Informatics, Yokohama.
Suzuki, R., and Shimodaira, H. (2006a). pvclust: Hierarchical clustering with p-values via multiscale bootstrap resampling (Version 1.2-0) [R package ].
Suzuki, R., and Shimodaira, H. (2006b, Aug 9th). An R package for hierarchical clustering with p-values. from http://www.is.titech.ac.jp/~shimo/prog/pvclust/
Swinnen, S. P., and Carson, R. G. (2002). The control and learning of patterns of interlimb coordination: past and present issues in normal and disordered control. Acta Psychologica, 110, 129-137.

222
Temprado, J. J., Monno, A., Zanone, P. G., and Kelso, J. A. S. (2002). Attentional demands reflect learning-induced alterations of bimanual coordination dynamics. European Journal of Neuroscience, 16, 1390-1394.
Thelen, E. (1995). Motor Development A New Synthesis. American Psychologist, 50(2), 79-95.
Tononi, G., Sporns, O., and Edelman, G. M. (1999). Measures of degeneracy and redundancy in biological networks. Proceedings of the National Academy of Sciences of the United States of America, 96, 3257-3262.
Toro, B., Nester, C. J., and Farren, P. C. (2007). Cluster analysis for the extraction of sagittal gait patterns in children with cerebral palsy. Gait and Posture, 25, 157-165.
Turvey, M. T. (1990). Coordination. American Psychologist, 45(8), 938-953.
van Emmerik, R. E. A., and van Wegen, E. E. H. (2000). On Variability and Stability in Human Movement. Journal of Applied Biomechanics, 16, 394-406.
van Mourik, A. M., and Beek, P. J. (2004). Discrete and cyclical movements: unified dynamics or separate control? Acta Psychologica, 117, 121-138.
Verbeke, G., and Molenberghs, G. (2000). Linear mixed models for longitudinal data. New York: Springer.
Vereijken, B., Emmerik, R. E. A. V., Bongaardt, R., Beek, W. J., and Newell, K. M. (1997). Changing coordinative structures in complex skill acquisition. Human Movement Science, 16, 823-844.
Vereijken, B., van Emmerik, R. E. A., Whiting, H. T. A., and Newell, K. M. (1992). Free(z)ing degrees of freedom in skill acquisition. Journal of Motor Behavior, 24(1), 133-142.
Walter, C. (1998). An alternative view of dynamical systems concepts in motor control and learning. Research Quarterly for Exercise and Sport, 69(4), 326-334.
Walters, M., Hudson, J., and Bird, M. (1990). Kinematic Adjustments in Basketball Shooting at three distances. Paper presented at the Proceedings of the International Symposium of Biomechanics in Sports, Prague.
Ware, J. H. (1985). Linear models for the analysis of longitudinal studies. The American Statistician, 39(2), 95-101.
Wei, K., Wertman, G., and Sternad, D. (2003). Interactions Between Rhythmic and Discrete Components in a Bimanual Task. Motor Control, 7, 134-154.
Weiss, R. E. (2005). Modeling longitudinal data. New York; London: Springer.
223
Williams, K., Haywood, K., and VanSant, A. (1998). Changes in Throwing by Older Adults: A Longitudinal Investigation. Research Quarterly for Exercise and Sport, 69(1), 1-10.
Wilson, B. D., and Howard, A. (1983). The use of cluster analysis in movement description and classification of the backstroke swim start. Paper presented at the Biomechanics VIII: Proceeding of the Eight International Congress of Biomechanics, Nagoya, Japan.
Wimmers, R. H., Savelsbergh, G. J. P., Beek, P. J., and Hopkins, B. (1998). Evidence for a Phase Transition in the Early Development of Prehension. Developmental Psychobiology, 32(3), 235-248.
Zanone, P. G., and Kelso, J. A. S. (1992). Evolution of behavioral attractors with learning: Nonequilibrium phase transitions. Journal of Experimental Psychology: Human Perception and Performance, 18(2), 403-421.
Zanone, P. G., and Kelso, J. A. S. (1997). Coordination dynamics of learning and transfer: Collective and component levels. Journal of Experimental Psychology: Human Perception and Performance, 23(5), 1454-1480.
Zanone, P. G., and Kostrubiec, V. (2004). Searching for (Dynamic) Principles of Learning. In V. Jirsa and J. A. S. Kelso (Eds.), Coordination dynamics: Issues and trends (pp. 57-89). New York: Springer.
Zhan, S., and Ottenbacher, K. J. (2001). Single subject research designs for disability research. Disability and Rehabilitation, 23(1), 1-8.

224
10 Appendix A – Individual results of cluster analysis from Chapter 7
In Table 10-1 the results of the bootstrapping procedure and the according number of
trials contained in each identified cluster are shown.
Table 10-1: Results of multi-scale bootstrapping procedure (p-values) for each cluster for each participant and number (no.) of trials contained in each cluster.
Cluster 1 Cluster 2 Cluster 3 Cluster 4 Cluster 5 Cluster 5 Cluster 6 Participant
p no p no p no p no p no p no p no
AN 87 63 90 93 NA 1 NA 1
CAL 83 12 99 70 98 78
CR 86 76 78 33 91 51
LU NA 1 99 155
MI 95 96 97 33 NA 1 94 4 NA 1 89 22 NA 1
The number of identified clusters varied between 6 clusters for participant MI and 2
clusters for participant LU and in general the obtained p-values supported the results of the
cluster analysis quite strongly. For LU cluster 1 contained only a singular trial which was
identified as an outlier and no clear clustering structure could be recovered from the cluster
analysis of the remaining trials. The bootstrapping procedure indicated higher stability for
lower grouping. However, these were not supported by the Hubert-Γ scores, therefore no
further separation into different clusters was applied (compare Figure 9-1). For the complete
results from the cluster analysis compare Appendix C.

225
131
154
111
310 16 2 9 4
14 1 57 8 1
2 617
15 2111 13 25 26
18 1914
115
6 140
144
151 35
27 28 3812
924
20 2213
712
713
6 139
142
152
146
147
143
153
145
149
148
150
155
134
135
5167 73
23 102
99 108 7
791 98 11
311
913
312
211
712
4 114
120 12
312
811
812
1 6370 72
37 64 6510
759 61
57 62 45 54 34 48 47 31 33 42 56 39 30 32 44 50 29 49 43 53 41 55 4640 60
36 52 132
138 13
010
911
611
511
212
512
610
096 105 84 94 8
5 8780
74 83 86 82 9758 93
110
103
89 104
9575 76
90 101 81 88 79 92 66 106
6978
68 71
010
020
030
040
050
0
Cluster method: averageDistance: euclidean
Hei
ght
100100 10093100 100 10072 7292 6496 9897 100100100100 78 7199 98 658384 10010093 645186 10068 83 94779268 80 83798273 83 9887 72 80 954573 84 6498 81 93 716393 9065 8793 9395 9898100 8897 867899 776886 8098 94 909476 99 939092 53 949292 99 9690 99834189 95 7890 769997 100 9679 9491 9488 76 8889 81 98 92999785 82 9286 9570 100 9693 94 9698 100 9596 9381 99 9997 100 1001009895 10092 1009979 97938571
63100
au
5 10 15 20
0.3
0.6
Number of clusters(#)
Hub
ert-Γ
B.
A.
Figure 10-1: (A) Results of bootstrapping procedure for participant LU (B) Plot of Hubert-Γ scores against number of clusters for participant LU.
For the remaining participants the identified clusters were well supported by both the
bootstrapping procedure and the Hubert- Γ scores. The individual results will be presented in
the order of the performance starting with the most successful participants and ending with
the least successful.
Participant CR
For participant CR a three cluster solution was obtained with relatively equal spread of
trials across the clusters. Investigation of the angle-angle plot for the right arm indicated that
the movement was initiated by abduction of the shoulder joint followed by synchronous
flexion and abduction in the elbow joint and the shoulder joint (see Figure 9-2.a). Comparison
of the movement clusters indicated differences especially between movement clusters 2 and 3
and movement cluster 1. For movement cluster 1 mean starting angles were -76°±4° STD,
whereas for cluster 2 and 3 angles of -92°±7° STD and -89°±6° STD accordingly were found.
For the starting angles of the right elbow joint, movement clusters showed values of 86°±3°
STD for movement cluster 1, 84°±5° STD for movement cluster 2, and 78°±8° STD for
movement cluster 3. Investigation of the left arm kinematics made the differences between the
movement clusters apparent. Especially kinematic differences between movement cluster 3

226
and movement clusters 1 and 2 were clearly visible (see Figure 9-2.b). These differences
stemmed from both joints, where for movement cluster 3 the elbow joint showed greater
flexion paired with greater abduction angles in the shoulder joint compared to movement
clusters 1 and 2. With regards to differences between movement clusters 1 and 2, the plots
gave also some indication based on the starting flexion angles of the elbow joint which were
slightly greater for movement cluster 2 (97°±5° STD) compared to cluster 1 (89°±7° STD).
Hence, relating these findings to the somewhat lower p-values obtained during the
bootstrapping procedure which indicated that movement clusters 1 and 2 showed lower
stability, this finding could have been a result of the considerable overlap between the two
movement patterns. Kinematics of the left leg showed no peculiar differences between the
movement clusters and were marked by high stability across all trials and movement clusters
(compare Figure 9-2.c). Plots followed a diagonal pattern with a negative slope of 45°.

227
20 30 40 50 60 70 80 90 100
-150
-140
-130
-120
-110
-100
-90
-80
-70
Right elbow flexion angle (°)
Rig
ht s
houl
der a
bduc
tion
angl
e (°
)
0 10 20 30 40 50 60 7050
60
70
80
90
100
110
120
Left elbow flexion angle (°)
Left
incl
uded
sho
ulde
r ang
le (°
)
-10 0 10 20 30 40-50
-40
-30
-20
-10
0
Left hip flexion angle (°)
Left
knee
flex
ion
angl
e (°
)
(c)
(a) (b)
Cluster 1Cluster 2Cluster 3
Figure 10-2: Angle-angle plots for all movement clusters of participant CR. (a) Angle-angle plot of right shoulder joint abduction angles against right elbow joint flexion angles. (b) Angle-angle plot of left included shoulder joint angle against left elbow joint flexion angle. (c) Angle-angle plot of left knee joint flexion angle against left hip join flexion angle.
Investigation of the cluster distribution across throwing distances and conditions for
participant CR revealed a progression between the three movement clusters. Cluster selection
was marked by high stability with few alternations between the different movement clusters.
Movement clusters 2 and 3 were present mainly at smaller throwing distances, whereas
movement cluster 1 represented trials from greater throwing distances. During the INC
condition CR started with movement cluster 3, which was used until 7m distance, where a
switch to cluster 1 occurred. Subsequently movement cluster 1 was maintained until 4m,
where the participant switched to movement cluster 2. Switches between clusters were always
initiated by changes in the throwing distances, where each time the first movement clusters at
a new throwing distance belonged to the subsequently stabilized movement cluster. With
regards to the progression of the movement (3→1→2), the distribution clearly resembled a
hysteresis effect. Relating the cluster progression to the movement kinematics, since the

228
initial movement cluster (cluster 3) showed quite peculiar differences to movement clusters 1
and 2, potentially the execution of shots from higher throwing distance influenced the
subsequent execution of throws from lower distances. This finding could have lead to a
greater similarity between the later movement clusters and resembling some sort of learning
effect and more in reminiscence of a movement scaling approach.
2 3 4 5 6 7 8 9 9 8 7 6 5 4 3 2
1
2
3
Distance(m)
Clu
ster
[#]
80
90
100
110
120
130
140
150
Fluc
tuat
ions
[°]
Figure 10-3 : Distribution of movement clusters (●) against trials grouped by distance in ordering of actual occurrence for participant CR. Mean dissimilarity scores at each according throwing distance by direction are superimposed (-●-).
The fluctuations showed in general a decreasing trend over the course of the
experiment with some slight peaks at 6m during INC (95°→123°) and at 5m during DEC
(87°→98°), which accompanied the occurrences of switches between movement clusters.
In summary, for participant CR the results obtained from the cluster analysis indicated
the adaptation of a single unimodal attractor landscape to the throwing distance. The
movement patterning showed a clear hysteresis effect but gave little support for the presence
of critical fluctuations. Regarding the differences between the movement patterns at the end
and the beginning of the experiment, movement kinematics of the non-throwing arm showed
strong significant differences potentially suggestive of a learning effect.
229
Participant LU
As pointed out earlier, for Participant LU no true clustering could be identified, and
therefore, only a general overview over the kinematics will be given. Regarding the
coordination of the right arm participant LU used a movement pattern with small ranges of
motion in the right elbow joint (11°±4° STD, compare Figure 9-4.a). The plots appeared very
similar across trials supporting the conclusion of no true clustering. Interestingly, the single
trial which deviated completely from the remaining trials showed a coordination pattern
resembling the pattern found for participants BR, JA, and NI in Chapter 6. The coordination
of the left arm showed considerable variation but no clear patterning across trials between the
left shoulder joint and left elbow joint was visible (compare Figure 9-4.b). The kinematics of
the left leg again showed a trend similar to the right arm with very little inter-trial variation
also exhibiting the -45° degree pattern shown by the previous participants and in the other
studies (see Figure 9-4.c).

230
20 40 60 80 100-120
-110
-100
-90
-80
-70
-60
-50
-40
-30
-20
Right elbow flexion angle (°)
Rig
ht s
houl
der a
bduc
tion
angl
e (°
)
40 50 60 70 80
35
40
45
50
55
60
65
70
75
Left elbow flexion angle (°)
Left
incl
uded
sho
ulde
r ang
le (°
)
-10 0 10 20 30
-50
-45
-40
-35
-30
-25
-20
-15
-10
-5
Left hip flexion angle (°)
Left
knee
flex
ion
angl
e (°
)
(c)
(a) (b)
Cluster 1
Cluster 2
Figure 10-4 : Angle-angle plots for all movement clusters of participant LU. (a) Angle-angle plot of right shoulder joint abduction angles against right elbow joint flexion angles. (b) Angle-angle plot of left included shoulder joint angle against left elbow joint flexion angle. (c) Angle-angle plot of left knee joint flexion angle against left hip join flexion angle.
The fluctuations showed only one peculiar peak which seemed to be mostly influenced
by the outlying trial. Regarding the obvious differences between the singular trial and the
remaining trials, this effect can be seen as an example where in subsequent trials transitions
between movement patterns could be achieved in discrete movement which, as pointed out
earlier, is not possible for continuous movements (see Figure 9-5).
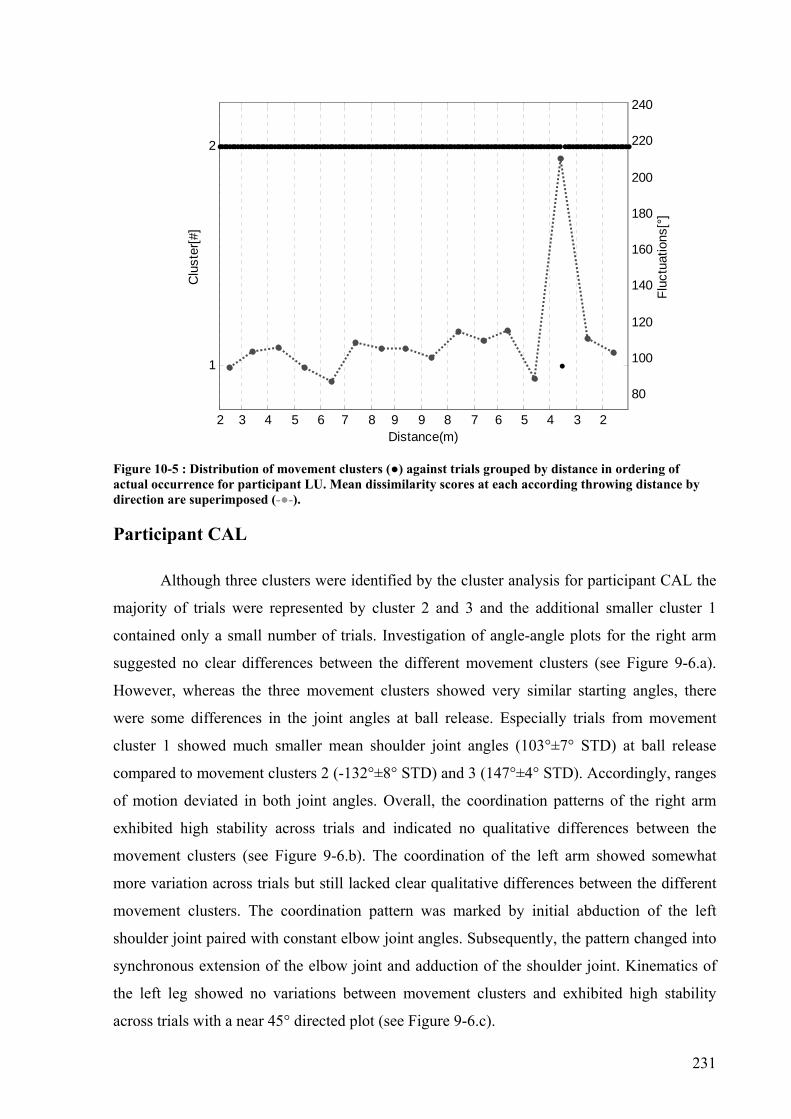
231
2 3 4 5 6 7 8 9 9 8 7 6 5 4 3 2
1
2
Distance(m)
Clu
ster
[#]
80
100
120
140
160
180
200
220
240
Fluc
tuat
ions
[°]
Figure 10-5 : Distribution of movement clusters (●) against trials grouped by distance in ordering of actual occurrence for participant LU. Mean dissimilarity scores at each according throwing distance by direction are superimposed (-●-).
Participant CAL
Although three clusters were identified by the cluster analysis for participant CAL the
majority of trials were represented by cluster 2 and 3 and the additional smaller cluster 1
contained only a small number of trials. Investigation of angle-angle plots for the right arm
suggested no clear differences between the different movement clusters (see Figure 9-6.a).
However, whereas the three movement clusters showed very similar starting angles, there
were some differences in the joint angles at ball release. Especially trials from movement
cluster 1 showed much smaller mean shoulder joint angles (103°±7° STD) at ball release
compared to movement clusters 2 (-132°±8° STD) and 3 (147°±4° STD). Accordingly, ranges
of motion deviated in both joint angles. Overall, the coordination patterns of the right arm
exhibited high stability across trials and indicated no qualitative differences between the
movement clusters (see Figure 9-6.b). The coordination of the left arm showed somewhat
more variation across trials but still lacked clear qualitative differences between the different
movement clusters. The coordination pattern was marked by initial abduction of the left
shoulder joint paired with constant elbow joint angles. Subsequently, the pattern changed into
synchronous extension of the elbow joint and adduction of the shoulder joint. Kinematics of
the left leg showed no variations between movement clusters and exhibited high stability
across trials with a near 45° directed plot (see Figure 9-6.c).

232
20 40 60 80 100 120
-150
-140
-130
-120
-110
-100
-90
-80
-70
-60
-50
Right elbow flexion angle (°)
Rig
ht s
houl
der a
bduc
tion
angl
e (°
)
30 40 50 60 70 80 90
60
70
80
90
100
110
120
Left elbow flexion angle (°)
Left
incl
uded
sho
ulde
r ang
le (°
)
0 10 20 30 40 50 60
-80
-70
-60
-50
-40
-30
-20
Left hip flexion angle (°)
Left
knee
flex
ion
angl
e (°
)
(c)
(a) (b)
Cluster 1Cluster 2Cluster 3
Figure 10-6 : Angle-angle plots for all movement clusters of participant CAL. (a) Angle-angle plot of right shoulder joint abduction angles against right elbow joint flexion angles. (b) Angle-angle plot of left included shoulder joint angle against left elbow joint flexion angle. (c) Angle-angle plot of left knee joint flexion angle against left hip join flexion angle.
When plotting the clusters against the trial sequence the movement cluster distribution
showed a relation to the throwing distance (see Figure 9-7). Movement cluster 3 was mainly
used during the lower distances whereas movement clusters 1 and 2 were distributed over the
higher distances. During the INC condition movement cluster 3 was used up to 5m where a
switch to movement cluster 2 occurred. Afterwards movement cluster 2 was prominent until
9m DEC with some singular occurrences of movement cluster 3. At 9m a switch to movement
cluster 1 occurred but only to become immediately unstable again during the following
throwing distances and movement cluster 2 became again the preferred movement pattern.
Subsequently, movement cluster 2 was used only for one more distance bin and at 6m
distance the final switch back to movement cluster 3 occurred. Between 6m and 4m the
participant exhibited some alternations between clusters 2 and 3 until 3m from where onwards

233
only cluster 1 was used. Regarding the distribution of the movement cluster, no clear
indication of hysteresis effects were found. Regarding the differences between INC and DEC,
the transitions were made at 5m and 6m accordingly. Especially during DEC, some
alternations were present where the participant revisited movement cluster 2 although the
majority of throws were performed using movement cluster 3. The fluctuations showed a
pattern with three smaller peaks which did not coincide with switching behaviour and only the
third peak occurred in the vicinity of a switch between clusters. Both the transitions (3→2)
and (2→1) were accompanied by low values of mean dissimilarity scores.
2 3 4 5 6 7 8 9 9 8 7 6 5 4 3 2
1
2
3
Distance(m)
Clu
ster
[#]
110
120
130
140
150
160
170
Fluc
tuat
ions
[°]
Figure 10-7: : Distribution of movement clusters (●) against trials grouped by distance in ordering of actual occurrence for participant CAL. Mean dissimilarity scores at each according throwing distance by direction are superimposed (-●-).
In conclusion, for participant CAL a unimodal attractor layout was present and no
indications neither of critical fluctuations nor of hysteresis behaviour were found.
Participant AN
For participant AN the cluster analysis identified four different clusters were cluster 3
and 4 contained only one trial each. The angle-angle plot of the right elbow joint and right
shoulder joint abduction angles showed some differences between the two identified
movement clusters (compare Figure 9-8.a). For movement cluster 2 shoulder joint abduction
angles at the beginning of the movement (top) were somewhat smaller compared to cluster 1

234
(meancluster1 = -65°±7° STD, meancluster2 = -65°±7° STD). A similar trend was visible for the
shoulder joint angle at ball release where mean angles for the movement cluster 1 were -
121°±6° STD and -104°±9° STD for cluster 2. No such differences were found for the right
elbow joint angles. The kinematics of the left shoulder joint and left elbow joint did not show
any strong differences between the two movement clusters and, with the exception of a few
trials, exhibited quite similar behaviour across all trials (see Figure 9-8.b). Movement
kinematics of the left leg showed minimal variation between the movement clusters. The plots
were marked by initial synchronous extension in both joints with the hip joint starting from a
flexed position, which went into a extended position. Subsequently, the knee joint angles
stayed nearly constant at the end and the hip joint flexed back into a neutral position (see
Figure 9-9.c).
-20 0 20 40 60 80
-130
-120
-110
-100
-90
-80
-70
-60
-50
-40
-30
Right elbow flexion angle (°)
Rig
ht s
houl
der a
bduc
tion
angl
e (°
)
20 30 40 50 60 70
30
40
50
60
70
80
Left elbow flexion angle (°)
Left
incl
uded
sho
ulde
r ang
le (°
)
-30 -20 -10 0 10 20-60
-50
-40
-30
-20
-10
Left hip flexion angle (°)
Left
knee
flex
ion
angl
e (°
)
(c)
(a) (b)
Cluster 1Cluster 2Cluster 3Cluster 4
Figure 10-8 : Angle-angle plots for all movement clusters of participant AN. (a) Angle-angle plot of right shoulder joint abduction angles against right elbow joint flexion angles. (b) Angle-angle plot of left included shoulder joint angle against left elbow joint flexion angle. (c) Angle-angle plot of left knee joint flexion angle against left hip join flexion angle.

235
The cluster distribution indicated that the two main clusters were related to throwing
distance with movement cluster 1 being more prominent at the smaller throwing distances and
movement cluster 2 mainly utilized during greater throwing distances (see Figure 9-9). During
the INC condition movement cluster 1 was used from 2m up to 5m with a switch at 6m to
movement cluster 2, which was maintained until 4m DEC where the switch back to
movement cluster 1 occurred. The switches between the different movement clusters followed
in both cases very closely the jumps of the throwing distances, occurring during the first trial
in the subsequent new distance. Since the switch during DEC from movement cluster 2 to 1
occurred at a smaller throwing distance compared to the INC, the plot provided clear
indication for hysteresis behaviour.
The fluctuations scores showed a sudden increase only at 5m (118°→294°) which
preceded the switch to the new cluster but no such rise in the dissimilarity scores was
observed during the DEC condition, where the transition between the two clusters was not
accompanied by a pronounced increase in dissimilarity scores (130°→150°). Rather the
fluctuations were similar in magnitude, potentially indicating that loss of stability used only
for the first transition but not for the second.
2 3 4 5 6 7 8 9 9 8 7 6 5 4 3 2
1
2
3
4
Distance(m)
Clu
ster
[#]
100
150
200
250
300
Fluc
tuat
ions
[°]
Figure 10-9: Distribution of movement clusters (●) against trials grouped by distance in ordering of actual occurrence for participant AN. Mean dissimilarity scores at each according throwing distance by direction are superimposed (-●-).

236
In summary, for participant AN the results indicated a unimodal attractor layout where
a single movement pattern was scaled according to the throwing distance. Distribution of
movement clusters clearly supported hysteresis effects but also critical fluctuations for one
instance of the switches between movement clusters.
Participant MI
For participant MI the greatest number of movement clusters in this chapter were
identified. However, the majority of the trials were contained in clusters 1, 2, and 6. Angle-
angle plots of the right arm did not show any clear differences between the different
movement clusters except for movement cluster 6 which showed the greatest range of motion
in the right shoulder joint (see Figure 9-10). All remaining trials showed similar ranges of
motion with small differences for the starting angles for the right elbow joint. In general the
range of motion of the elbow joint for individual trials was very limited and the motion in the
throwing arm was mainly accomplished by the shoulder joint. Movement cluster 7 showed a
clearly different movement pattern from the remaining trials. For the left arm the outlying
behaviour for cluster 4 and 3 could be confirmed with the distinction between the remaining
trials remaining somewhat elusive (compare Figure 9-10.b). Ranges of motion for both joints
of the left arm were in general quite small (meanleft_elbow= 4°±5° STD, meanleft_shoulder = 3°±5°
STD). For the left leg the plots of the angle-angle kinematics gave no clear indications for
differences between the movement clusters and exhibited considerable overlap (see Figure 9-
10.c). In general, the typical pattern shown by all participants was present. Coordination
between the two segments was kept constant by participant MI only the location of the plots
was somewhat shifted between trials.

237
0 20 40 60 80 100 120 140
-140
-120
-100
-80
-60
-40
-20
Right elbow flexion angle (°)
Rig
ht s
houl
der a
bduc
tion
angl
e (°
)
60 65 70 75 80 85 90 95 10020
25
30
35
40
45
50
55
60
Left elbow flexion angle (°)
Left
incl
uded
sho
ulde
r ang
le (°
)
20 30 40 50 60
-75
-70
-65
-60
-55
-50
-45
-40
-35
-30
-25
Left hip flexion angle (°)
Left
knee
flex
ion
angl
e (°
)
(c)
(a) (b)
Cluster 1Cluster 2Cluster 3Cluster 4Cluster 5Cluster 6Cluster 7
Figure 10-10 : Angle-angle plots for all movement clusters of participant MI. (a) Angle-angle plot of right shoulder joint abduction angles against right elbow joint flexion angles. (b) Angle-angle plot of left included shoulder joint angle against left elbow joint flexion angle. (c) Angle-angle plot of left knee joint flexion angle against left hip join flexion angle.
The distribution of the movement clusters showed some greater variability during the
smaller distances of the INC condition, where a mixture of movement clusters 2, 4, and 6 was
used with movement cluster 2 potentially having the highest stability (see Figure 9-10). This
alternating pattern strategy was maintained until 6m distance where movement cluster 1 was
stabilized. Subsequently this cluster was used until the final distance of 2m during the DEC
condition where again some greater fluctuations were visible and some preference for
movement cluster 2 was indicated. The fluctuations showed a decreasing trend for the INC
conditions from 2m to 9m (182°→97°) with smaller values for the subsequent distances until
5m DEC which accompanied the occurrences of trials using movement cluster 2. At 5m a
sharp rise (94°→200°) occurred which was followed by somewhat higher fluctuations for the
remaining distances. The distribution of movement clusters gave some indication of hysteresis
behaviour where especially movement cluster1 was used much longer during the DEC

238
condition compared to the INC condition. However, participant MI finished the experiment
using similar movement compared to the beginning (cluster 2).
2 3 4 5 6 7 8 9 9 8 7 6 5 4 3 21
2
3
4
5
6
7
Distance(m)
Clu
ster
[#]
80
100
120
140
160
180
200
220
240
Fluc
tuat
ions
[°]
Figure 10-11: Distribution of movement clusters (●) against trials grouped by distance in ordering of actual occurrence for participant MI. Mean dissimilarity scores at each according throwing distance by direction are superimposed (-●-).
In summary, participant MI seemed to use a single movement pattern across all
distances and, in regards to the initial trials, where often movement cluster 6 was used,
potentially some exploratory behaviour was present which lead to learning. This view is also
supported by the observation of decreasing fluctuations scores and the subsequent main usage
of a single movement cluster.

239
11 Appendix B – Matlab code function res = npoints(mat, no, type) % npoints(mat, no, type) % RETURNS A MATRIX WITH no NUMBER OF ROWS WHERE THE COLUMS % CONSIST OF THE INTERPOLATED POINTS OF MAT BASED ON A % TYPE (LINEAR, CUBIC, SPLINE) FIT if nargin==2 type = 'spline'; end [m,n] = size(mat); % DETERMINE SIZE OF MATRIX x = 0:m-1; % ORIGINAL NODES xx = linspace(0,m-1,no); % INTERPOLATED NODES res = zeros(no,n); % RESULT MATRIX for i=1:n res(:,i) = interp1(x,mat(:,i),xx,type)'; end function y = dist_fluct(data_n,index) %dist_fluct(data_n,index) % CALCULATES THE FLUCTUATIONS IN MOVEMENT PATTERNING PER DISTANCE % ON ALL TRIALS WITHIN A DISTANCE-BY-DIRECTION COMBINATION % data_n SHOULD BE A 3D MATRIX WHERE THE FIRST DIMENSION REPRESENTS TRIALS, % THE SECOND DIMENSION REPRESENTS A TIME SERIES, THE THIRD DIMENSION REPRESENT % DIFFERENT JOINT ANGLES. index SHOULD CONSIST OF MATRIX WITH THREE COLUMNS % EQUALLING [DISTANCE, TRIAL, CONDITION] AND ROWS REPRESENT TRIALS [no_trials,no_ts,no_ang] = size(data_n); dmat = squareform(pdist(reshape(data_n,no_trials,no_ts*no_ang),'euclidean')); y = zeros(8,2); for dist = 2:9 for cond = 1:2 i = find(index(:,1)== dist & index(:,3) == cond); smat = dmat(i,i); y(dist-1,cond) = mean(smat(triu(smat)~=0)); end end function tdiff = su_trials(data_n) %SU_TRIAL(NDATA) % CALCULATES THE DIFFERENCES BETWEEN SUCCESSIVE TRIALS % data_n IS A 3D MATRIX WHERE THE FIRST DIMENSION REPRESENTS TRIALS, THE % SECOND DIMENSION REPRESENTS TIME SERIES, THE THIRD DIMENSION REPRESENT % DIFFERENT ANGLES [no_trials,no_ts,no_angles] = size(data_n); tdiff = diag(squareform(... pdist(reshape(data_n,no_trials,no_ts*no_angles),'euclidean')),1);
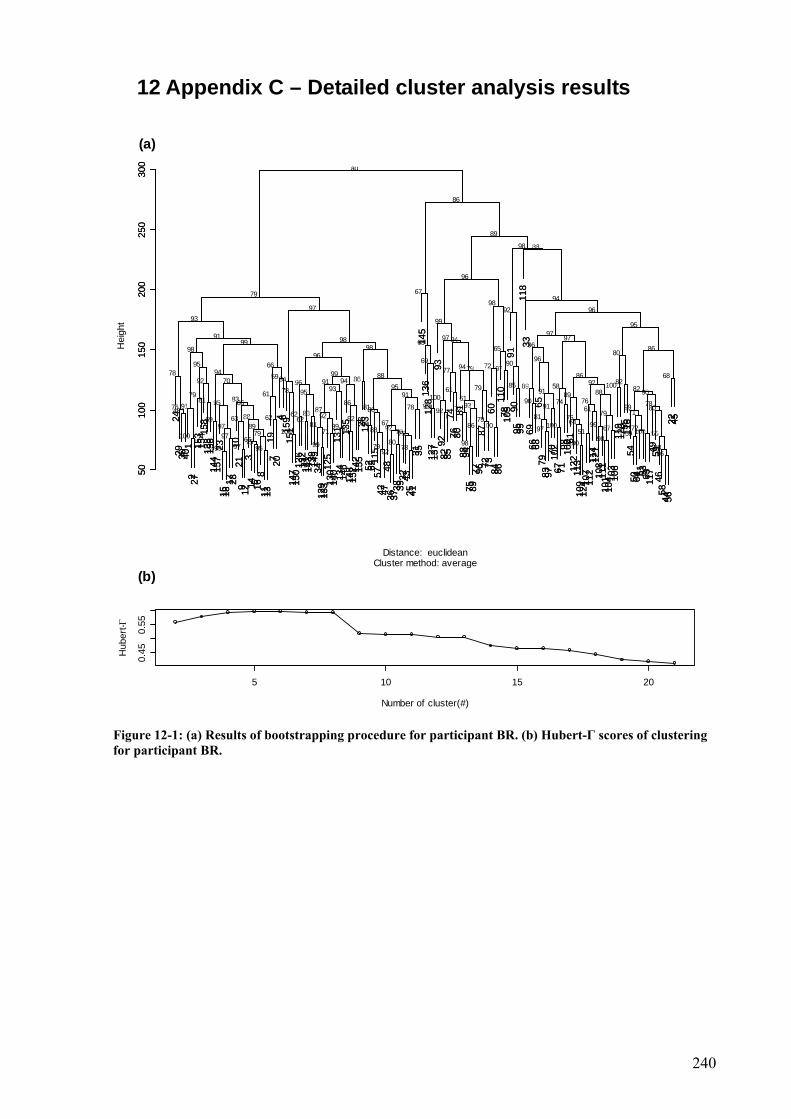
240
12 Appendix C – Detailed cluster analysis results
2429 30 40
12 27
153
154 1
5813
815
614
415
723
15 1817 28
1021
9 123
14 5 168
11 1319
7 204 6
159
151
147
150
126
132
141
143 139
149
3412
913
312
513
014
013
113
414
613
514
815
2 142
155
26 123
52 6211
557
42 4748
36 3738 39
32 4325 41
31 3514
513
612
812
713
793
9282 85
7476 80
8188 94
75 8977 96
8772 73
6084 86
110
78 105
9190
95 9911
833
6966 68
6579
83 9770 102
67 7198 100 61
122
113
109
124 10
711
211
412
110
811
110
110
4 103
106
119
120 55 116
5450 64 5
1 53 63 117
49 5946
5844 56
22 45
5010
015
020
025
030
0
Cluster method: averageDistance: euclidean
Hei
ght
669299 95 78 5897 7999 98 100807565 9897100 5979 5575100 517071 1008891 9792 67 7289 9997 86 100 10081 996793 647969 6263 92 766288 819262 83 79 7148 928687 72 61 80998176 78 919091 93 7886 8695 74 769081 83 6110079 91 8961 95 90889178 6193 827995 89 5885 1009296 91 829492 70 84 8659 6888 869978 94 77 79 9794 726695 9069 9696 8098 65 8698 966399 9498 979791 97959993
96929798 9479 67
96
8898
89
86
au
589598 88 83 6499 6498 99 100653243 9790100 5830 6650100 495468 1005472 9749 51 4259 9683 81 100 10059 976989 378648 4171 70 247361 854535 66 42 4858 901952 59 62 43924479 37 639285 73 4637 4879 78 317933 55 659855 15 1972 6 17316067 4470 245114 86 6776 99126 9 801313 35 45 5146 6325 38246 11 31 33 9660 523910 7455 457 686 40 205 30595 96 10725 119221
86572 1734 55
30
1711
31
28
bp24
29 30 401
2 2715
315
4 158
138
156
144
157
2315 18
17 2810
219 12
314 5 16
811 13
197 20
4 615
915
114
715
012
613
214
114
3 139
149
3412
913
312
513
014
013
113
414
613
514
815
2 142
155
26 123
52 6211
557
42 4748
36 3738 39
32 4325 41
31 3514
513
612
812
713
793
9282 85
7476 80
8188 94
75 8977 96
8772 73
6084 86
110
78 105
9190
95 9911
833
6966 68
6579
83 9770 102
67 7198 100 61
122
113
109
124 10
711
211
412
110
811
110
110
4 103
106
119
120 55 116
5450 64 5
1 53 63 117
49 5946
5844 56
22 45
5010
015
020
025
030
0
5 10 15 20
0.45
0.55
Number of cluster(#)
Hub
ert-Γ
(b)
(a)
Figure 12-1: (a) Results of bootstrapping procedure for participant BR. (b) Hubert-Γ scores of clustering for participant BR.

241
8086 41
114
144 56 60
64 8791
111
101
67 7553 52 66
98 116
59 6584 85
113
68 82 81 8393 97 10
214
3 8879 90 1
4614
512
589 96
112
109
108
69 7011
576 117
78 94 73
95 9971 124
128
129
149
152 13
415
016
0 77
107
120
118
119 12
610
611
0 127
135
137
136
141 1
32 133 7
413
014
749 61 6
310
510
012
3 103
154
6254 51 72
156
153
155
151
157 14
815
915
850 131
55 142
104
48 584 92
139
345 2
7 1 621
37 4412
142 57
122
15 35 26
46 23 453 22 43
3124 36
16 47 98
10 1430
1112 27
3925
2013 17
1832 19 28
138
40 2914
033 38
010
020
030
040
0
Cluster method: averageDistance: euclidean
Hei
ght
10050 10074100 96 9464 94100 888190 91 96 90 100100 64 8986 100100100100 1008398 64 75 71 10093 60 798689 7981 5793 94918699 86 6168785796 74 95938185 6394 73 7377 5568 97 100969795 92 9397 64 9795 93 649896 9787 10076 999098 9910098 7991 9999 4797 8395 999899 879497 10082 88 100 8490 9998 889799 8096 9865969599 99 7910098 798299 98 9898 6486100 68100 98 9999 99 73 7497 9779 63 6151 78 87 5678 93
82
77 7778
88
80
au
10054 10059100 92 9866 96100 747084 84 29 84 100100 44 8868 10010010099 996993 48 78 36 10085 73 142442 7442 5960 40517998 82 5133443361 22 21393439 6314 18 6676 6440 0 100201846 48 3887 30 1780 6 60285 018 10066 99220 991005 2315 991 655 801 201 64893 9961 14 100 2153 992 1610 6397 100211111 98 3403 59751 0 9197 4890 810 84 891 1 40 4090 9119 50 4644 15 20 5336 64
12
37 3635
10
19
bp
8086 41
114
144 56 60
64 8791
111
101
67 7553 52 66
98 116
59 6584 85
113
68 82 81 8393 97 10
214
3 8879 90 1
4614
512
589 96
112
109
108
69 7011
576 117
78 94 73
95 9971 124
128
129
149
152 13
415
016
0 77
107
120
118
119 12
610
611
0 127
135
137
136
141 1
32 133 7
413
014
749 61 6
310
510
012
3 103
154
6254 51 72
156
153
155
151
157 14
815
915
850 131
55 142
104
48 584 92
139
345 2
7 1 621
37 4412
142 57
122
15 35 26
46 23 453 22 43
3124 36
16 47 98
10 1430
1112 27
3925
2013 17
1832 19 28
138
40 2914
033 38
010
020
030
040
0
5 10 15 20
0.50
0.70
Number of cluster(#)
Hub
ert-Γ
(b)
(a)
Figure 12-2: (a) Results of bootstrapping procedure for participant CA. (b) Hubert-Γ scores of clustering for participant CA.

242
10 19
6 75
23 8
1411
12 1378
71 72 6765 75
9774 86 98 10
010
210
795
108
109
110
63 9911
111
6 93
118
105
106
128
140
9492 96
7710
168 103
8980
8783 85
7079
73 7669
66 104
8490 91
5961 62
46 5558 64
8157
82 884 35
2817 27
2319 20
2621
24 2949 54
5260 47 56
42 5345 51
3639 41 48 130
15 30 3816 32
5018 25
3443
4037 44
3122 33
131
156
152
155
158
143
154
159
136
141
151
144
157
150
153 11
211
513
313
714
813
514
513
211
312
911
412
012
211
912
711
712
313
812
412
6 121 142 14
913
414
714
612
513
9
050
100
150
Cluster method: averageDistance: euclidean
Hei
ght
1005698 100 93 100100 97 100100 100 10068 74 67 6199 987094 99 1009699 9595 7472769958 80 100 73675894 8096 77 10098 67 95 8284 8597 68100 93 99 92 9592 97 10072 809992 857798 96959788 99 70 9182 81 73 79100 9187 7083 838895 937472 5672 9676 85 77 9295 8492 96 78 608891 83719467 86828880 508882 97 9194 8980 88 6196 9996 9978 7063 949890 92 99 98 9287 83 7591
86979875 96959998 8694 92
81 95 8779
100 95
95 97
85
au
1005098 100 89 100100 97 100100 100 10068 76 80 4497 986891 98 1009598 9695 6649648764 64 100 68714491 7091 44 10094 48 90 7036 3786 3999 31 96 49 7784 73 10078 758584 307189 88888352 96 30 3765 26 43 43100 4016 5163 283144 375143 3949 6980 67 24 257 4126 64 44 821218 3248638 25392739 661752 52 1912 8928 15 5610 313 438 3838 4262 18 2 4 1131 23 477
235239 3675 74 8
52 13 2471
0 2
4 3
65
bp
10 19
6 75
23 8
1411
12 1378
71 72 6765 75
9774 86 98 10
010
210
795
108
109
110
63 9911
111
6 93
118
105
106
128
140
9492 96
7710
168 103
8980
8783 85
7079
73 7669
66 104
8490 91
5961 62
46 5558 64
8157
82 884 35
2817 27
2319 20
2621
24 2949 54
5260 47 56
42 5345 51
3639 41 48 130
15 30 3816 32
5018 25
3443
4037 44
3122 33
131
156
152
155
158
143
154
159
136
141
151
144
157
150
153 11
211
513
313
714
813
514
513
211
312
911
412
012
211
912
711
712
313
812
412
6 121 142 14
913
414
714
612
513
9
050
100
150
5 10 15 20
0.44
0.50
Number of cluster(#)
Hub
ert-Γ
(b)
(a)
Figure 12-3: (a) Results of bootstrapping procedure for participant DU. (b) Hubert-Γ scores of clustering for participant DU.
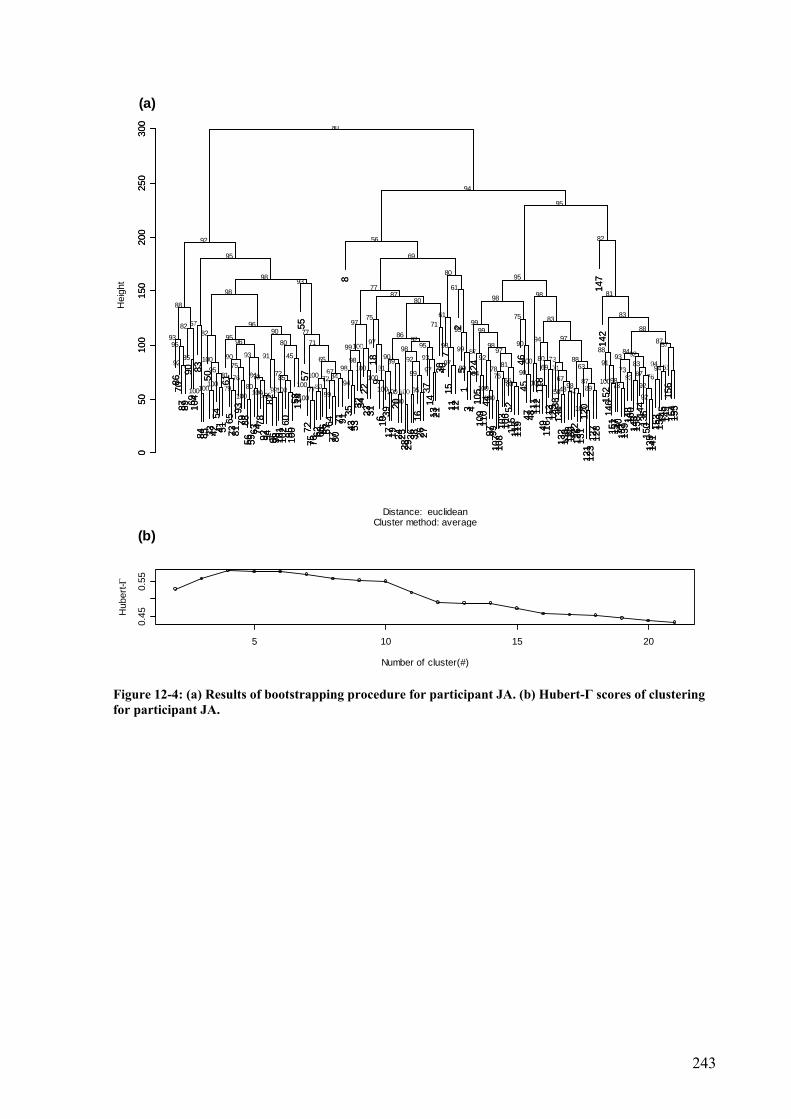
243
8670
87 8990
69 104
8384 85
5033 42
5441 51
6165
73 8193
79 8856 59
63 7478
92 9482
96 98 101
102
6095 100
58 114
5557
7275 76
62 68 66 6764
77 8071 91
835
43 5332 34
2223 31
189
6 1039
17 1920
24 2528 29
36 3816
26 2737
1413 21
30 407
1511 12
25
13 4
124
105
109
110
4497 99
107
108
103
106 5
211
511
711
946
4547 48 1
11 112
118
49 116 1
13 125 13
813
413
213
312
913
012
212
613
112
012
112
312
712
814
714
215
214
615
115
714
013
713
9 148 160
143
158 1
4413
615
013
514
115
315
9 145
149
156
154
155
050
100
150
200
250
300
Cluster method: averageDistance: euclidean
Hei
ght
100100 100100 92100 100 99100 100 100 50100 5299 95100 100 4877100 79 891008080 98 9273100100 80 10094 87 1009866 6772 100 828576 70 76768481 10084 99 84 8772 906795 97 737881 80 947198 100 5169 6375 81 83 9497 9192 89 10098 73100 92 8865 809285 9390 939091 4593 9287 8497 88999899100 9895 98 5795 9080 7196 97 879492 9793 95 8682 7790 9995 8882 719657 97 99 8375 75 8361
88 80 9887 98 8198 77 6193 9598 80
95 69
92 56 82
95
94
au
100100 100100 92100 100 99100 100 100 62100 5299 94100 100 6284100 73 781008373 98 83709999 45 10093 79 1009856 6163 100 698070 52 72676636 9943 98 41 5271 696792 89 256666 78 496196 100 5459 5344 42 43 6594 8061 46 10096 59100 52 3168 414782 5821 64583 5615 1036 1914 77972496 99 9723 9 3632 6927 646 85 201929 1140 13 6076 2716 592 3455 73866 88 8 4058 63 4968
51 35 714 5 456 17 509 186 16
16 48
30 66 44
18
27
bp
8670
87 8990
69 104
8384 85
5033 42
5441 51
6165
73 8193
79 8856 59
63 7478
92 9482
96 98 101
102
6095 100
58 114
5557
7275 76
62 68 66 6764
77 8071 91
835
43 5332 34
2223 31
189
6 1039
17 1920
24 2528 29
36 3816
26 2737
1413 21
30 407
1511 12
25
13 4
124
105
109
110
4497 99
107
108
103
106 5
211
511
711
946
4547 48 1
11 112
118
49 116 1
13 125 13
813
413
213
312
913
012
212
613
112
012
112
312
712
814
714
215
214
615
115
714
013
713
9 148 160
143
158 1
4413
615
013
514
115
315
9 145
149
156
154
155
050
100
150
200
250
300
5 10 15 20
0.45
0.55
Number of cluster(#)
Hub
ert-Γ
(b)
(a)
Figure 12-4: (a) Results of bootstrapping procedure for participant JA. (b) Hubert-Γ scores of clustering for participant JA.
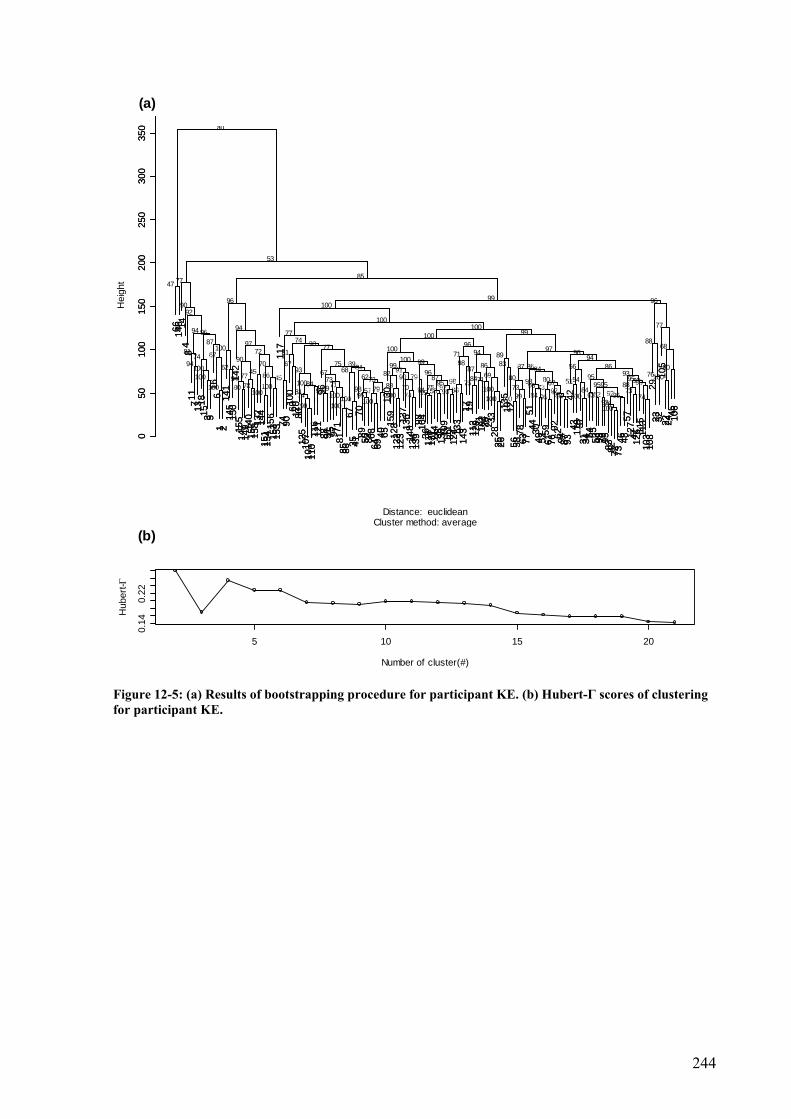
244
66 146 14
48
11 7 13 18
15 3 516
61 2
141
145
150
142
155
147
149 14
015
715
8 132 144
151
154
156
152
153
117
74 9010
060 120
8012
510
710
111
011
612
196
88 91 75 97 71
8185 86
6735 41
7089 50 84 68
64 6940 65
130
159
128
122
123
137
136
148
134
139
98 104
3611
813
1 114
38 138 10
911
139 124 13
39
143
17 1911
212
9 21 102 20 27 33
2825 26
135
10 1256 58
7863 77
5144 30
49 5259
61 7692
62 94 87 9342
43 119 37
31 34 54 55 53 99 79 95
83 82 72 7346 48
5712
747 126 11
511
310
310
829
23 3210
522 24
45 106
050
100
150
200
250
300
350
Cluster method: averageDistance: euclidean
Hei
ght
10099 100 7693100 100 100100 7495 84 1009974 100 7495100 6384 956293 92100 95 9081 7357 975895 8894 8498 79 10069 70100 75 92 737380 100 9678 88 95 8871 9584 75 67100 95 905198 98 9373 80 54717394 958445 8087100 1009062 957977 86 69 769382 966745 93 68 91 87 94100 84 9062 568687 8699 86 838994 67 7570 989990 100 9474 8967 71 9694817281 100 97100 77 6896909787 8874 10077 999694 94 100 77100
9210090 9696 99
47 77 85
53
au
9999 100 6893100 100 100100 7391 65 1009866 100 789199 5884 227381 19100 73 7661 5175 885294 8977 8694 63 10059 62100 45 61 606179 100 8539 51 9 2929 1331 45 44100 51 225598 88 1832 54 47552993 216859 541299 1002534 215739 86 59 631017 43462 95 43 2 16 1298 18 8160 371725 111 8 76661 37 1777 95123 0 362 3145 61 22192434 0 3100 12 2514123 3317 019 024 3 0 160
303 32 0
61 12 6
56
bp
66 146 14
48
11 7 13 18
15 3 516
61 2
141
145
150
142
155
147
149 14
015
715
8 132 144
151
154
156
152
153
117
74 9010
060 120
8012
510
710
111
011
612
196
88 91 75 97 71
8185 86
6735 41
7089 50 84 68
64 6940 65
130
159
128
122
123
137
136
148
134
139
98 104
3611
813
1 114
38 138 10
911
139 124 13
39
143
17 1911
212
9 21 102 20 27 33
2825 26
135
10 1256 58
7863 77
5144 30
49 5259
61 7692
62 94 87 9342
43 119 37
31 34 54 55 53 99 79 95
83 82 72 7346 48
5712
747 126 11
511
310
310
829
23 3210
522 24
45 106
050
100
150
200
250
300
350
5 10 15 20
0.14
0.22
Number of cluster(#)
Hub
ert-Γ
(b)
(a)
Figure 12-5: (a) Results of bootstrapping procedure for participant KE. (b) Hubert-Γ scores of clustering for participant KE.

245
64 9363
84 8790
72 7582 88 8
6 83 9537
43 5652
4636 42
73 65 9271
74 76 7767
62 6658 80
5955 120
111
114
117
113
104
110
79 9649 91
101
6910
510
810
910
710
010
694 103
112
124
155
134
153
156
159
118
119
131
6012
713
312
812
950
85 98 70
97 102
7881
9961 89
154
6 148
47 9 2
411 12
517 18
681
102 3
3015
19 2040 41 34
26 2821
32 3313
22 25 27 2931 35
38 3912
544
48 5451
53 5745 47
138
152 11
513
613
916
148
2315
815
116
0 137
145
142
132
140
122
123
149
135
146 15
714
114
314
412
112
6 116 130 1
47 15050
100
150
200
Cluster method: averageDistance: euclidean
Hei
ght
586410071 91 80100 8399
63 5897 99 100100100 8196 9975 92 8210072 76 100100 100 99100 69941008096 91 9481 57787966 679895 9196 90 7588 10087 8985 100969267 8784 7879 86 84 659891 76 97100 6787 8489 9670 97 97 918882 91 7694 9673 8894 9196 9872 93 92 889396 949799 87 659385 7796 996574 9396 9695 8387 97 9499 94 9292 769387 93 7599 819699 92 68 949990100 9798 98100 98100 8381 100
100100 10096 100
98 1009999
98
9698
99au
646010073 83 81100 4399
63 6395 97 10010099 4587 9972 28 6810059 50 10097 100 98100 48681005995 71 8585 75645564 481364 6079 64 4456 9973 8941 100208741 7585 7272 32 52 494726 54 9199 3928 4254 7670 32 16 215940 52 2583 5478 8937 8018 651 65 84 202148 9965 41 463354 3597 105535 3245 626 2014 5 53 11 1544 70921 12 501 2633 8 78 142440 27 30 60 5220 0
00 07 0
5 121
2
43
1bp
64 9363
84 8790
72 7582 88 8
6 83 9537
43 5652
4636 42
73 65 9271
74 76 7767
62 6658 80
5955 120
111
114
117
113
104
110
79 9649 91
101
6910
510
810
910
710
010
694 103
112
124
155
134
153
156
159
118
119
131
6012
713
312
812
950
85 98 70
97 102
7881
9961 89
154
6 148
47 9 2
411 12
517 18
681
102 3
3015
19 2040 41 34
26 2821
32 3313
22 25 27 2931 35
38 3912
544
48 5451
53 5745 47
138
152 11
513
613
916
148
2315
815
116
0 137
145
142
132
140
122
123
149
135
146 15
714
114
314
412
112
6 116 130 1
47 15050
100
150
200
5 10 15 20
0.40
0.50
Number of cluster(#)
Hub
ert-Γ
(b)
(a)
Figure 12-6: (a) Results of bootstrapping procedure for participant NI. (b) Hubert-Γ scores of clustering for participant NI.

246
152
143
151
154
6615
711
768 99
5461 62 50 53 73
63 7074
8280 81
55 7267
42 28 44 111
4111
645 113
7769 71
9288 90 97
8449
46 59 57 64 52 85 86 93 87
100 10
347 114
120
110
119
101
106
104
109 94 95 108 96
123
4310
211
8 107
9183 89
75 5665 51
76 7810
512
679 98 3
1 33 32 128
139
150 1
029 127 48 130
158
159
160 1
614
615
3 147
156
140
155 145
148
11 13 21
12 30 115 121
34 6036
37 39 35
112 3 6 9
4 57
8 17 15 14 19 18 20
3858
24 251 2 2214
214
413
713
8 132
135
149
122
129 23
131
141 13
613
412
512
413
327 26 40
020
040
060
080
0
Cluster method: averageDistance: euclidean
Hei
ght
100 100 84 6898100 100100100 10053 701007798100 85100100 10099 48100 71 5992100 947792 83 86 1009567 90879984 9891 7487848895 8862 9699 75 6467 79 958887 8797 928686 90 6094 988686 71 7394 84 937896 81 9797 7885 999146 94929796 959282 8195718498 7393 9398 8496 7498 9392 9598 78 999398 68 887198 97 6395 9590 809696 969899998490 10093 98 9186 99988799 9796 10099 98 97 10010094 95 999852 9796100 97
83
81100
au
100 100 83 6795100 100100100 10056 731006796100 5610099 10098 64100 65 568199 954764 71 78 977754 78548885 9893 6370223592 8656 8198 30 4074 54 743368 7852 443284 17 4313 868264 41 4591 91 434637 53 7877 4335 956356 3344318 351110 346577444 3823 32 243 3729 6257 73 54 1582 69 33736 31 3237 143 26595 61135852 063 2 3421 23258 114 118 2 4 0017 3 1954 120100 17
58
65100
bp
152
143
151
154
6615
711
768 99
5461 62 50 53 73
63 7074
8280 81
55 7267
42 28 44 111
4111
645 113
7769 71
9288 90 97
8449
46 59 57 64 52 85 86 93 87
100 10
347 114
120
110
119
101
106
104
109 94 95 108 96
123
4310
211
8 107
9183 89
75 5665 51
76 7810
512
679 98 3
1 33 32 128
139
150 1
029 127 48 130
158
159
160 1
614
615
3 147
156
140
155 145
148
11 13 21
12 30 115 121
34 6036
37 39 35
112 3 6 9
4 57
8 17 15 14 19 18 20
3858
24 251 2 2214
214
413
713
8 132
135
149
122
129 23
131
141 13
613
412
512
413
327 26 40
020
040
060
080
0
5 10 15 20
0.3
0.6
Number of cluster(#)
Hub
ert-Γ
(b)
(a)
Figure 12-7: (a) Results of bootstrapping procedure for participant RY. (b) Hubert-Γ scores of clustering for participant RY.

247
139
141
138
135
136
140
137
133
134
152
151
158 1
4414
915
0 142 145 15
915
716
014
714
614
814
315
615
515
315
41
53 6468
62 6510
086 72
89 9488 90
84 9910
161
5654 55
59 57 6310
292 110 7
996 97
7510
393 95
67 7776 74 87
8369 70
91 9873
60 6671 85
3926
30 3110
712
112
2 114
127
130
10 2833
34 42 51
50 4143 52 3
735 36
48 4546 47
4929
32 4417 2 4
5 6 20 24 40
14 21 22
23 2718 25 1
3 1512
16 198 7 93 11
120
7858
82 80 8110
510
410
910
811
911
311
811
111
511
6 112
106
117
3812
612
512
912
812
312
4 131
132
010
020
030
040
0
Cluster method: averageDistance: euclidean
Hei
ght
100 100 65100 10069100100 78100 100 81100 8399 8979 9894 59 80100100 56 9983 7610093 100 87100 10095 84 98 9184 8156 55 9997 9091 100 92100 97 99100 8871 8699100 7196 7384 71 10060 9086 8662100 94 7284 73 7762100 65 8996 88 928481 72 918195 93 72100100 87 63 9562 9563 9173 909651 699398 9673 8391 9579 9195100 78 100 91100 87 97 5892 93 9498 98 9096 977191100 95 9467 79 9654 10099 8594 9786 8742
61100 6961 7142
8269 91
71 72100
100
au
100 100 78100 10051100100 32100 100 89100 8899 8676 9694 51 80100100 46 9979 3910093 99 78100 10090 68 95 9090 6251 55 9299 5373 100 9210094 99 99 6973 5897100 5957 6984 59 10047 5448 7855100 85 2476 42 5441100 54 5496 32 178236 25 50625 81 29100100 73 46 6657 4261 1746 753372 461190 3544 7179 930 163100 76 100 10100 88 9 4012 82 6397 3 86 302513100 20 3932 35 356 10098 395 1412 3271
45100 4062 3870
8443 88
41 40100
100
bp
139
141
138
135
136
140
137
133
134
152
151
158 1
4414
915
0 142 145 15
915
716
014
714
614
814
315
615
515
315
41
53 6468
62 6510
086 72
89 9488 90
84 9910
161
5654 55
59 57 6310
292 110 7
996 97
7510
393 95
67 7776 74 87
8369 70
91 9873
60 6671 85
3926
30 3110
712
112
2 114
127
130
10 2833
34 42 51
50 4143 52 3
735 36
48 4546 47
4929
32 4417 2 4
5 6 20 24 40
14 21 22
23 2718 25 1
3 1512
16 198 7 93 11
120
7858
82 80 8110
510
410
910
811
911
311
811
111
511
6 112
106
117
3812
612
512
912
812
312
4 131
132
010
020
030
040
0
5 10 15 20
0.5
0.7
Number of cluster(#)
Hub
ert-Γ
(b)
(a)
Figure 12-8: (a) Results of bootstrapping procedure for participant SH. (b) Hubert-Γ scores of clustering for participant SH.

248
3492
7 8 946 152
143
32 135 1
22 158
10 134
17 151 35 144 13
914
2 157
131
130
141 23 11 38 33
36 24 3121
136
145 12 2 3 13 28 2914 5
4 2520
26 30 19
18 16 27 15
147 14
815
315
414
015
0 155
615
6 149
137
146
78 8854 79 97 11
512
675 82
6884 99 8
3 94 44 59 85 87 57 77 58 7095 96 81 98 10
4 67
90 91 63 7662 89 71 103 5
169 72 60 64 61 80 66 73 65 74 86
100
122
39 124
109
107
108
105
117 114
123
128
4512
010
211
011
1 56
101
113 12
712
913
2 47 4111
637 48 1
19 138 55
133
106
125 4
950 42 4312
193 52 40 5311
211
8020
040
060
080
010
00
Cluster method: averageDistance: euclidean
Hei
ght
99 10010089 667081 9899 100100100 87 997974 796910068 9463 73 6486 62 89 69 997591 98817556 7278 958776 7777 74100 7687 8895 7688 90 81 9196 71 8882 100 8790 93 755188 8083 81959383 70 649566 969894 88 96 909293 8096 9585 84 99 94 8591 100 96 9293 9496 72 9794 9188 100 7895 895984 9891 98 9599 1009786 8799 86 10097 10097 96 1001009693 9493100 100100 100 998585 1009597 10087 10083 100 1009196 9995 9787 9490
71100
au
99 10010087 643785 9298 1009910082 998385 856310080 5366 65 4663 67 80 43 924771 96515955 6048 834038 1845 51100 5939 3152 6826 89 35 2999 44 949 100 3219 20 457640 3272 34138950 29 411054 268612 35 3 441316 3693 1327 69 3 4 1717 1 5 5818 116 80 229 2729 1 1293 203726 213 3 73 1528 463 19 03 06 8 00205 18160 01 0 1298 064 018 072 0 0413 115 427 1216
29100
bp
3492
7 8 946 152
143
32 135 1
22 158
10 134
17 151 35 144 13
914
2 157
131
130
141 23 11 38 33
36 24 3121
136
145 12 2 3 13 28 2914 5
4 2520
26 30 19
18 16 27 15
147 14
815
315
414
015
0 155
615
6 149
137
146
78 8854 79 97 11
512
675 82
6884 99 8
3 94 44 59 85 87 57 77 58 7095 96 81 98 10
4 67
90 91 63 7662 89 71 103 5
169 72 60 64 61 80 66 73 65 74 86
100
122
39 124
109
107
108
105
117 114
123
128
4512
010
211
011
1 56
101
113 12
712
913
2 47 4111
637 48 1
19 138 55
133
106
125 4
950 42 4312
193 52 40 5311
211
8020
040
060
080
010
00
5 10 15 20
0.3
0.6
Number of cluster(#)
Hub
ert-Γ
(b)
(a)
Figure 12-9: (a) Results of bootstrapping procedure for participant AN. (b) Hubert-Γ scores of clustering for participant AN.

249
154
160
152
156 15
315
7 148
149
114
114
415
013
914
514
214
3 146
151
155 15
815
922
19 2314
014
720 26 8 9
1536
14 1725
2928 30
1016 21
56 7
56 58 79
54 7013
067 103
124
133
136
114
118
418
24 2733 49
109
5012
637 40
116
115
110
121
123
120
122
111
128
134
9796 85 86
8188 100 8
9 9284
82 992 3
3235
39 31 3811
244
45 4610
510
810
648 55
113
127 13
213
113
5 117
119
125
138
129
137
8369
87 9052
3443 47
42 5177
53 101
64 9394
74 9810
410
266 68
6061
7362
7110
772 78
63 6575 76 5
759 91
8041 95
1112 13
050
100
150
200
Cluster method: averageDistance: euclidean
Hei
ght
100
100100 100100 89 9192 8698 9310085100 71 918893 92100 99 9599 52 7995 9996 77 7261 60 8276 62 949188 100 9789 81 7478100 9799 75 100 899879 946770 909693 95 7874 8875 90 6684 8810095 10076799366 6769 9698 8266 5798 747872100 8461 9898 1006390 88 937292 9697 9988 848387 8773 73 83 979981 50 93100 979083 6073 979565 92 98 100 76 9897887995 66 98 100 87 9576 9583
9875 100 9983 9410097 98
99 84998974
99
99 9998
99
au
100
100100 99100 79 7290 7696 7310068100 58 887891 8099 99 6699 53 7094 9995 48 5772 71 2459 58 578364 100 5454 66 706999 7095 60 100 408660 888466 208486 76 6155 4545 61 3631 179988 10059867268 7347 8665 2158 4897 38527799 2459 552 1003869 56 125073 595 387 265549 3542 46 22 859856 61 420 52382 5430 53279 20 4 0 46 35153594 49 6 0 77 3374 1676
446 0 280 1302 3
2 6301640
1
0 22
2
bp
154
160
152
156 15
315
7 148
149
114
114
415
013
914
514
214
3 146
151
155 15
815
922
19 2314
014
720 26 8 9
1536
14 1725
2928 30
1016 21
56 7
56 58 79
54 7013
067 103
124
133
136
114
118
418
24 2733 49
109
5012
637 40
116
115
110
121
123
120
122
111
128
134
9796 85 86
8188 100 8
9 9284
82 992 3
3235
39 31 3811
244
45 4610
510
810
648 55
113
127 13
213
113
5 117
119
125
138
129
137
8369
87 9052
3443 47
42 5177
53 101
64 9394
74 9810
410
266 68
6061
7362
7110
772 78
63 6575 76 5
759 91
8041 95
1112 13
050
100
150
200
5 10 15 20
0.40
0.50
Number of cluster(#)
Hub
ert-Γ
(b)
(a)
Figure 12-10: (a) Results of bootstrapping procedure for participant CAL. (b) Hubert-Γ scores of clustering for participant CAL.

250
712
24 2621
22 3233
31 4148 49
46 5354
4735 36
4534 42
38 407 17
2750
25 3728 39 1
6 1823 29
18 19
64 15 13
10 115 9
314
2012 30
5264 72
8394
95 119 77 80 73
67 8563 81
129
136
112
137
127
138
117
121
125
116
98 118
58 5910
211
310
011
010
810
912
010
111
1 115
122
123
106
105
104
107
86 9387
89 9099 74
69 9291
7975 76
55 65 6682 88
6896 97
43 44 62
6056 78
51 5784
61 7015
813
116
012
410
311
412
812
615
014
313
013
514
814
914
714
414
515
914
013
313
214
214
615
315
7 156
141
151
155
152
154
134
139
050
100
150
200
Cluster method: averageDistance: euclidean
Hei
ght
10010010010098 10092100 98100 70 91100 951009998 95 5398 7172 73 6783 100 64746893 945982 918799 708492 5253 9977 7290 78 9079 6994 7057 799810093 88 92 74 8558 94 707994 9387 93 6894 90849972 99628297 51 97 959468 88 839967 85 9073 98 6868 9679 97 86 9492 82 7375 93 60 8977 95964784 81 69100 969175 7049 8996 9379 8387 8689 97 929655 97 6691100 97 9796 81909690
99100 9893 859986
868286
7889
74 649491
90
au
10010010010098 10094100 98100 73 92100 961009898 93 4896 5229 82 6974 100 69813476 956191 689099 493794 4955 9758 2790 55 8860 5781 6853 229510094 27 93 83 6048 63 323979 8435 89 7839 67219154 92417896 51 45 418557 88 129767 27 4966 31 2847 8827 57 9 3776 78 6652 4 47 2825 31137881 49 42100 30431 3677 7712 1724 3829 6877 52 10278 11 43499 2 454 444270
0100 181 2605
162142
2326
15 3155
6
bp
712
24 2621
22 3233
31 4148 49
46 5354
4735 36
4534 42
38 407 17
2750
25 3728 39 1
6 1823 29
18 19
64 15 13
10 115 9
314
2012 30
5264 72
8394
95 119 77 80 73
67 8563 81
129
136
112
137
127
138
117
121
125
116
98 118
58 5910
211
310
011
010
810
912
010
111
1 115
122
123
106
105
104
107
86 9387
89 9099 74
69 9291
7975 76
55 65 6682 88
6896 97
43 44 62
6056 78
51 5784
61 7015
813
116
012
410
311
412
812
615
014
313
013
514
814
914
714
414
515
914
013
313
214
214
615
315
7 156
141
151
155
152
154
134
139
050
100
150
200
5 10 15 20
0.50
0.60
Number of cluster(#)
Hub
ert-Γ
(b)
(a)
Figure 12-11: (a) Results of bootstrapping procedure for participant CR. (b) Hubert-Γ scores of clustering for participant CR.

251
120
51
144 16
2413
313
4 5045 59 6
8 99 55 64 137
146 123
143
139
126
130
129
131 1
25 128 14
914
814
515
212
713
613
514
113
214
4 60 81 83 84
96 102 10
310
911
088 119 1
11 116 82
74 94 80 85
8710
061 91
113
115
117
118 12
410
410
8 93 9592
105
106 9
711
4 107
86 101 89 98
70 7977 75 76
7858 67
42 47 66
9069 71
5444 57
5114
046 27 38
48 4915
015
315
4 142 147 12
1713 15
20 28 2534 39 3
3 359
8 1910 11
2218 23 1
21 155
156
5265 112
122
56 627
63 73 53 72 29 30
138
151
157
158 40 31 32
6 2143
2 337 41
26 36
010
020
030
040
0
Cluster method: averageDistance: euclidean
Hei
ght
566695 787681 869194 9910097100 100 9577 9499 95 10050 93 100100 100 6575 9396 92100 97 10088 7685 9892 9193 6777 76 5851100 93 697780 6892 97 94945687 76996963100 847664 998571100 98 9678 90 6779 6388 81 87 62 9162 76878254 10071 925999 648155 94 98 598684 637289 99 99 745766 8673 65 709982 77 8882 99 8491 8697 649998 99 84 77 7872 9291 99 80 8791 9099 81100 89 9098 85939895 79 979489
9782
89 86
87
94
au
567196 826477 866793 991009799 100 9680 6599 94 10055 85 100100 100 6853 6394 8599 44 10043 5648 7288 4994 3777 68 6050100 15 696453 7117 68 7674589 19114834100 929442 966570100 6 544 42 7154 7217 29 52 45 8665 80892169 145 37832 491637 11 9 662210 493986 2 7 535440 8243 78 5716 33 7716 2 224 836 4913 1 80 47 5731 263 2 34 5287 160 430 23 300 331119 30 68221
820
86 17
78
94
bp
120
51
144 16
2413
313
4 5045 59 6
8 99 55 64 137
146 123
143
139
126
130
129
131 1
25 128 14
914
814
515
212
713
613
514
113
214
4 60 81 83 84
96 102 10
310
911
088 119 1
11 116 82
74 94 80 85
8710
061 91
113
115
117
118 12
410
410
8 93 9592
105
106 9
711
4 107
86 101 89 98
70 7977 75 76
7858 67
42 47 66
9069 71
5444 57
5114
046 27 38
48 4915
015
315
4 142 147 12
1713 15
20 28 2534 39 3
3 359
8 1910 11
2218 23 1
21 155
156
5265 112
122
56 627
63 73 53 72 29 30
138
151
157
158 40 31 32
6 2143
2 337 41
26 36
010
020
030
040
0
5 10 15 20
0.40
0.55
Number of cluster(#)
Hub
ert-Γ
(b)
(a)
Figure 12-12: (a) Results of bootstrapping procedure for participant MI. (b) Hubert-Γ scores of clustering for participant MI.